Save 23% ($351) & Get a Free 1-1 Call with our Team ⏰ : 0d 2h 59m 44s

Disclaimer: Not financial nor investment advice. You are responsible for any capital-related decisions you make, and only you are accountable for the results.
Macro:
As more victims of the FTX saga look as if they may be coming to light (Greyscale and Genesis), the Crypto market continues to be littered with fear. This has caused both BTC and ETH to sell off slightly whilst many Alts have been drained.
TLDR
- The DXY might experience a short-term rise, potentially impacting the crypto market.
- Multiple assets have formed even lower lows.
- SNX & SRM have printed bullish candles last week.
- MINA has registered an all-time low. The asset is at risk.
- SOL's trajectory changes, as its last line of defense, is lost. The level of $5 is now on the cards.
- Investors have turned to self-custody rather than opting to leave their coins on Exchanges.
- Bitcoin and Ether are showing different pictures with regard to the accumulation of coins amongst wallet cohorts. Small BTC wallets have been aggressive yet the larger ones are not so much, whereas the ETH wallet cohorts have shown the opposite.
- The Net Realised Profit/Loss showed the largest USD loss on-chain in Bitcoin’s existence.
DXY (U.S. Dollar Index)
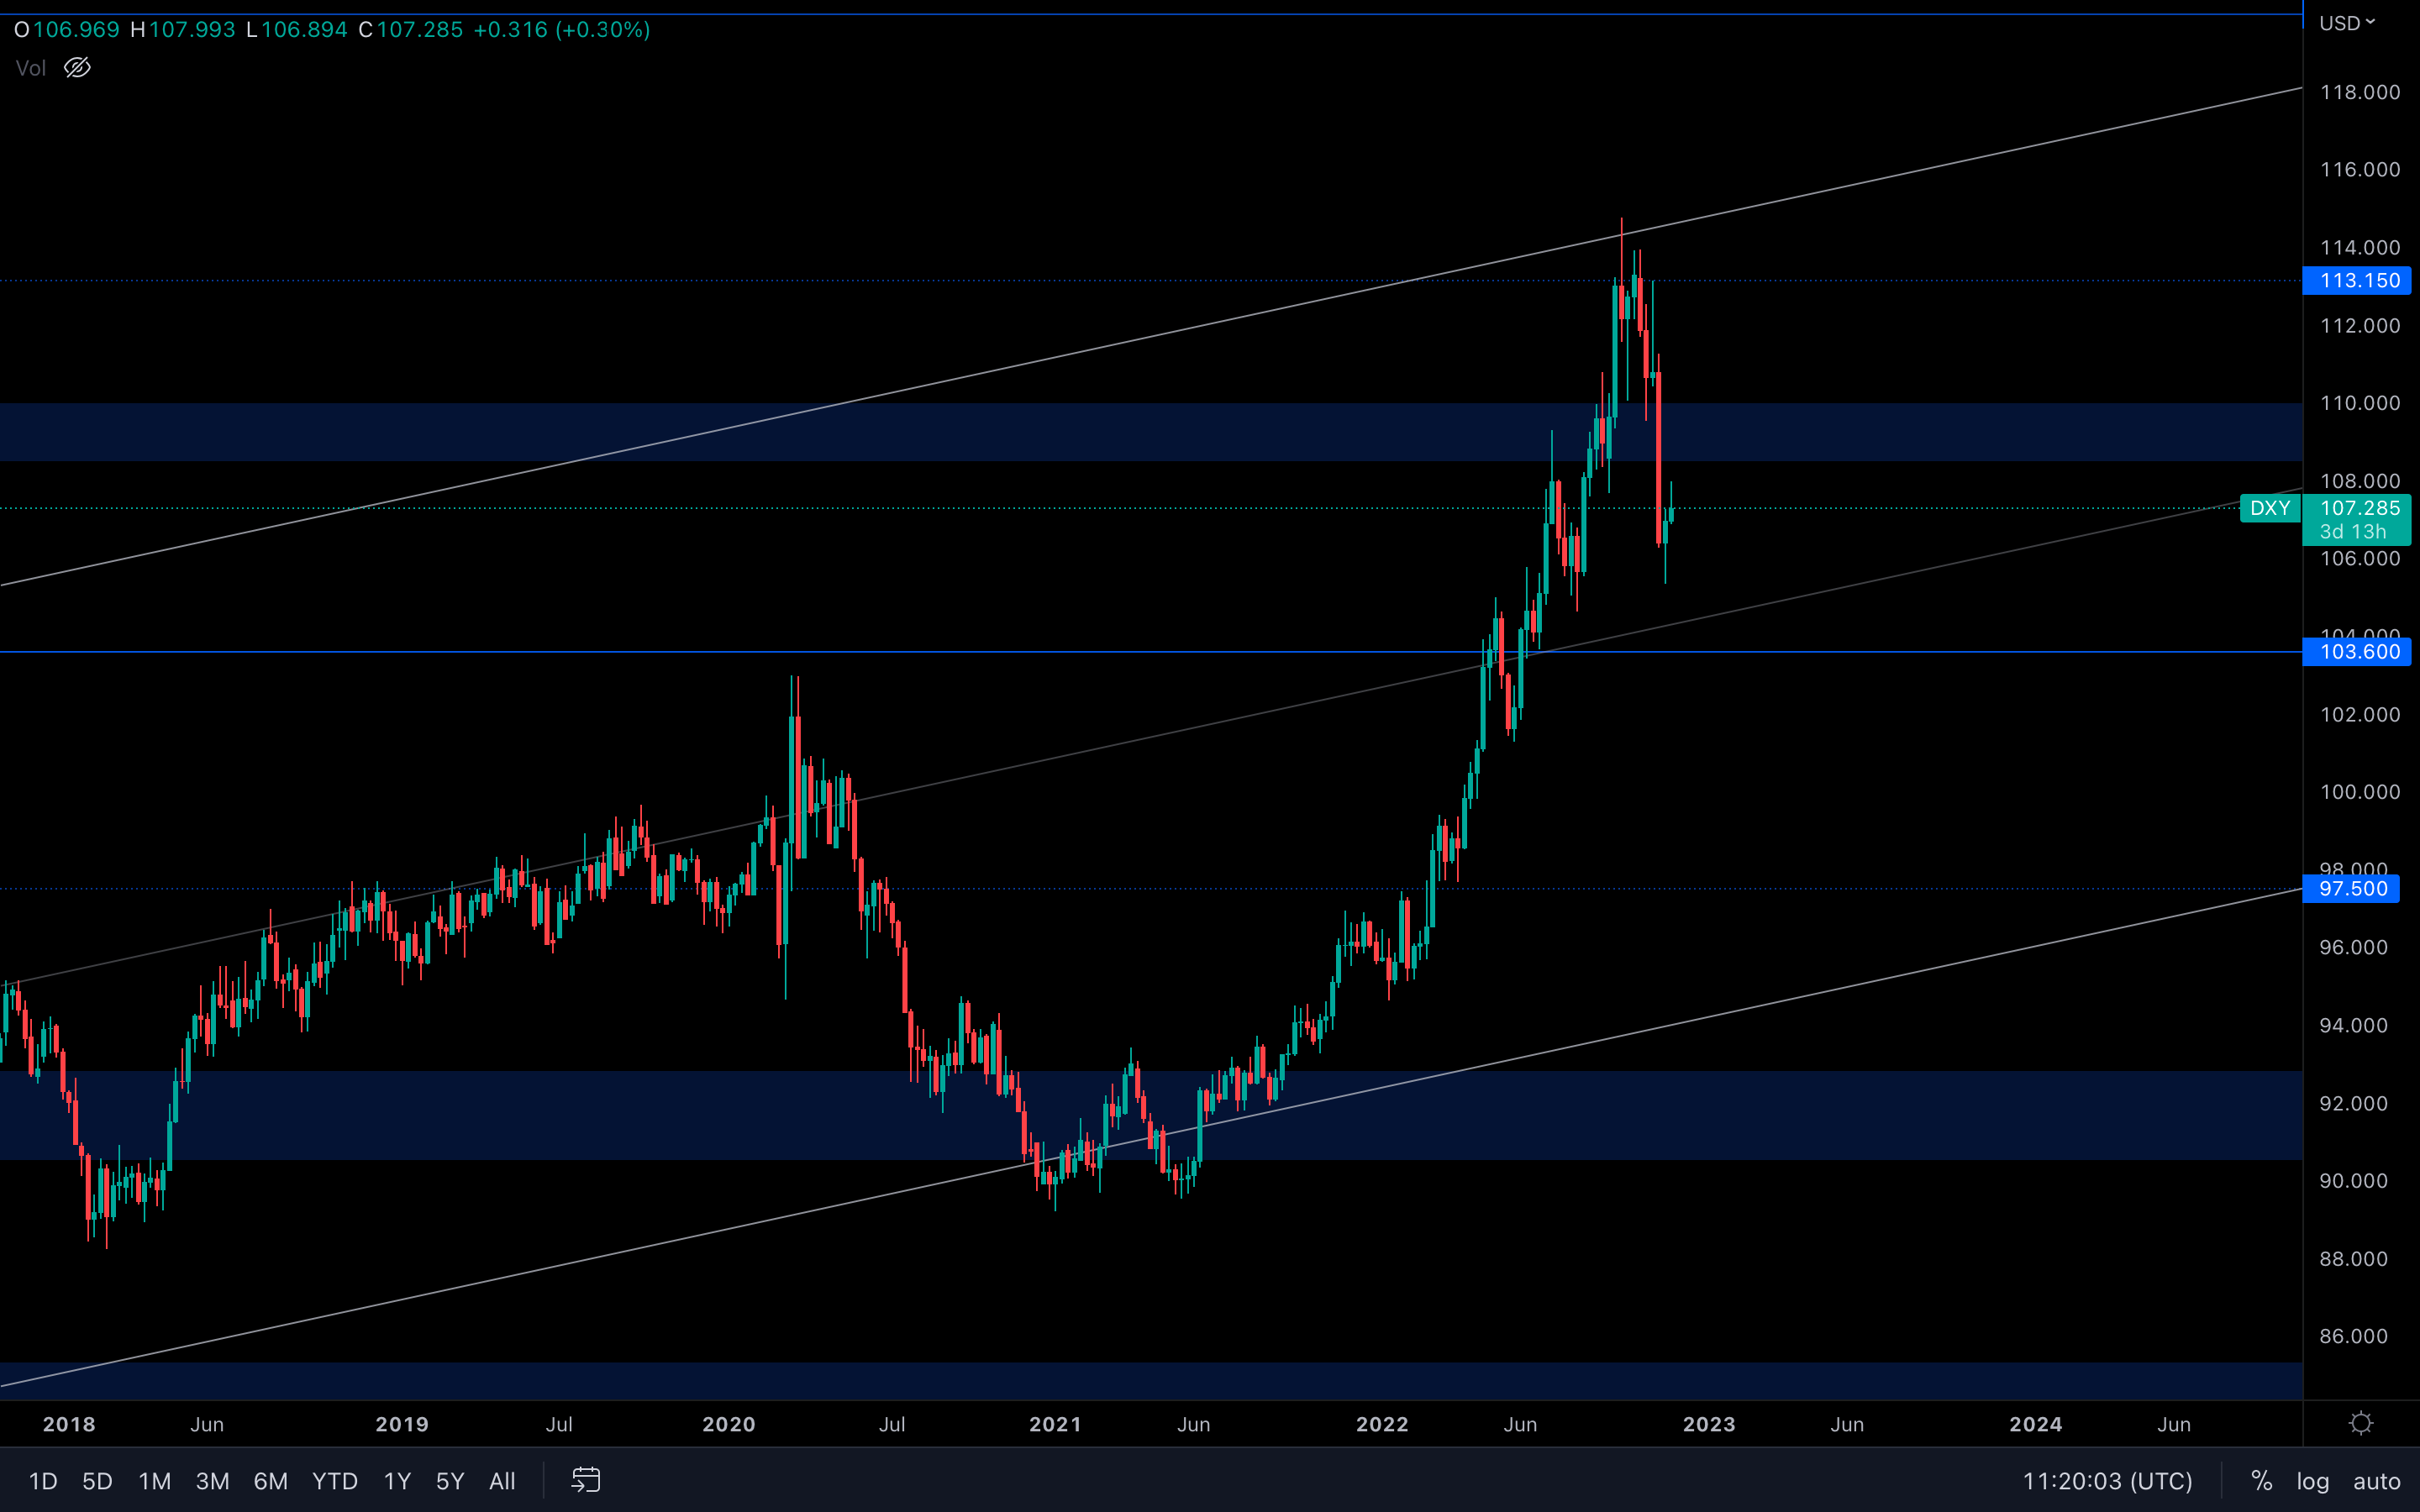 It seems the DXY has slowed down its selling pressure, closing a bullish candle last week. Because of that, it's safe to assume that we are going to see a $109 - $110 retest soon.
Not something we'd like to see though, because a rising DXY usually comes with a descending crypto market. It's not a universal rule, but it's common behaviour. For that reason, we could see volatility in the crypto market.
S&P 500 Index
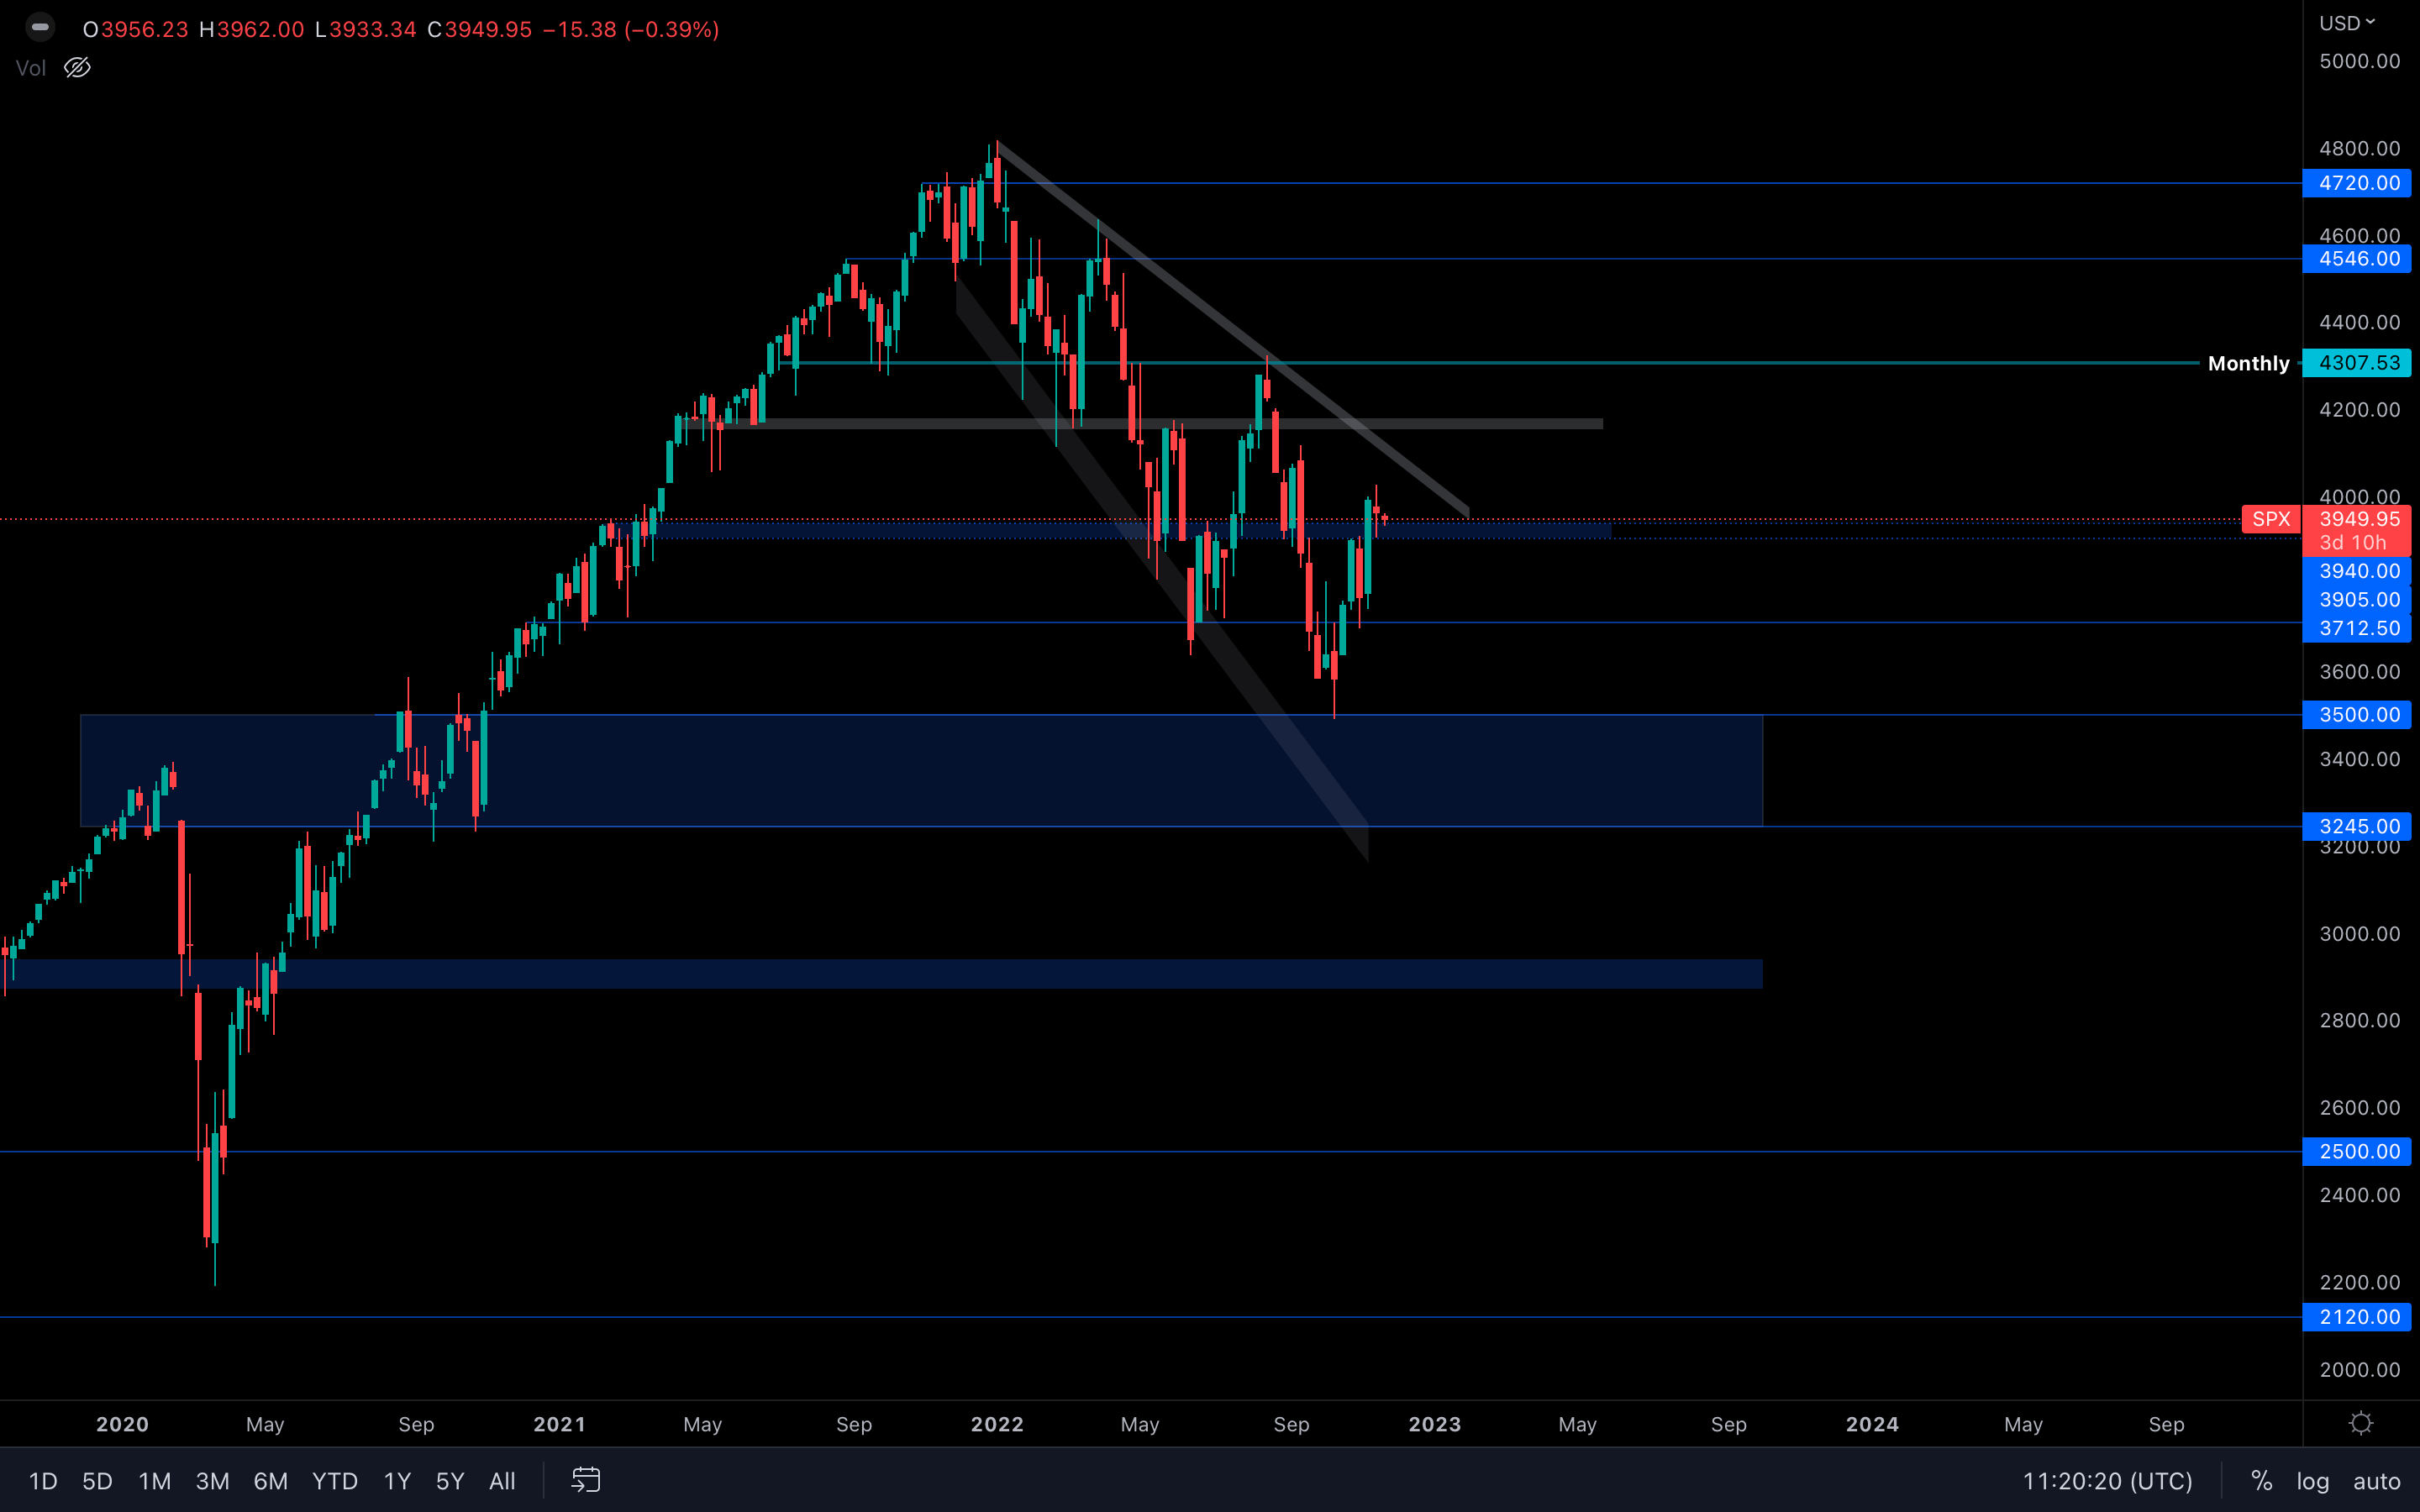 The S&P 500 Index has retested $3900 and then closed above it, which suggests a test of the top trend line is on the cards here. However, we should always be prepared for both scenarios:
If the $3900 level is lost, then a test of $3700 will follow shortly.
Total Market Cap
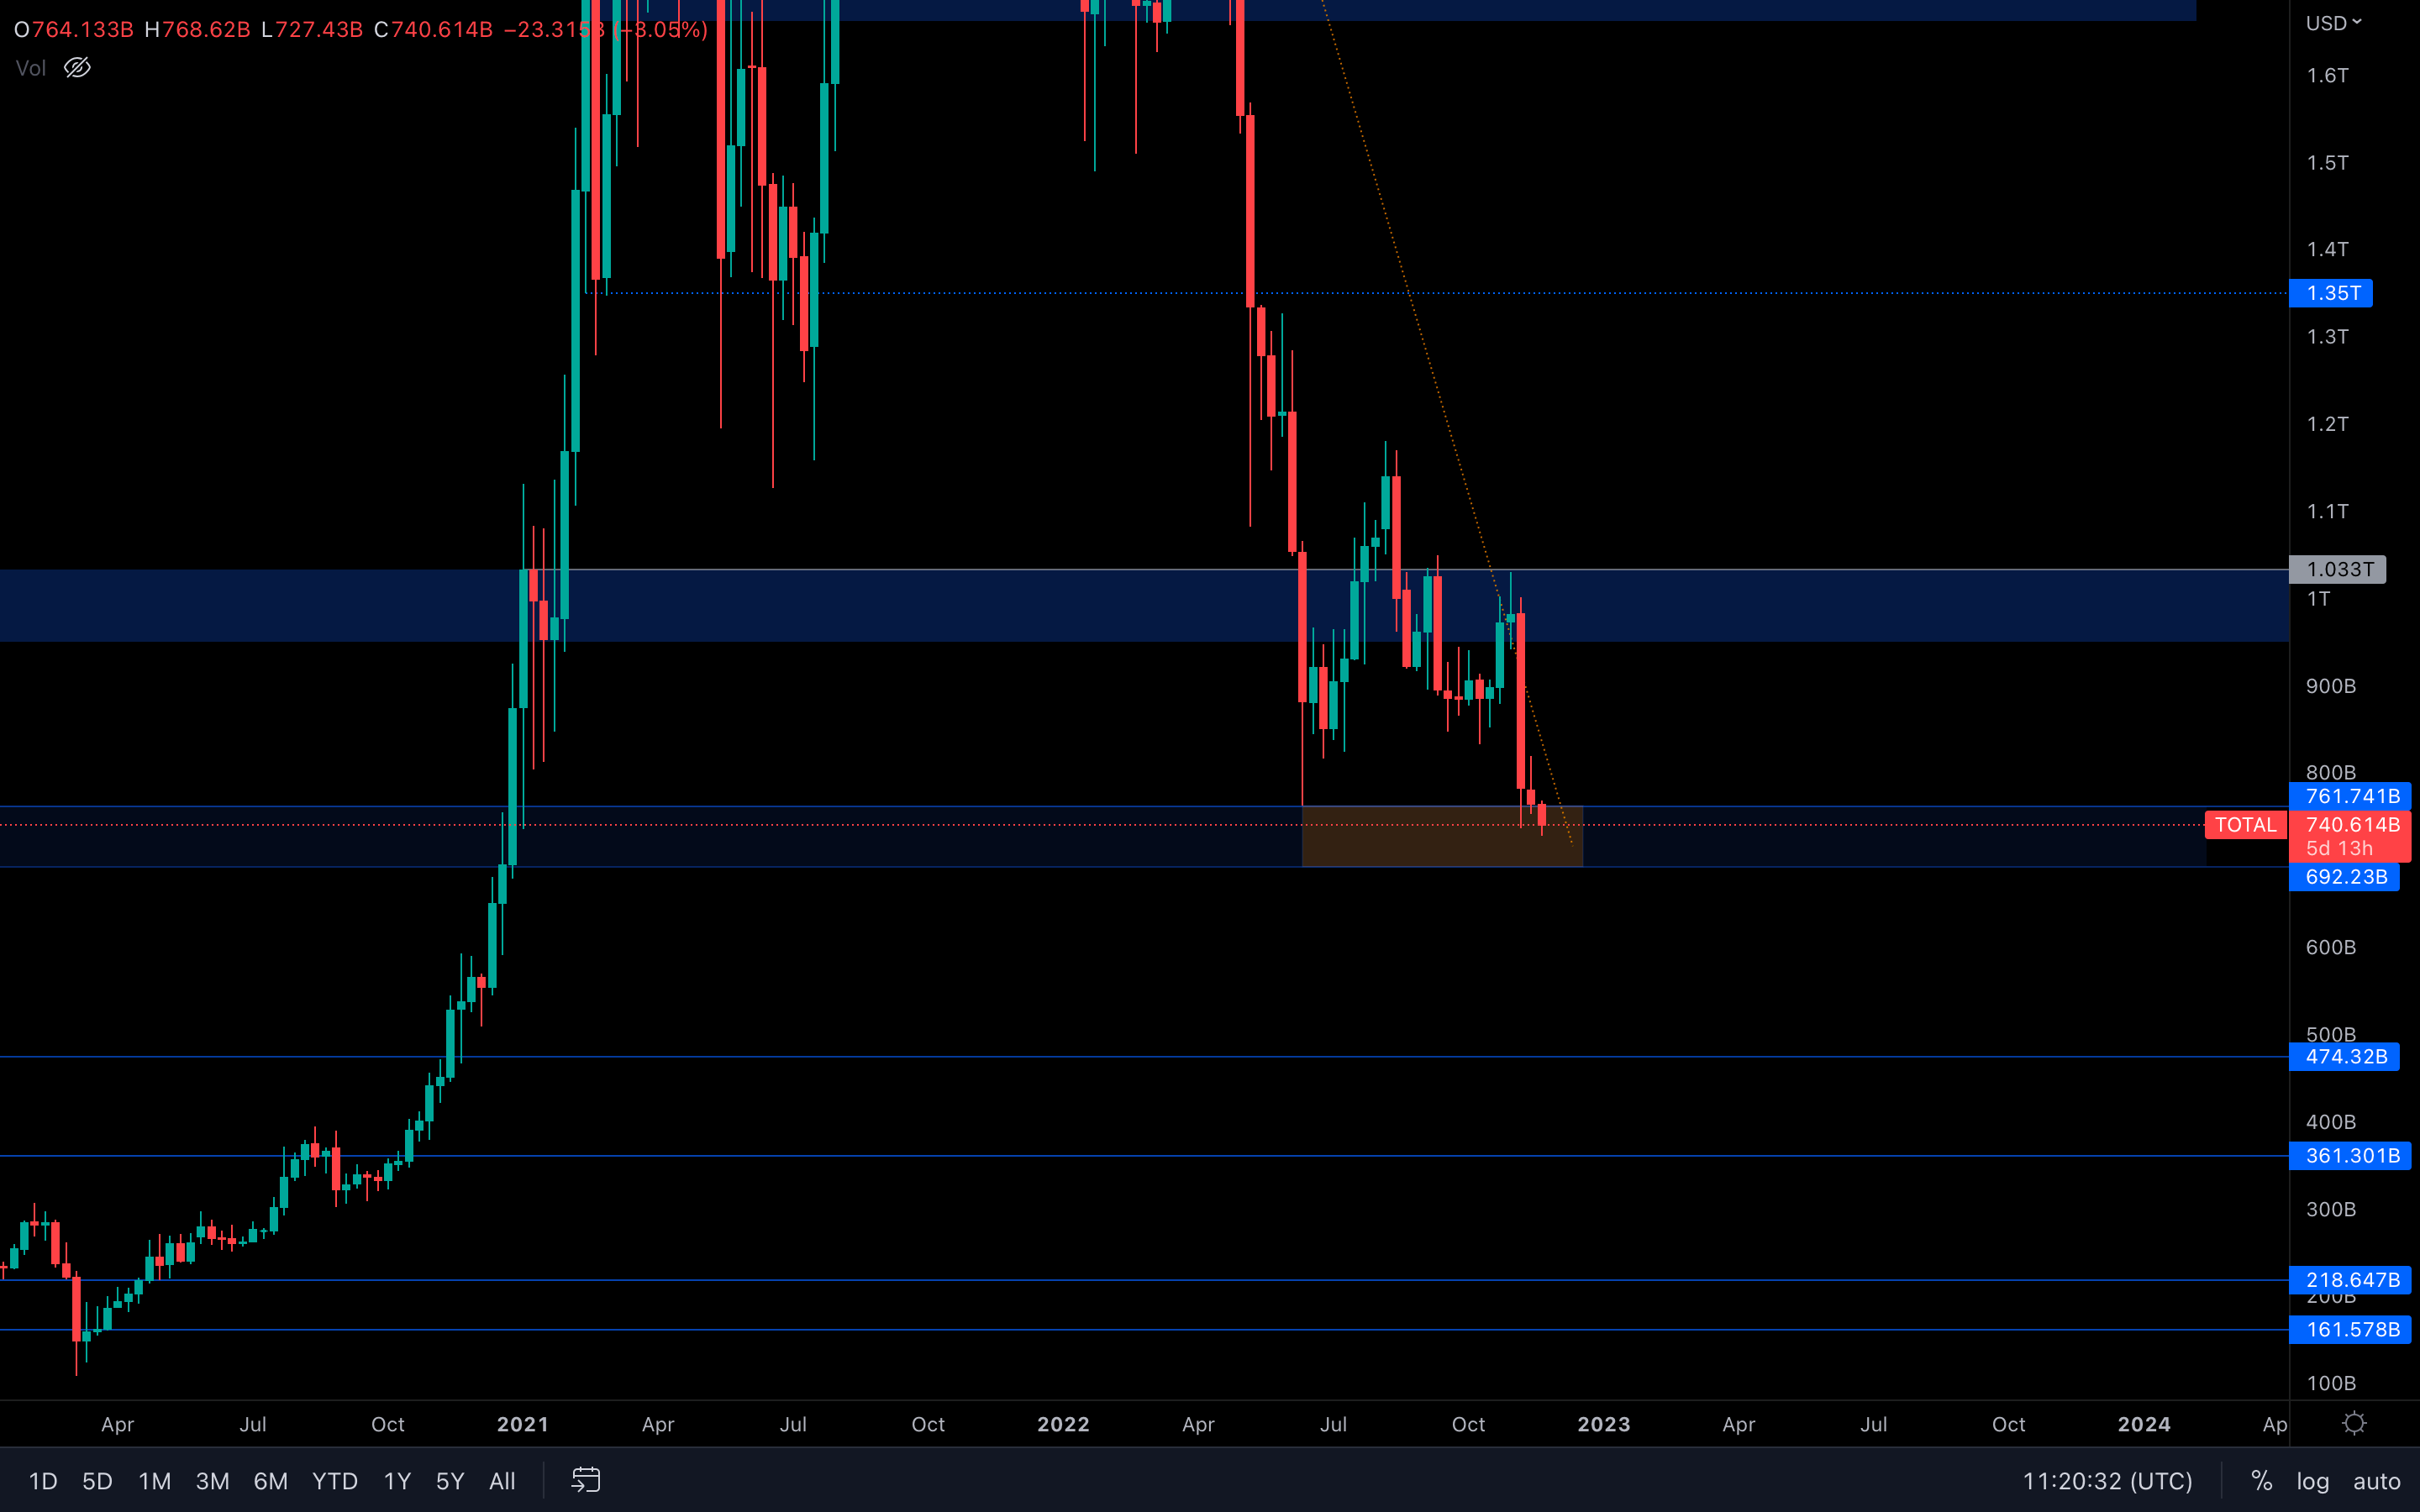 Downside resumes. The Total Market Cap index registered an even lower weekly candle closure last week, which is now pushing the total evaluation toward $692B. Yesterday, we even formed a new low - it's not a big difference in $, but it is a notable technical difference.
The safe bet here is that $692B will be tested next. However, the $761B level could easily be reclaimed, so the downside scenario can get invalidated. Don't go 100% on the $692B probability, it's honestly a 50-50 game now.
Altcoins Market Cap
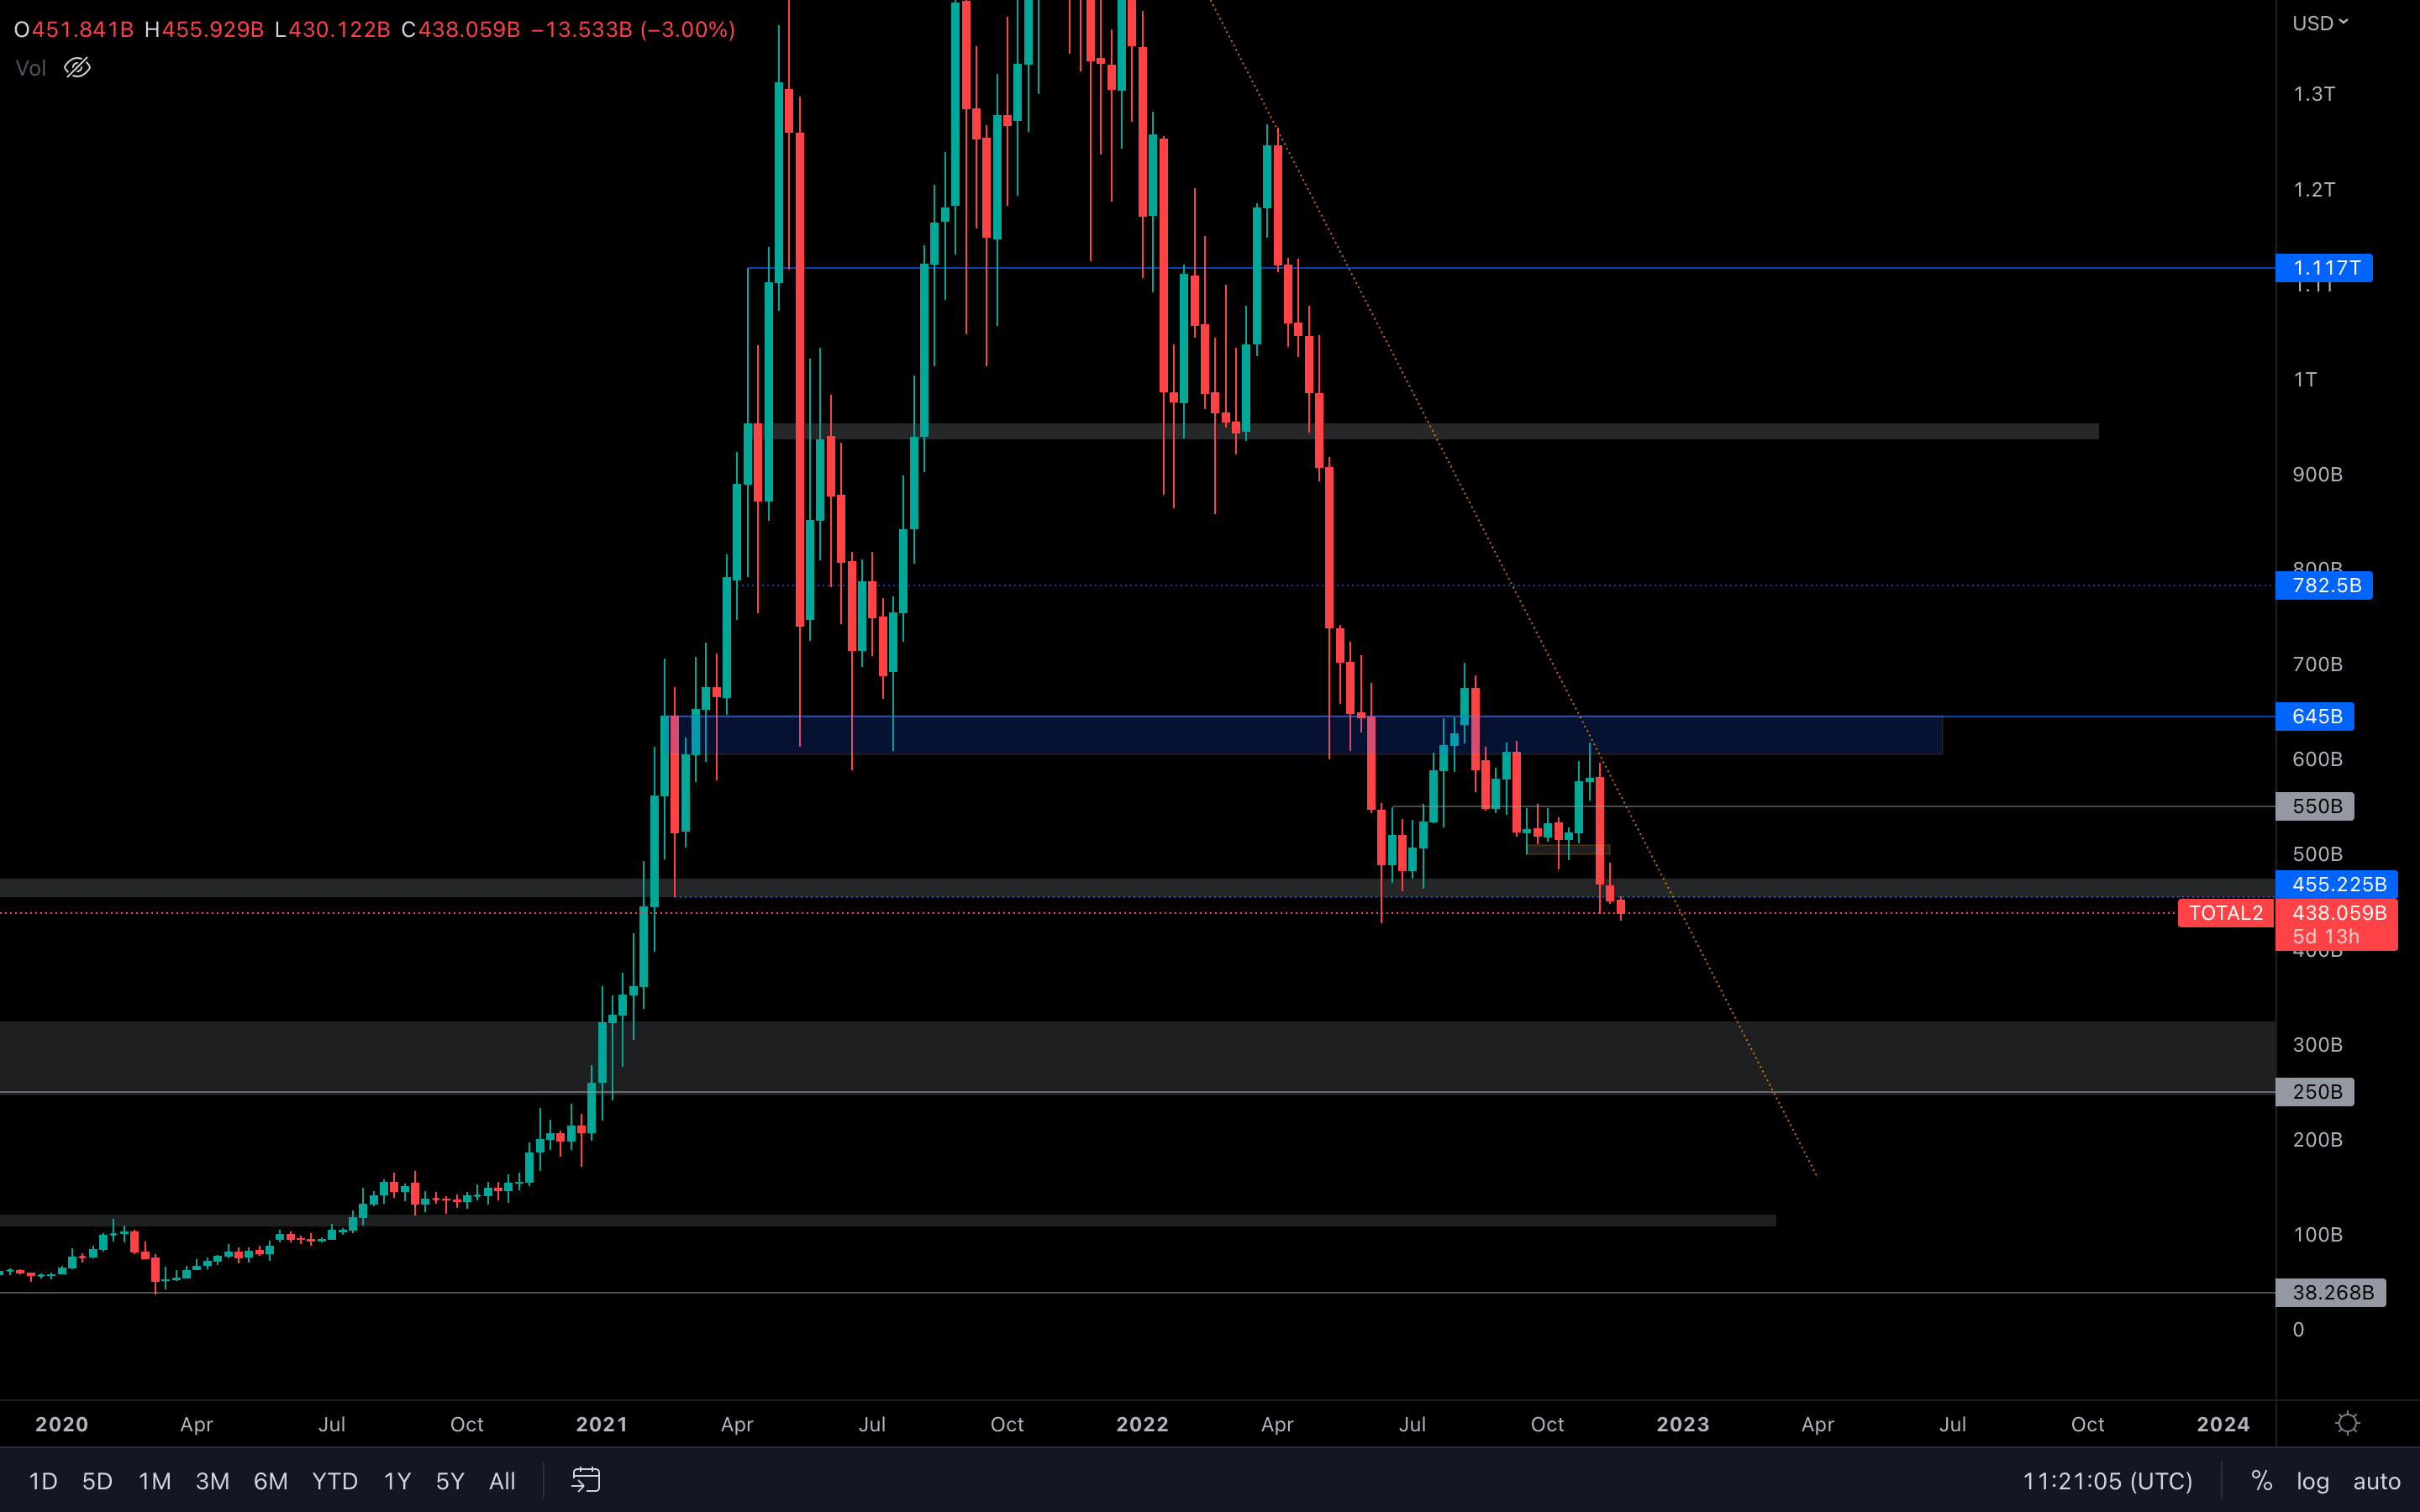 We almost had a full-bodied closure for the Altcoins Market Cap last week, but even with that, the similarities between the Total Market Cap and the Altcoins Market Cap remain. Where the T Mcap goes, the A MCap follows, and that statement will stay true until we reach a solid evaluation for the entire crypto market when the two indexes can have different price actions.
With that aside, we'll need to see a weekly closure above $455B, otherwise, the Altcoins Market Cap risks having $300B as its next target. 🫣
Bitcoin - Technical Analysis
 (Daily chart was used)
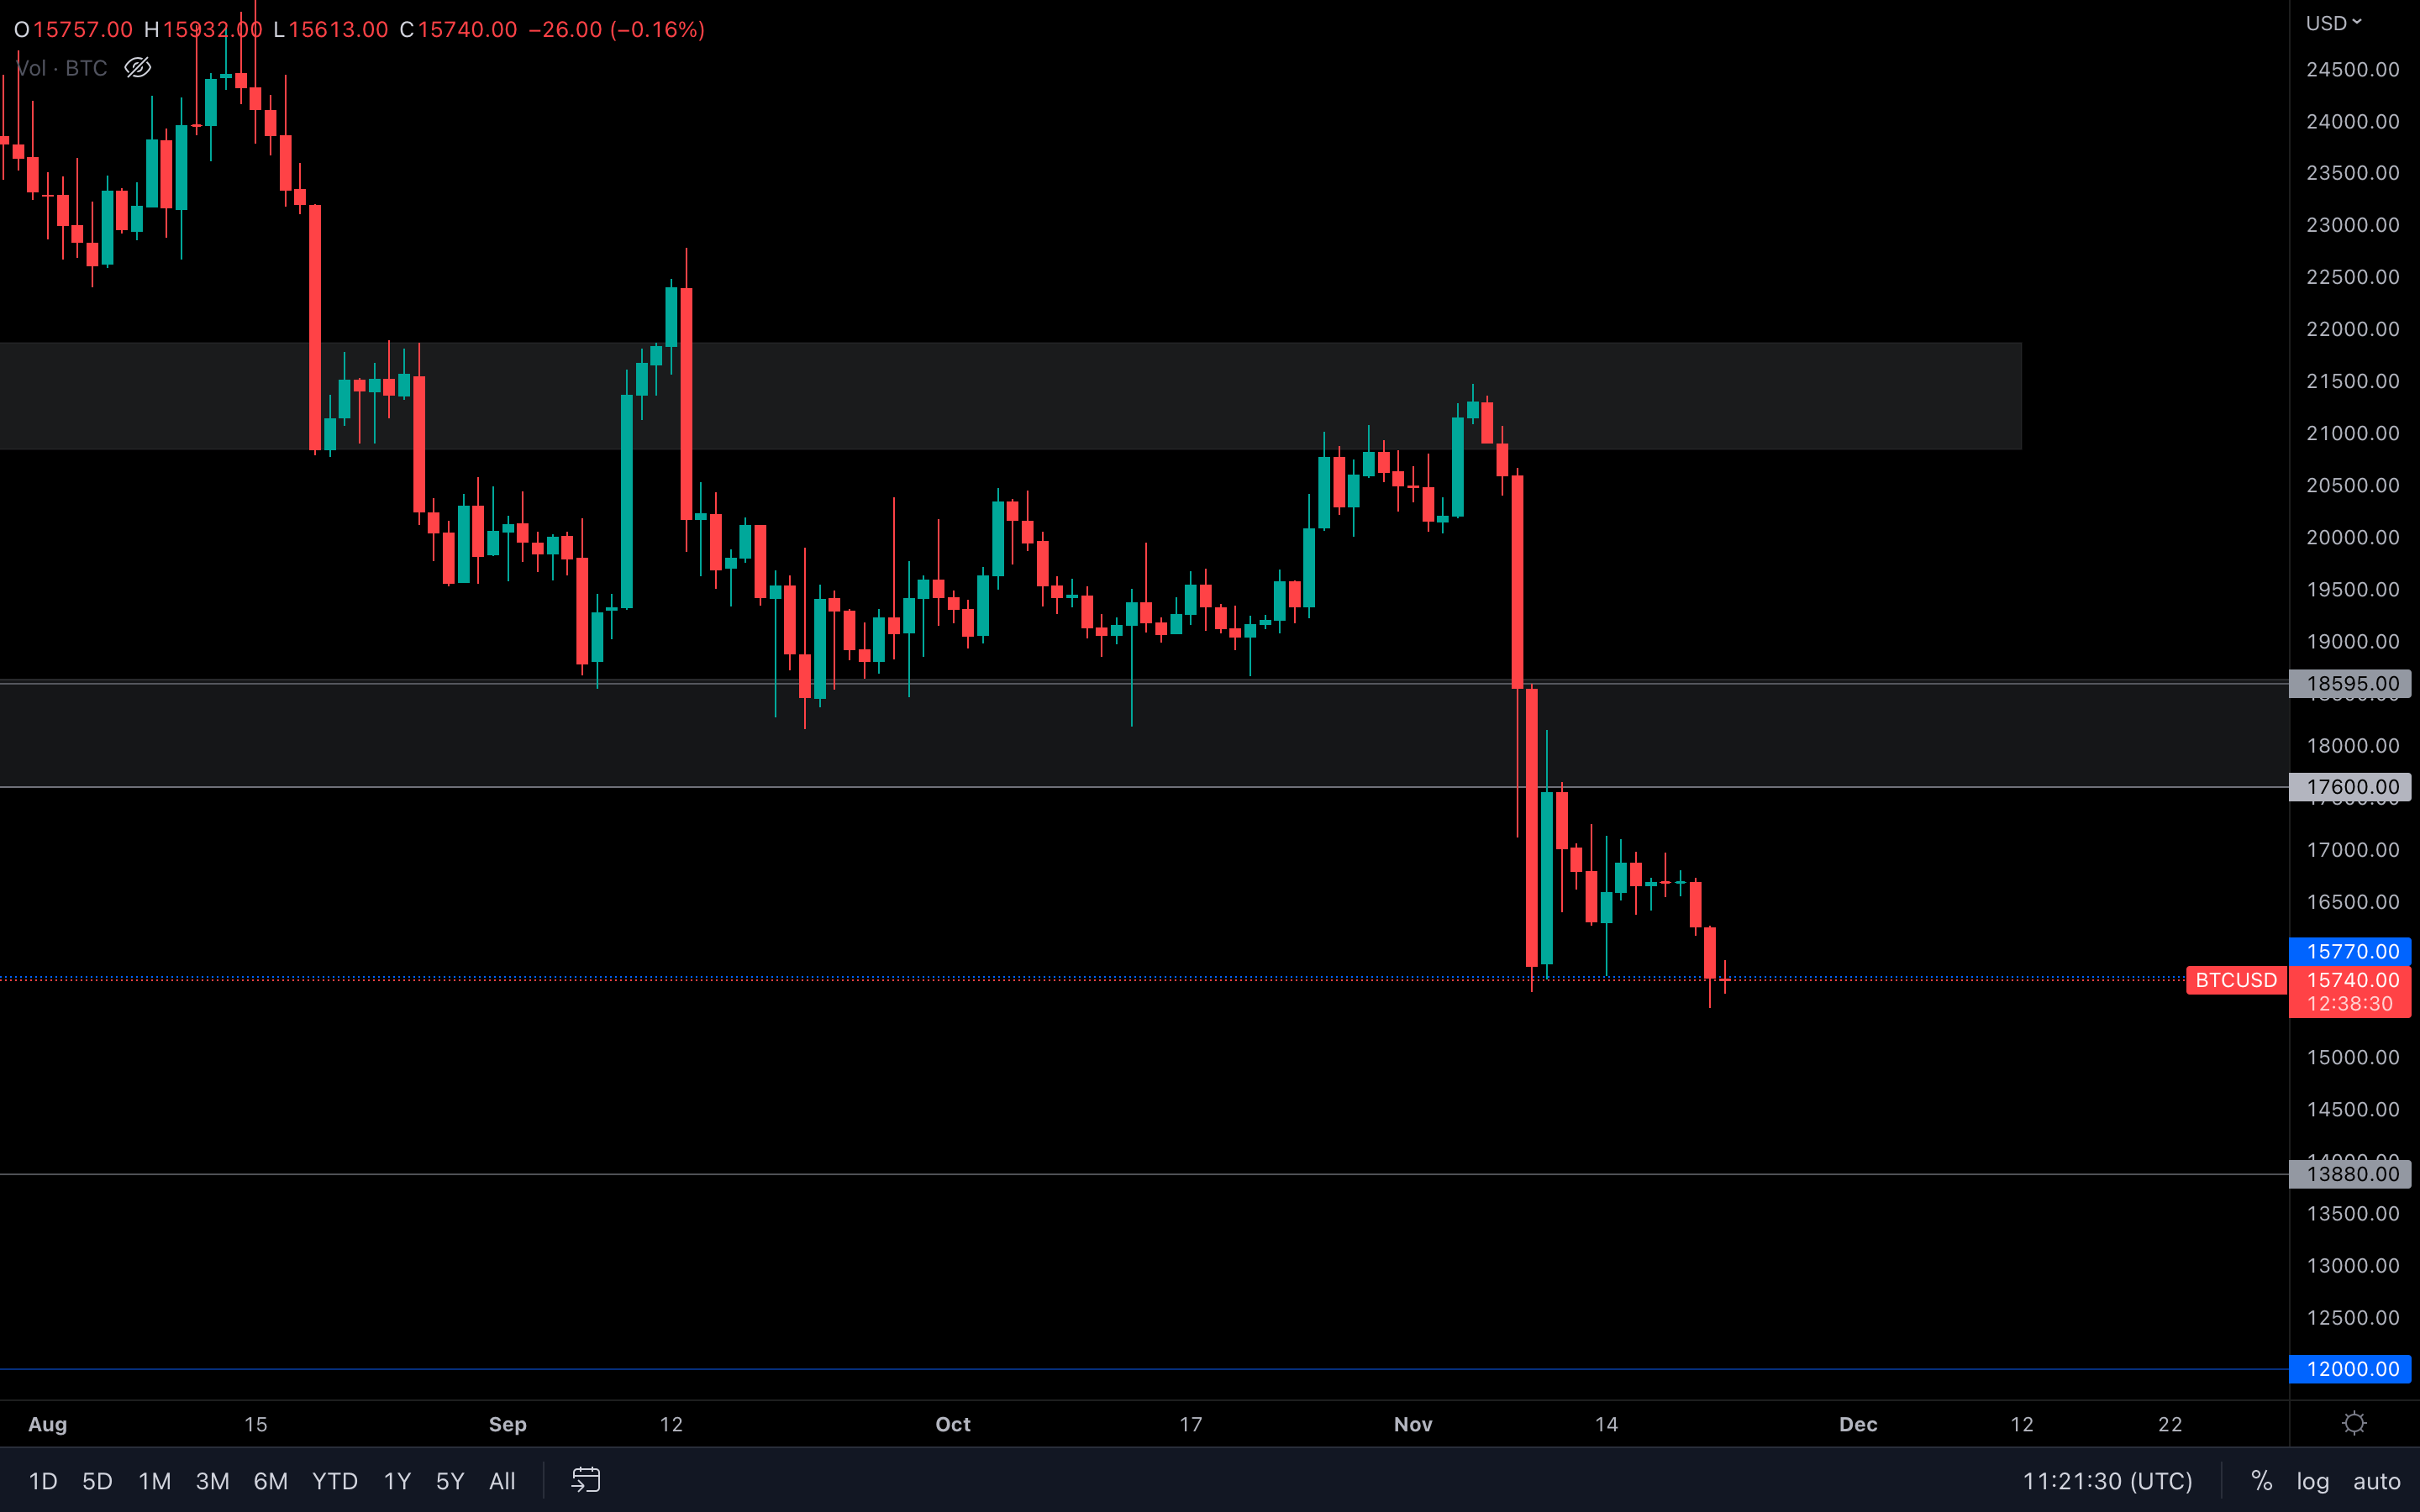
New low for Bitcoin as well - the asset has now reached its $15,770 local supporting level, to which there's not much strength as we have only seen some interest around this level only once in the past, and that's almost two weeks ago.
(Daily chart was used)
New low for Bitcoin as well - the asset has now reached its $15,770 local supporting level, to which there's not much strength as we have only seen some interest around this level only once in the past, and that's almost two weeks ago.
If $15,770 holds here, then we could see choppy price action between $15,770 and $17,600 until either of these levels is broken, similar to what we've seen a few days ago. However, a loss of $15,770 puts $13,880 as Bitcoin's next stop. It's a waiting game for now.
Let’s dive into the on-chain metrics to see how the widespread contagion fears can be viewed on-chain.
Metric 1 – Exchange Net Position Change
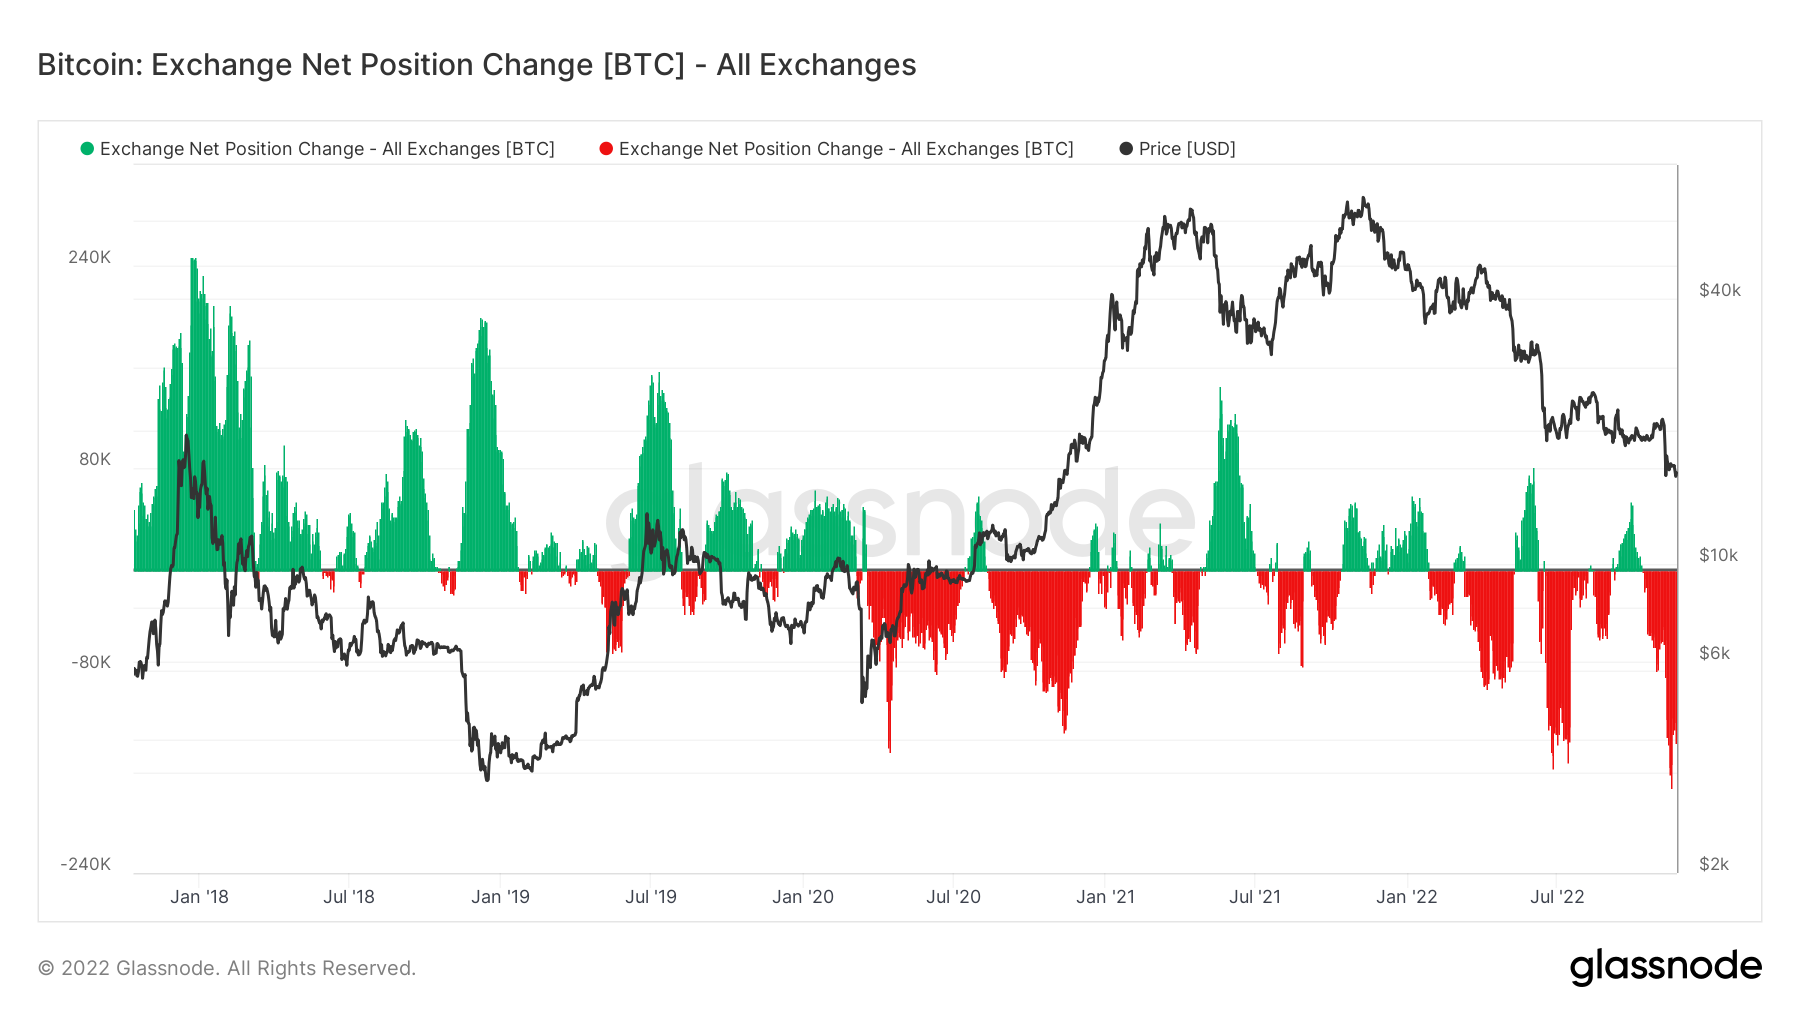
The Exchange Net Position Change shows the 30d change of supply held in Exchange wallets. We can see from the below graph that the most recent red spike is the deepest we’ve seen. This shows that investors are taking self-custody into their own hands. The well-known cold storage wallet provider Ledger announced a record sales week in the week following the demise of FTX.
Bitcoin – Exchange Net Position Change
 Metric 2 – Addresses
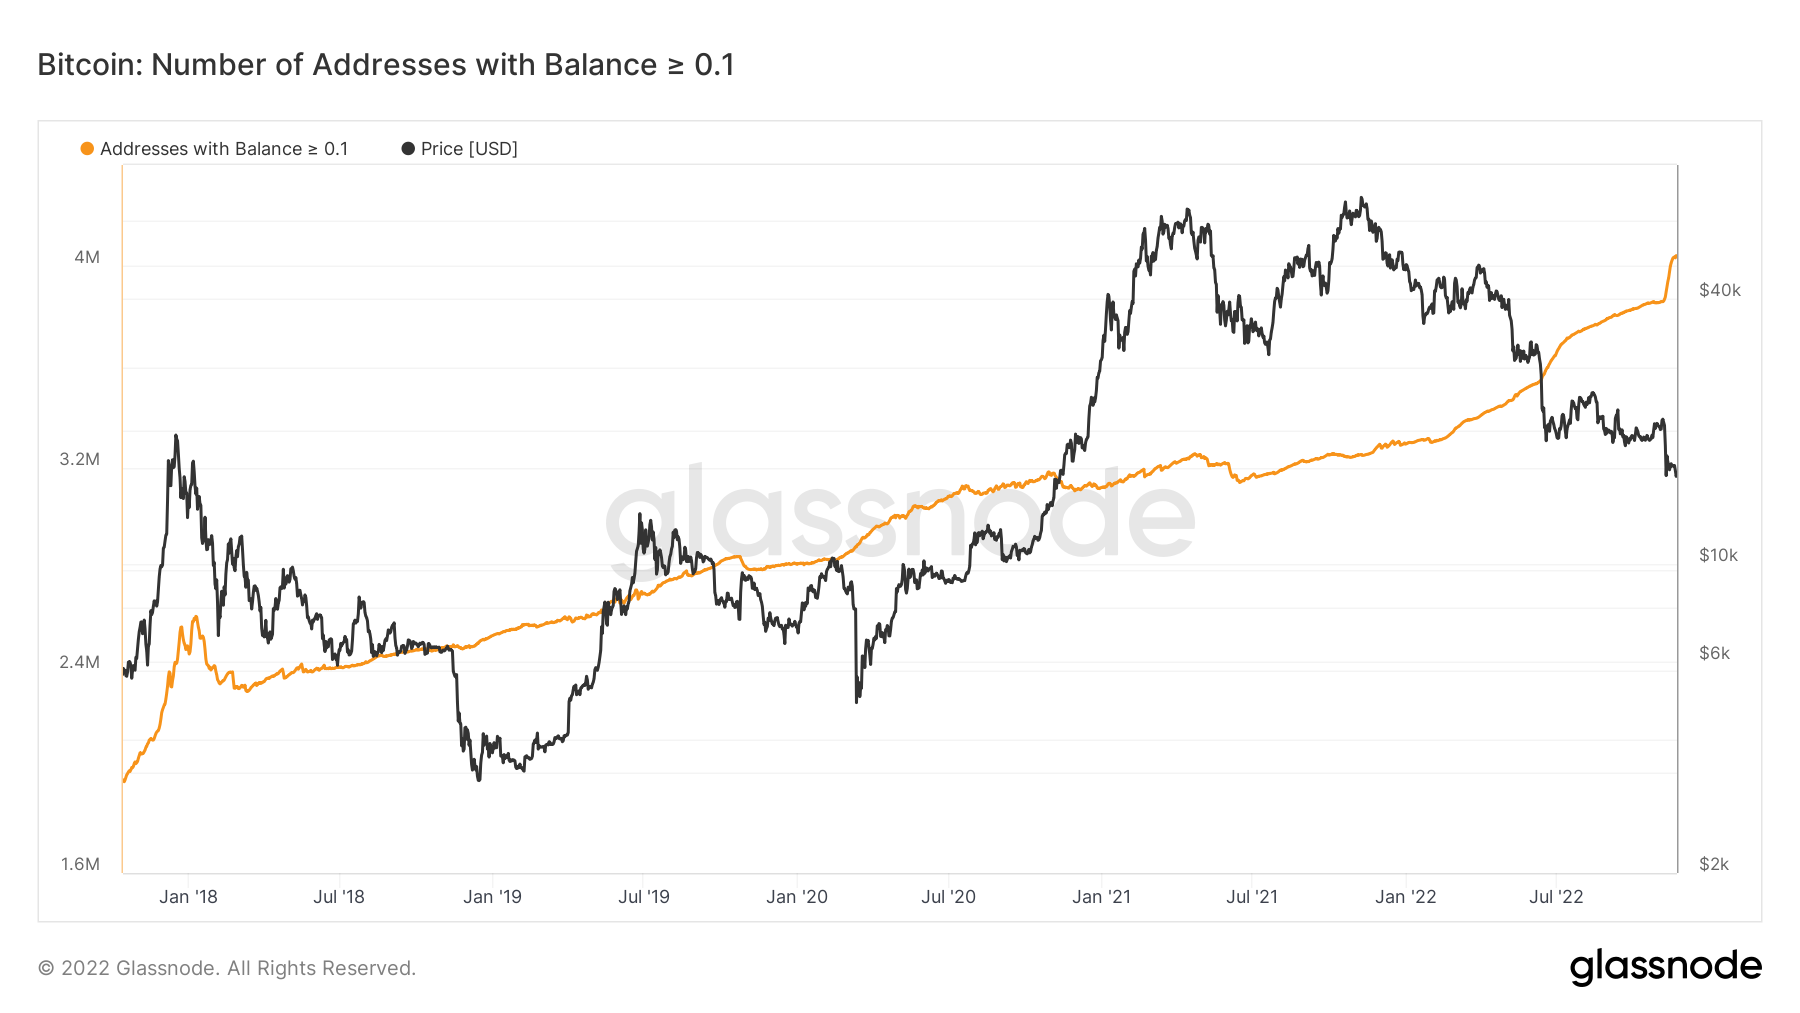
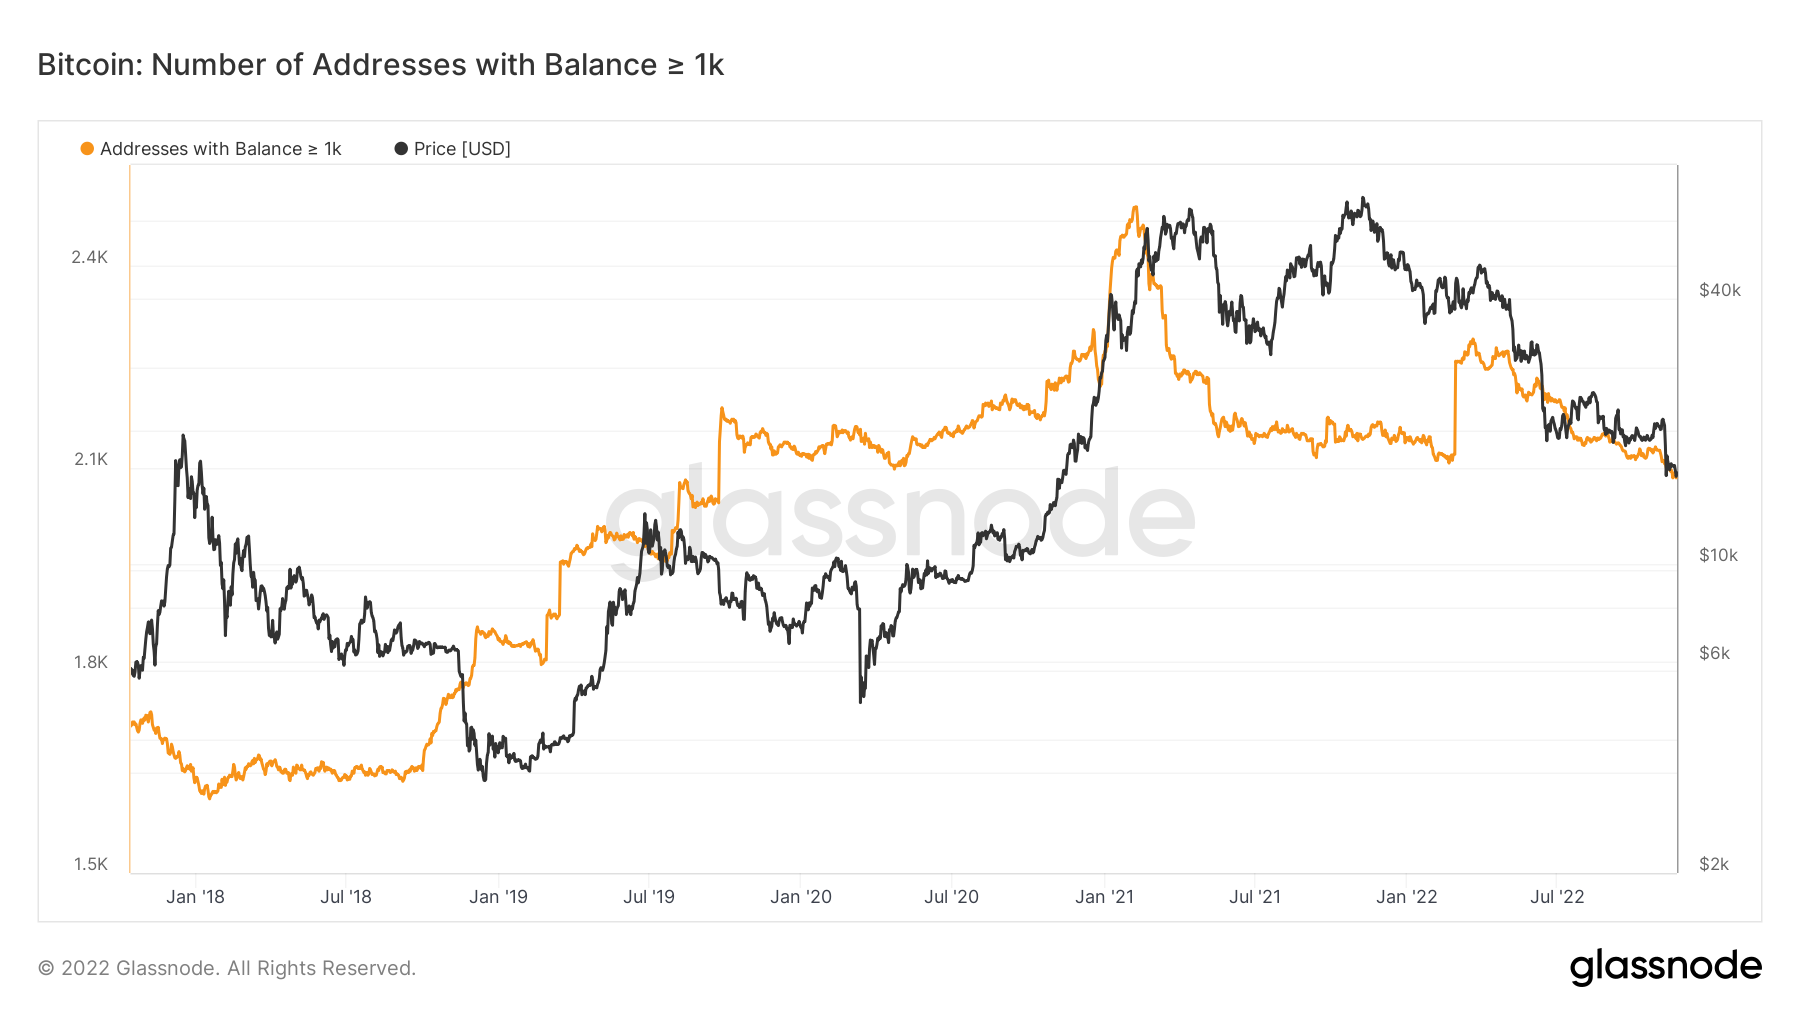
In the past fortnight, we have seen some significant divergences in the Addresses metrics. The smaller Bitcoin wallet cohorts have begun risking on in an aggressive manner. However, the largest wallet cohorts have begun to risk off (reduce their exposure to Bitcoin). Interestingly, the wallet cohort containing more than 10,000 BTC have also heavily risked-on. The last time the wallet cohort of > 1,000 BTC was at an unrealised loss was back in March 2020, perhaps this is why we’re seeing them be more cautious in their risk taking (adding more BTC).
Bitcoin – Addresses with Balance > 0.1 Bitcoin
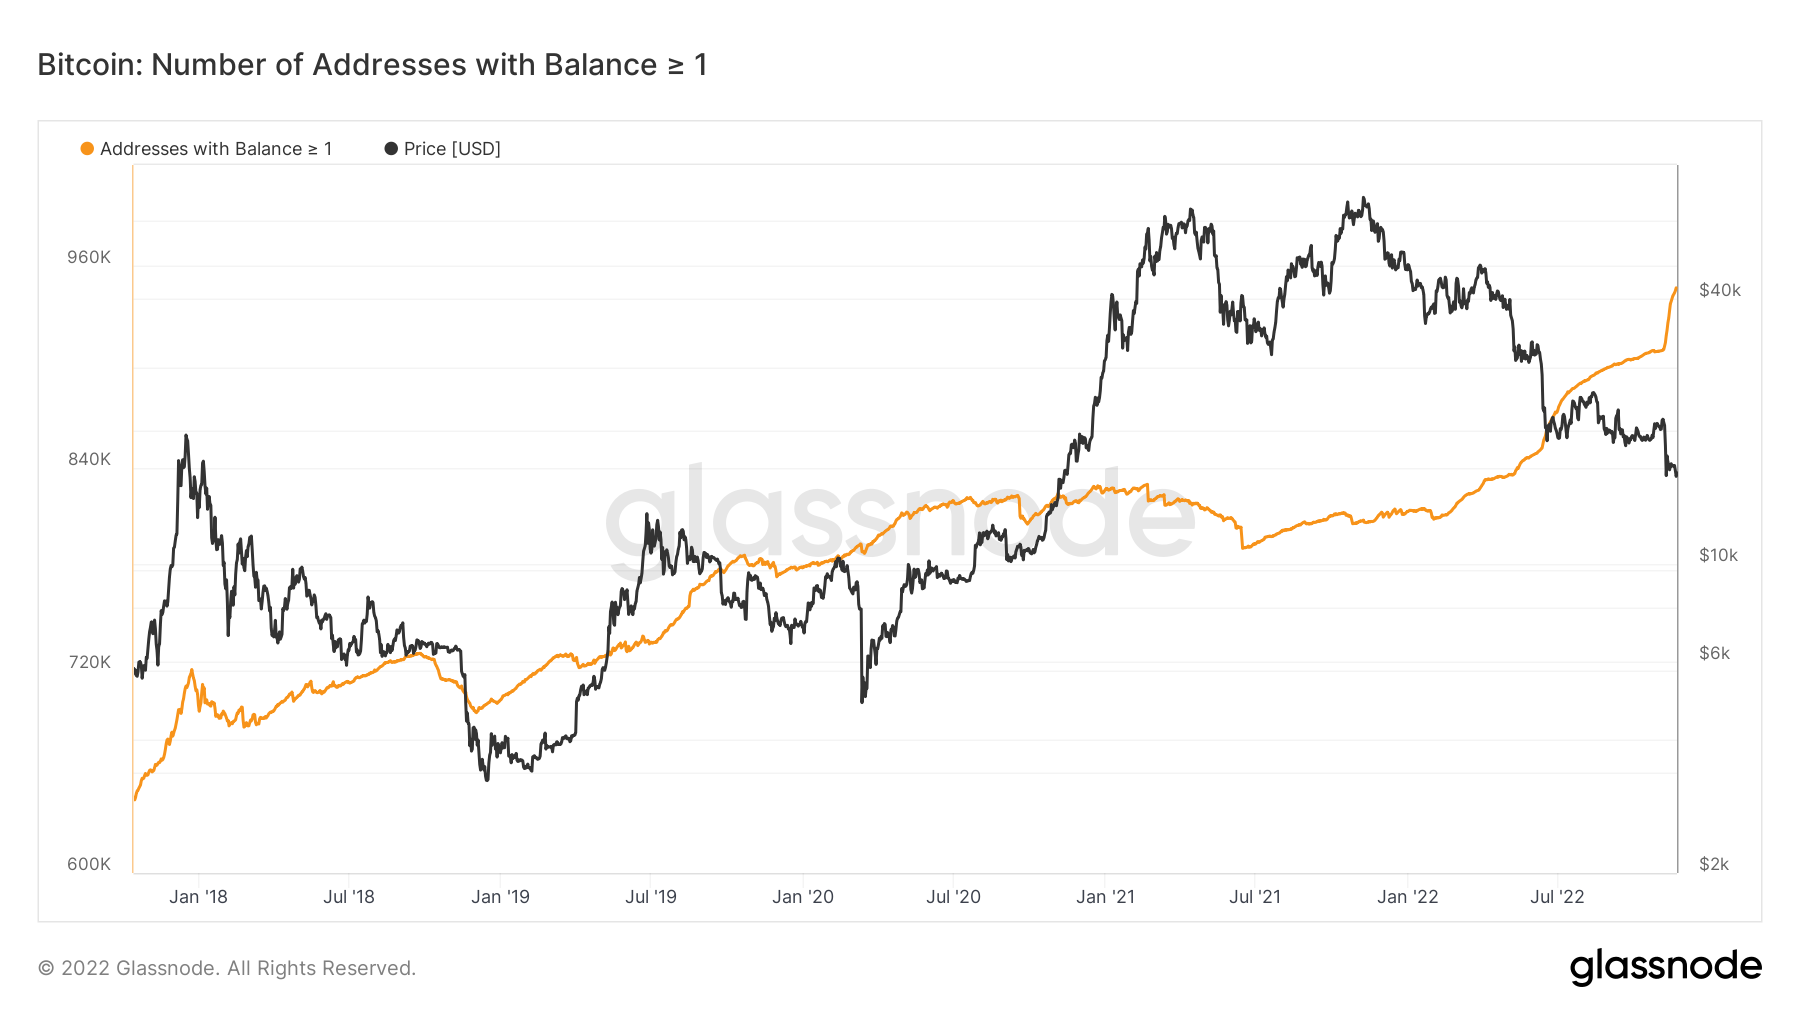
 Bitcoin – Addresses with Balance > 1 Bitcoin
 Bitcoin – Addresses with Balance > 1,000 Bitcoin
 Bitcoin – Addresses with Balance > 10,000 Bitcoin
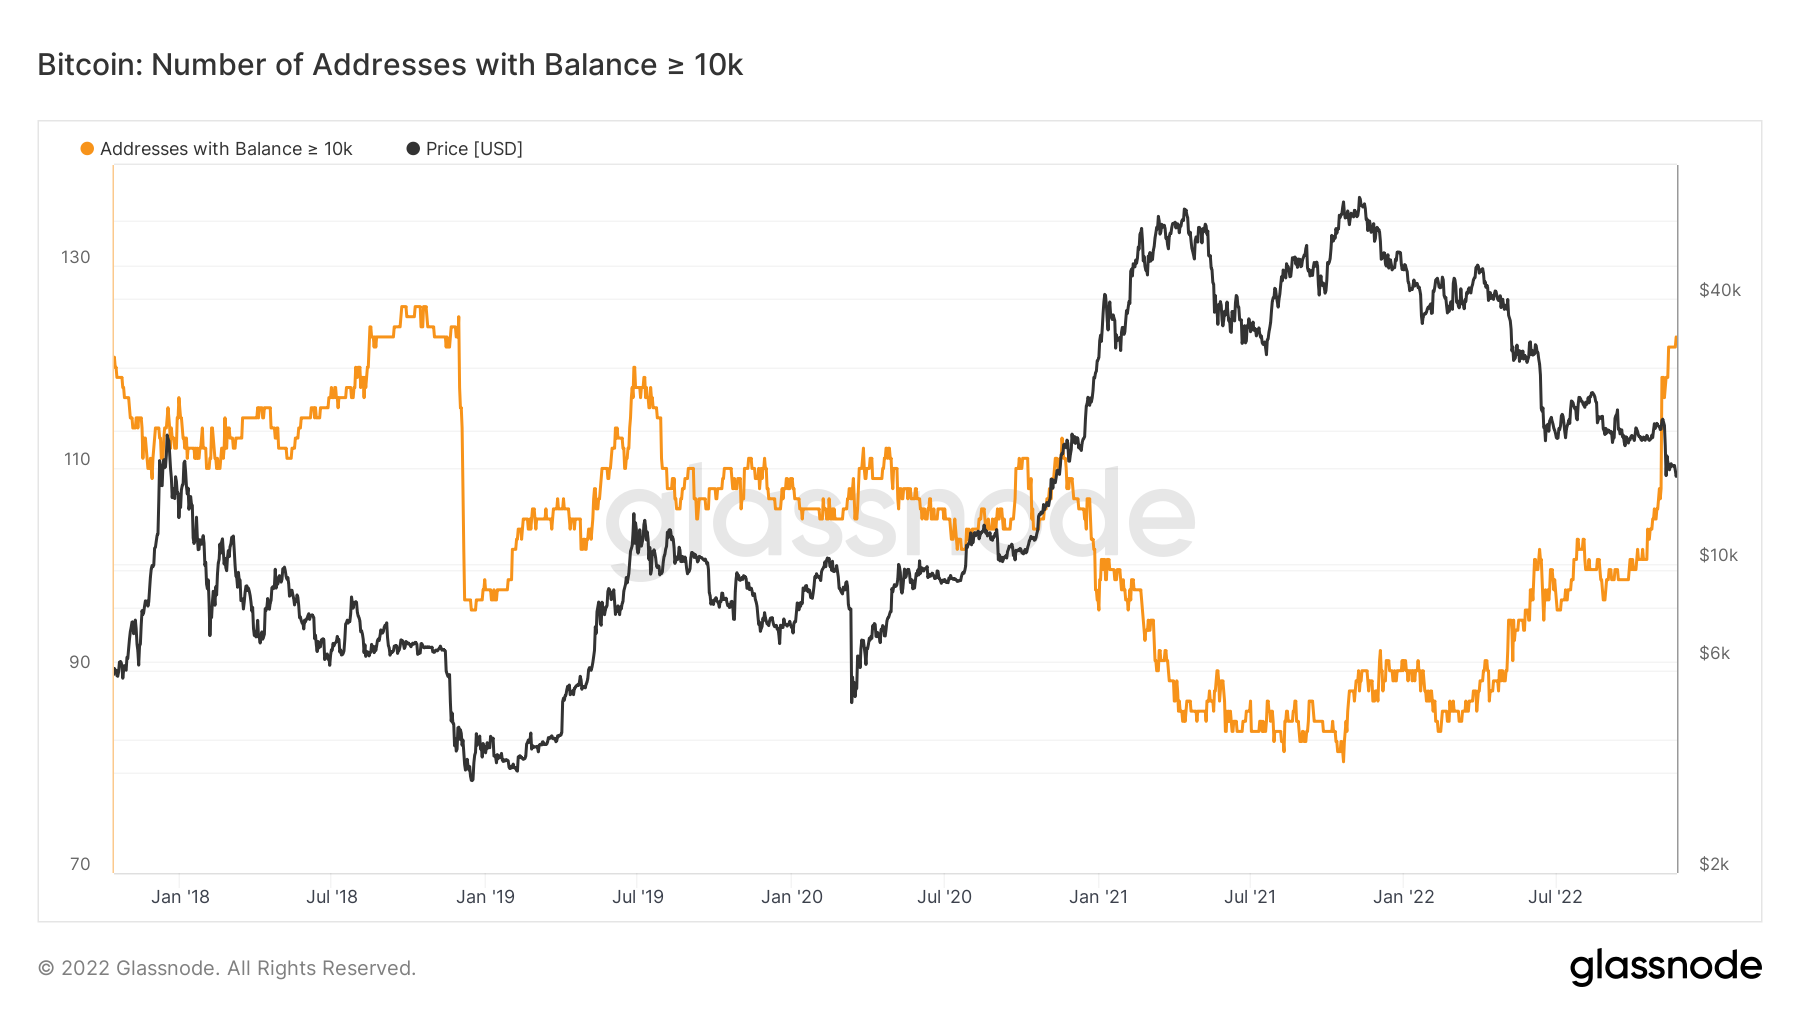 Metric 3 – Net Realised Profit/Loss
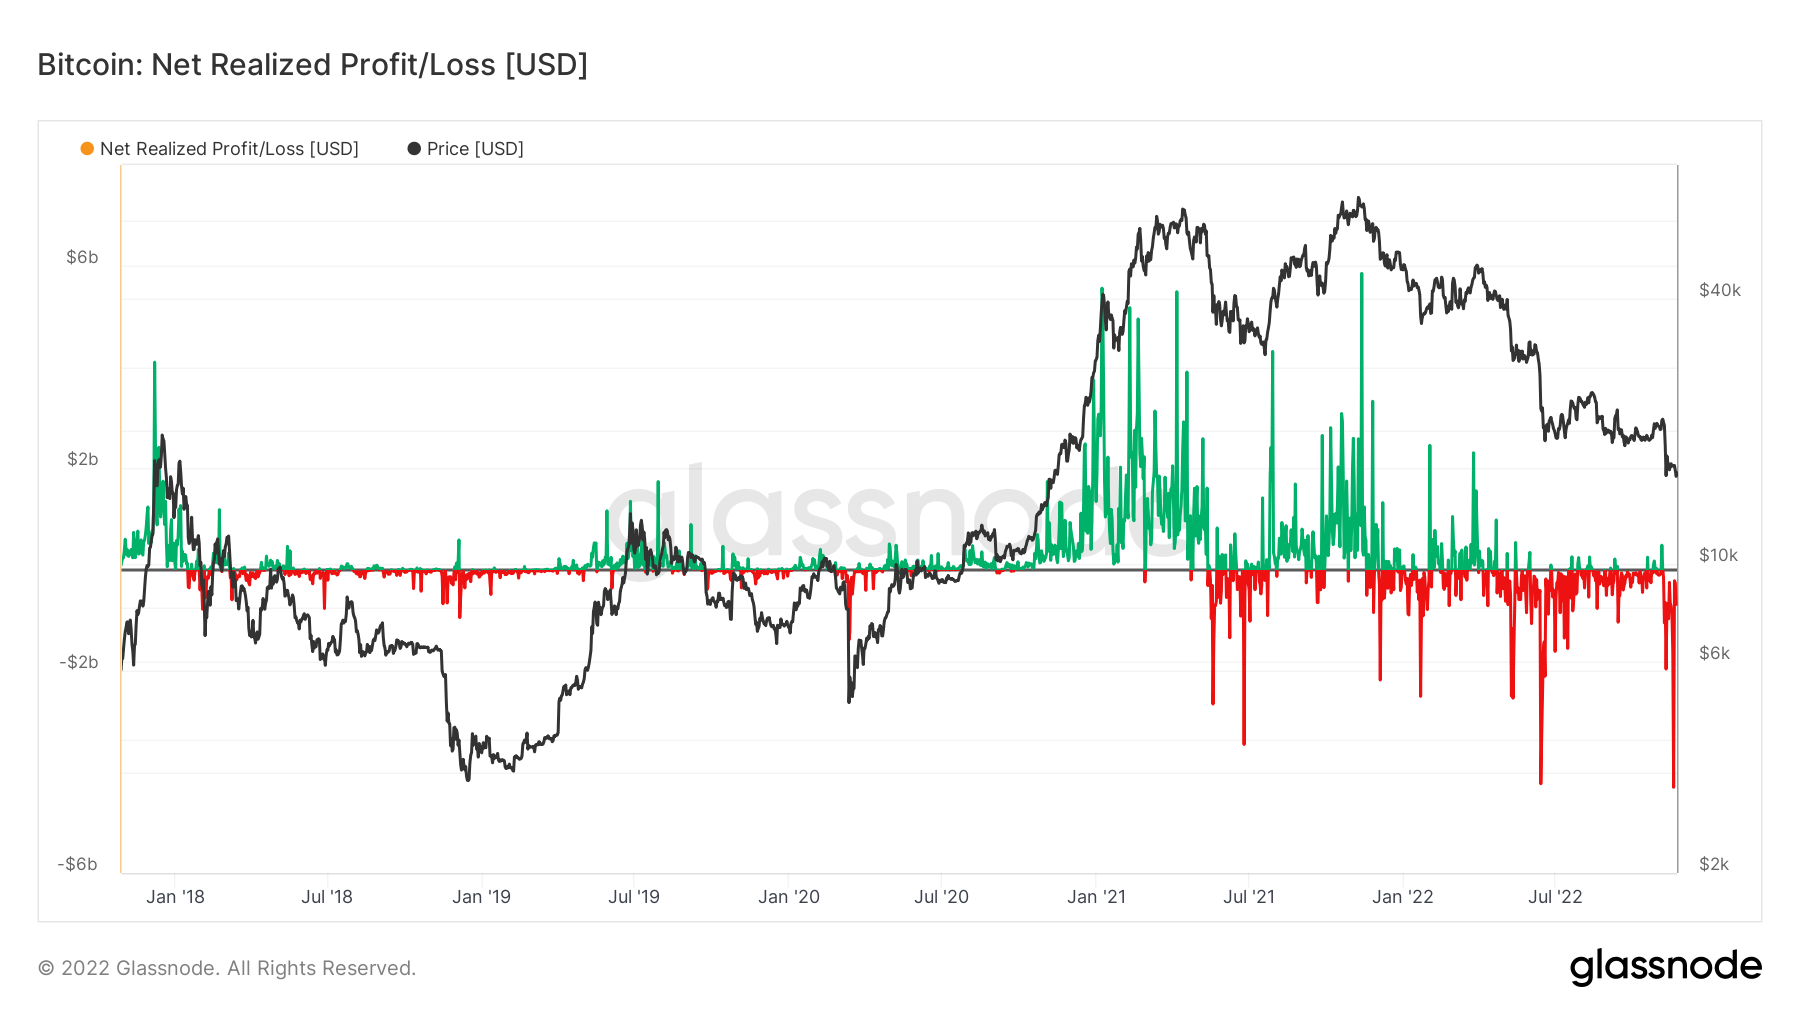
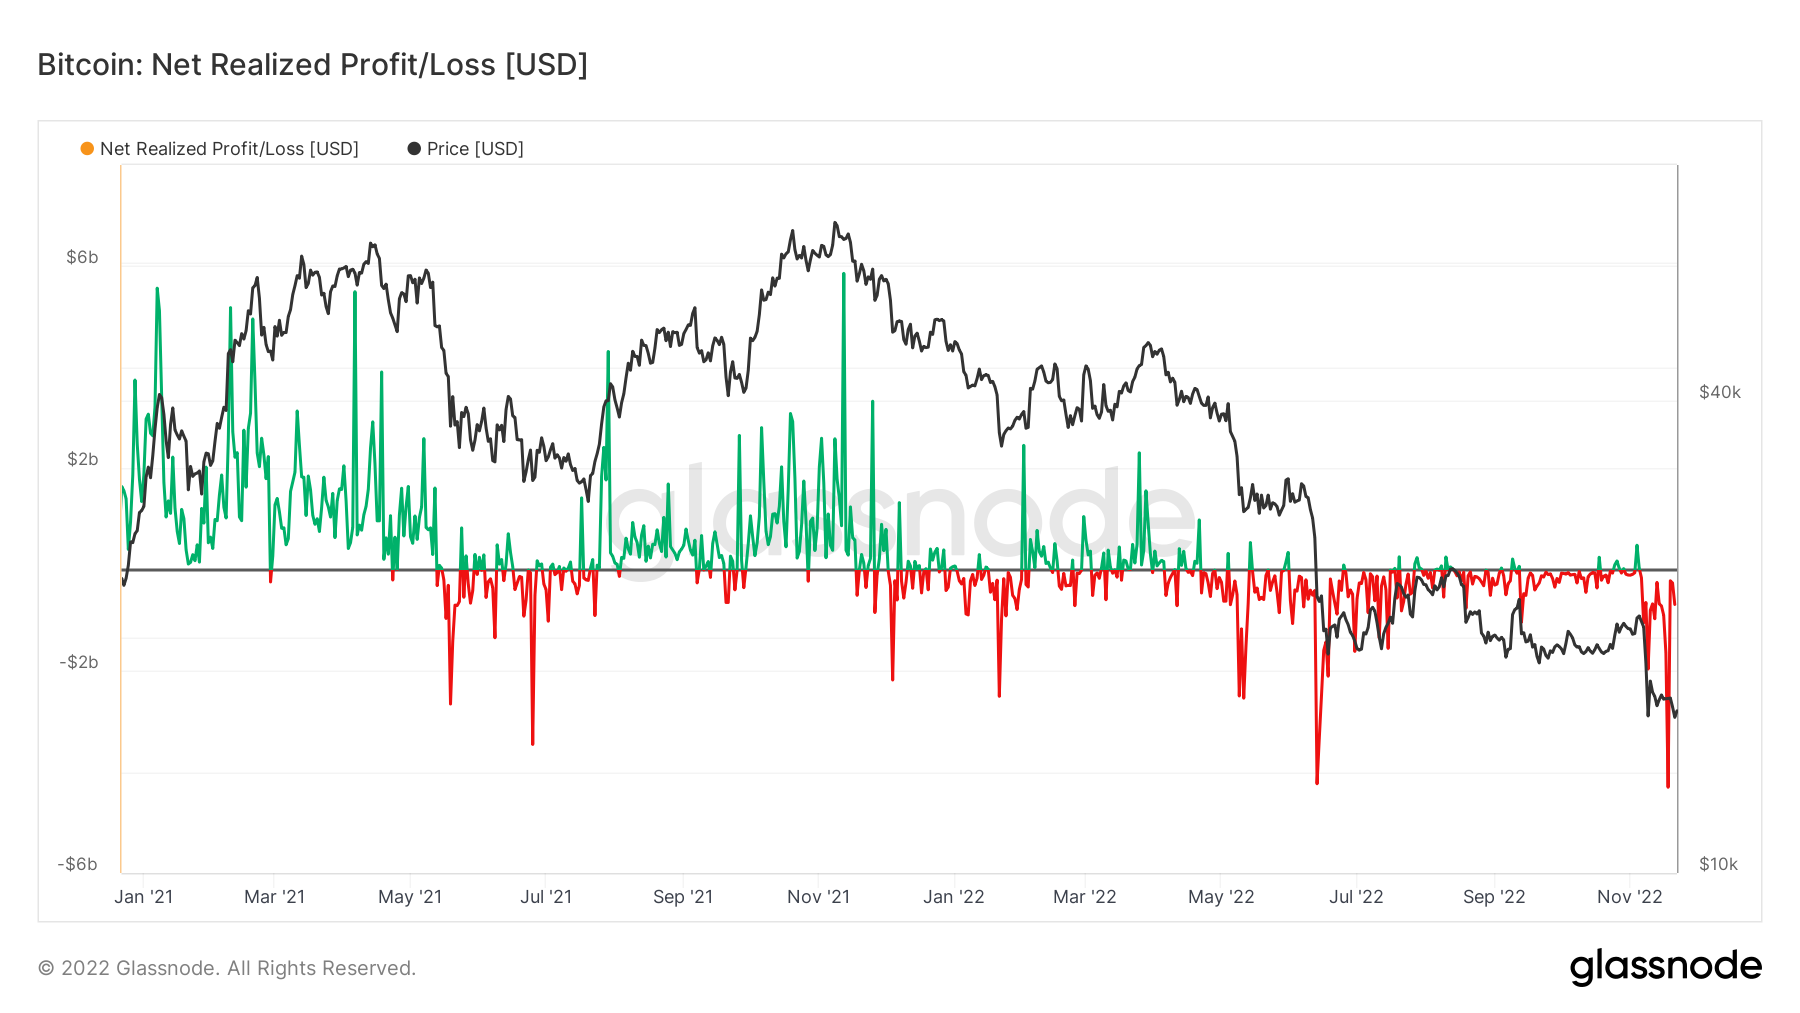
The Net Realised Profit/Loss shows the profit or loss of all moved coins. The below graph shows that in the past week, there was the largest red spike of realised losses. This indicates that the amount of USD loss taking was the most it has ever been in the past week. Now, this was not during the price collapse from $20,000 down to $16,000, but rather a few days later when Bitcoin remained relatively flat at the $16,700 level. A zoomed out and zoomed in version shared below.
Bitcoin – Net Realised Profit/Loss (Zoomed Out)
 Bitcoin – Net Realised Profit/Loss (Zoomed In)
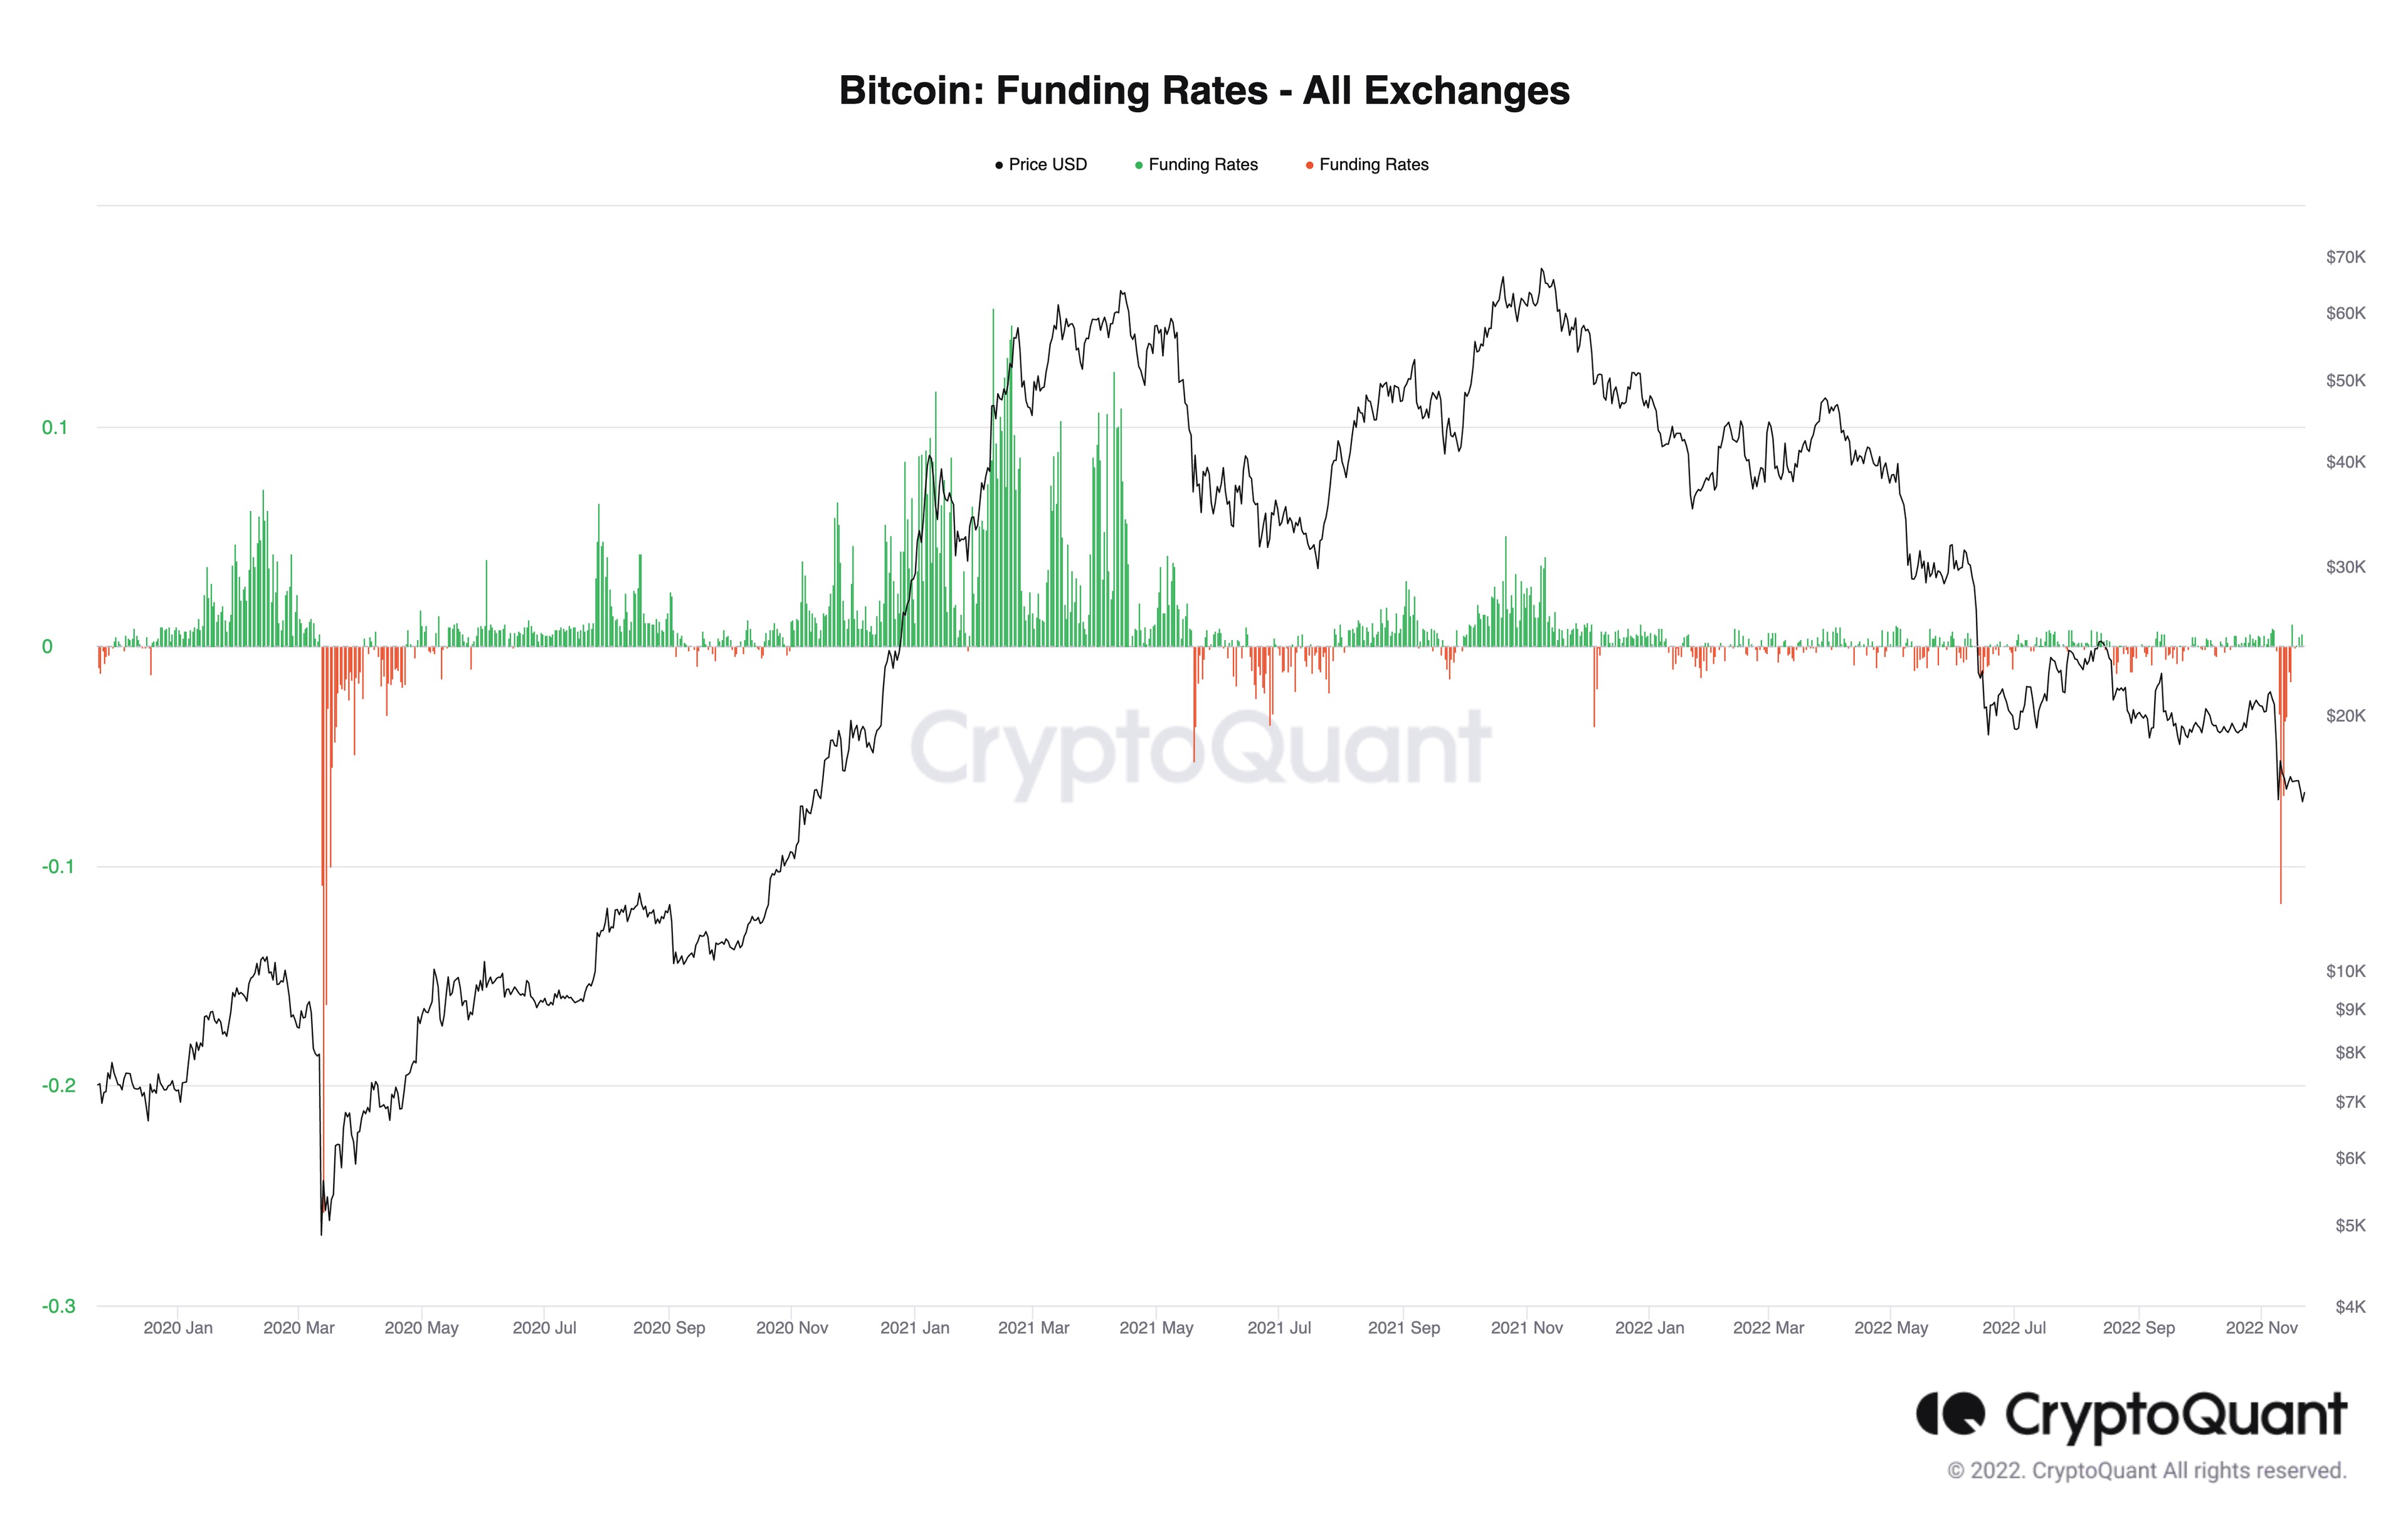
 Metric 4 – Funding Rates
In last week’s report, we covered Open Interest, showing that it had fallen dramatically. A fall in Open Interest indicates the amount of leverage in the system has decreased which is much healthier for the market going forward.
Alongside this, we have now begun to see Funding Rates reset to normal levels. When the FTX collapse played out, Funding became deeply negative, meaning investors were paying a premium to be Short, of which that premium was being paid to Longs.
So, in the prior week we saw leverage come down to a more healthy level, followed this week by Funding Rates resetting to a more healthy level also.
Bitcoin – Funding Rates
Ether - Technical & On-Chain Analysis
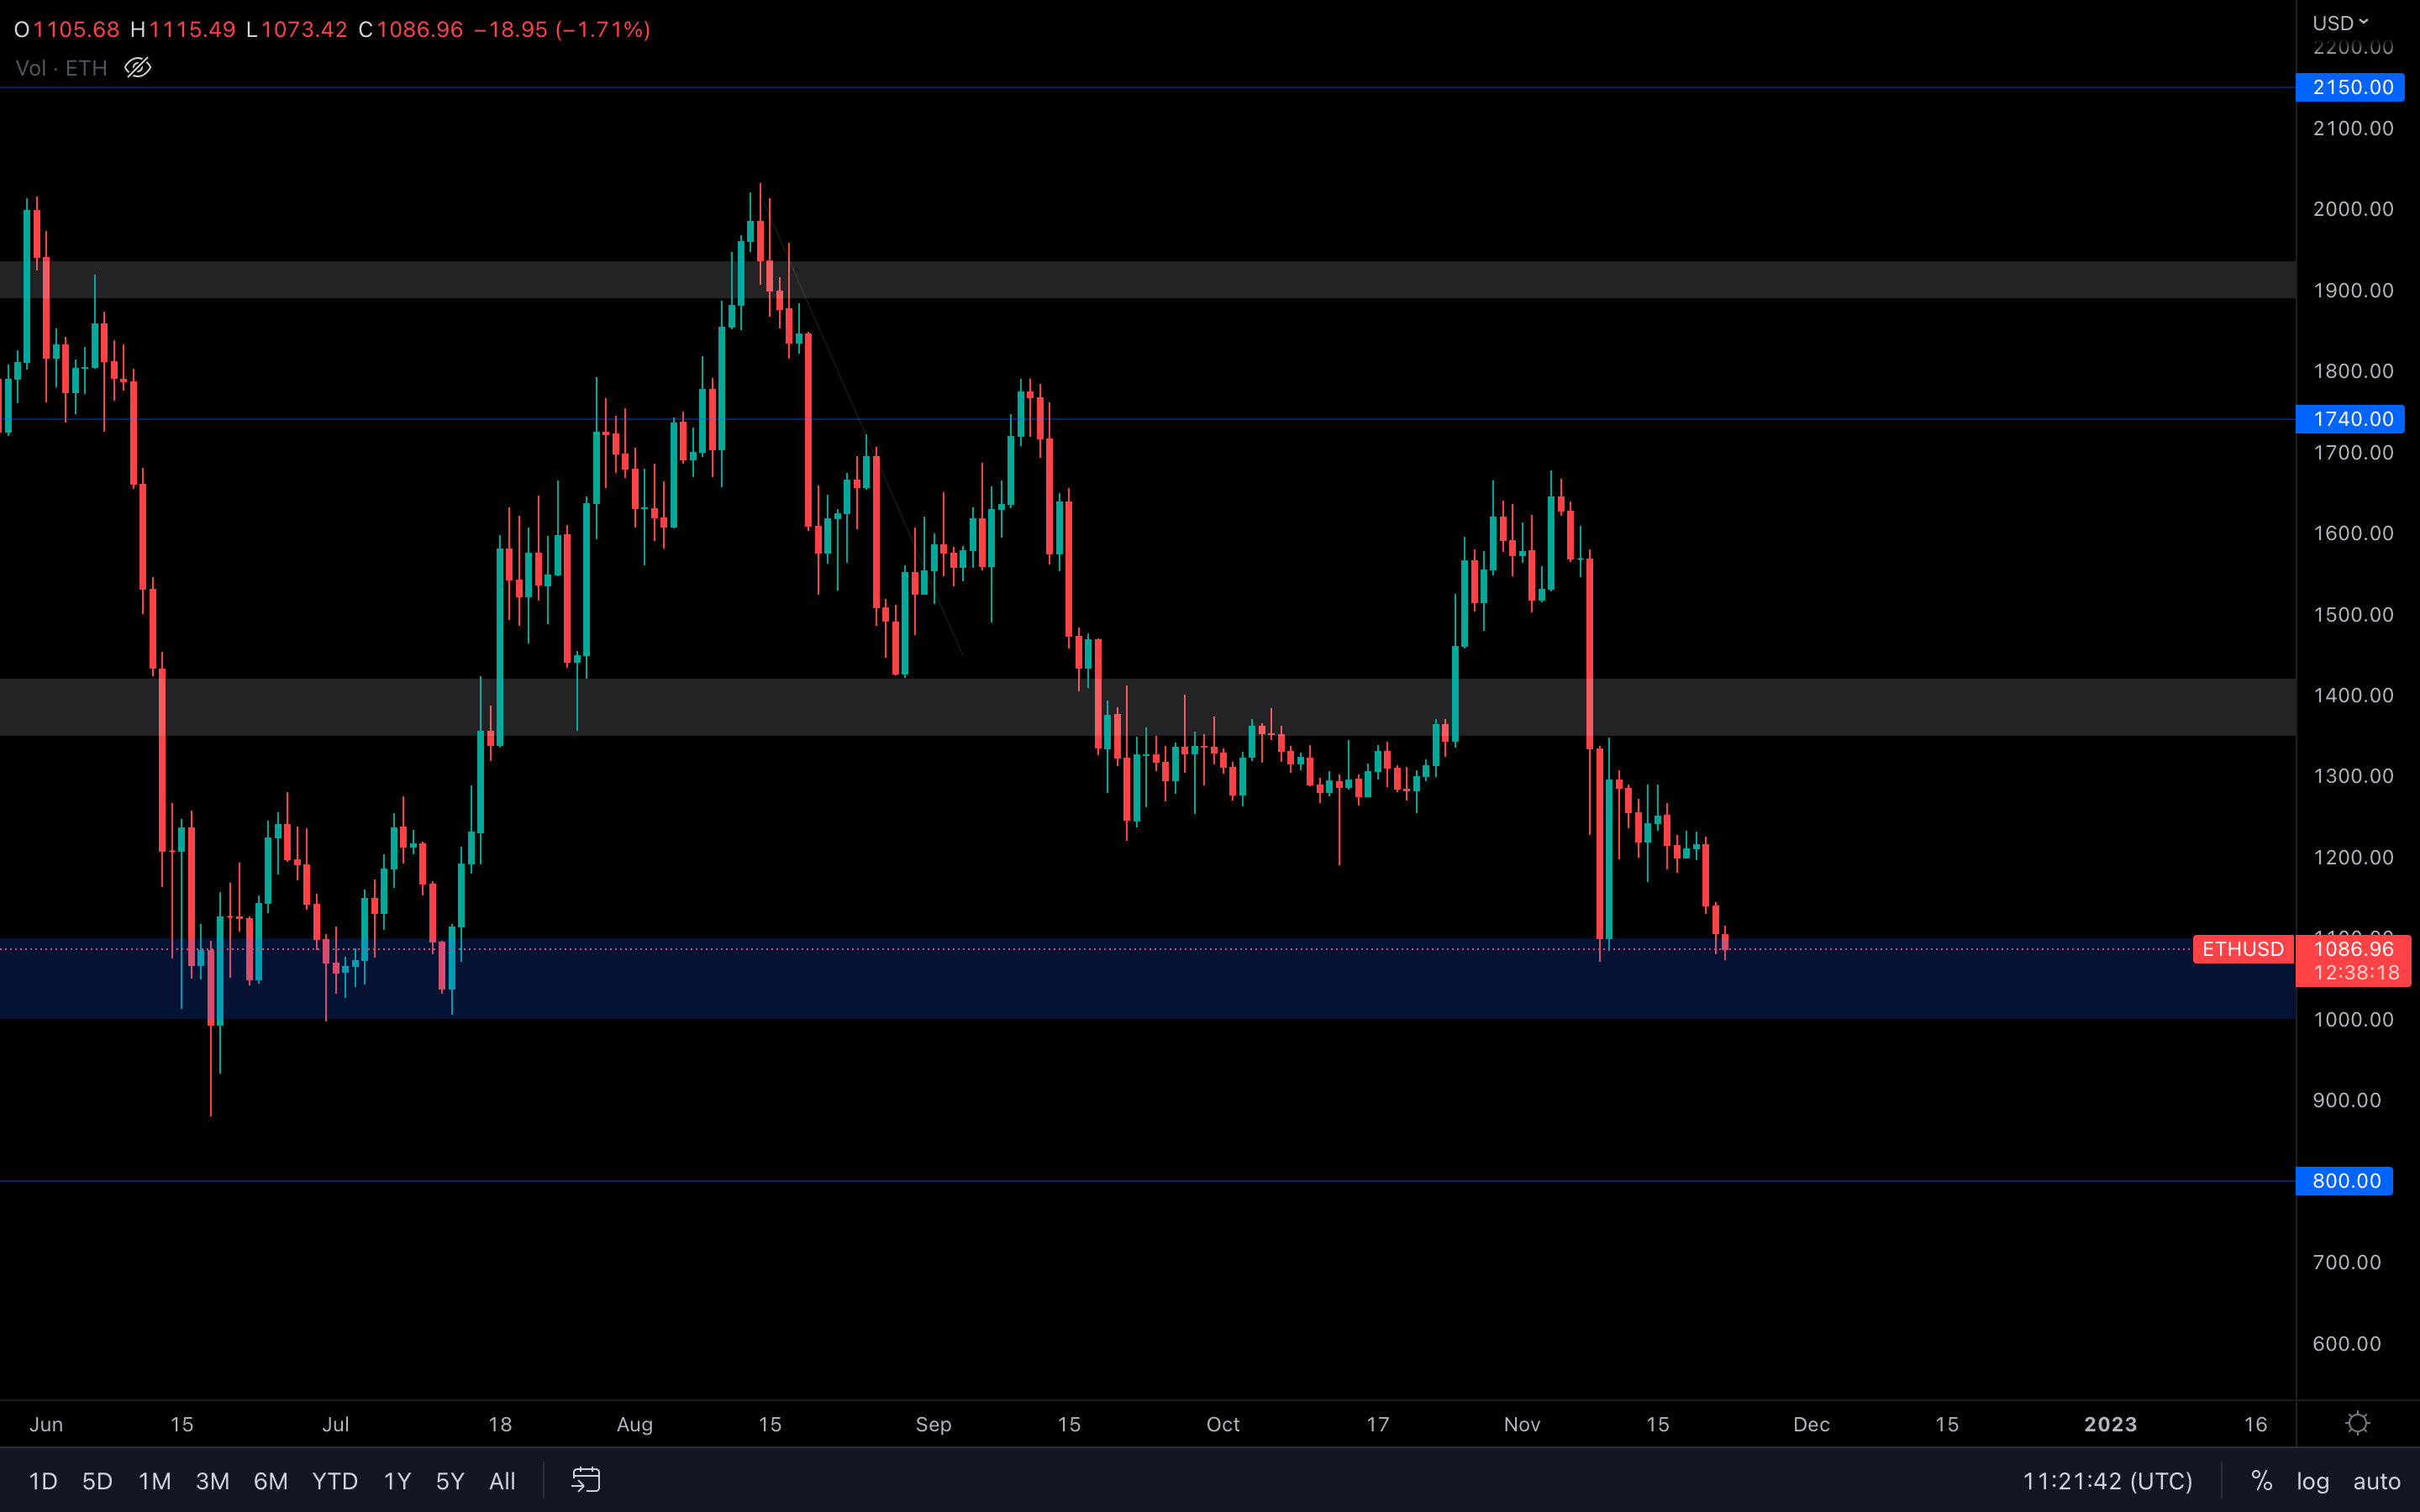 Ether is back in the $1100 - $1000 range and is currently testing its November low (registered almost two weeks ago). For now, Ether has $1100 as support - if/once that's taken out, we could potentially see a $1000 test shortly after.
It's uncertain if we could see a sub $1000 ETH this quickly, as the major selling pressure has mostly been taken out, and leverage has been flushed out, so only an unexpected event or piece of news could bring Ether under $1000. As long as $1100 holds, we could be also looking at a rise from here, most likely short-lived before even hitting $1200.
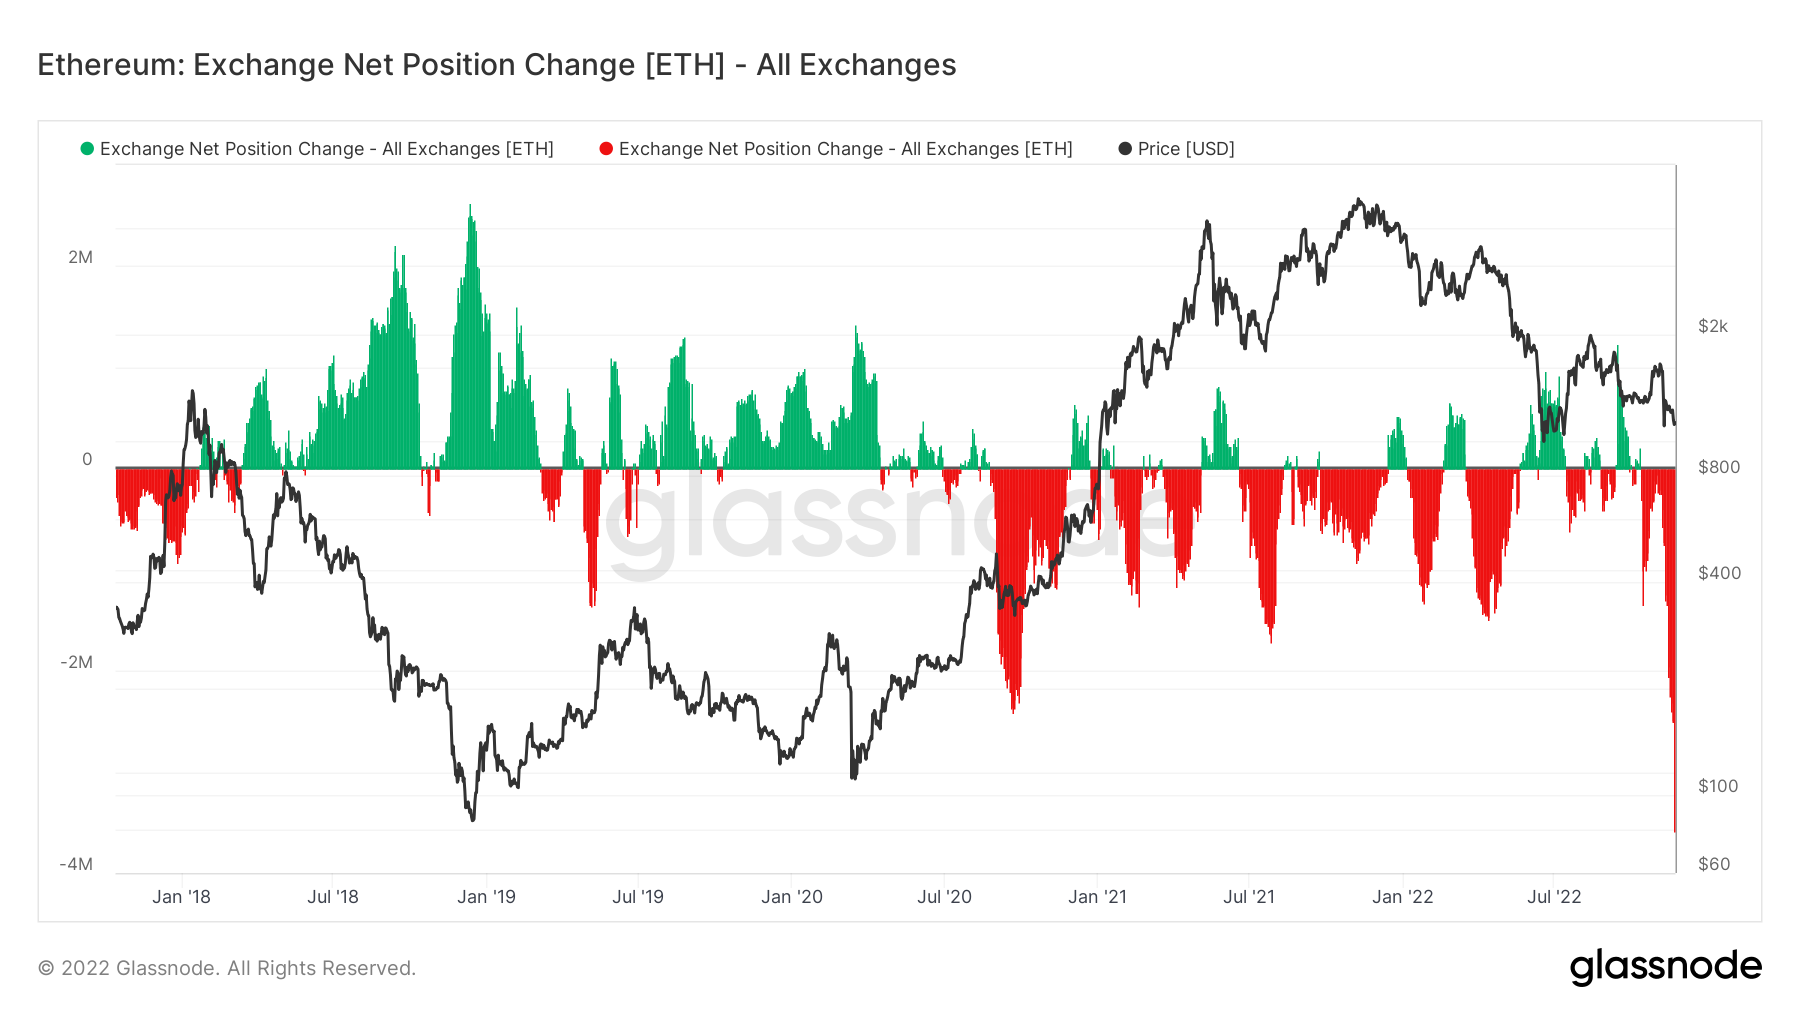
Metric 1 – Exchange Net Position Change
If we look at the same metric but for Ether, we can see that it’s a very similar situation. Investors have been driven to self-custody due to the distrust amongst Exchanges.
Ether – Exchange Net Position Change
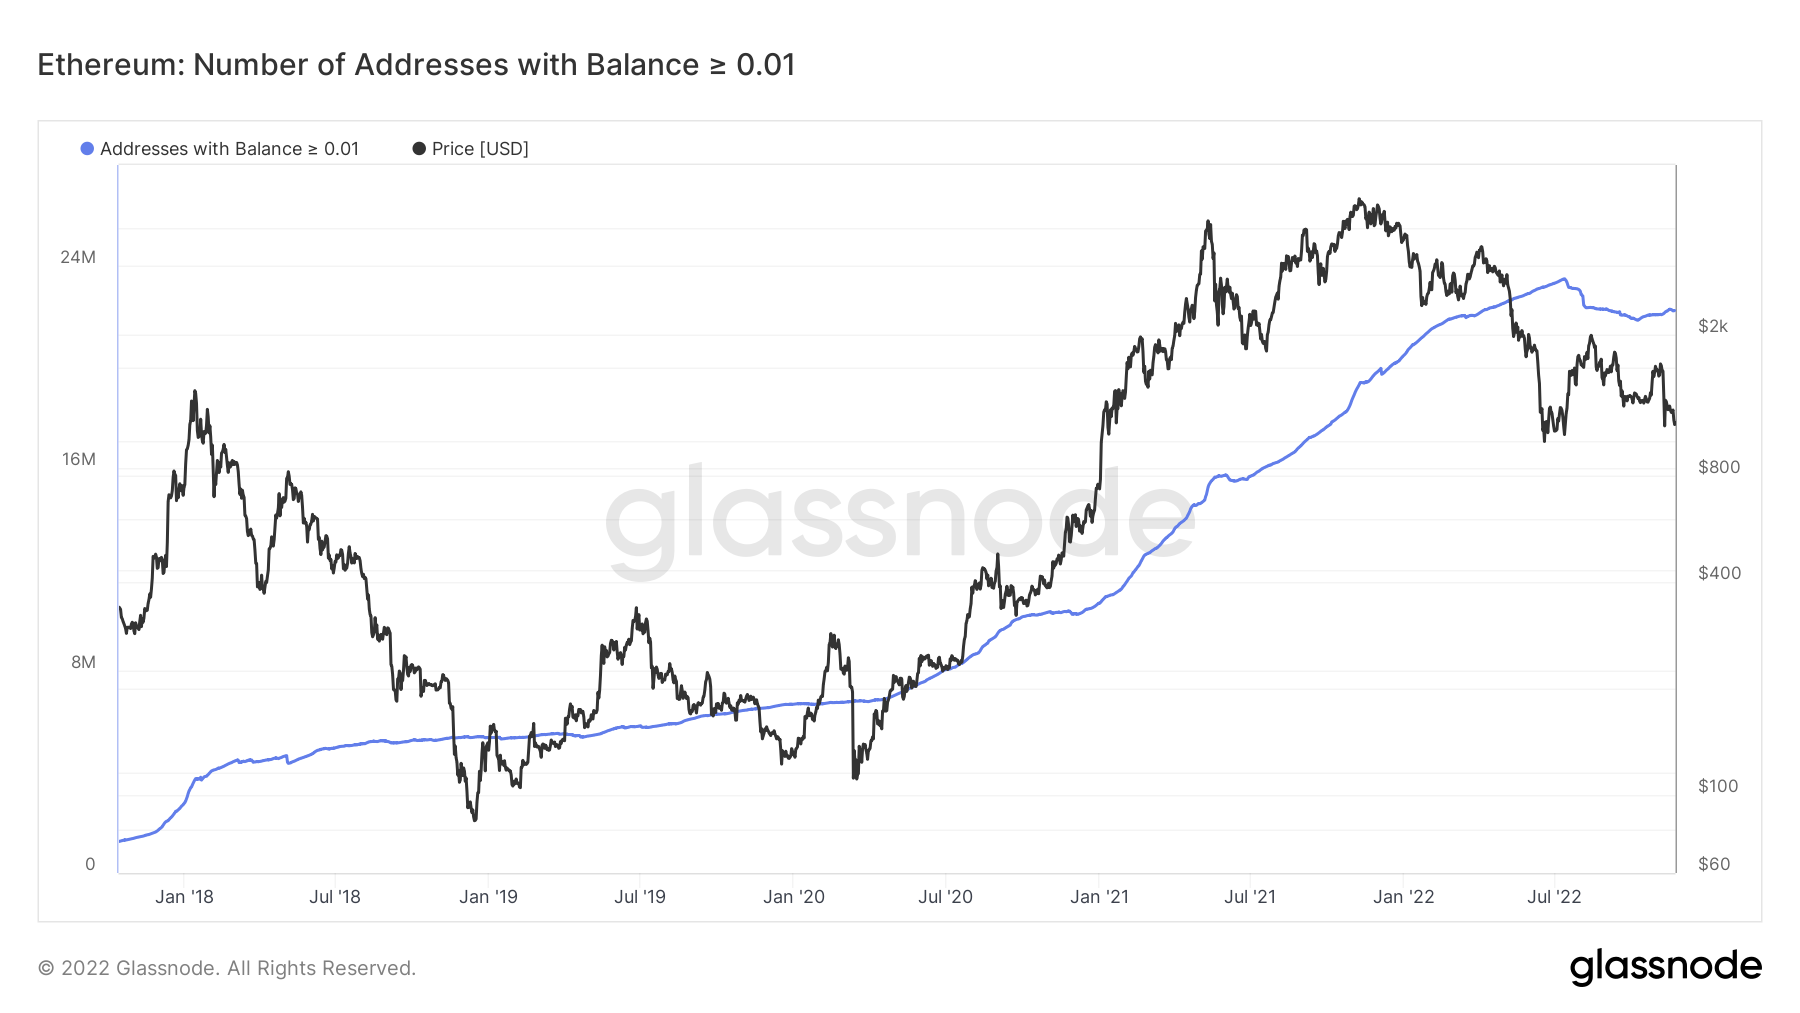
 Metric 2 – Addresses
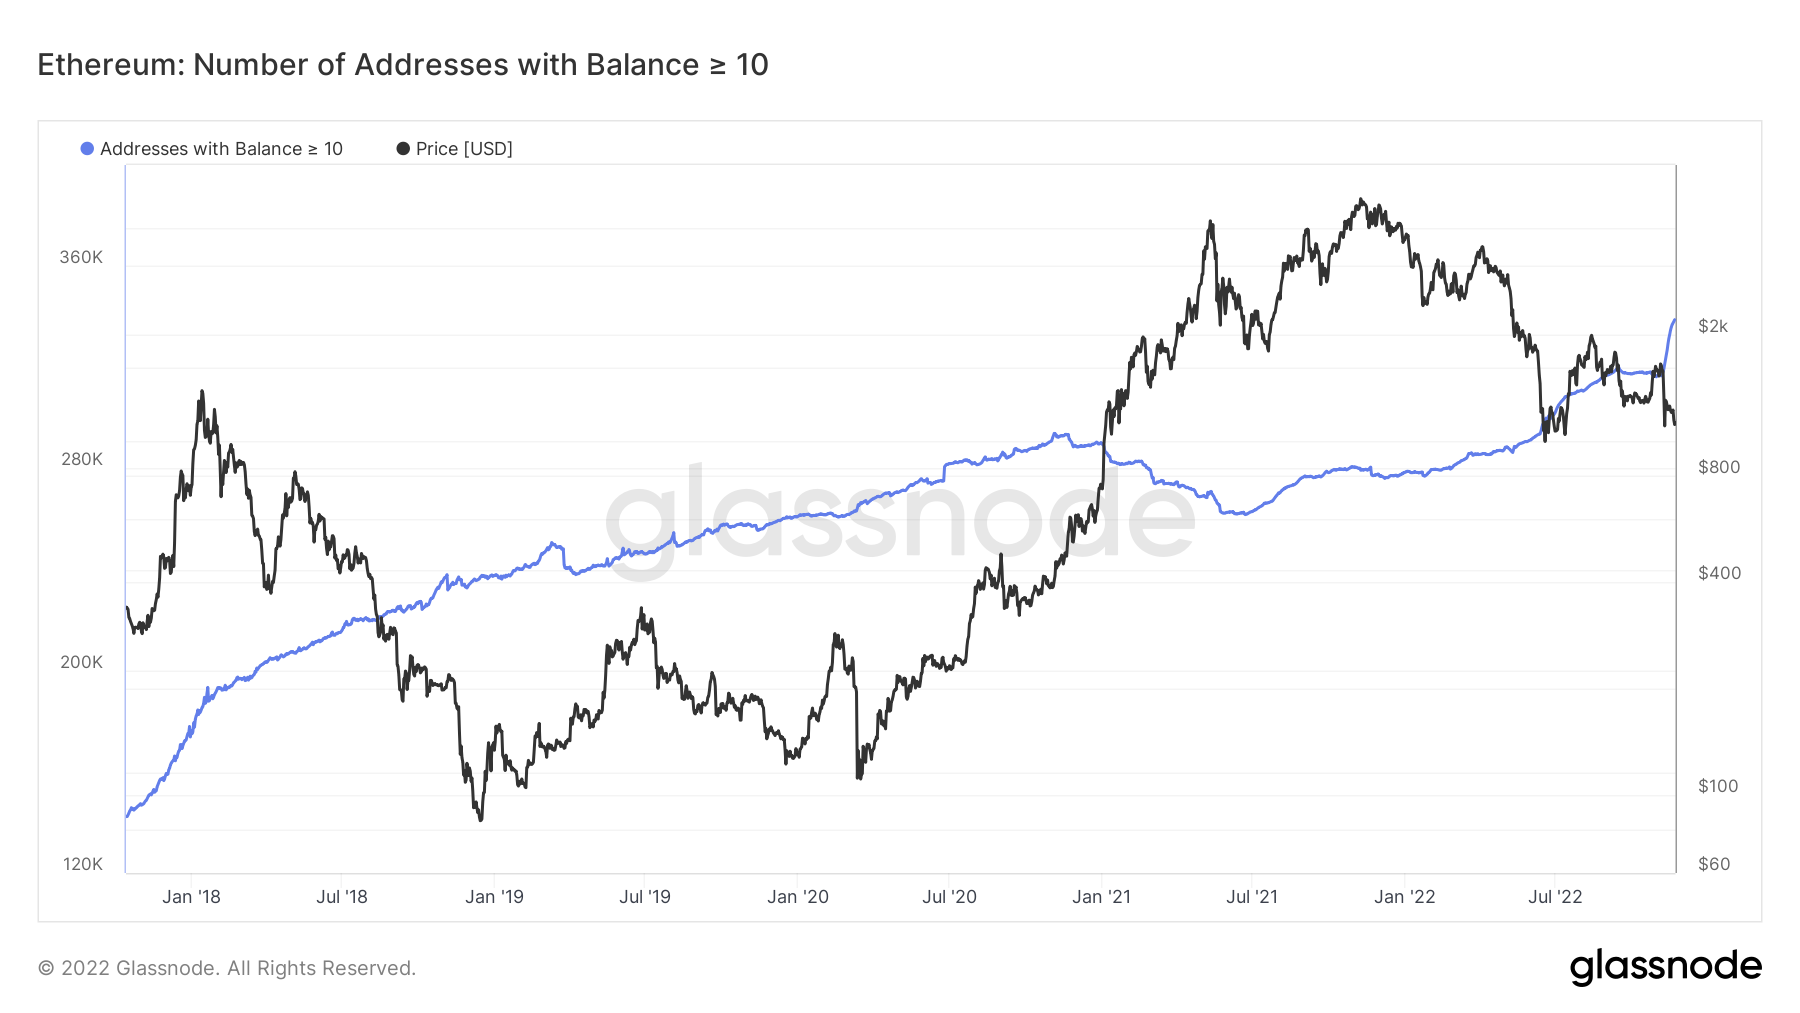
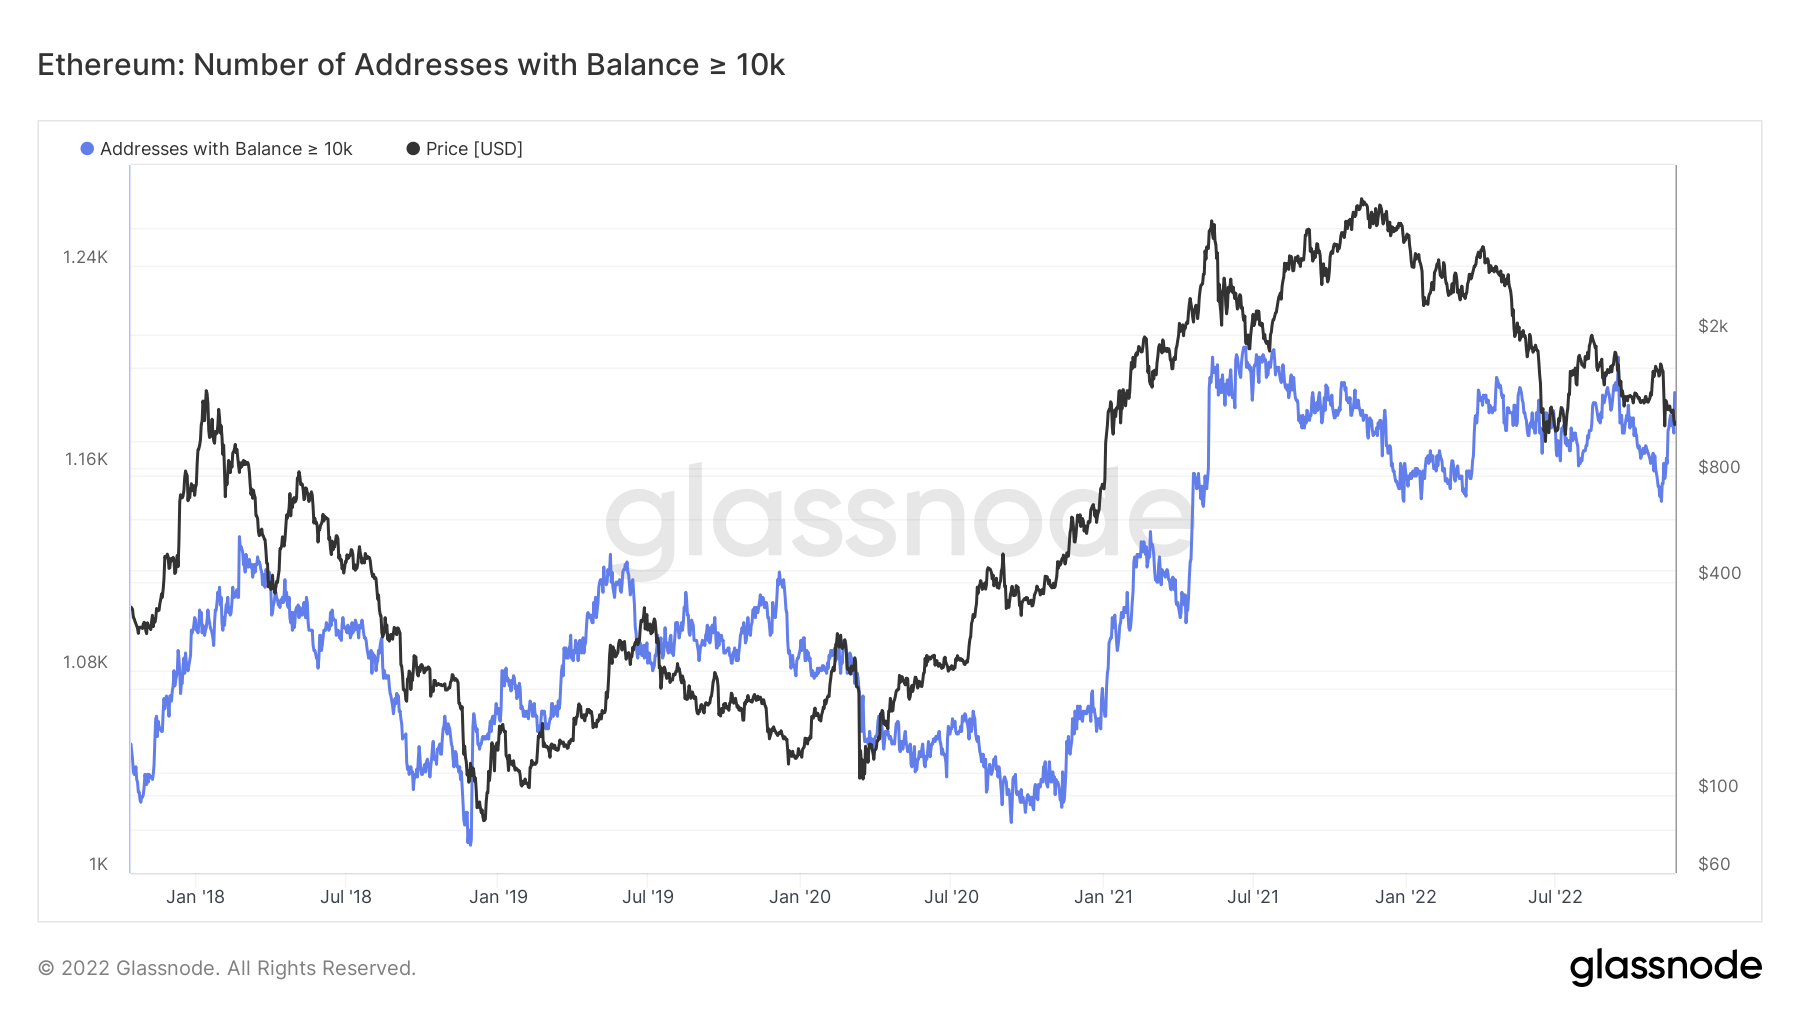
When looking at the Addresses metrics but for Ether, we can see that the smallest wallet cohorts have still risked-on but not aggressively, whereas in the majority, the larger wallet cohorts have risked on aggressively as prices have declined.
Ether – Addresses with Balance > 0.01 Ether
 Ether – Addresses with Balance > 10 Ether
 Ether – Addresses with Balance > 10,000 Ether
DOT
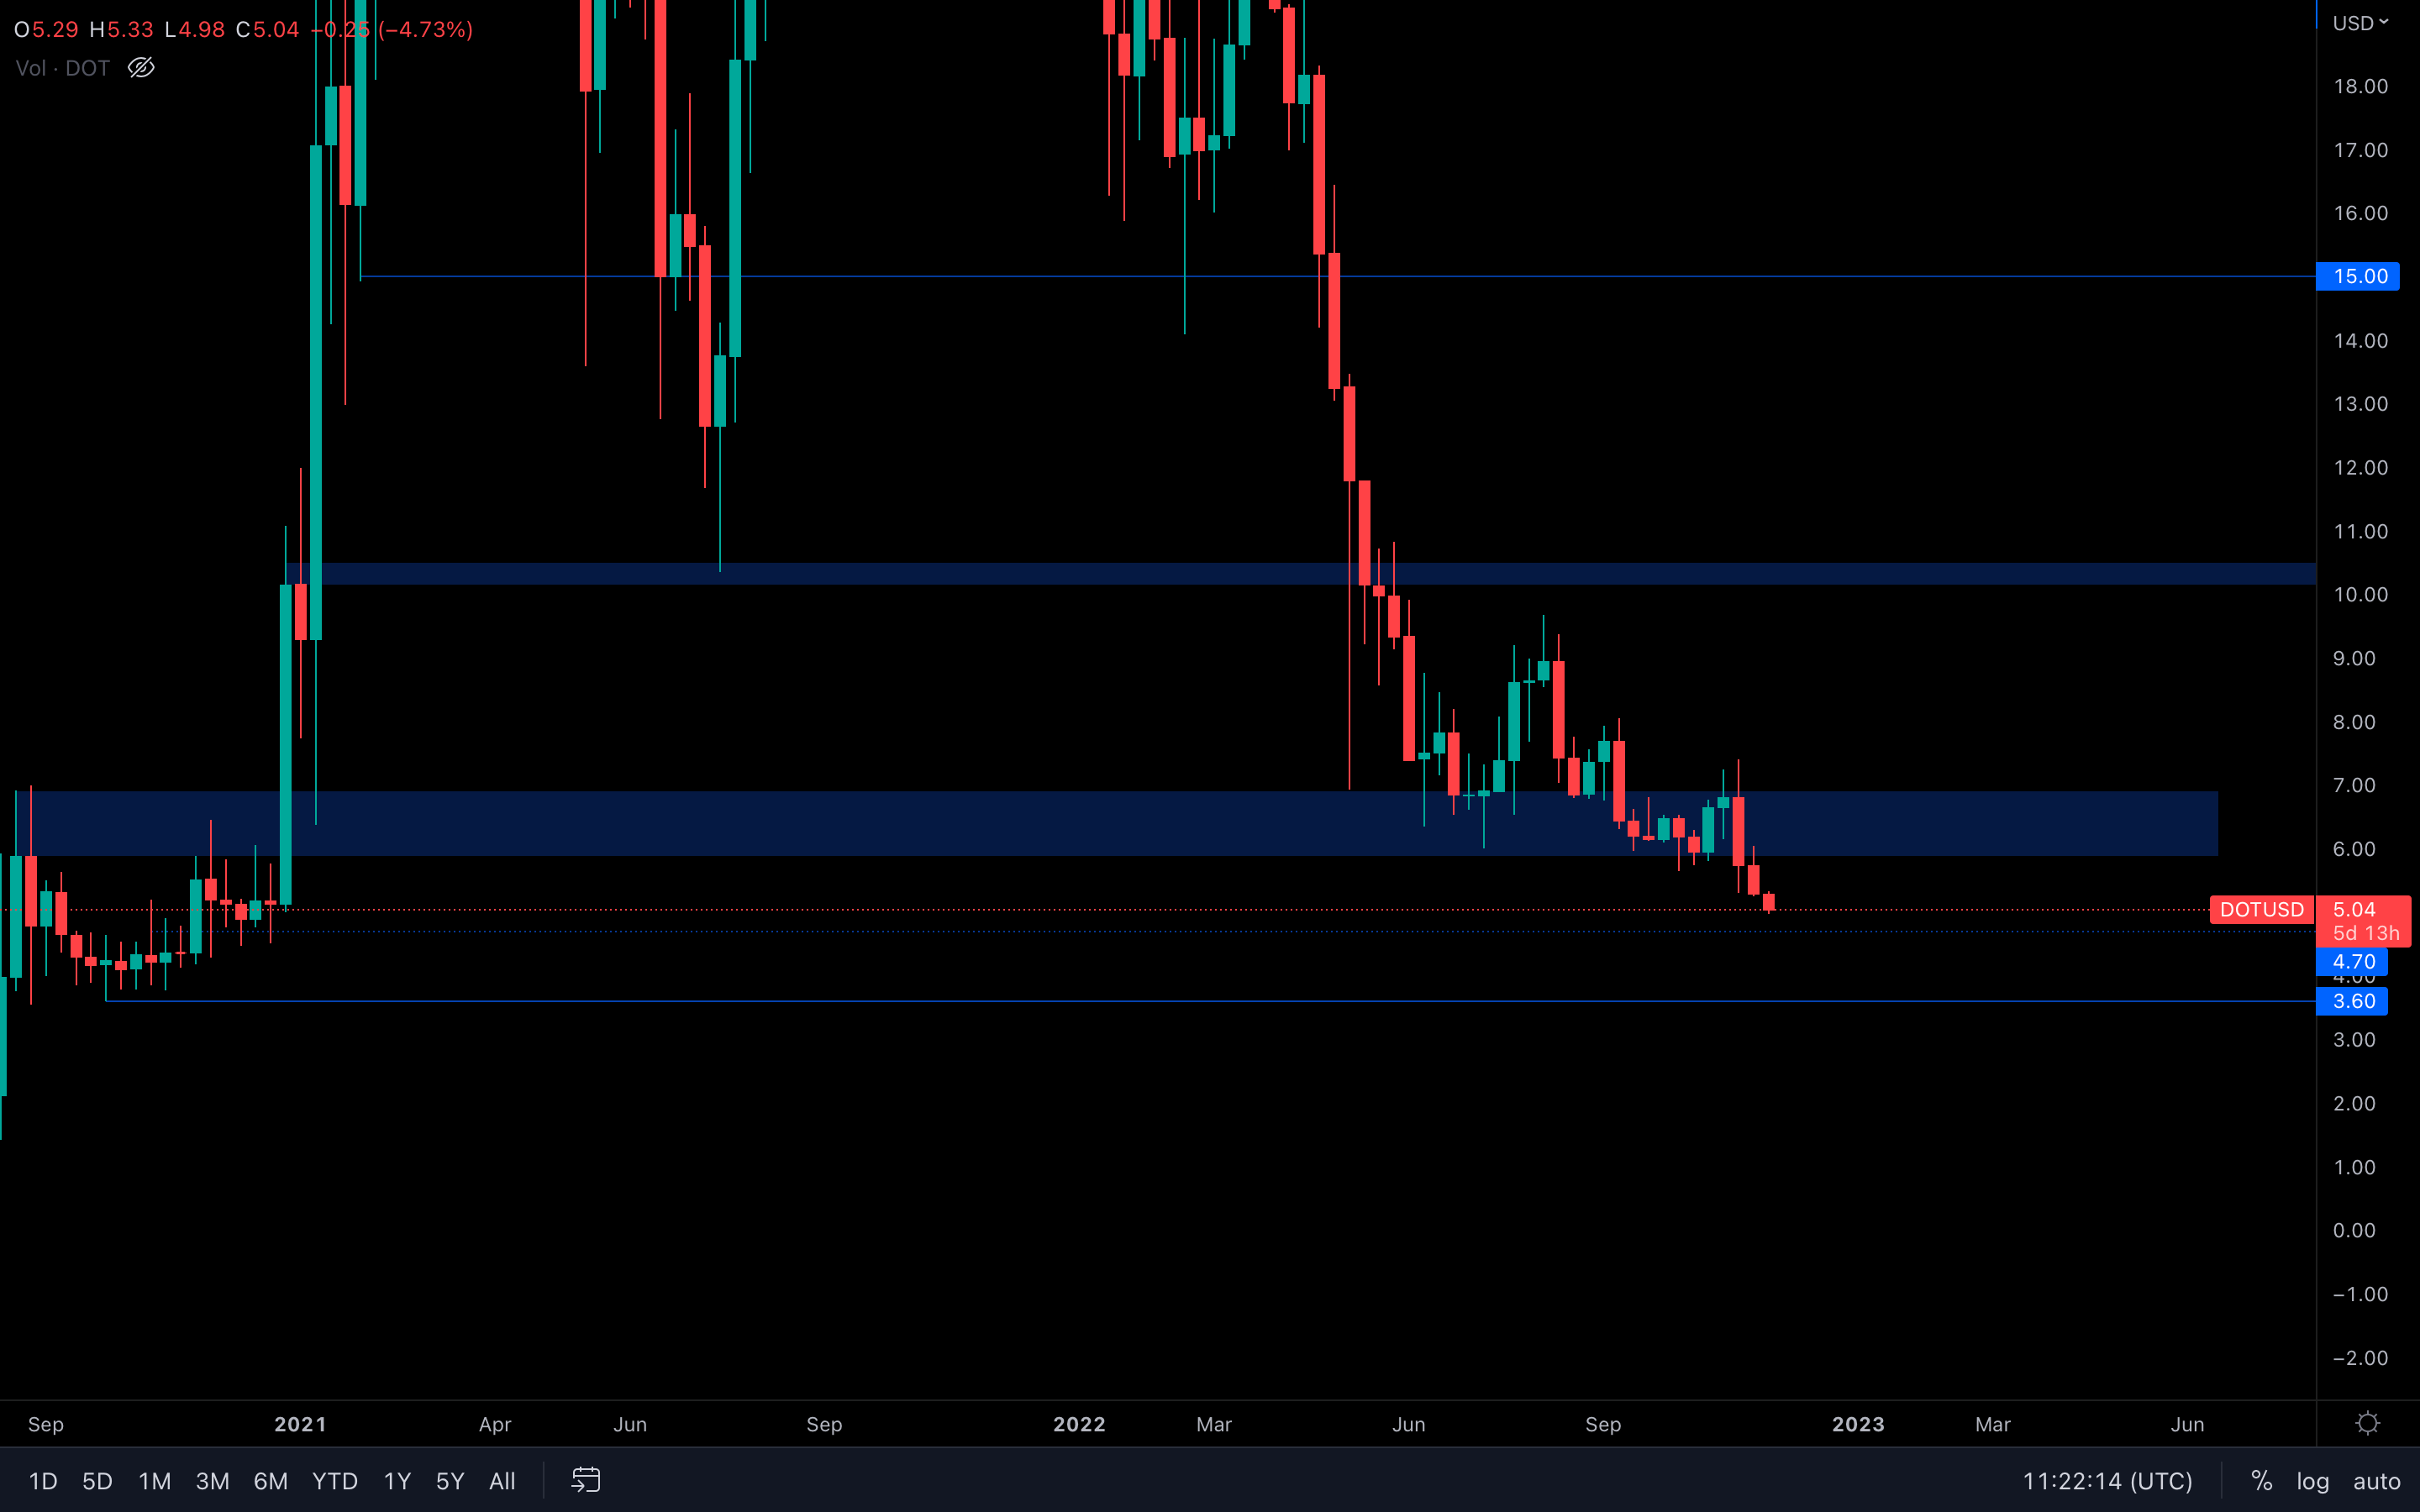 $6 was lost, and $4.70 was DOT's next target.
The $4.70 target isn't changed, DOT will most likely test this level soon, although a proper $6 retest isn't out of question either.
SNX
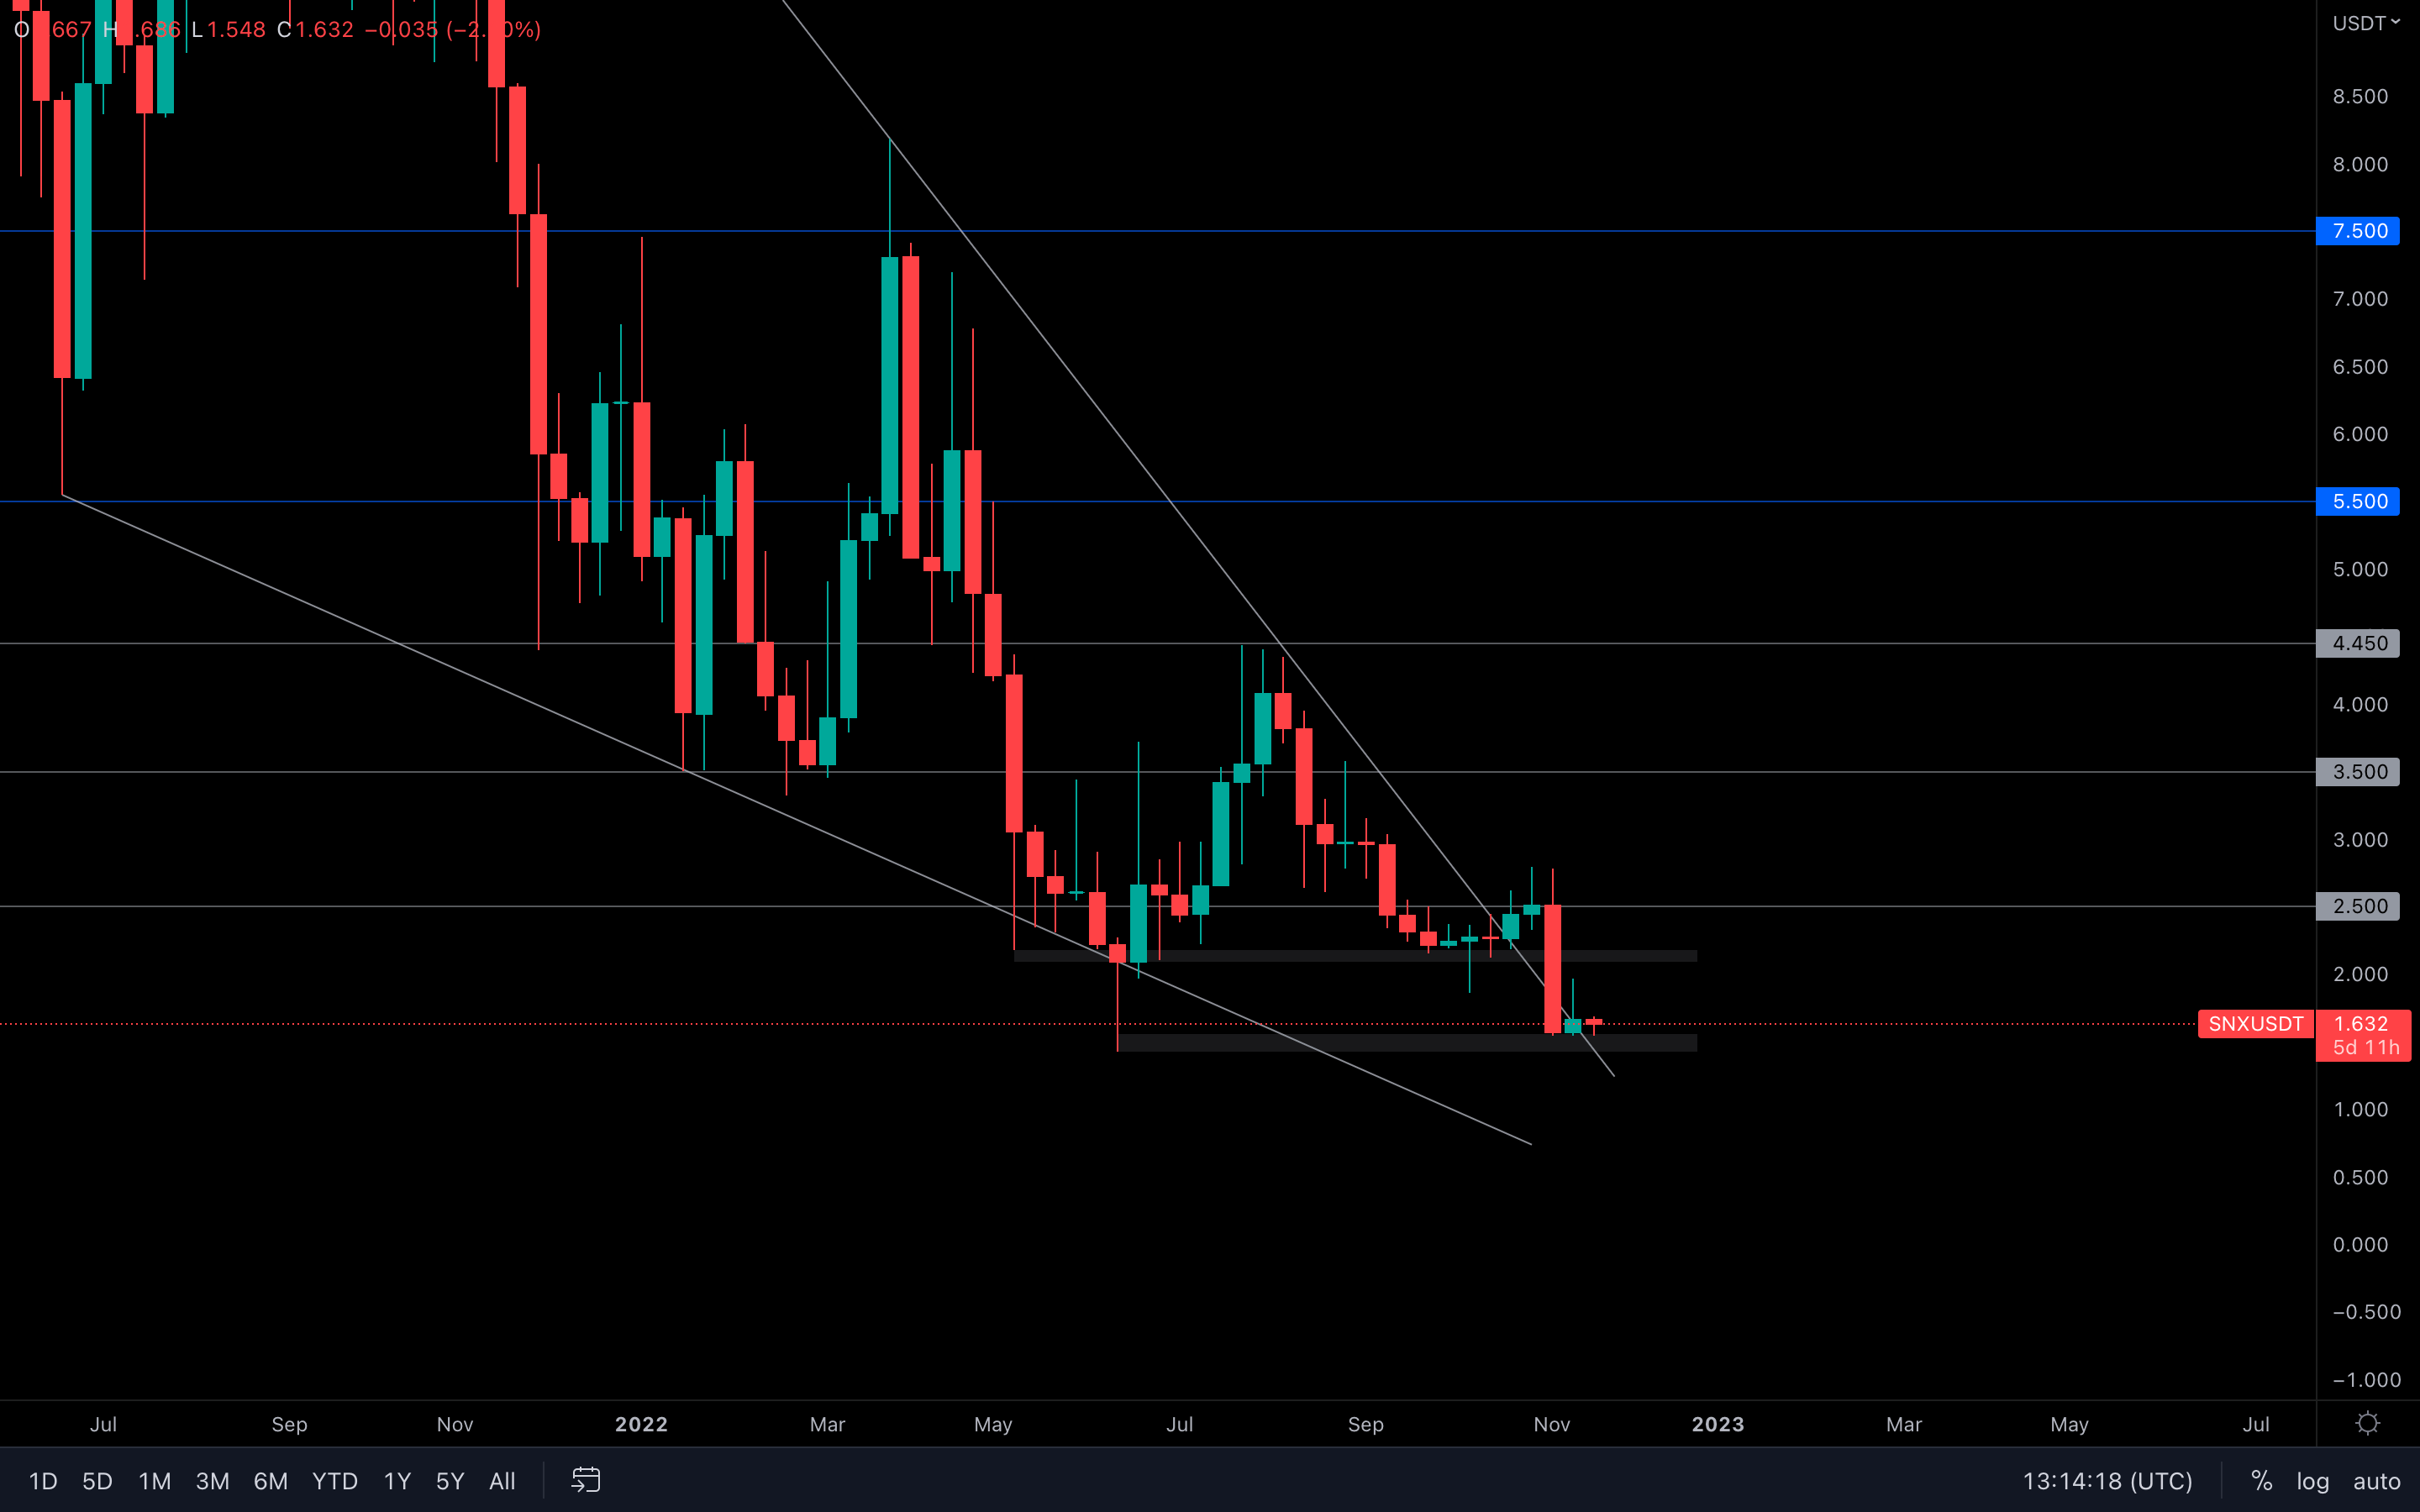 Last week, we can see that a particular candle was registered - an inverse hammer candlestick. For those that are not familiar with this candlestick pattern, it can be interpreted as a bullish signal, indicating a potential rise is on the horizon.
I'm a price action guy, and candlesticks are crucial in identifying where prices might go next. Because of that, I will go out on a limb here and assume we are going to retest $2 this week, or maybe the next. Keep in mind that we do have support just under SNX's current price, so the possibility is reinforced. However, it is not guaranteed - always be prepared for all scenarios.
RUNE
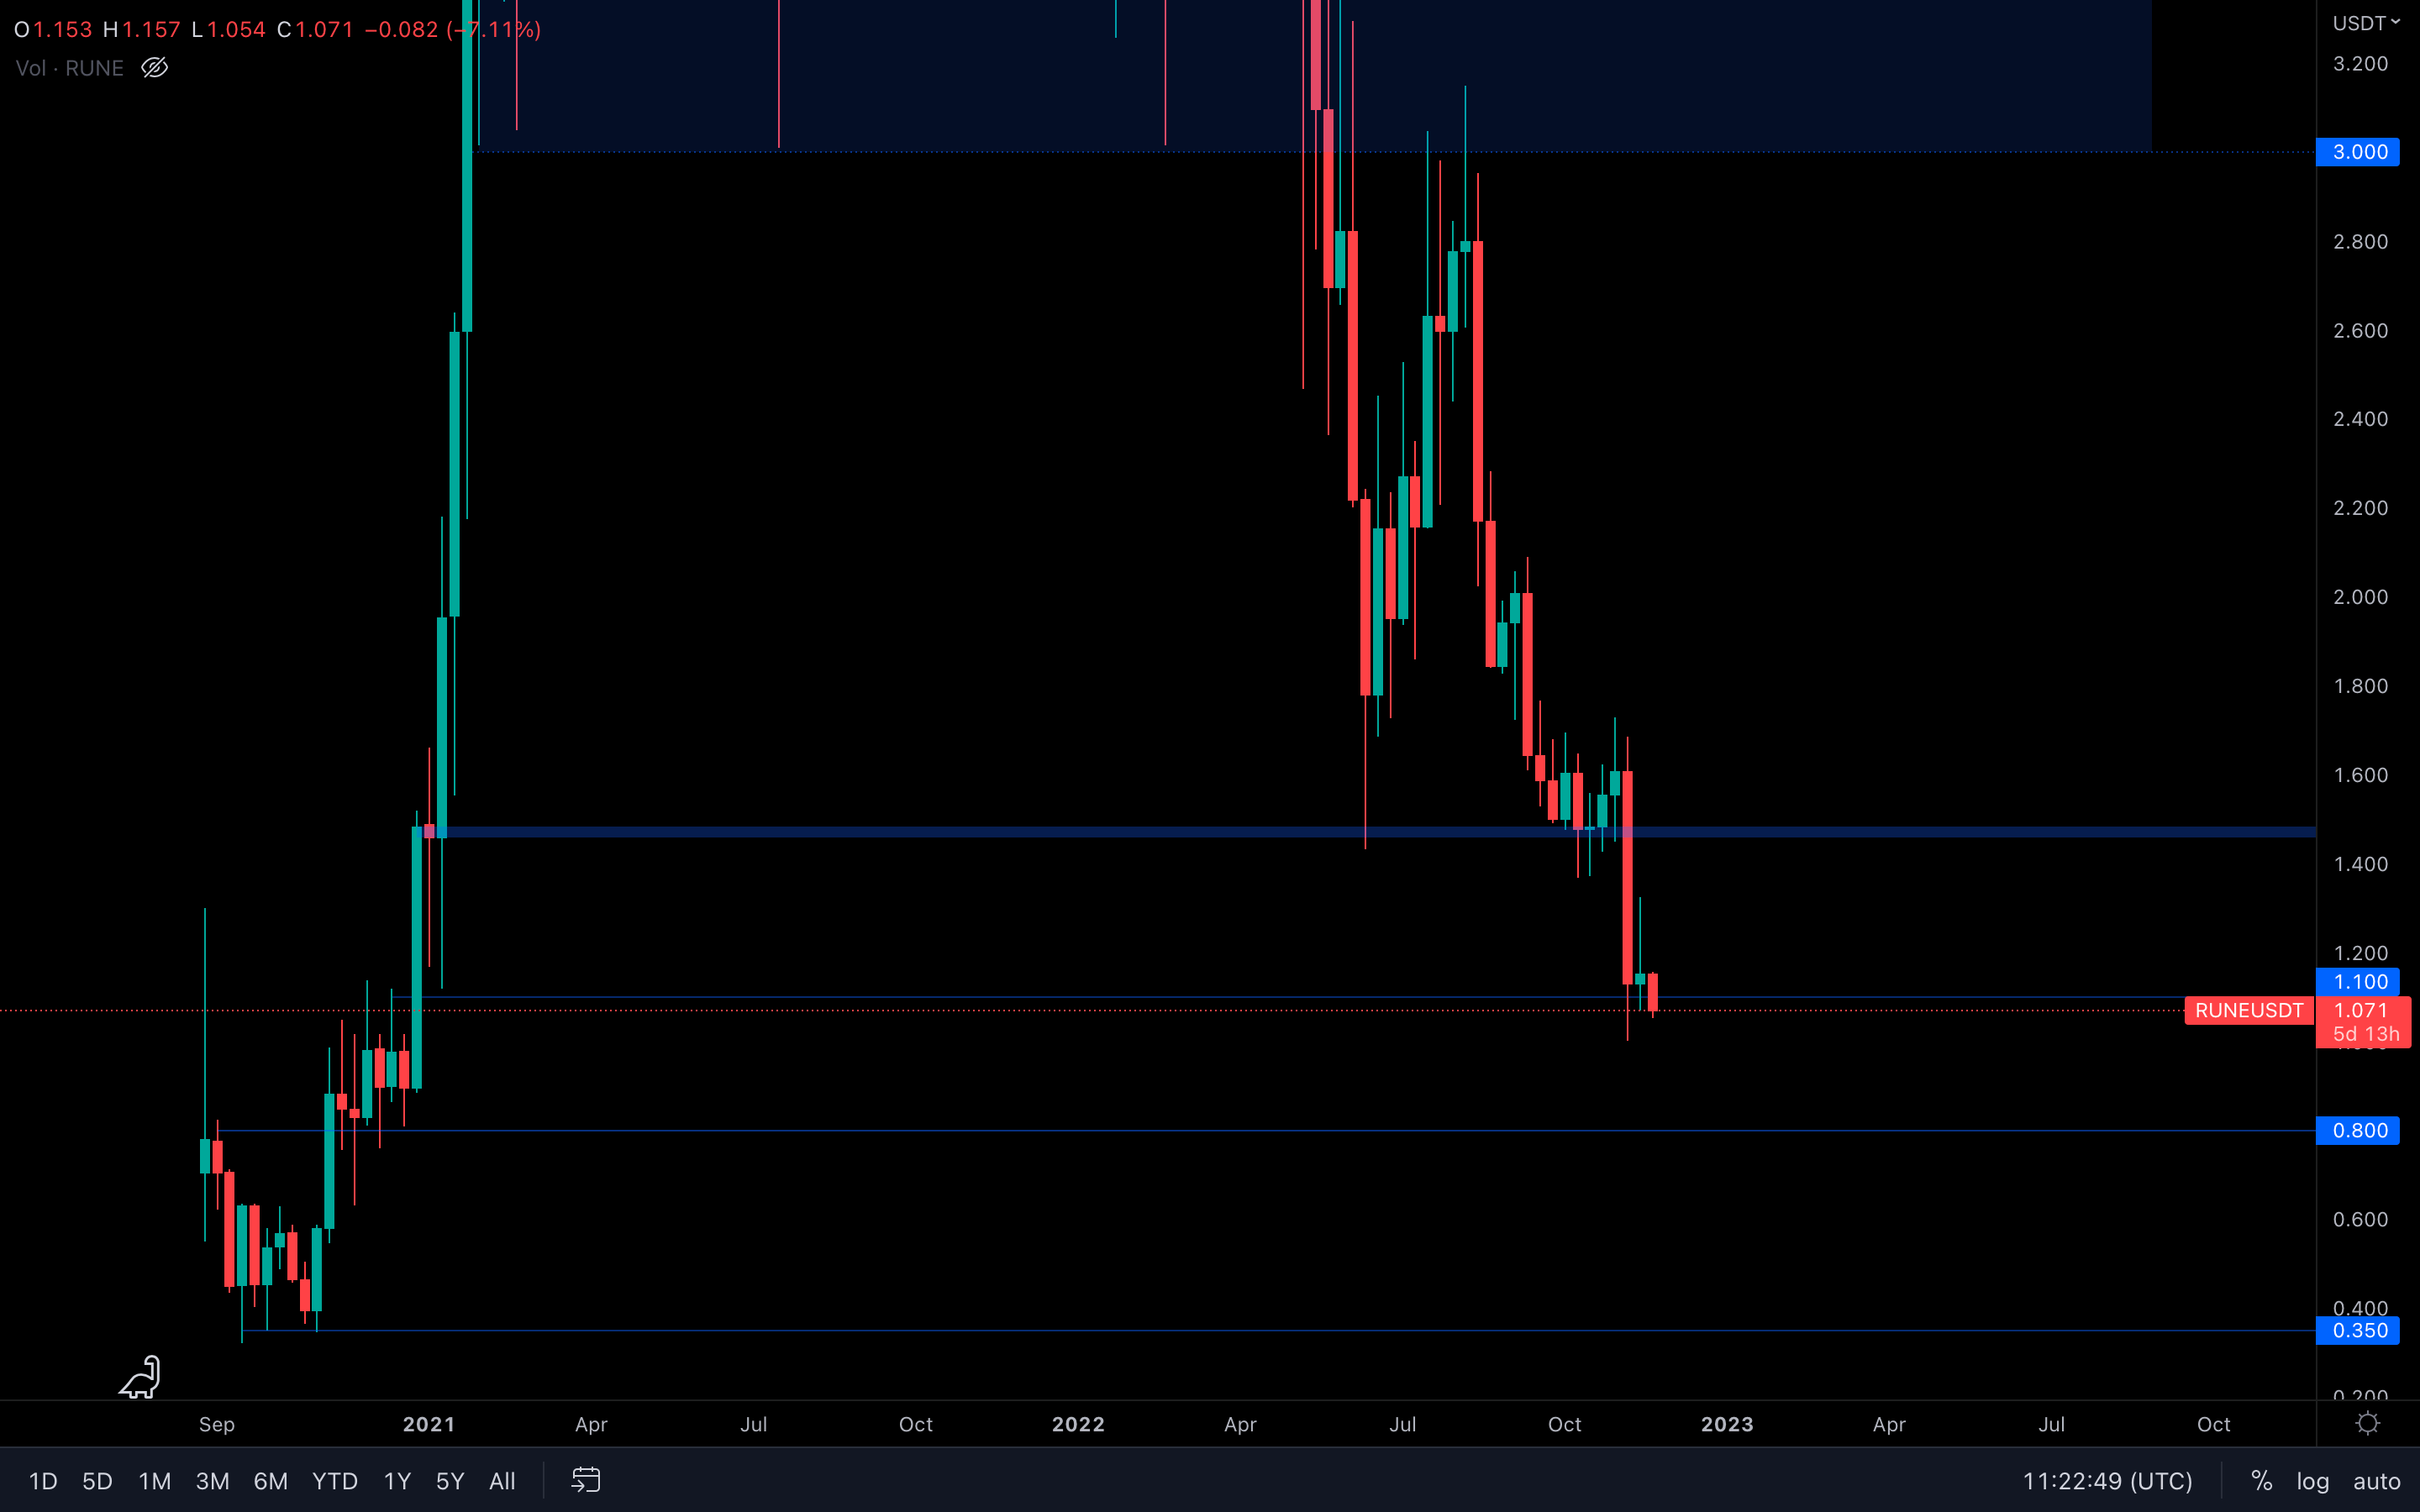 Although RUNE has closed above its current support level ($1.10) last week, we can still see that the selling pressure is not quite over. A weekly loss of $1.10 will put $0.80 as RUNE's next target, which for now remains uncertain as both Bitcoin and Ether are above support.
We'll have to wait and see how this week unfolds, but I'd say RUNE will likely close above $1.10 once more.
SOL
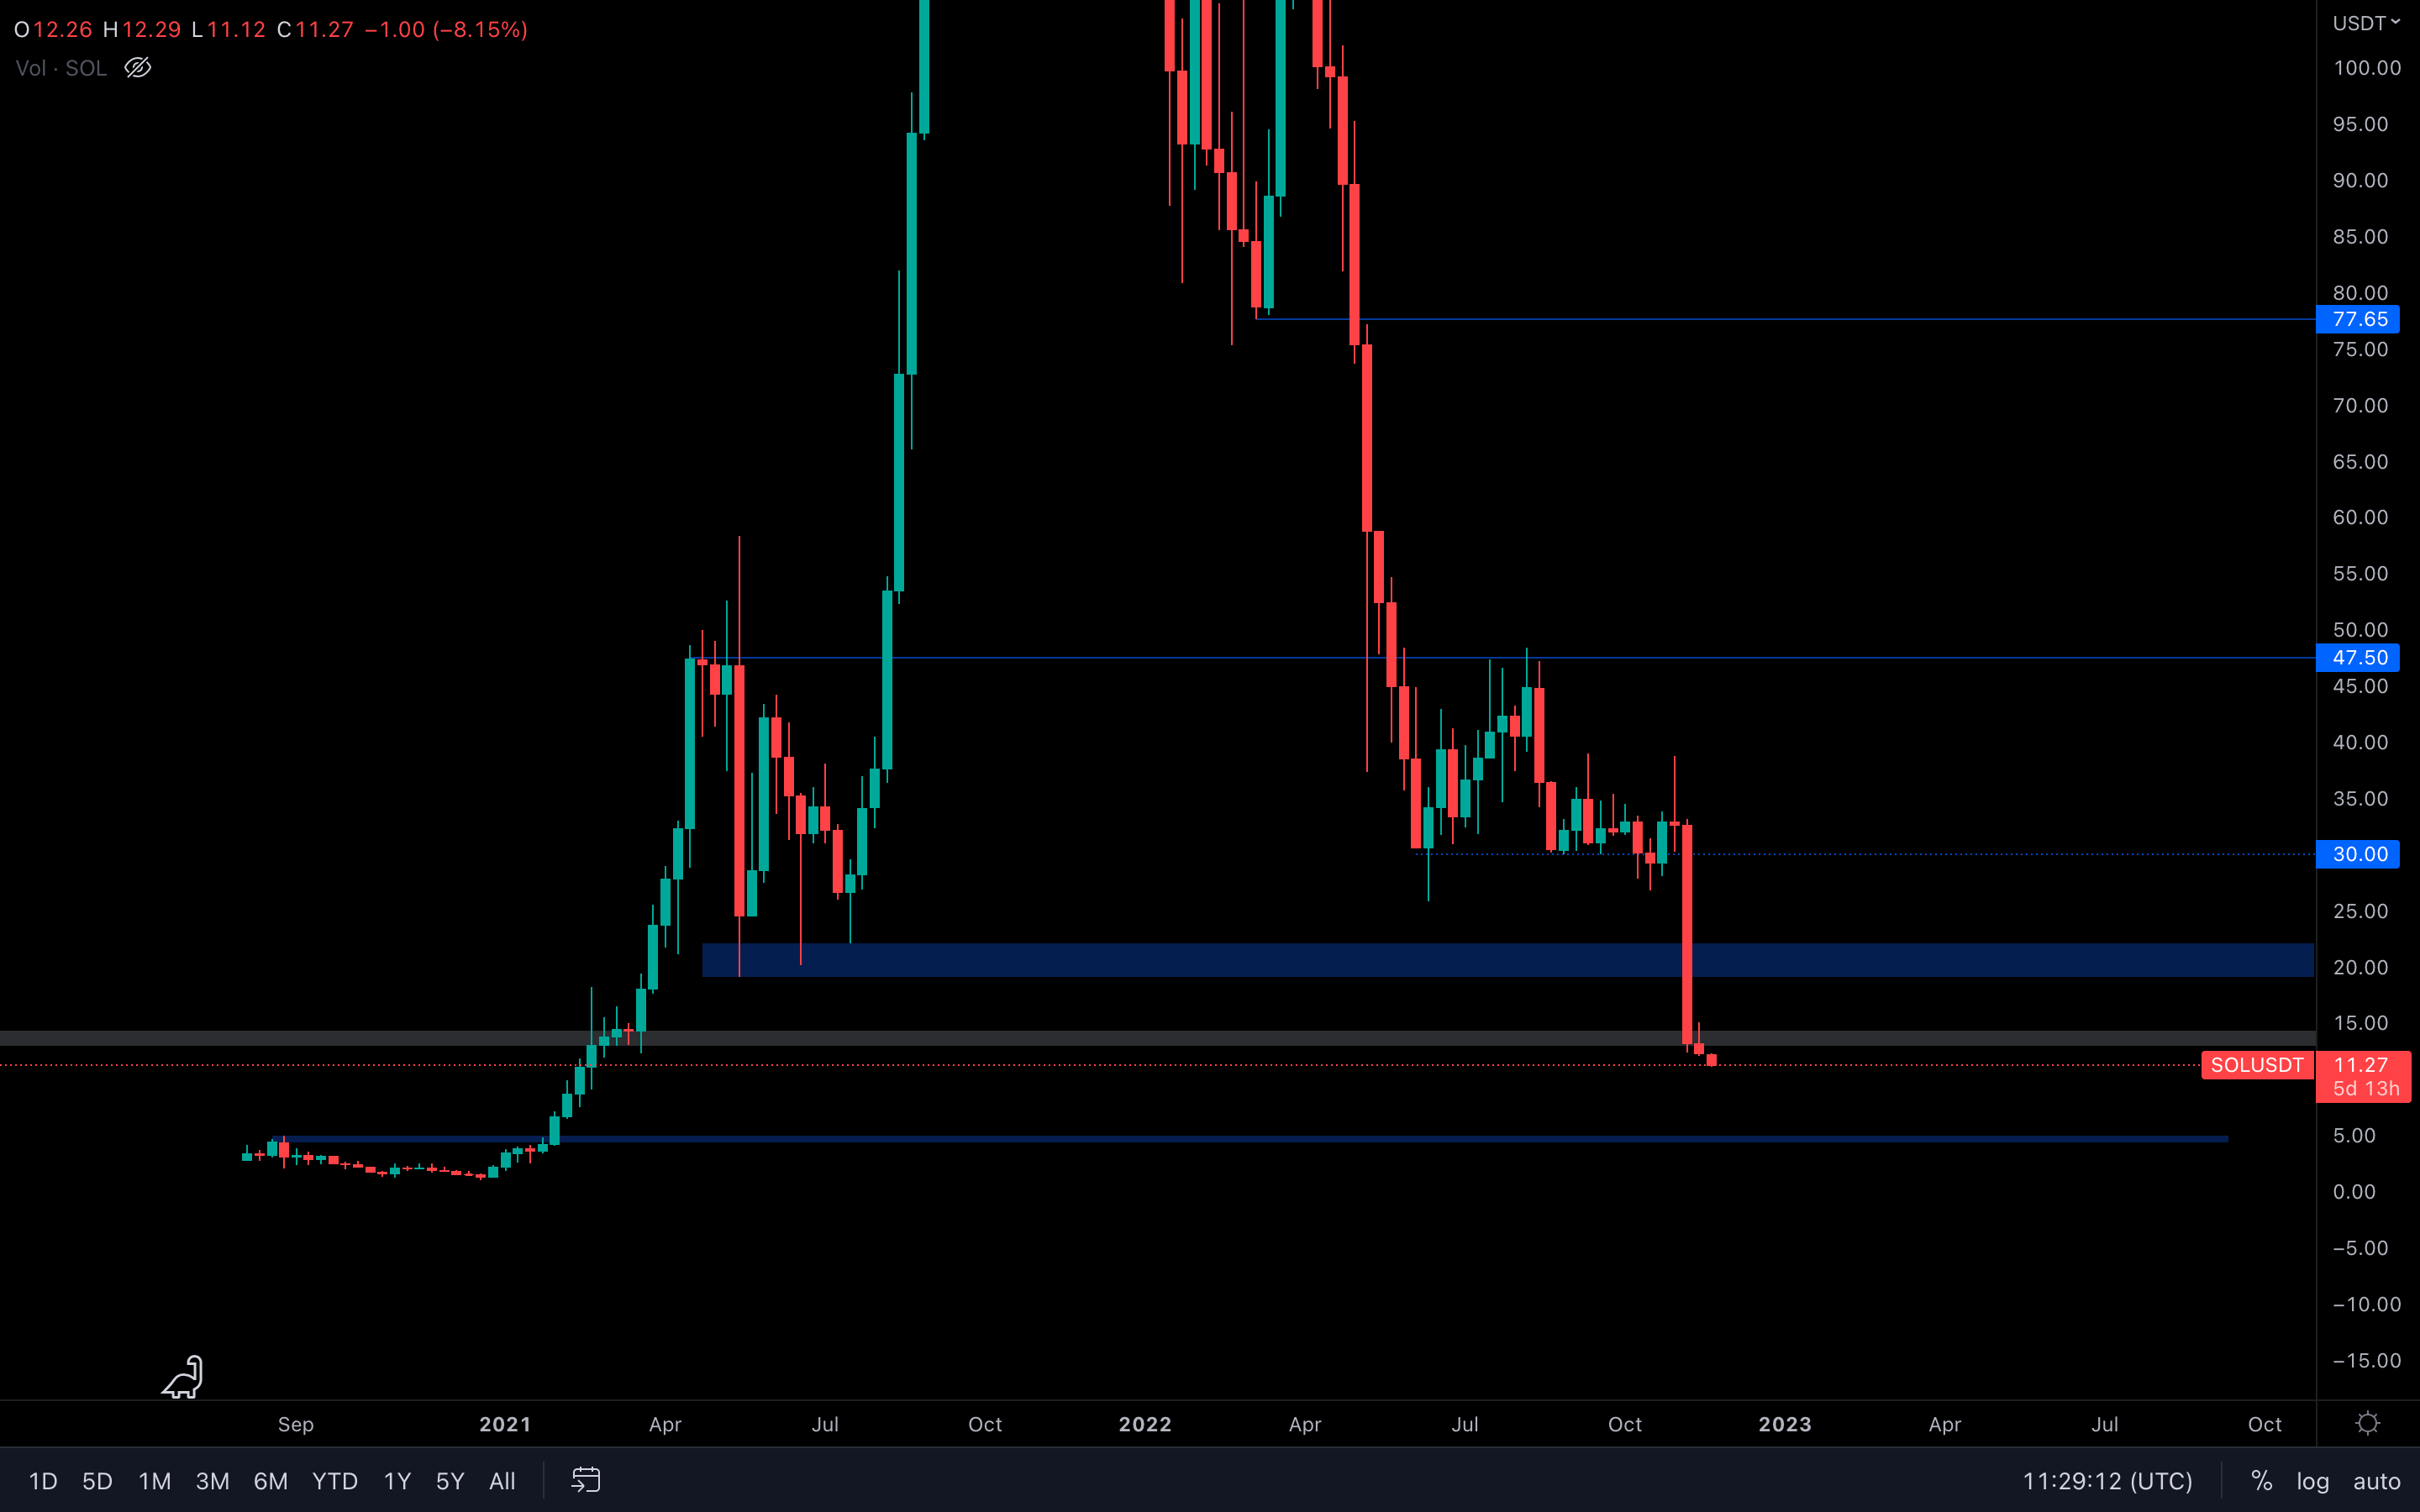 Apparently, charts do hold the power of making someone cry. 😟
What an unexpected performance for SOL, and all due to one event. It's actually crazy how much projects can be affected if given the wrong circumstances, especially when the cause doesn't even involve SOL's fundamental values.
SOL has now lost its $13 - $14 support area after closing under $13 last week. There's no major level other than $5, which from a technical standpoint is completely accurate - SOL is now on a path toward $5 unless the asset can reclaim $13 by closing a weekly candle above it.
This is a scenario in which fundamentals are worth more than technicals, so keeping an open eye on the Alameda situation is absolutely necessary for all SOL holders.
SRM
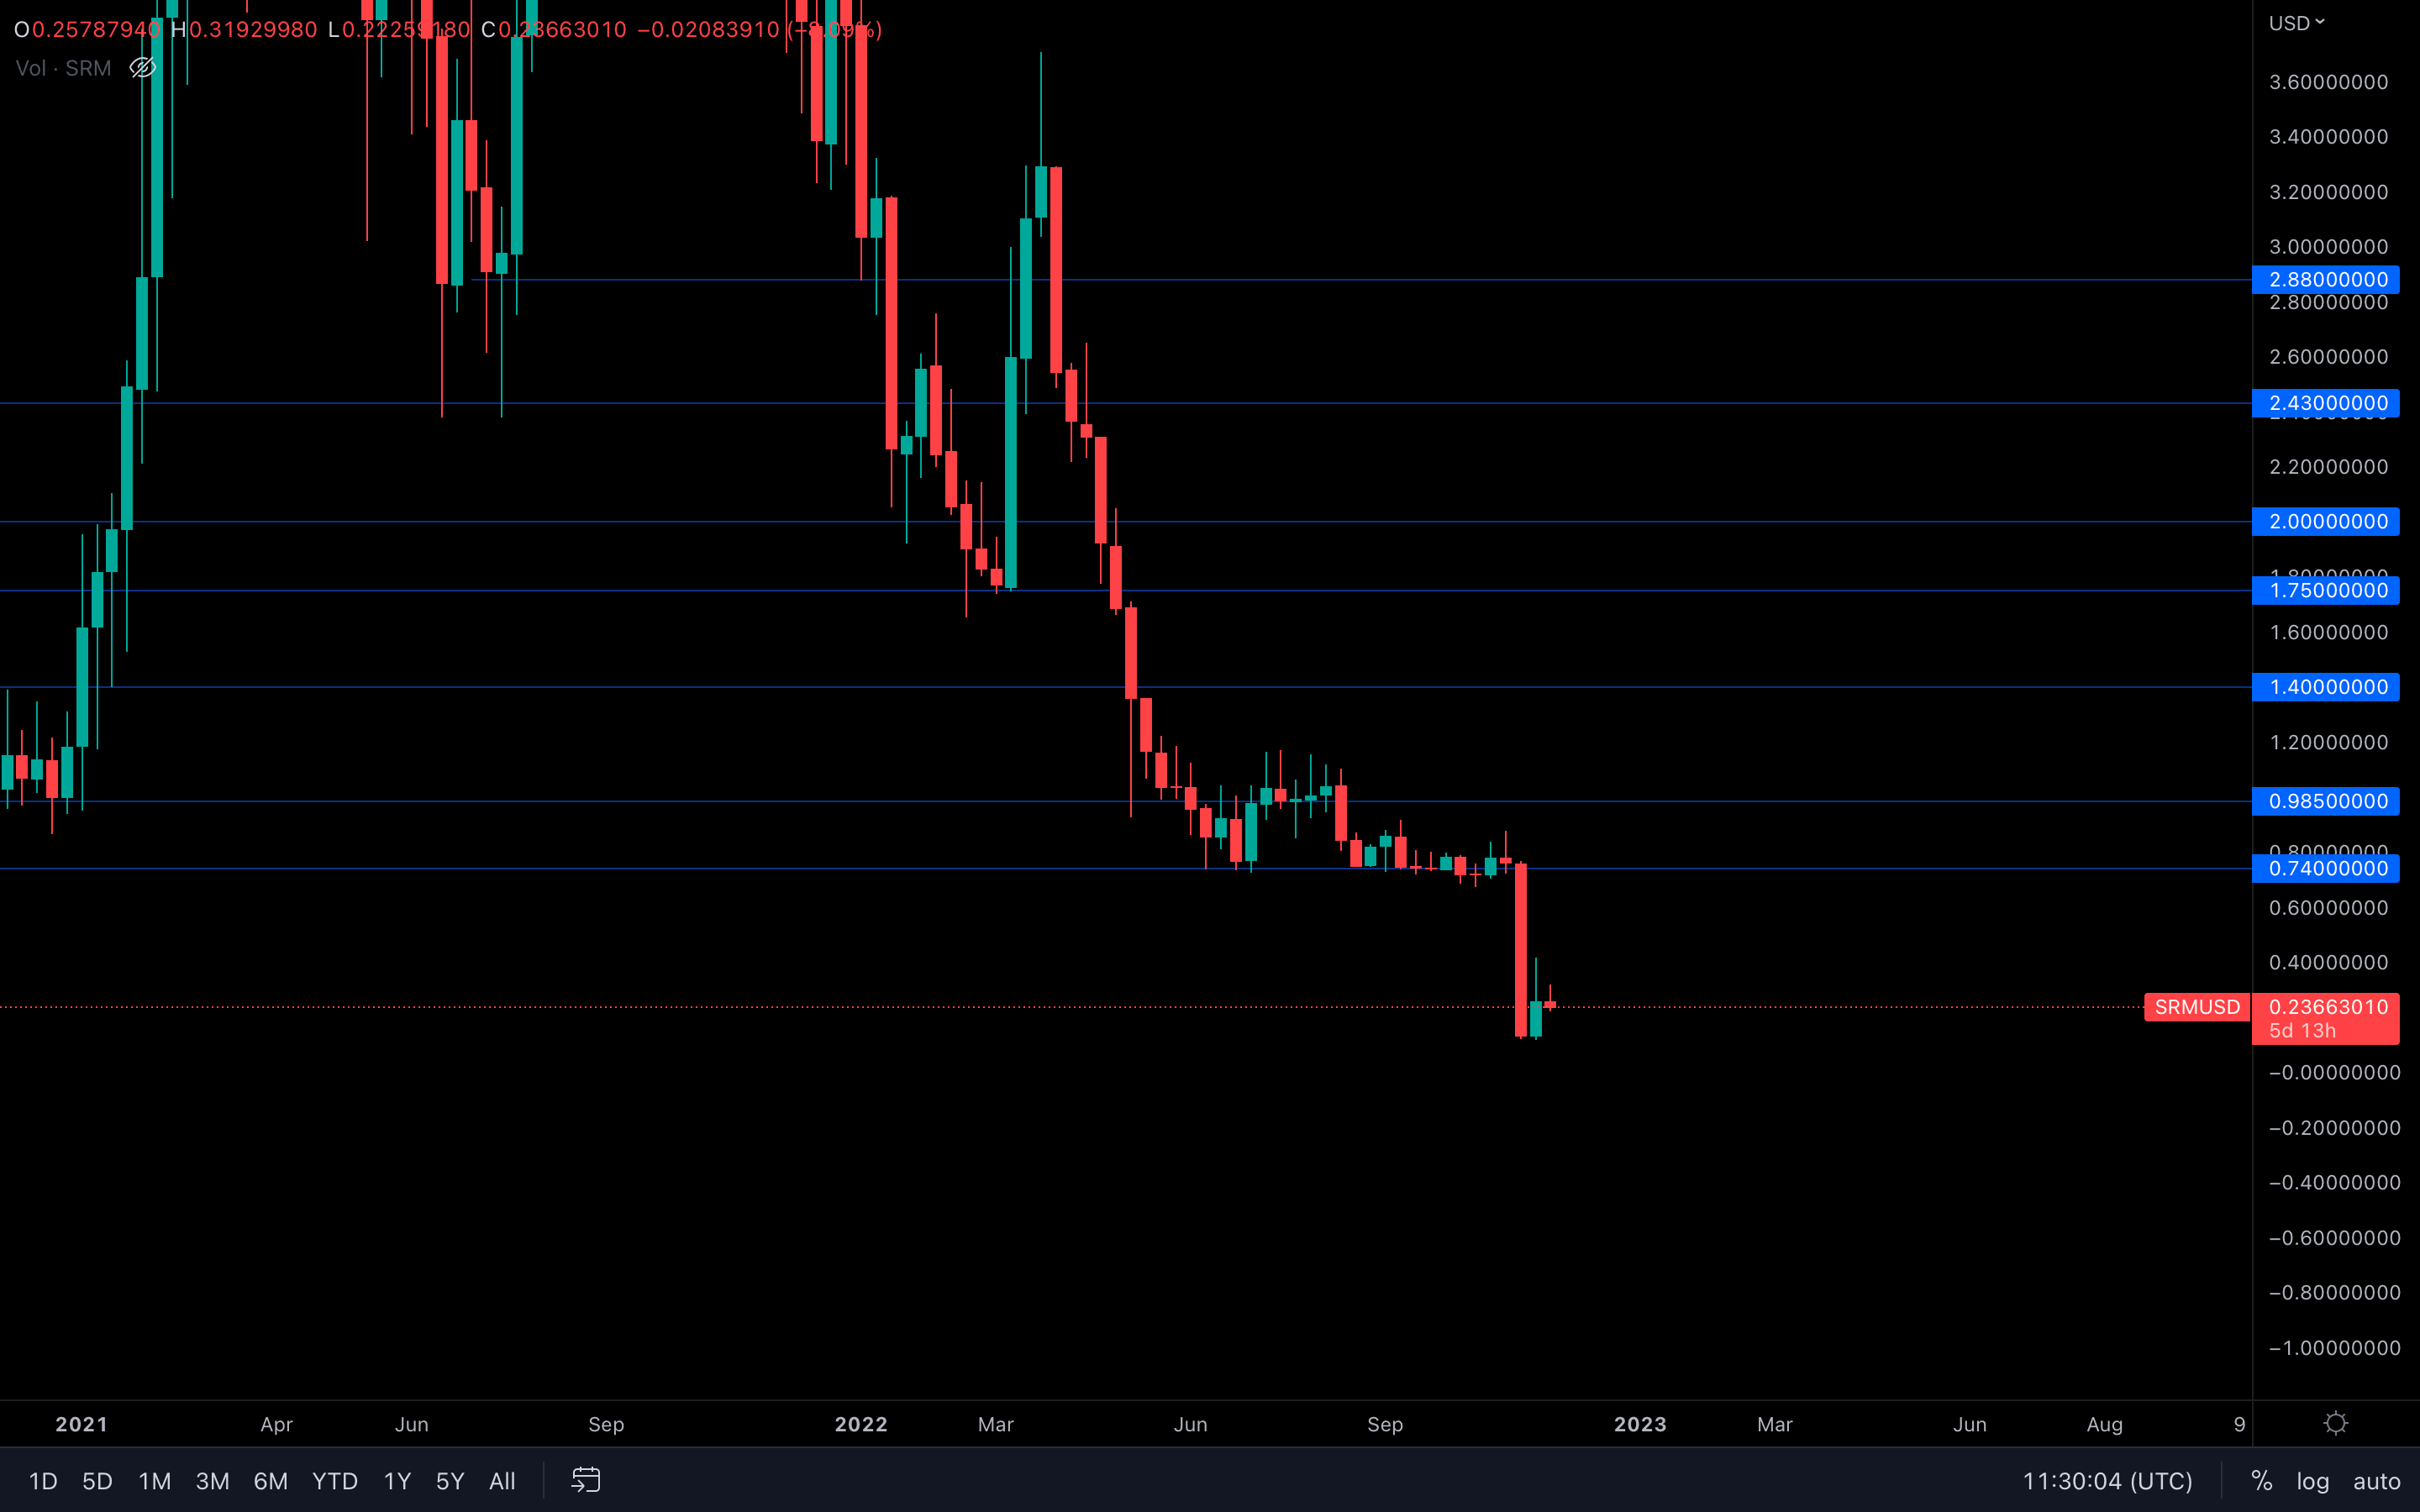 Similar price action to that of SNX, which suggests SRM will also experience buying pressure here. Something to note here is that $0.74 hasn't been retested yet, and this could completely happen in the future. However, without the right volume and the right market conditions, it's uncertain if we're going to reach that level anytime soon.
SYN
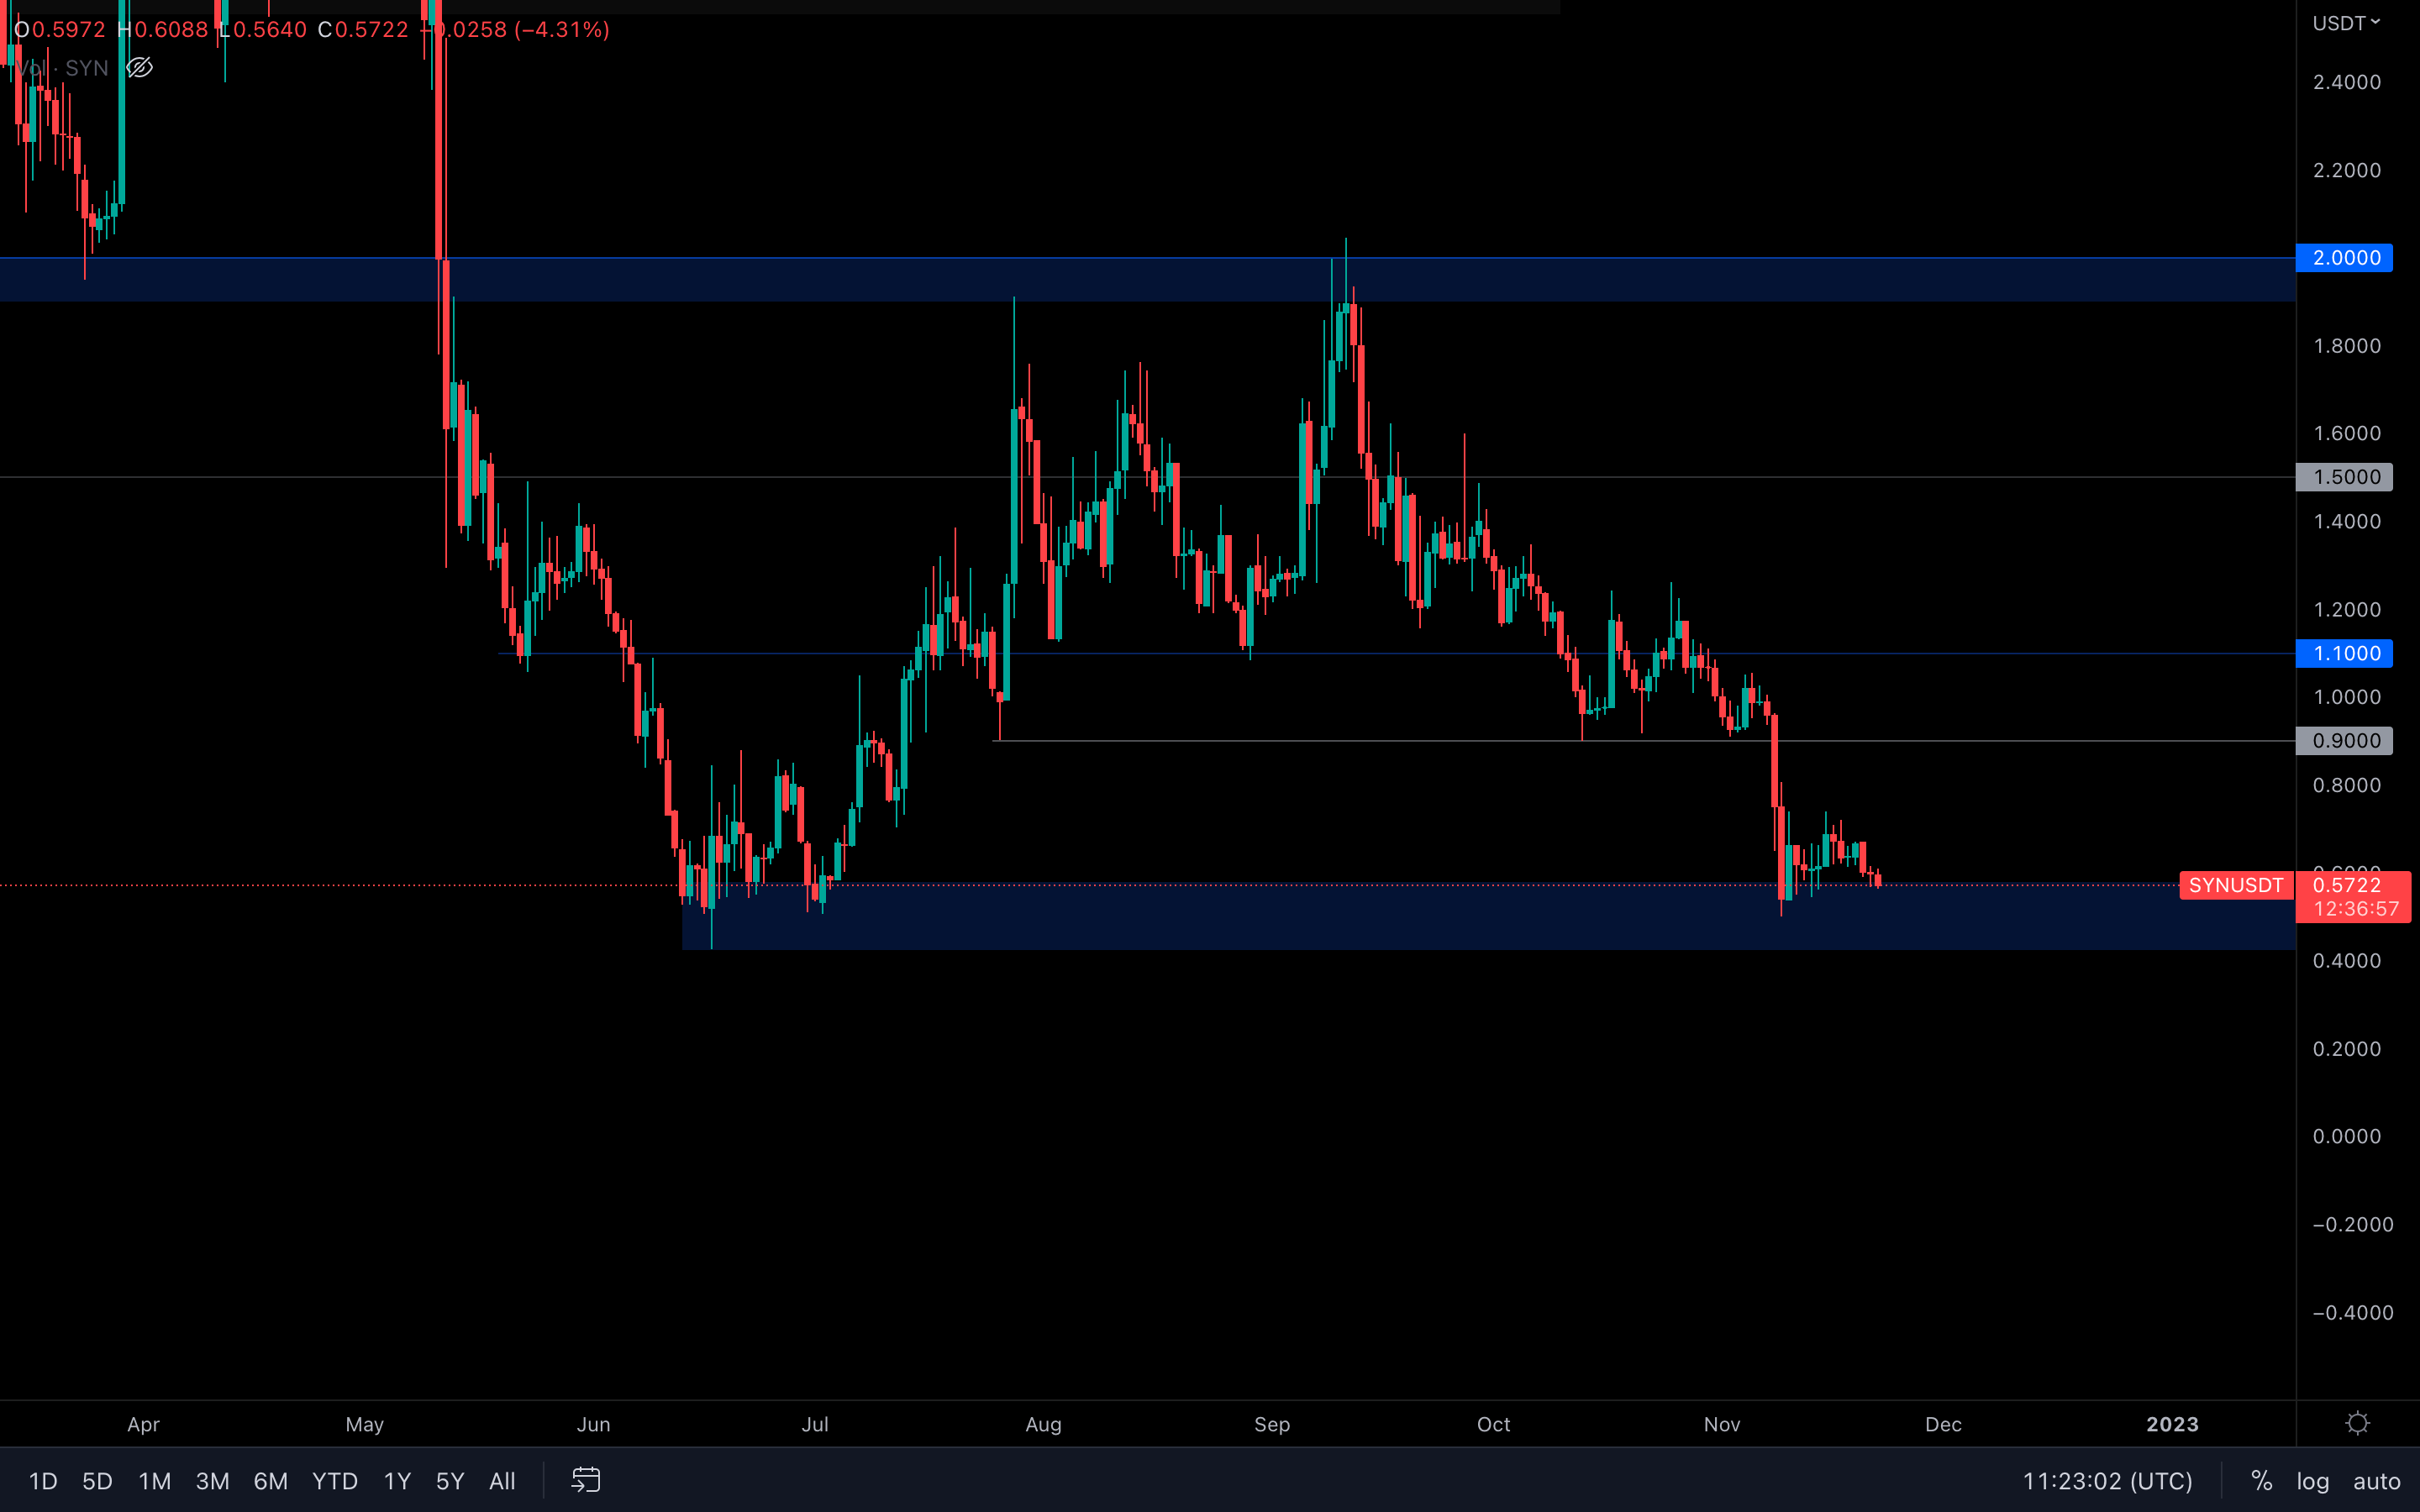 The rise toward $0.90 was short-lived - SYN continues to experience a choppy price action while above its current support area. Dropping under $0.42 is out of the question, there is no fundamental nor technical reason to expect such a performance for now, but the asset ranging between $0.58 and $0.42 isn't an impossible scenario here, actually quite a likely one.
For now, $0.58 is a level that has seen accurate tests in the past - a daily loss of this level will confirm a test toward $0.42 unless a reclaim of $0.58 occurs after.
MINA
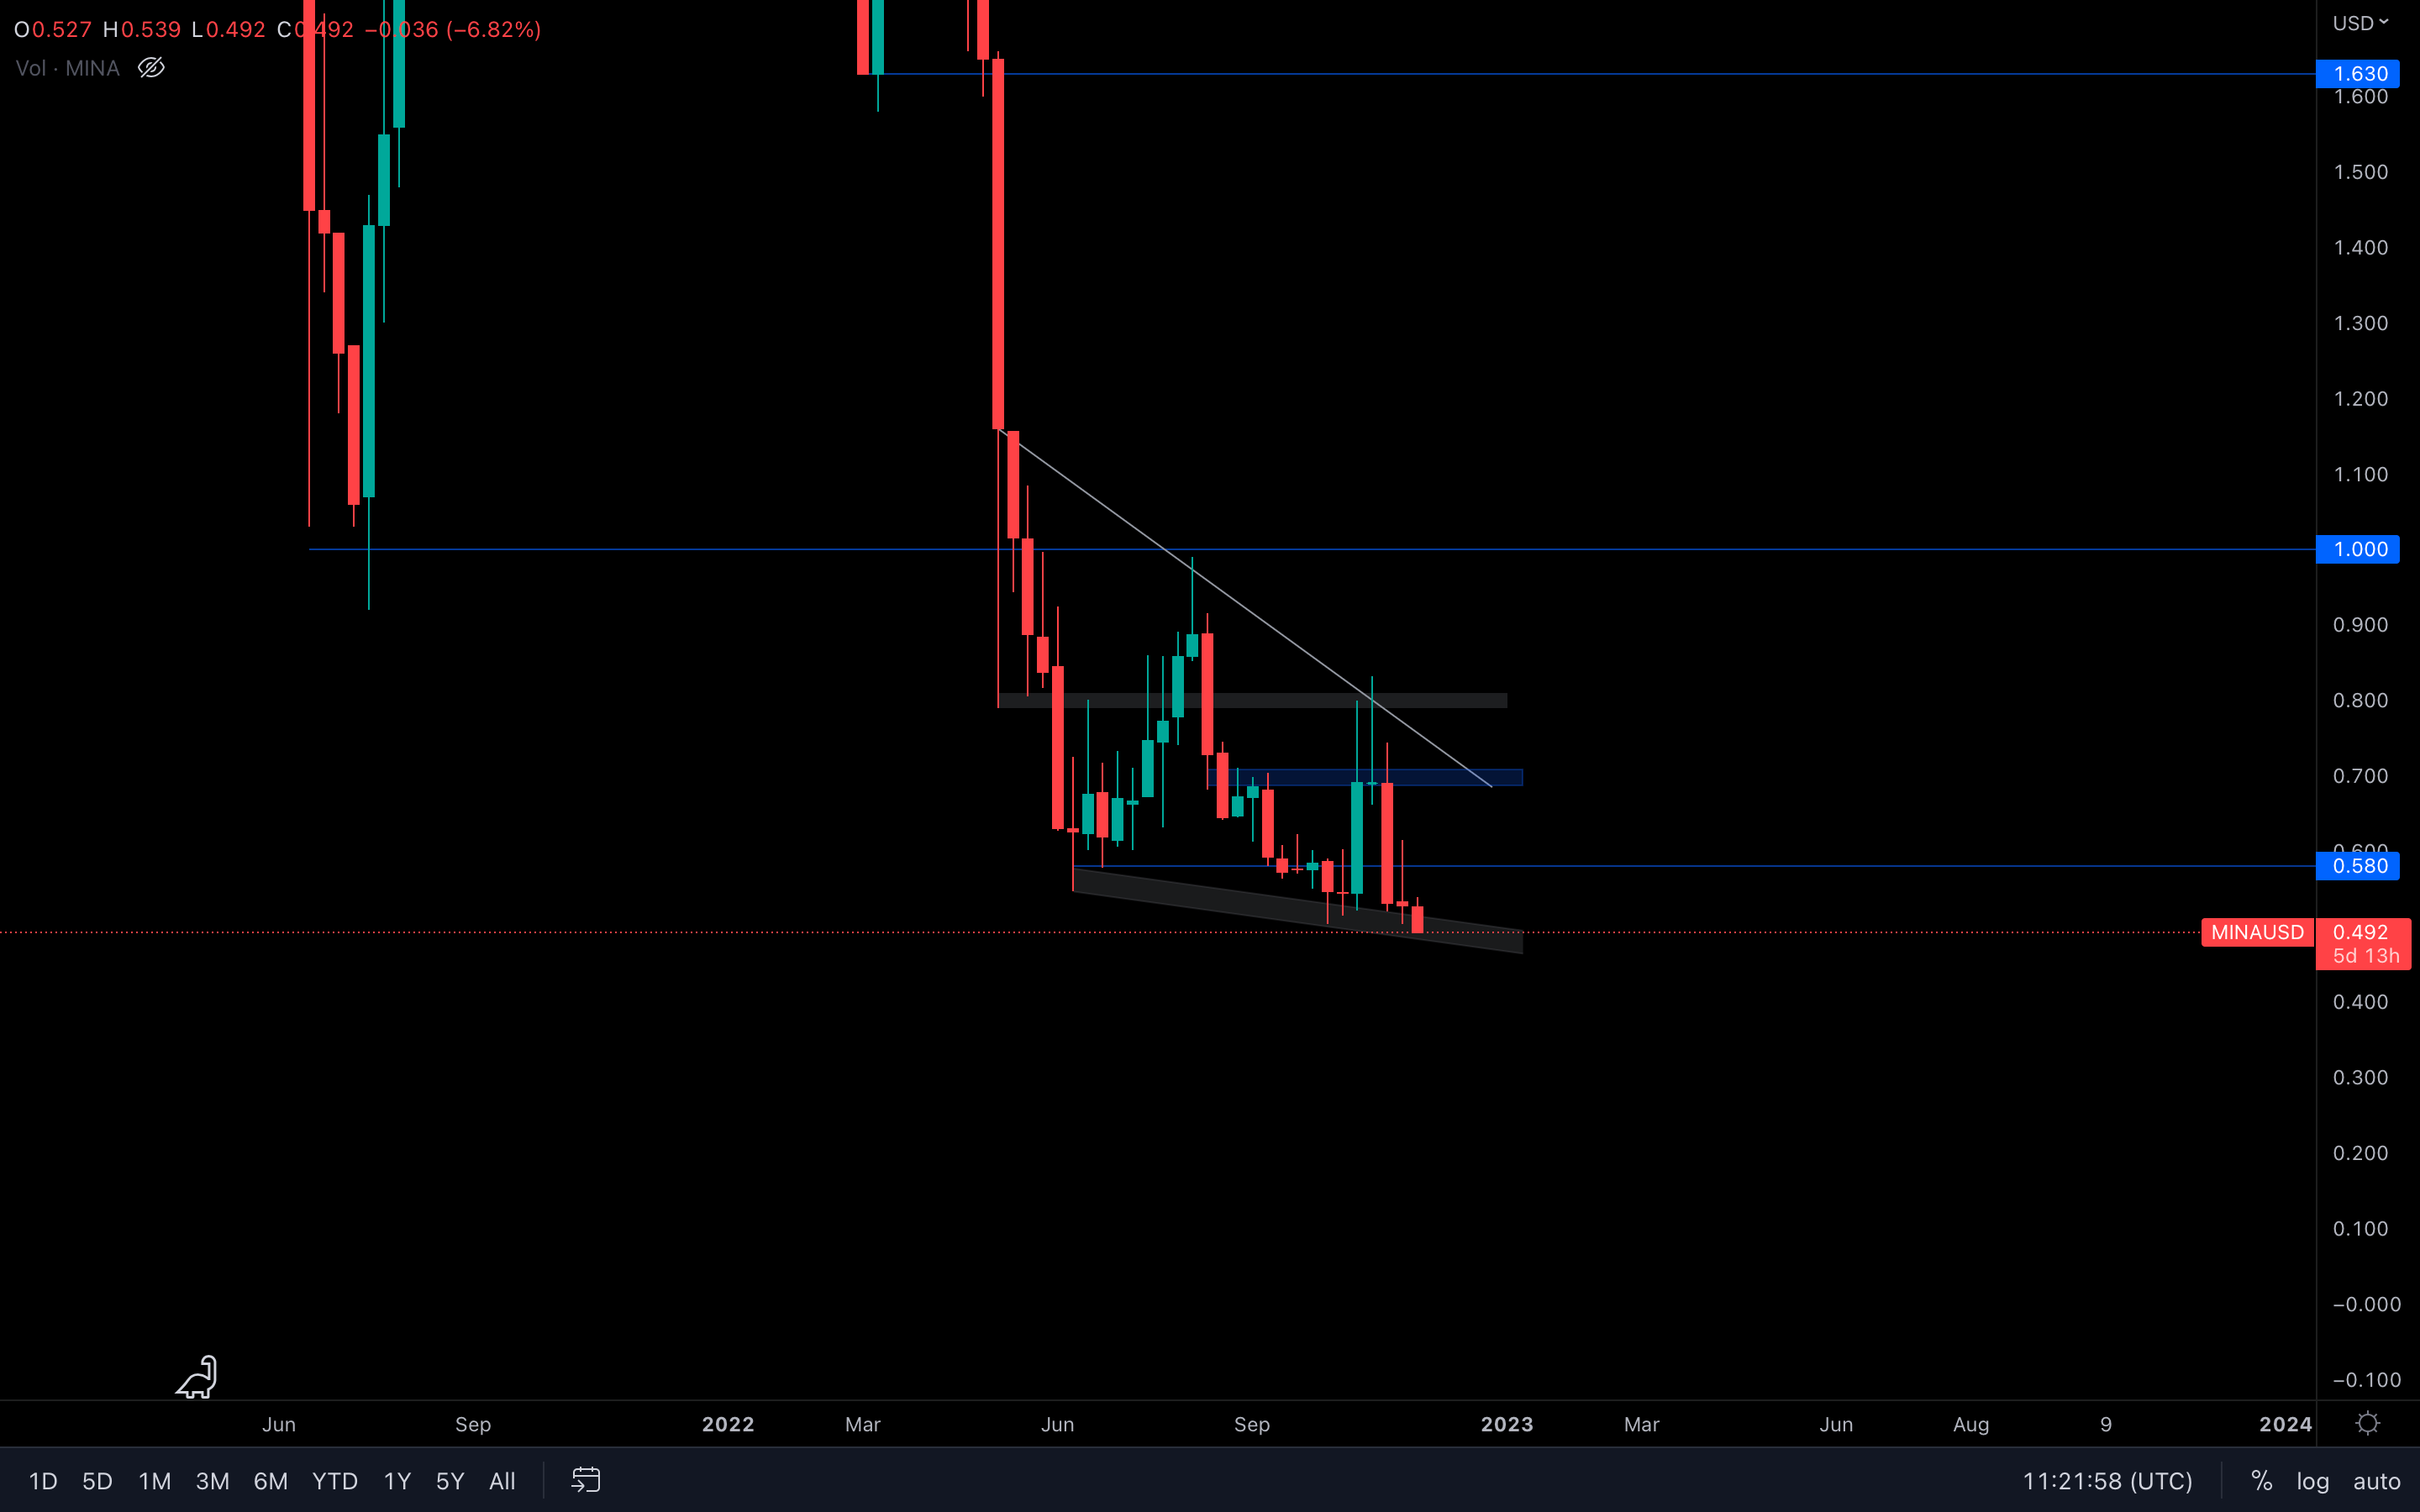 In last week's report, we mentioned that failure in reclaiming $0.58 will push MINA toward $0.50 - that has now happened. MINA is currently testing this supporting channel and hopefully, it will manage to hold.
One important note here - MINA registered a new all-time low. If its price is not able to hold itself above the channel, then we could potentially be looking at a downside price discovery, with levels such as $0.40, $0.35, $0.30, and so on as psychological targets.
If the level is successfully held, then a $0.58 retest will follow.
DYDX
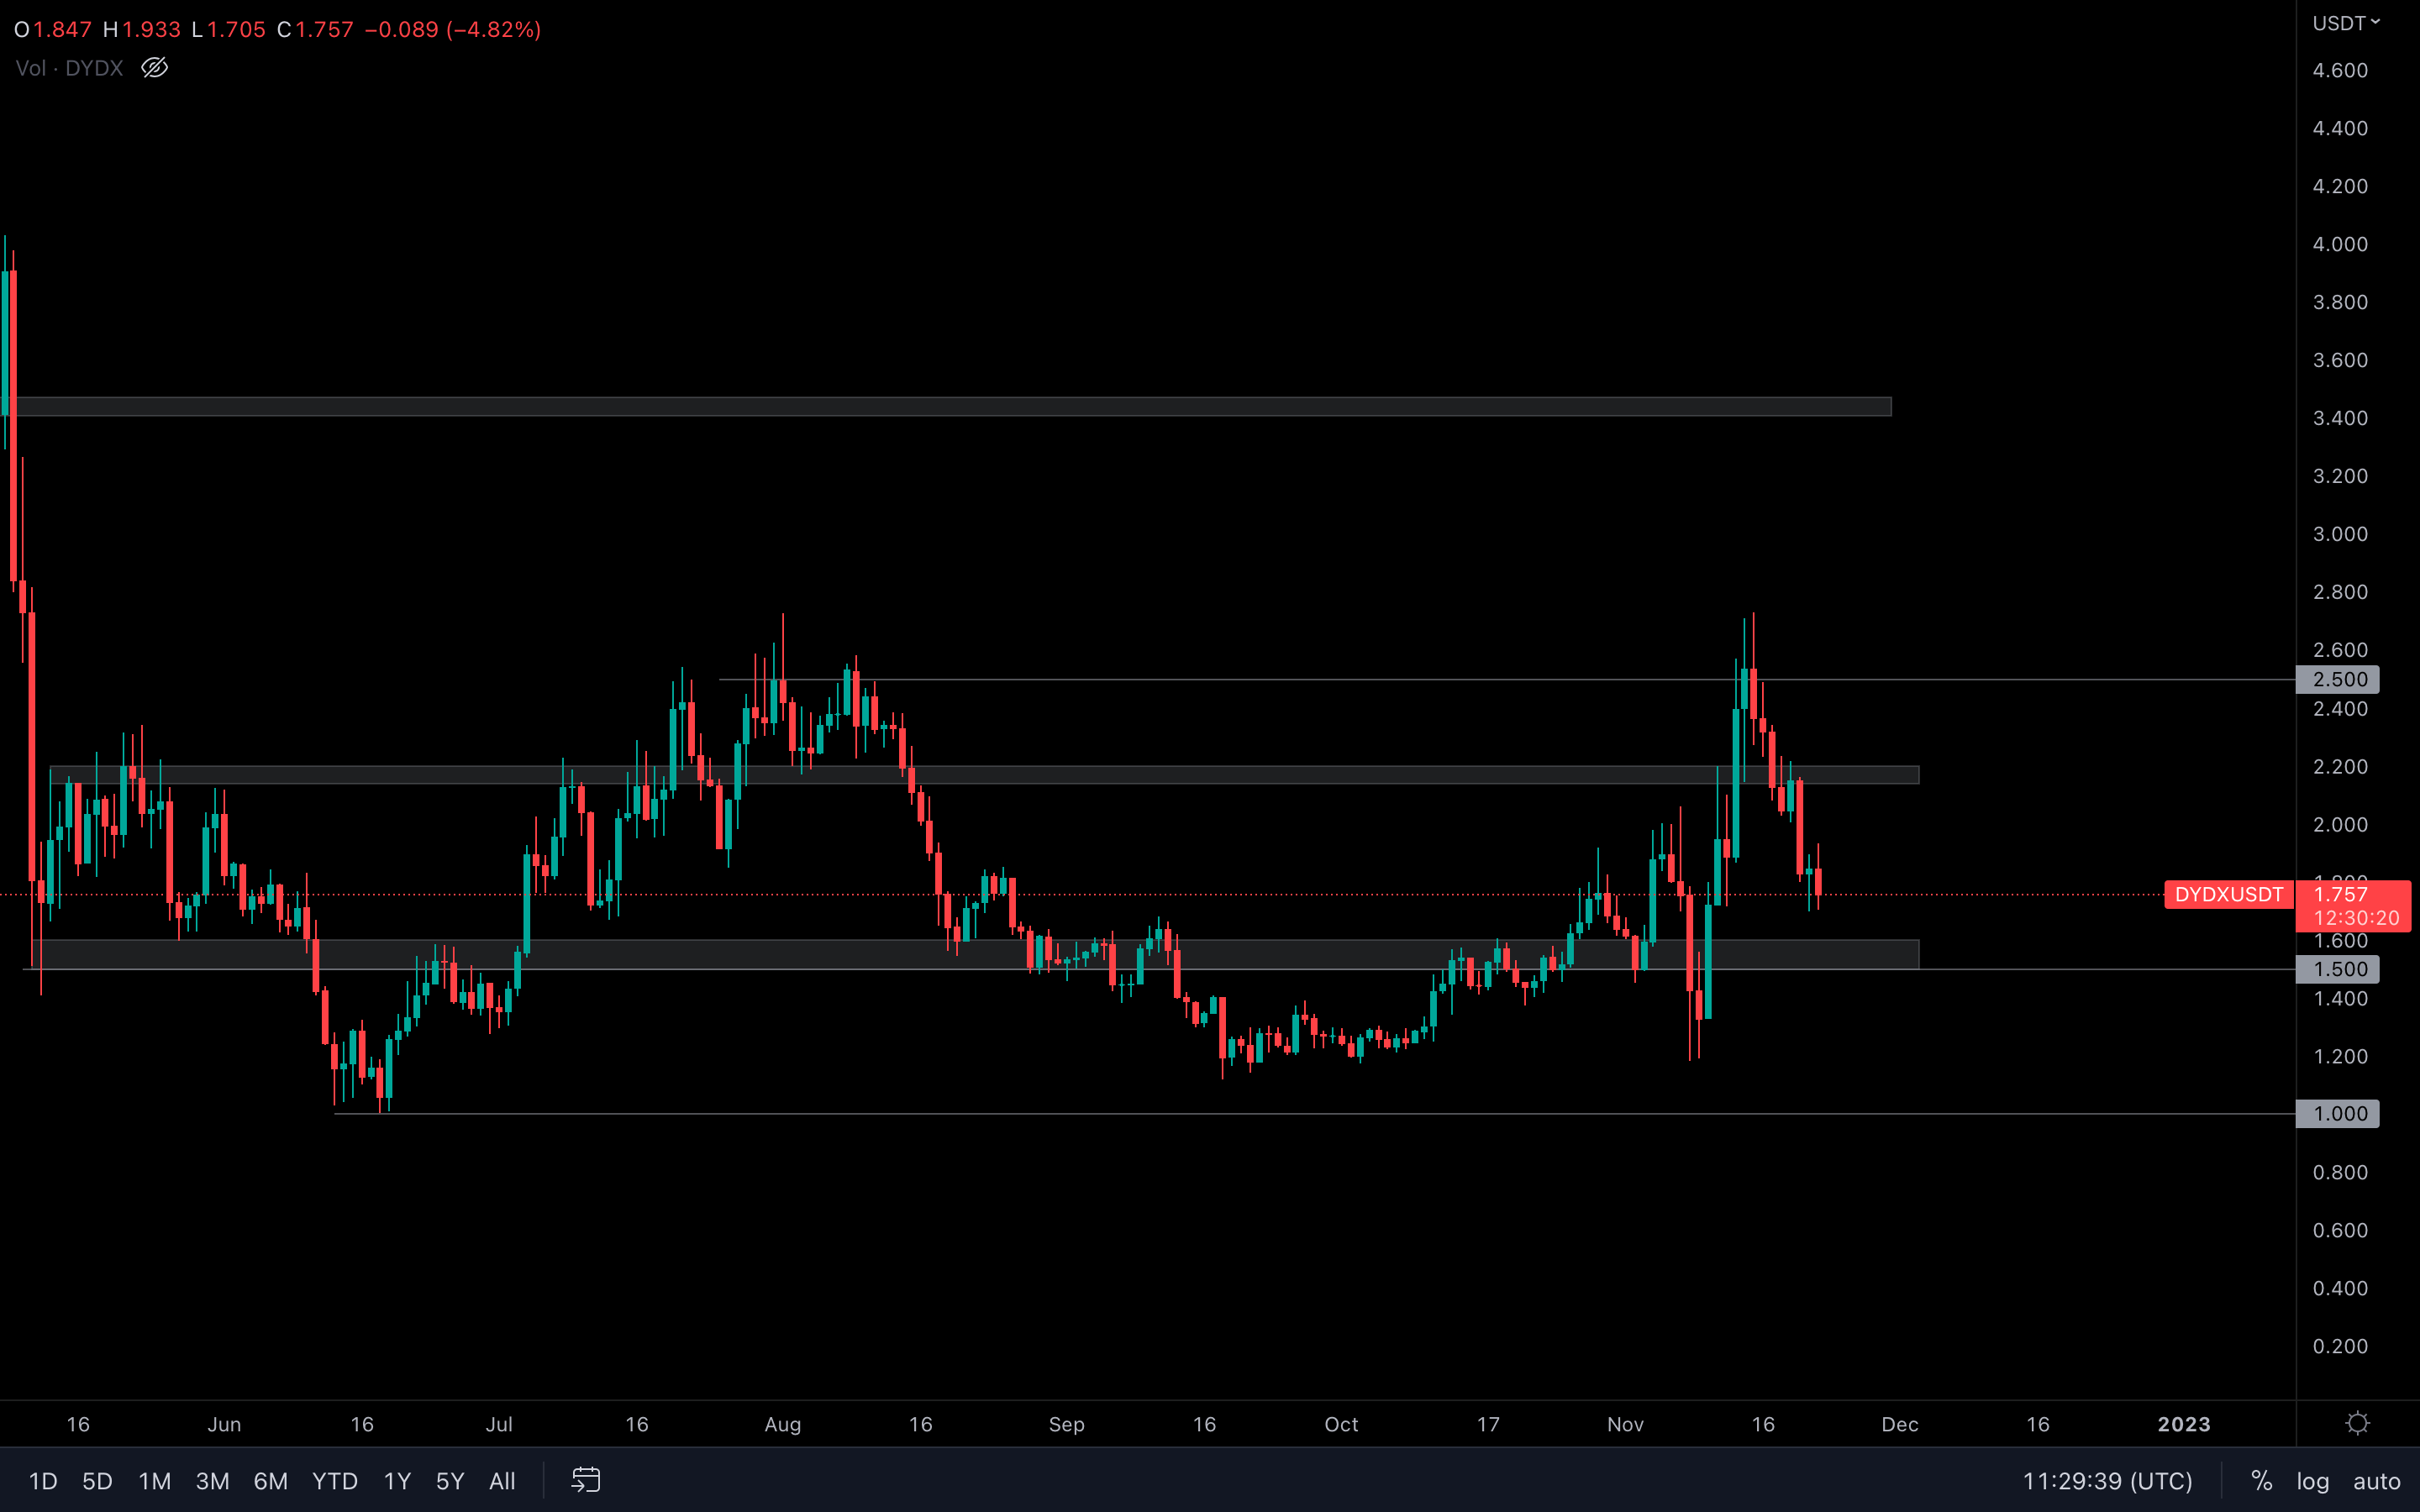 (Daily chart was used)
Unfortunately, dYdX was not able to hold $2.20 and as a result, dropped to $1.75 in a short amount of time. It seems the market wants to see dYdX back at the $1.50 level, which makes the daily market structure choppy and hard to read.
(Daily chart was used)
Unfortunately, dYdX was not able to hold $2.20 and as a result, dropped to $1.75 in a short amount of time. It seems the market wants to see dYdX back at the $1.50 level, which makes the daily market structure choppy and hard to read.
If you've read last week's report, you know that dYdX has experienced a change in market structures on the weekly timeframe. That change is still intact for now, but we will need to see continuous higher highs & higher lows to actually keep the market structure going.
On a shorter timeframe (this week), we should expect dYdX to retest $1.50.
Summary
The crypto market is still left dealing with the aftermath of the FTX incident. Trust was broken, which made investors leave the market in anticipation of an even worse move to the downside than what we've been dealt so far - and that's totally fair. However, this is directly impacting the market, making technicals more and more inaccurate and indecisive. Although we've always made sure to mention, combining fundamentals with technicals is a far more superior approach on the market rather than relying on technicals alone.The above set of metrics shows that there has been some significant loss taking on-chain in the past week, likely driven by the widespread fear of the fallout of the collapse of FTX. However, some market dynamics have reset putting the market in a more healthy area – less excessive leverage and a more neutral market in terms of derivatives. There is no reason why prices cannot continue to go lower as contagion fears persist and large players such as Greyscale and Gemini come under pressure. But, prices still remain low and a Dollar cost averaging approach should be considered.
Recommended from Cryptonary


