Save 23% ($351) & Get a Free 1-1 Call with our Team ⏰ : 0d 2h 59m 44s

Disclaimer: Not financial or investment advice. You are responsible for any capital-related decisions you make, and only you are accountable for the results.
Macro:After a quieter few weeks on the macro side, we have PCE and Employment data out this week.
The next Core PCE print (the FED's preferred Inflation metric) is released on December 1st. The consensus is for Core PCE to come in at 0.3% Month-on-Month, which would be down from the prior month's read of 0.5%. Overall, this would be a positive sign for the FED, although markets will likely react positively if the print comes in less than 0.3% and negatively if it comes in above.
On December 2nd, there is also the Unemployment data. The Unemployment figure is expected to be the same as the prior month, 3.7%, but the Non-Farms Payrolls (number of jobs added in the U.S. economy) is expected to add around 200k jobs, far less than the 261k added in the prior month. Again, if the jobs data comes in as predicted, that'll be a positive sign for the FED that the interest rate hikes are having their desired effect.
TLDR:
- A falling Hash Rate indicates that inefficient Miners are under pressure and may look to sell their reserves if the price of BTC remains low.
- The Market Indicator and Profit/Loss metrics suggest that there may be more pain ahead, but the metrics show that BTC is in value territory compared to history.
- We cannot ignore the threat of going lower, but the inability of investors and traders to realise lower prices on the release of negative news could suggest that we, at least, may have a local bottom.
DXY (U.S. Dollar Currency Index)
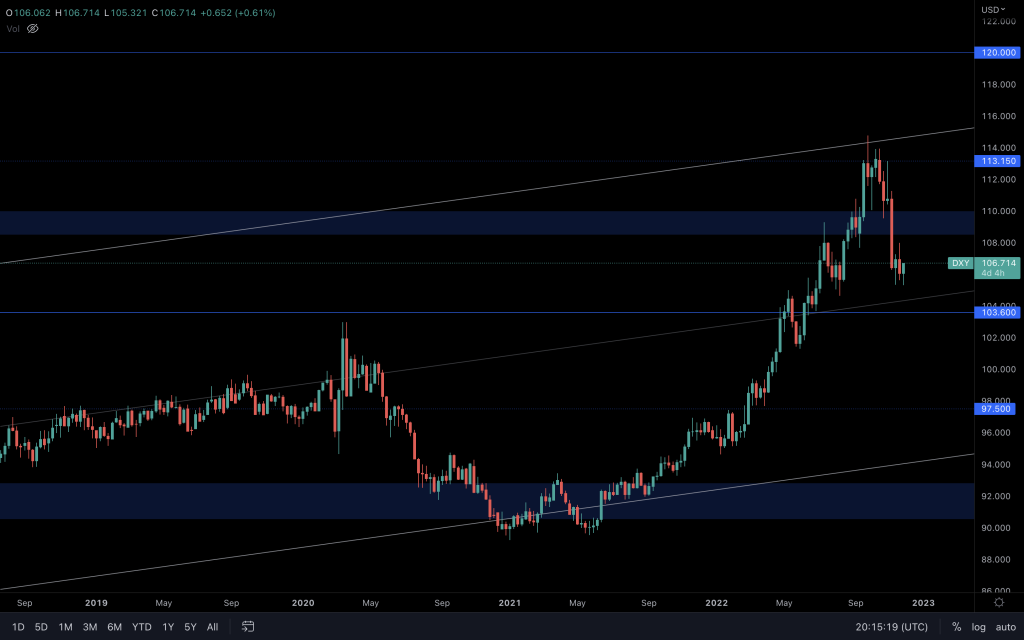
Last week's candle closed as a bearish engulfing, keeping the pressure on DXY to the downside. However, an interesting development on the daily timeframe means that we may have a double bottom formation that can push the index to $110/$111. It doesn't make the index bullish, but should that be the case (it will likely take a few more days to find out), we would then have to expect a period of suppression of prices across the market.
S&P 500 Index
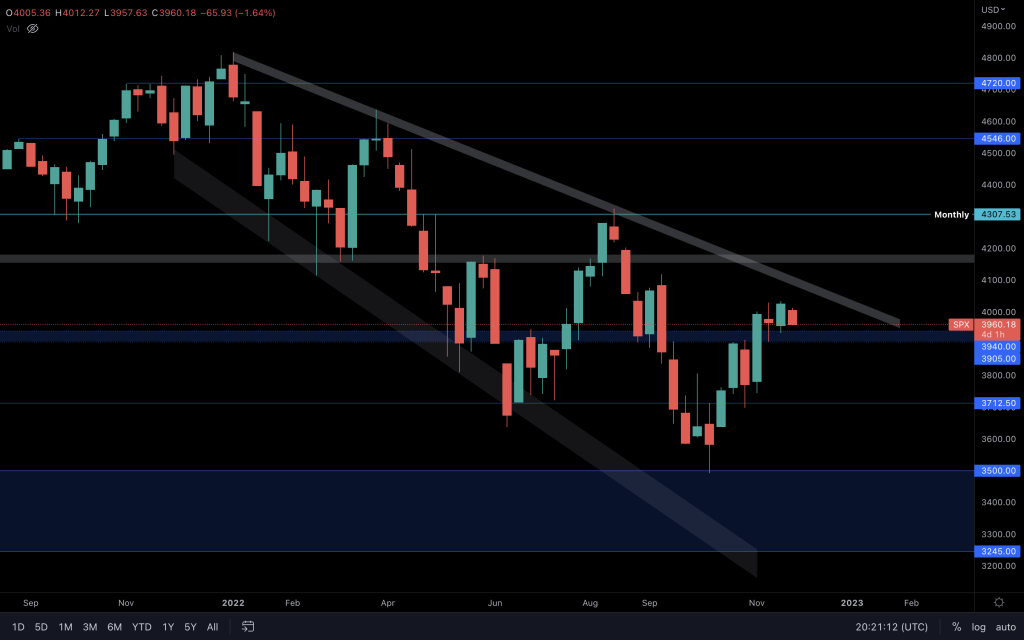
The S&P 500 Index closed out last week with relative strength. The pullback that is in progress results from DXY pushing higher. But we know the potential volatility that PCE and Employment bring if they're not as expected. The level that we continue to watch is $3,900. This level has to hold by weekly closures to continue to favour the index pushing higher into the $4,100s.
Total Market Cap
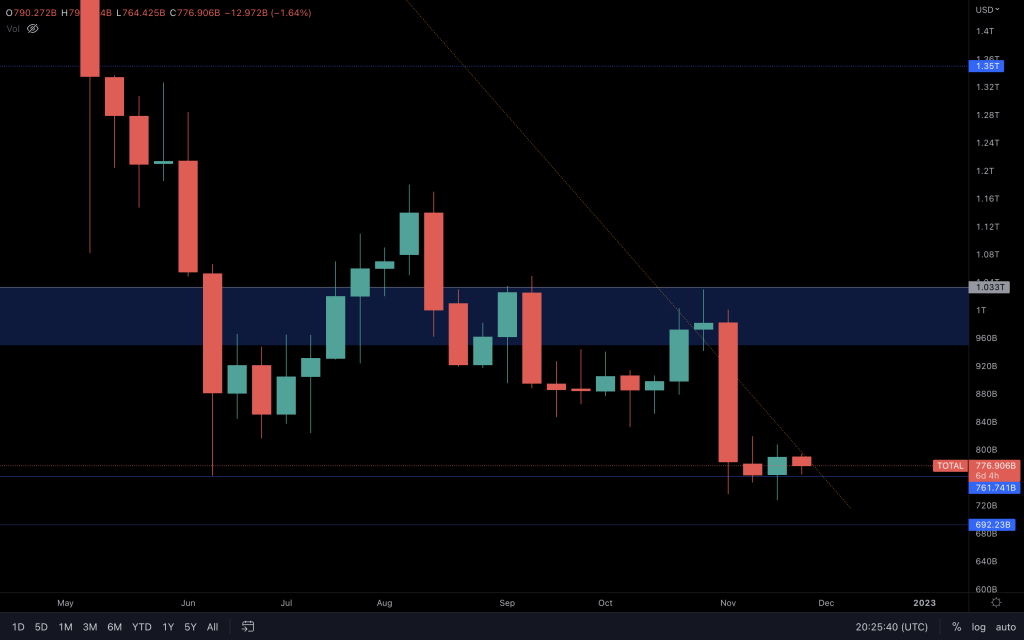
There is the possibility that the Crypto Market Cap is forming a base for its next relief rally, although it's too soon to rule out going lower. $760B is the 2017 high which has yet to be breached by a weekly/monthly closure. So, with $760B holding as support, any clear sign of relief would bring $880B and potentially $1T into play. With the monthly closure two days away, be prepared for volatility.
Altcoins Market Cap
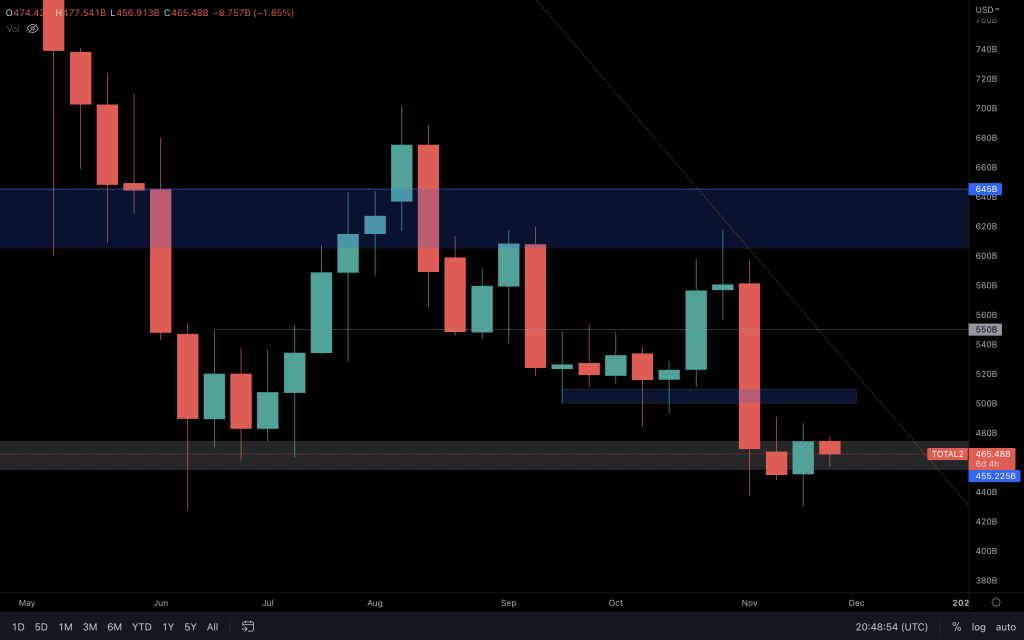
Not the strongest bullish engulfing candle closure, but a bullish engulfing nevertheless. The daily timeframe indicates uncertainty with four days worth of Doji candles. Whilst it may appear tedious, it shows that buyers and sellers are equal, and we now need one of them to take the lead from here. The pressure for lower prices is ever-present, so we need the market to convince us otherwise whilst it's at a support level.
Bitcoin
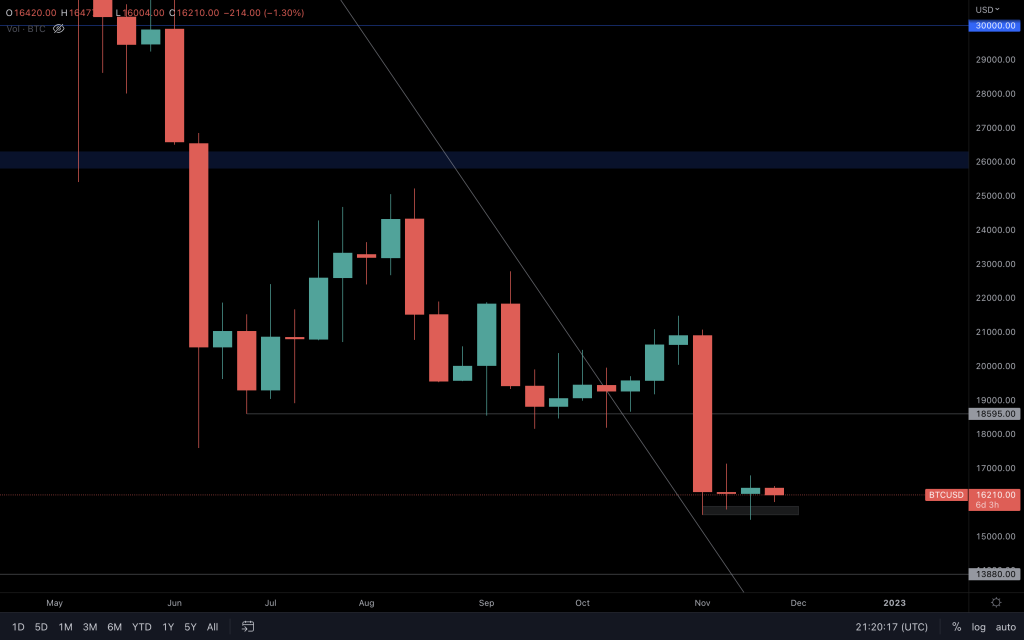
For two weeks, the price has stalled, even with the news of Genesis (potential insolvency) and Block-Fi (Chapter 11 filing). Although Bitcoin has tested the weekly $15,770 support level twice, we're yet to see a move away from bearishness. Should it lose $15,770, $13,880 (and even below) comes into play. Considering the fundamentals and T.A., it seems like all we need is a period of silence, and we may have a rally from this level. For that, the charts need to present us with an indication of strength, as the monthly chart favours lower prices in its current state.
Metric 1 – Miners
Perhaps the most critical metrics to cover this week is the Mining metrics. We will begin with the Hash Rate, which has declined significantly in the past week.Bitcoin – Hash Rate

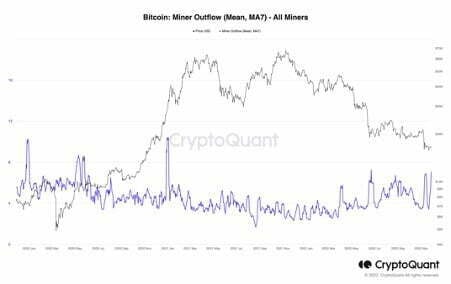
The Hash Rate decline indicates that some Miners (likely the more energy inefficient Miners) are leaving the network and turning their rigs off. As inefficient Miners leave the network, they will probably sell their remaining reserves. Currently, Miner reserves sit at an estimated 78k BTC. We can see below that Miner Outflows (of BTC) have increased in the past few weeks, showing that another Miner capitulation is likely underway.
Bitcoin – Miner Outflow
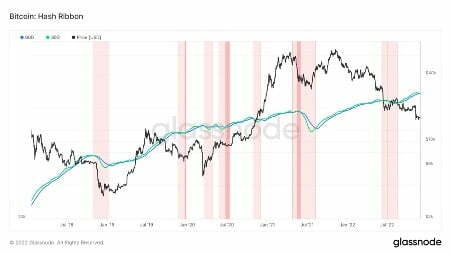
We can also see that the 30d M.A. has now crossed below the 60d M.A. on the Hash Ribbon metric. The Hash Ribbon is a market indicator that assumes that Bitcoin reaches a bottom when Miners have capitulated. When the 30d M.A. crosses back above the 60d M.A. (after forming a significant low), this may indicate that the Miner capitulation is over and that the worst may be behind us.
Bitcoin – Hash Ribbon
Metric 2 – RHODL Ratio
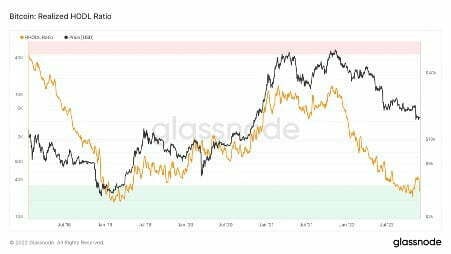
The RHODL Ratio takes the ratio between the 1-week and the 1-2 years RCap HODL bands. A high ratio signals an overheated market and can be used to time cycle tops. We can see from this metric that we are beginning to dip back into the green band area, which has historically been a great time to buy BTC. It may be worth waiting to see a new low in this metric before buying. However, the current zone generally indicates an excellent area to begin a Dollar-Cost-Averaging approach.
Bitcoin – RHODL Ratio
Metric 3 – Profit/Loss
The last set of metrics we will cover is the Profit/Loss metrics. We will take a look into these to see how we compare in terms of on-chain losses to prior cycles.
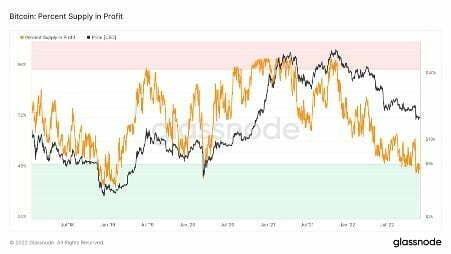
The first of these metrics is the Percent Supply in profit. We can see from this that roughly 48% of the current supply is in profit. This is higher than the Covid low, where 43% of the supply was in profit. It's also higher than the low of 2018, where just 39% of all coins were in an on-chain profit.
Bitcoin – Percent Supply in Profit
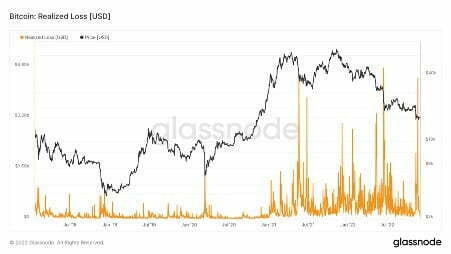
The second metric is the Realised Loss. This shows the total loss in USD value of all moved coins. We can see this is at one of its highest points. This may be because BTC is now priced higher in USD compared to 2018, for example. So we should factor this in.
Bitcoin – Realised Profit
Overall, the Profit/Loss metrics suggest that there may be some more pain ahead. Although we're already very close to the ultimate pain level, it would now perhaps be unwise to bet on much further pain.
Ether
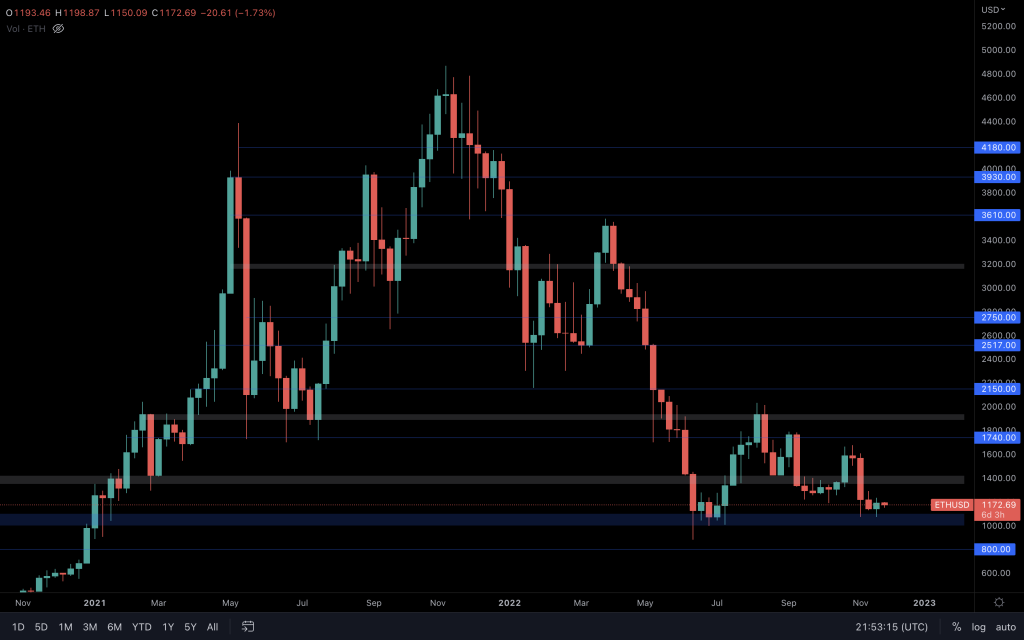
Oddly, none of the majors had a bullish engulfing, yet the indices did. Week of the altcoins! Besides that observation, Ether still maintains a price above $1,000. As long as that's true, a $1,400 retest is still on the table. If you've followed our daily T.A., we've highlighted the criteria for a move higher, and that's to overcome £1,235. Ether hasn't managed that to date, and without it, a retest of support ($1,000-$1,100) may be first on the cards.
Polkadot
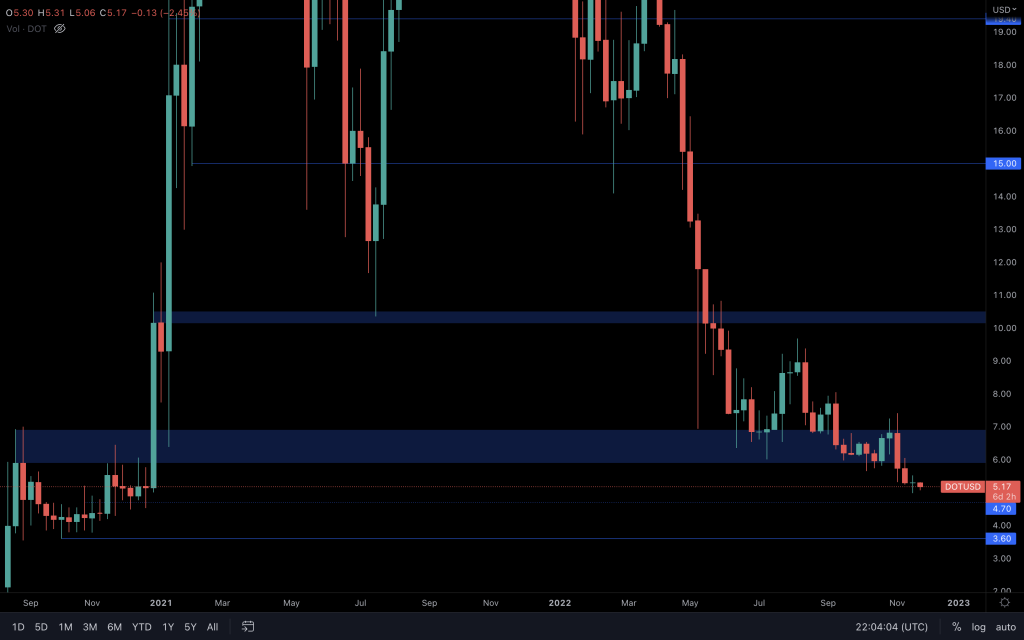
Although last week closed indecisively for DOT, there's no reason to rule out a visit to $4.70 and eventually $3.60. This may be an appealing range for those that wish to slowly DCA into a position but bear in mind that the market structure is still bearish. At this time, the bearish structure would only begin to be invalidated by reclaiming $7.
Synthetix
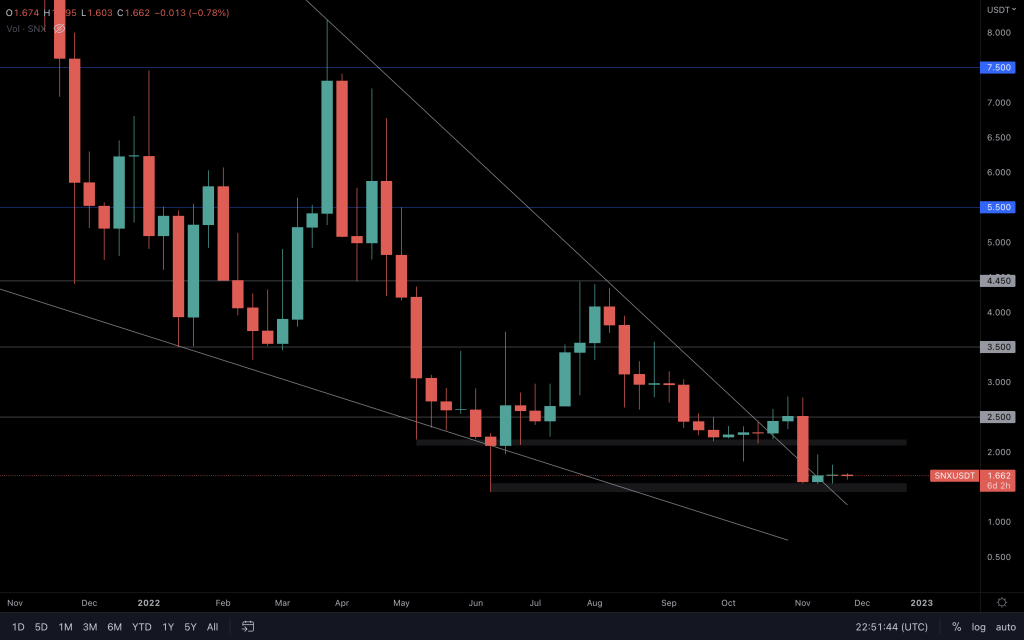
After three touches, $1.54 seems to be a solid level for SNX, but I wouldn't want to see too many more. Although there's an indecisive weekly closure, a $2-$2.10 retest is still in play, and the daily timeframe suggests that a closure above $1.75 is needed for that to happen (there's a descending triangle). If it fails to achieve that, a closure below $1.42 would indicate the beginning of lower prices.
THORChain
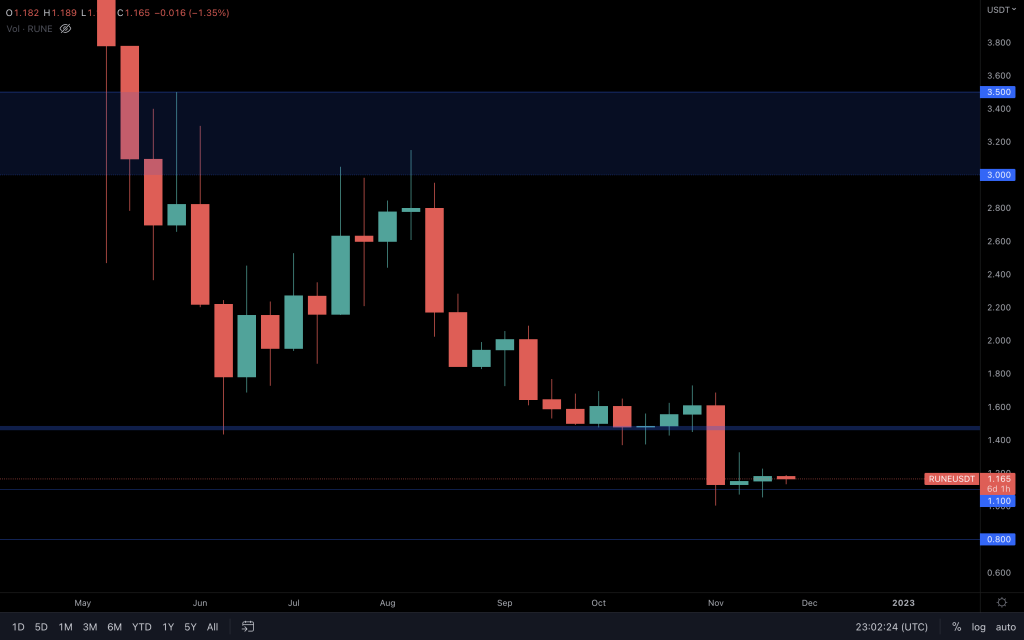
Even with the bearish daily structure, RUNE maintaining a price above $1.10 keeps the possibility of a $1.45 retest in play. The one thing that altcoins will require is strength from the majors. As we've mentioned in our daily analysis, $1.10 and $1.23 are the levels we're interested in for any signs of strength. However, if it loses $1.10, we can look at $1 and $0.80.
Solana
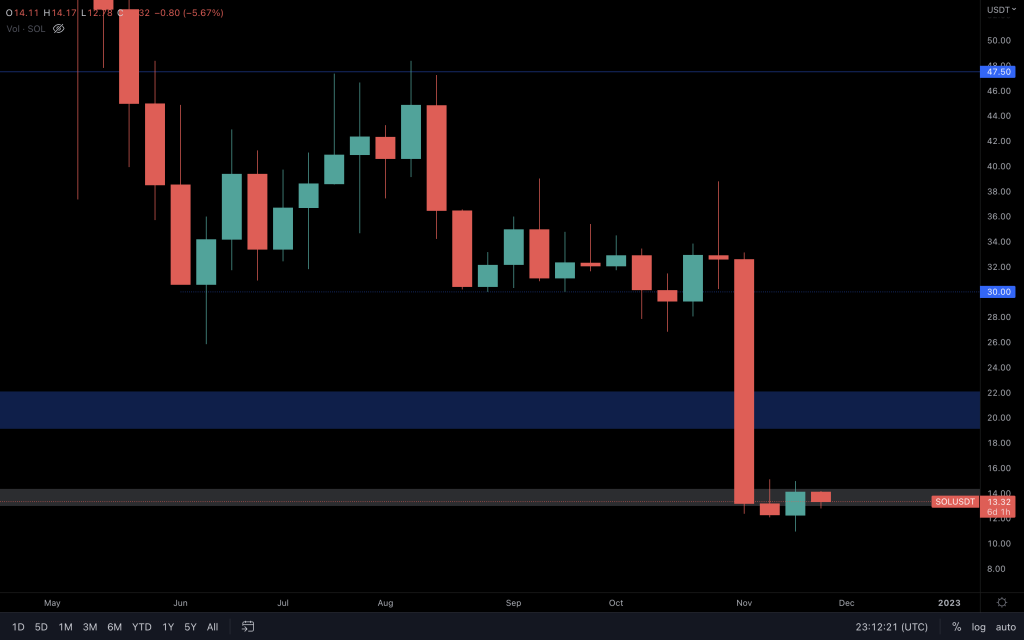
Similar to the TOTAL2 chart, it's not the most convincing bullish engulfing candle as it closed below resistance ($14.35). This puts SOL in limbo, with the daily chart only displaying ranging. There are two ways to look at Solana. The close perceived links to Alameda and SOL tokens (unlikely to be sold in the immediate future) or the fact that the blockchain continues to function without a hiccup. It would be a high-risk long to $19, but invalidation is relatively near (a weekly close below $12.25 or daily below $11.50).
Synapse
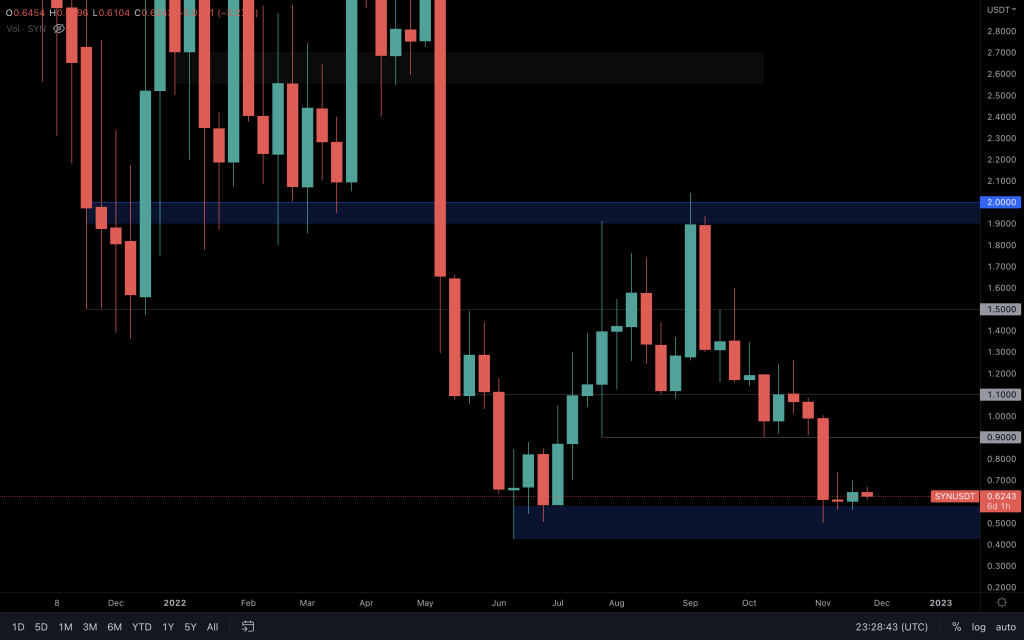
First, a Doji, then a spinning top. Both are indecisive weekly candles. Many assets have acted similarly over the past couple of weeks, and SYN is no exception. As long as $0.58 holds, SYN is spending its days between $0.58 and $0.74. A break either way on the daily timeframe should help us identify its next path.
MINA
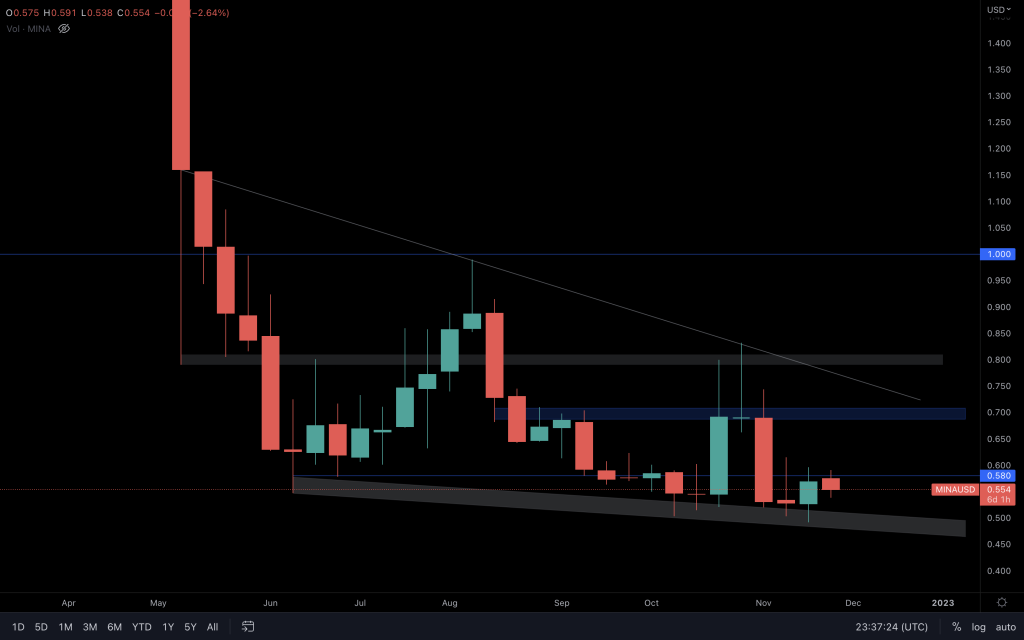
For three weeks, MINA has failed to make any meaningful ground. Whilst it's below $0.58, even on our daily timeframe analysis, we can expect further ranging. A break of $0.58 should lead MINA into $0.70 and potentially the top of the descending wedge, currently sitting at $0.76.
dYdX
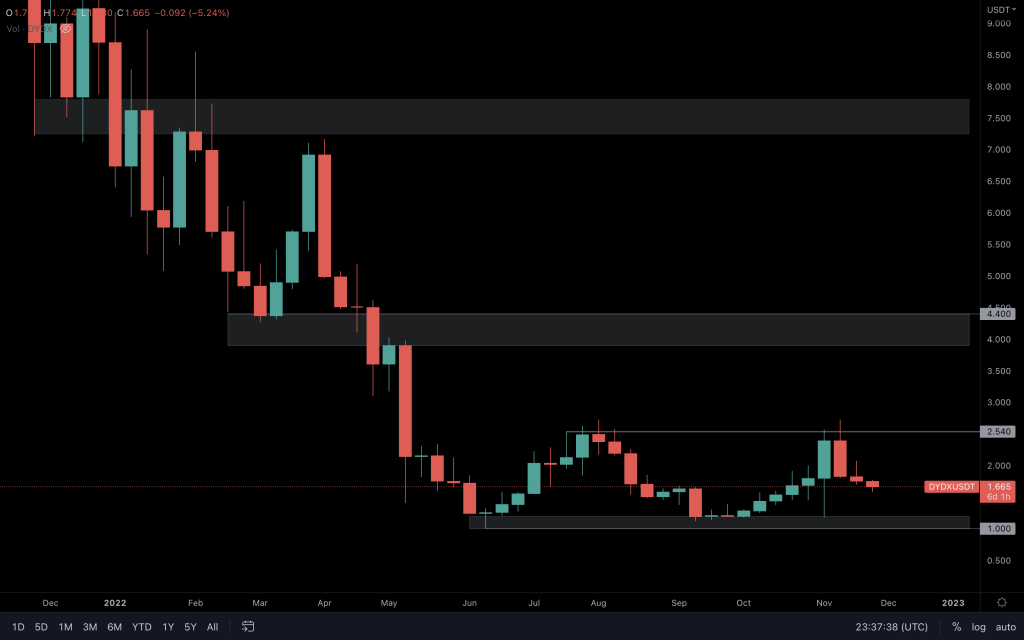
dYdX has moved impressively, offering traders great returns. All it's doing on the weekly timeframe is consolidating between $1 and $2.50.
Summary
There are still several Crypto headwinds ahead of us that may see more pain to come. However, the price is already very low, and some on-chain metrics suggest a light DCA'ing strategy could be wise. Bottoming processes take several months, and now may be a time to consider DCA'ing but to exercise patience throughout this process.
Recommended from Cryptonary


