Save 23% ($351) & Get a Free 1-1 Call with our Team ⏰ : 0d 2h 59m 44s

Disclaimer: Not financial nor investment advice. You are responsible for any capital-related decisions you make, and only you are accountable for the results.
Macro
There is an expectation that the FED will hike rates by 50 basis points at the next two meetings. Much of this has been predicted to have already been priced into the markets and with US economy/inflation data coming in over the past two weeks, showing inflation figures (PCE) that are decreasing slightly, markets may finally get some relief. The reason for this is that, decreasing PCE figures suggest inflation may be beginning to come down. This means the FED may be able to ease off on continued aggressive policy tightening. As a result, the markets will have fewer headwinds and they may begin to get some more momentum in the coming months. A potential relief rally will also be indicated by Bitcoin's monthly timeframe holding $30k, which we will explore in the monthly report.TLDR
- Records continue to be broken - 9 red weeks in a row.
- A potential short-term rally is on the cards, but the risks remain the same.
- More investors are selling rather than buying.
- The majority of investors are holding Bitcoin and Ether which is now worth less in USD than what they originally purchased them for.
- The MVRV Z-Score indicates more room for prices to go lower before a macro bottom is in.
Total Market Cap
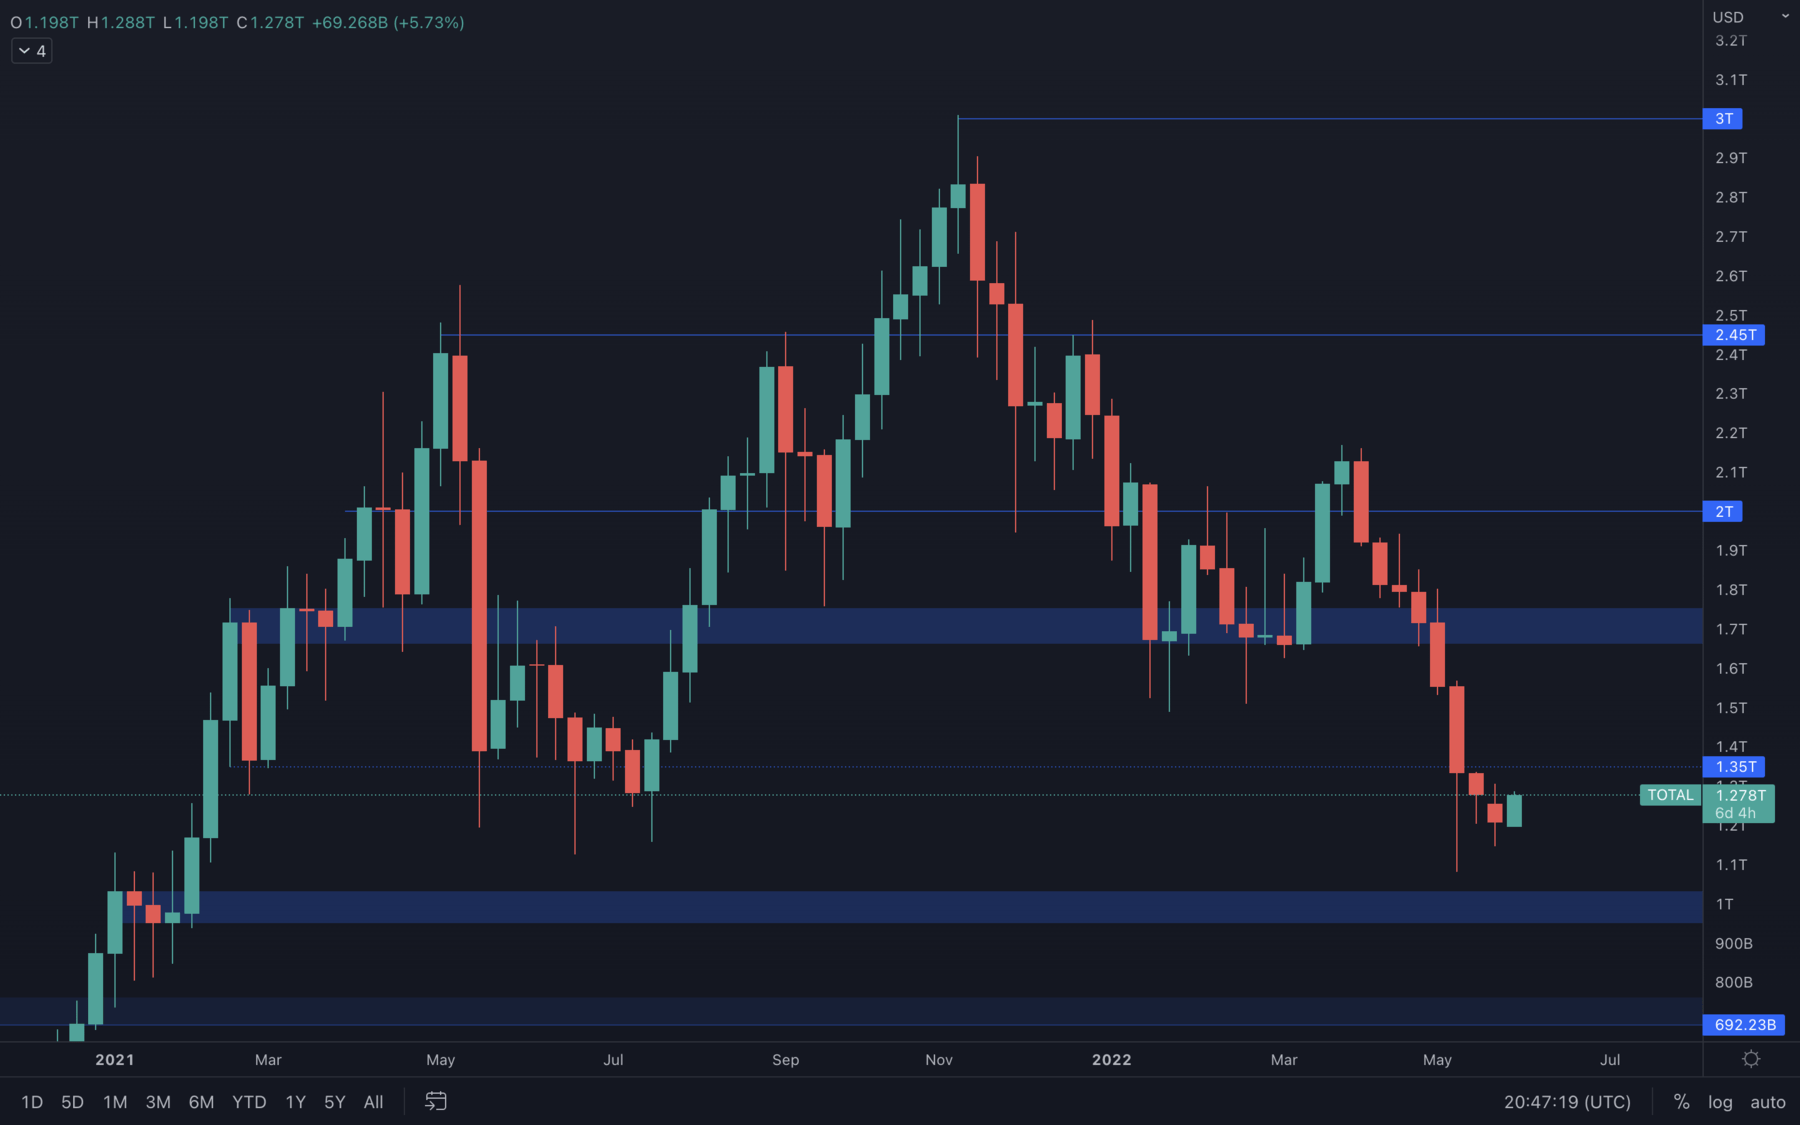
After a long continuous downtrend, we're finally seeing some upside movement, as the Total Market Cap is aiming for a $1.35T resistance test. With the S&P 500 Index also rising, we should expect the Total Market Cap to reach $1.35T because, as we know, the S&P 500 Index and the Crypto Market are correlated. We should expect some selling pressure around the $1.35T resistance level, so caution is advised.
Altcoins Market Cap
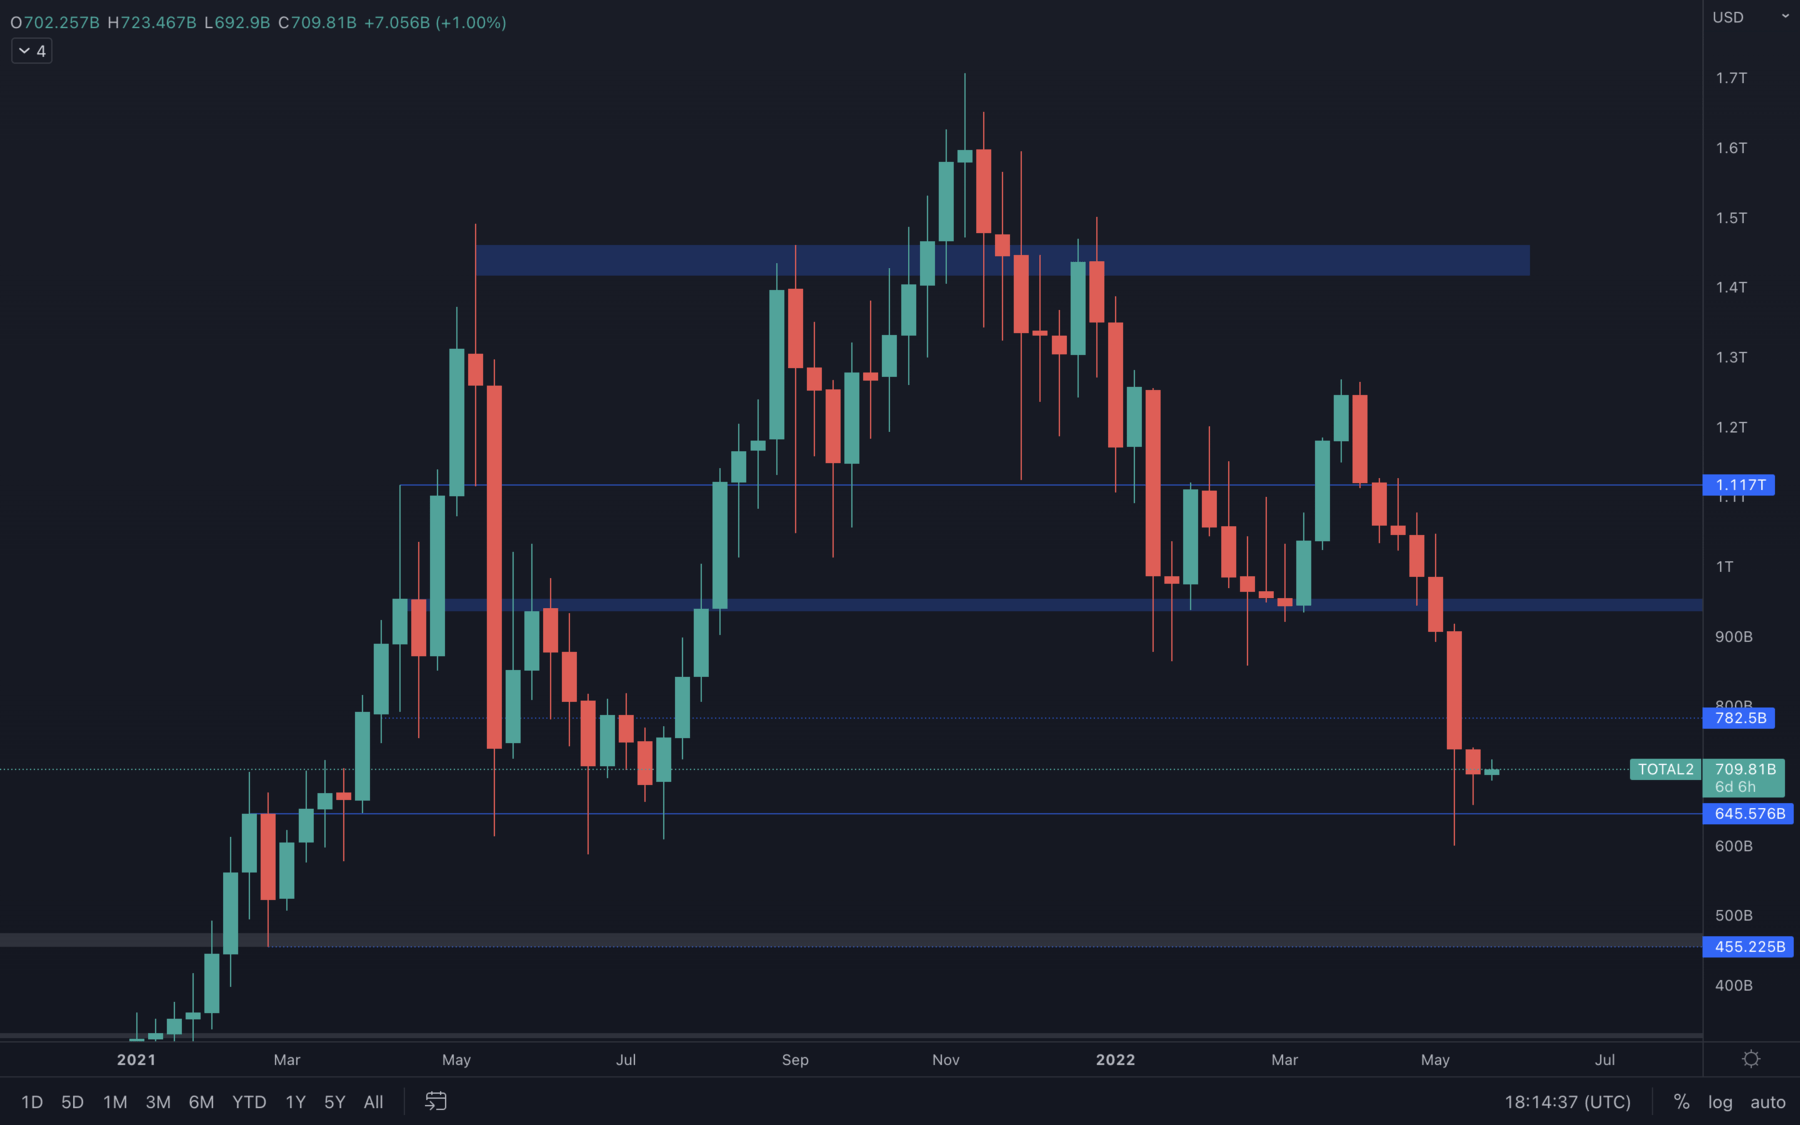 The Altcoin Marketcap looks a bit worse than the Total Market Cap, something which can maybe be caused by Bitcoin's dominance rising over the past few weeks. It's likely Bitcoin will outperform the market in the next weeks, while altcoins will either consolidate or descend. A $645B Altcoin Marketcap support test is on the cards.
Bitcoin - Technical & On-Chain Analysis
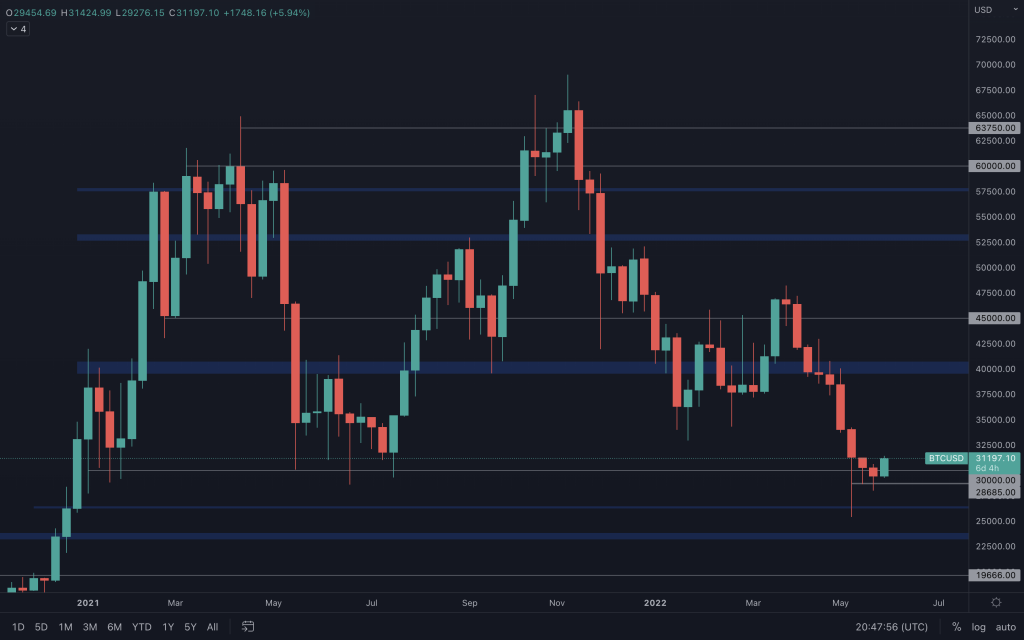 Even though we closed our 9th red week in a row last week - and that was under the $30.000 psychological & technical support level, the price is experiencing an early week rise, which is also in confluence with the solid rise on the S&P 500 Index.
A weekly closure above $30k will not only create a bullish engulfing candle on the weekly timeframe, but would also be the first green weekly candle in over 2 months. This will most likely lead to an early month rise in June, which will be cut short due to decreased volume and low buying pressure. A move higher cannot be sustained in the long run, given the current market conditions and it's best to treat the possible pump as nothing more than a trading opportunity, of course, with the right risk management strategy.
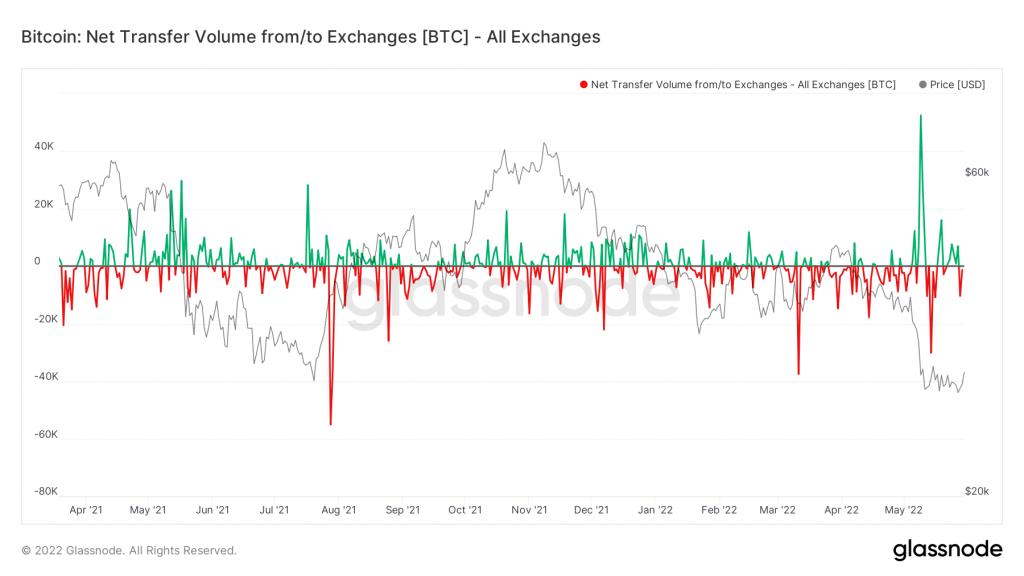
Metric 1 – Exchange Netflow Volume
We will begin by assessing the Exchange Netflow Volume (the flow of coins into or out of Exchanges). We can see there have been multiple days of inflows over the last week or two. This still suggests investors are selling their assets rather than holding or accumulating them. In order for the market to turn bullish again, we would need to begin seeing multiple large red spikes on the below graph, as this would suggest investors are accumulating once again.
Bitcoin – Exchange Netflow Volume
 Metric 2 – Net Unrealised Profit/Loss
The Net Unrealised Profit/Loss shows the difference between relative unrealised profit and relative unrealised gain. The graph above shows this in the form of sentiment, where orange suggests fear is beginning to creep into investors as many are now in unrealised losses (in a loss but have not sold their coins to realise this loss yet). We can see from the below graph, that when there are the orange lines (fear), if the yellow (optimism/anxiety) is not recovered in a relatively quick period of time, a capitulation event can occur and plunge investors into a greater unrealised loss.
Bitcoin – Net Unrealised Profit/Loss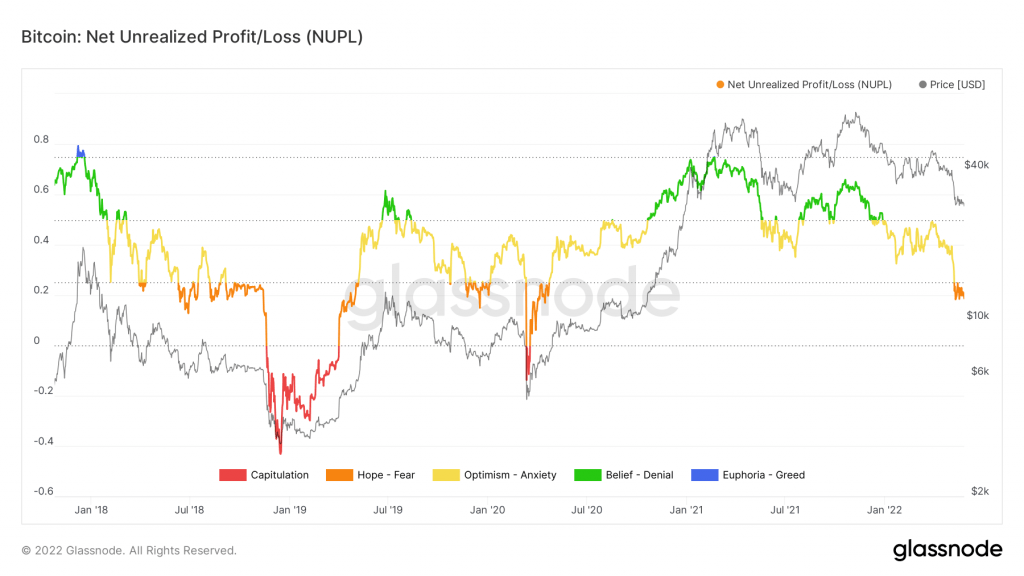 Metric 3 – MVRV Z-Score
If we now look at the MVRV Z-Score, we can see that Bitcoin is close to approaching its green ‘buy zone’. This has historically proven to be a great time to buy.
Bitcoin – MVRV Z-Score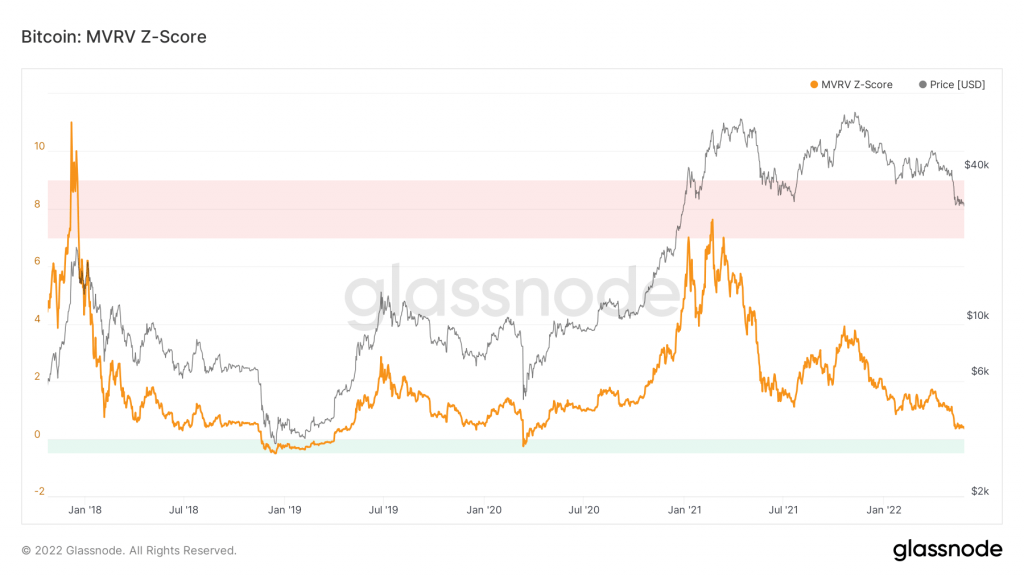
Ether - Technical & On-Chain Analysis
 ETH has had an aggressive weekly closure last week - the price dropped as low as $1700 once more and we're now seeing it just under the $2000 psychological & technical support level. A weekly reclaim above $2000 is needed for further upside, otherwise, ETH risks going a lot lower, something we can also see in the On-Chain metrics below - let's take a look at them, shall we?
Metric 1 – Exchange Netflow Volume
Compared to Bitcoin, we can see that there has been quite a different situation. Over the last 4-6 weeks, there have been several significant large red spikes (outflows of Ether from Exchanges). This is rather surprising as we would expect the price to perhaps have held up better considering these outflows of Ether from Exchanges.
Ether – Exchange Netflow Volume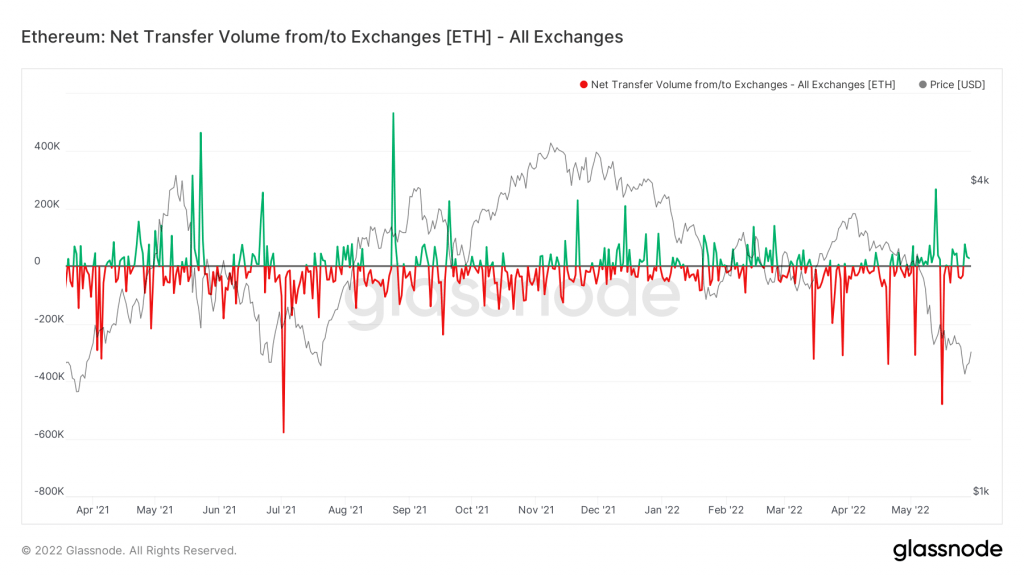
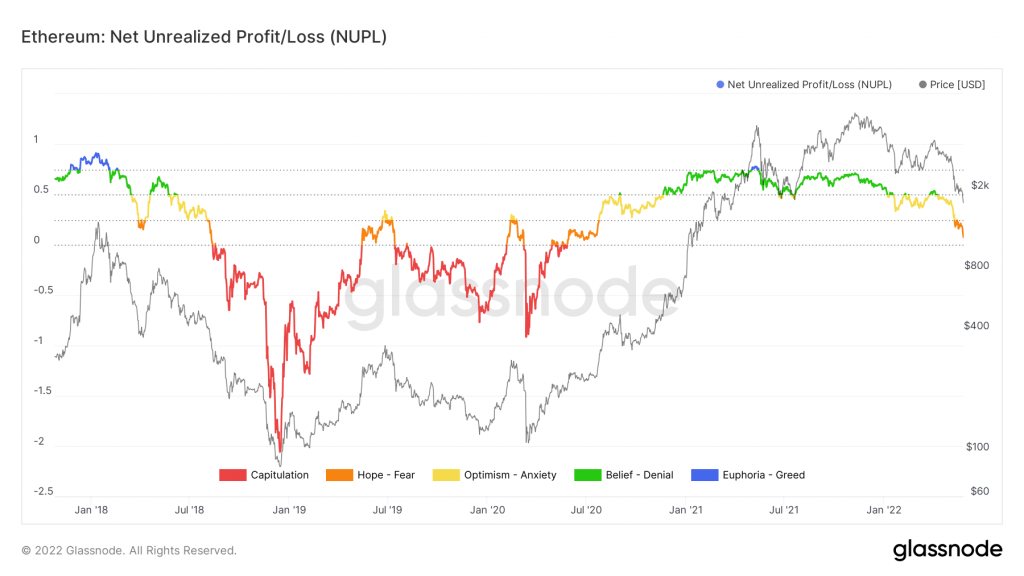
Metric 2 – Net Unrealised Profit/Loss
We can see from the below graph, that when there are the orange lines (fear), if the yellow (optimism/anxiety) is not recovered in a relatively quick period of time, a capitulation event can occur and plunge investors into a greater unrealised loss. The Ether chart suggests that Ether's price could come down considerably more if it is not recovered quickly.
Ether – Net Unrealised Profit/Loss
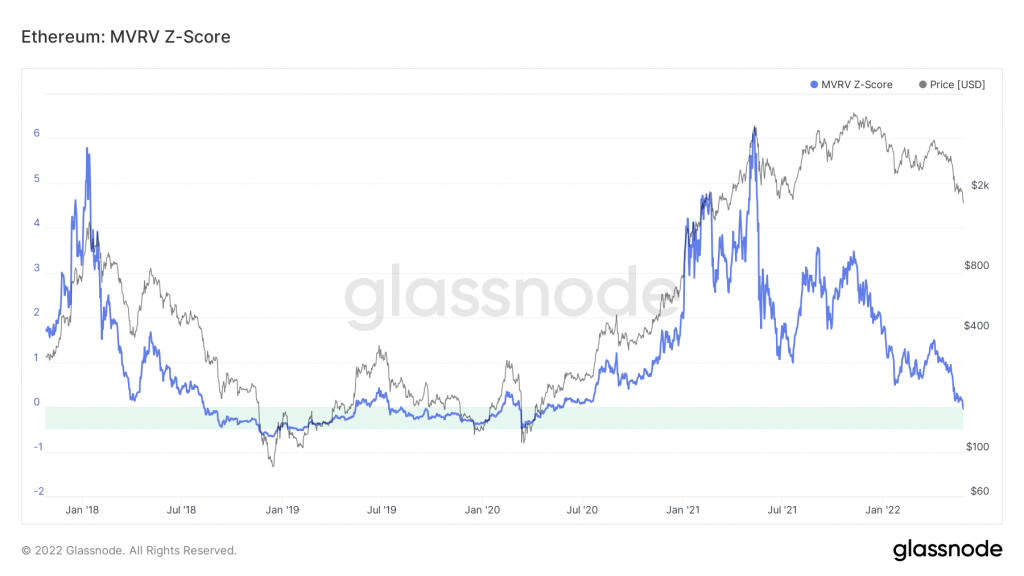
 Metric 3 – MVRV Z-Score
Compared to Bitcoin, Ether has just begun entering its green buy zone, but in prior cycles, it has tested towards the bottom of the green ‘buy zone’ and even traded under it. This suggests we may have further room to go lower in terms of prices.
Ether – MVRV Z-Score
DOT
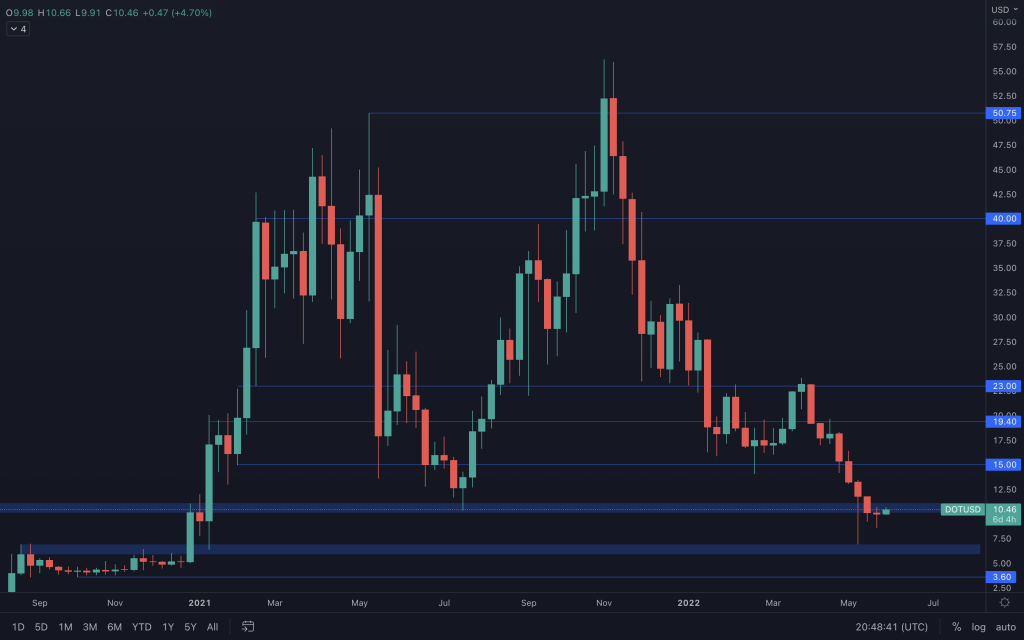 Even though DOT closed the previous week under its $10.5 - $10 support area, we're now seeing price rising due to BTC's market influence. It's safe to assume that altcoins, including DOT will get outperformed by Bitcoin in the coming weeks, as its dominance has been rising for some time and is still rising at the moment of writing. A weekly reclaim above $10.5 will indicate DOT can test $15 at some point in the near future.
SNX
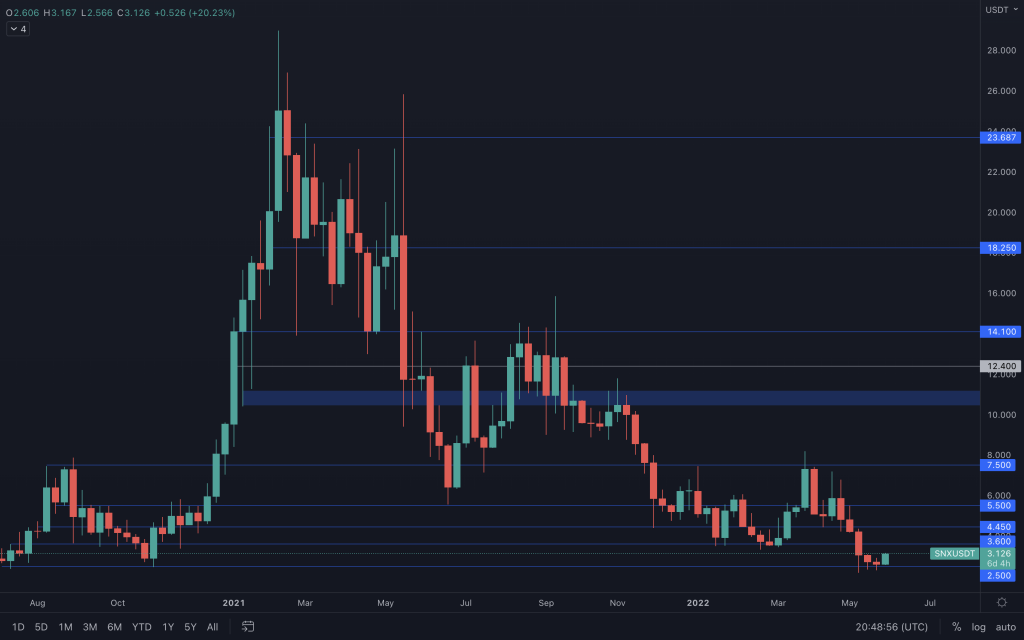 SNX is having a strong early week rise, stronger than most assets in the list - this indicates increased demand. Because price was able to hold the $2.5 support level perfectly, we can now expect SNX to test the $3.6 and $4.45 resistance levels in the coming weeks.
RUNE
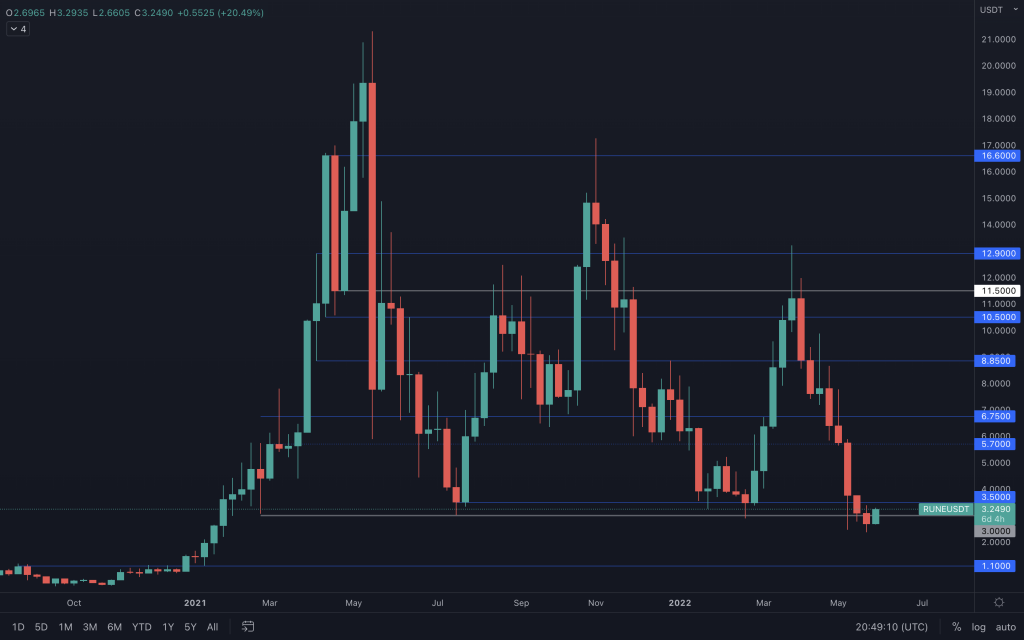 Same as DOT, RUNE closed the previous week under a crucial support level but is now back above it. A weekly closure above last week's weekly close ($3.10) will serve as a bullish engulfing candle on the weekly timeframe that will most likely lead RUNE to the $5.7 resistance level. In order for that to happen, RUNE also needs to break above its $3.5 intermediate resistance level, so that's what we will be watching for this week.
SOL
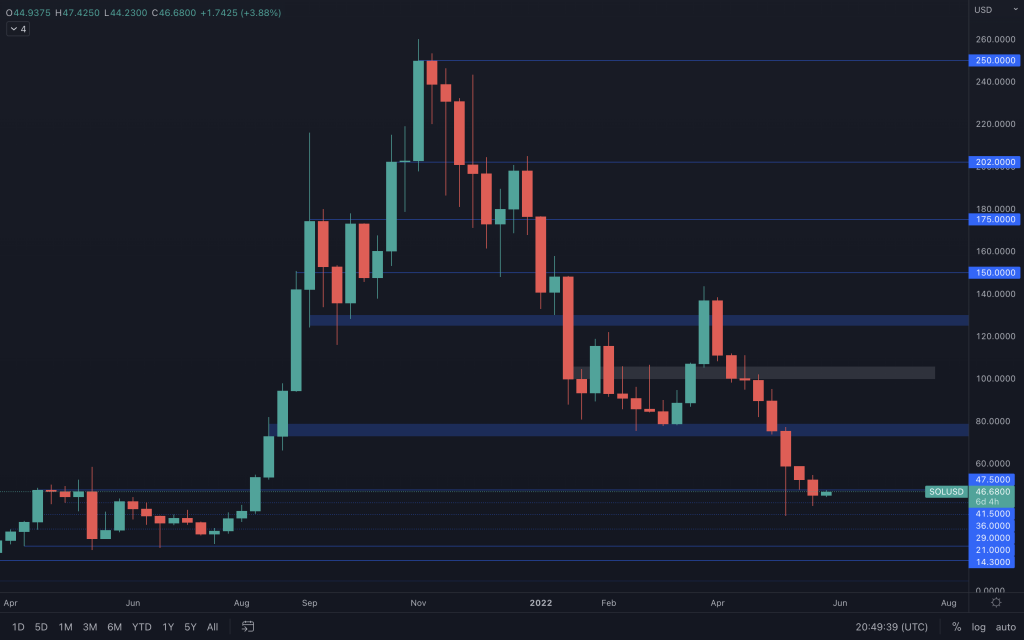 SOL looks defeated - the $47.5 support level has been lost after price closed a weekly candle under. It's extremely important for SOL to reclaim that level this week, otherwise it risks going lower, as there's less demand on SOL than any other assets in the list.
SRM
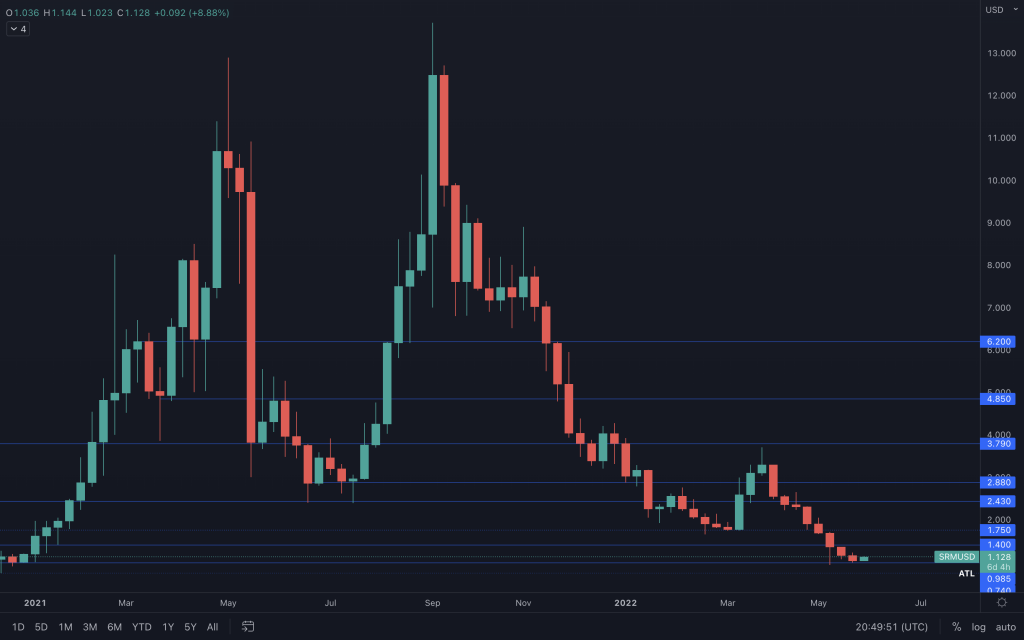 No weekly closure under $1, which means SRM now has no signs of further downside until that level is lost. We can expect SRM to range between $1.40 and $1 and only a break above or under these levels will indicate where SRM is going next.
FTT
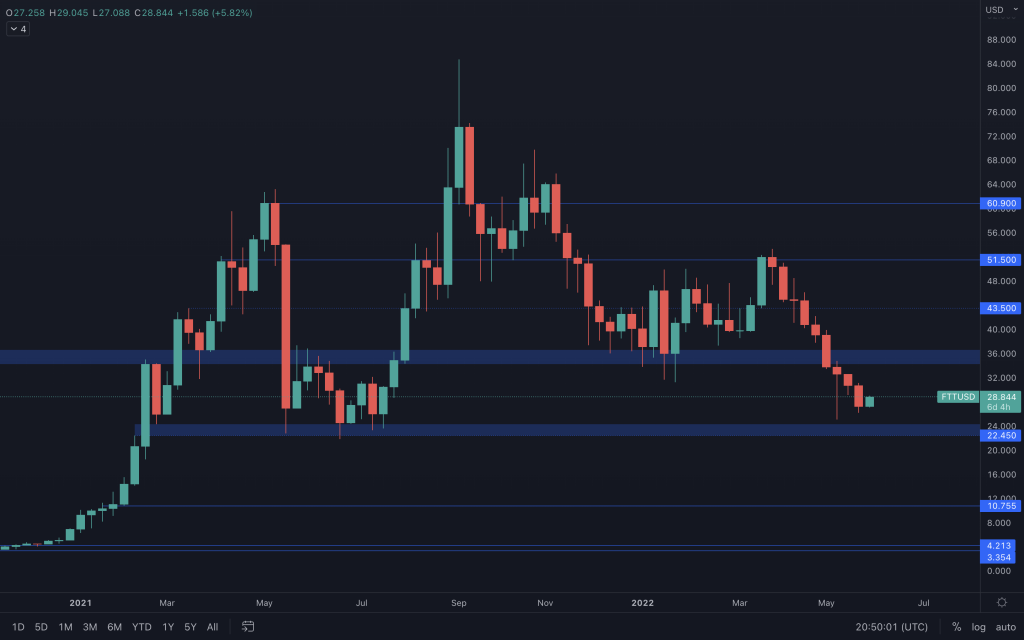 FTT has had an aggressive weekly closure last week, which might indicate that even with the market rising, FTT will not be able to go that far up, as the selling pressure outweights the buying pressure. For now, it looks like FTT is aiming for a $22.45 support test.
MINA
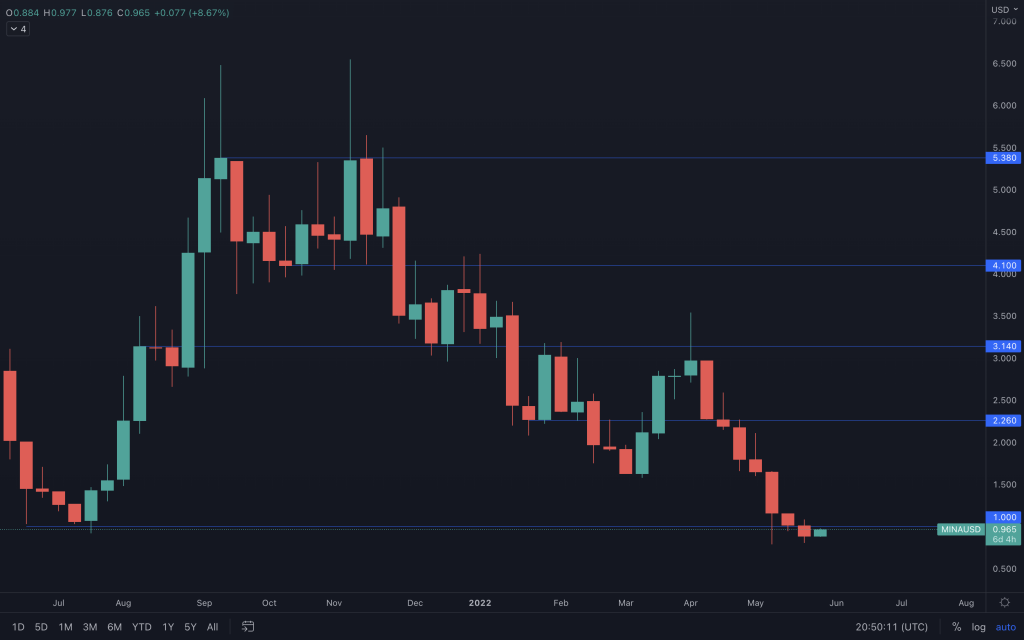 MINA closed its lowest weekly closure ever last week, under the $1 psychological & technical support level and is now trying to break above it. If MINA isn't able to reclaim $1 this week, we can expect further downside and a formation of all time lows.
dYdX
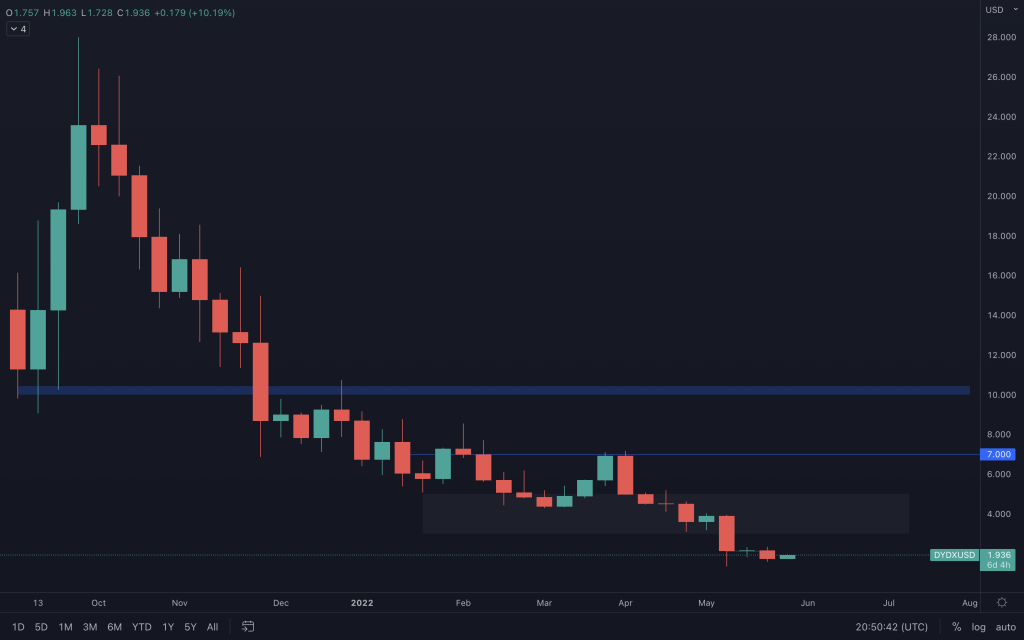 dYdX followed the market last week and invalidated a potential rise. Only thing we can do here is wait until bullish candles form, as dYdX has been forming lower weekly closures on a weekly basis. It's likely the price of dYdX will also be influenced by a Bitcoin rise, but not to the biggest extent, as its dominance continues to rise which will leave altcoins behind.
THOR
Summary
It can be said that several of the metrics suggest that a macro bottom is still not in, but they suggest a local bottom may be in. With the macro uncertainties on the horizon, it will likely be difficult for all relief rallies to get any meaningful momentum. Investors would be encouraged to remain cautious until the number of uncertainties begins to come down.Even though we've identified technical & on-chain factors that indicate prices will rally in the coming weeks, it's best to not let our emotions act instead of ourselves and also understand that the risks outperform the rewards here. Trade responsibly, invest with caution and most importantly, don't let greed take over your actions.
Recommended from Cryptonary


