Save 23% ($351) & Get a Free 1-1 Call with our Team ⏰ : 0d 2h 59m 43s

Disclaimer: Not financial nor investment advice. You are responsible for any capital-related decisions you make, and only you are accountable for the results.
Macro
After last week’s 8.6% inflation print, the markets’ eyes will be on the FED Interest Rate Decision this week on Wednesday (16/06/2022). It has been expected that the FED will raise rates by 50 basis points at the June and July meeting, however, some are now calling for a 75 basis point increase in the June meeting (this Wednesday). FED Chair Powell has been very generous in giving forward guidance to the market with regards to what the FED is going to do in the proceeding months. Therefore, it would be unlikely that he raises rates by 75 basis points in the June meeting and sticks to just doing 50. However, he may allude to the fact that the FED is ‘actively considering’ 75 basis points at the following meeting in July.With the unemployment rate at 3.6% (very healthy), the FED realised they can tighten into this without coming under any significant pressure from the people. If unemployment was at 5%, then this would be a different situation. Alongside this, the S&P is only down 19% from its highs, which all-in-all is not too bad. So, the FED may look at this and also think that they’re not under a huge amount of pressure here and therefore they may not be worried about it coming down even further. No, unfortunately the FED does not care how much our crypto bags are down either. So, the question is - can they go down further? Let's find out...
TLDR
- Bitcoin's price has now reached the 200 Moving Average value on the weekly timeframe - this acted as a bear market bottom in the past.
- Bitcoin's dominance is showing exhaustion upon testing a key resistance level.
- Whales are selling/staying away, while retail continues to accumulate.
- Last week’s high inflation print may mean the FED has to become more aggressive than originally thought, in order to combat inflation. As a result, this would negatively affect risk-on (crypto) asset prices.
- The Net Realised Profit/Loss suggests investors hold little conviction for higher prices and therefore have sold coins into any rallies that have come.
- The MVRV Z-Score and Net Unrealised Profit/Loss shows that prices may come down further, but that we have begun to enter zones where we could consider buying in in the following weeks/months.
Total Market Cap
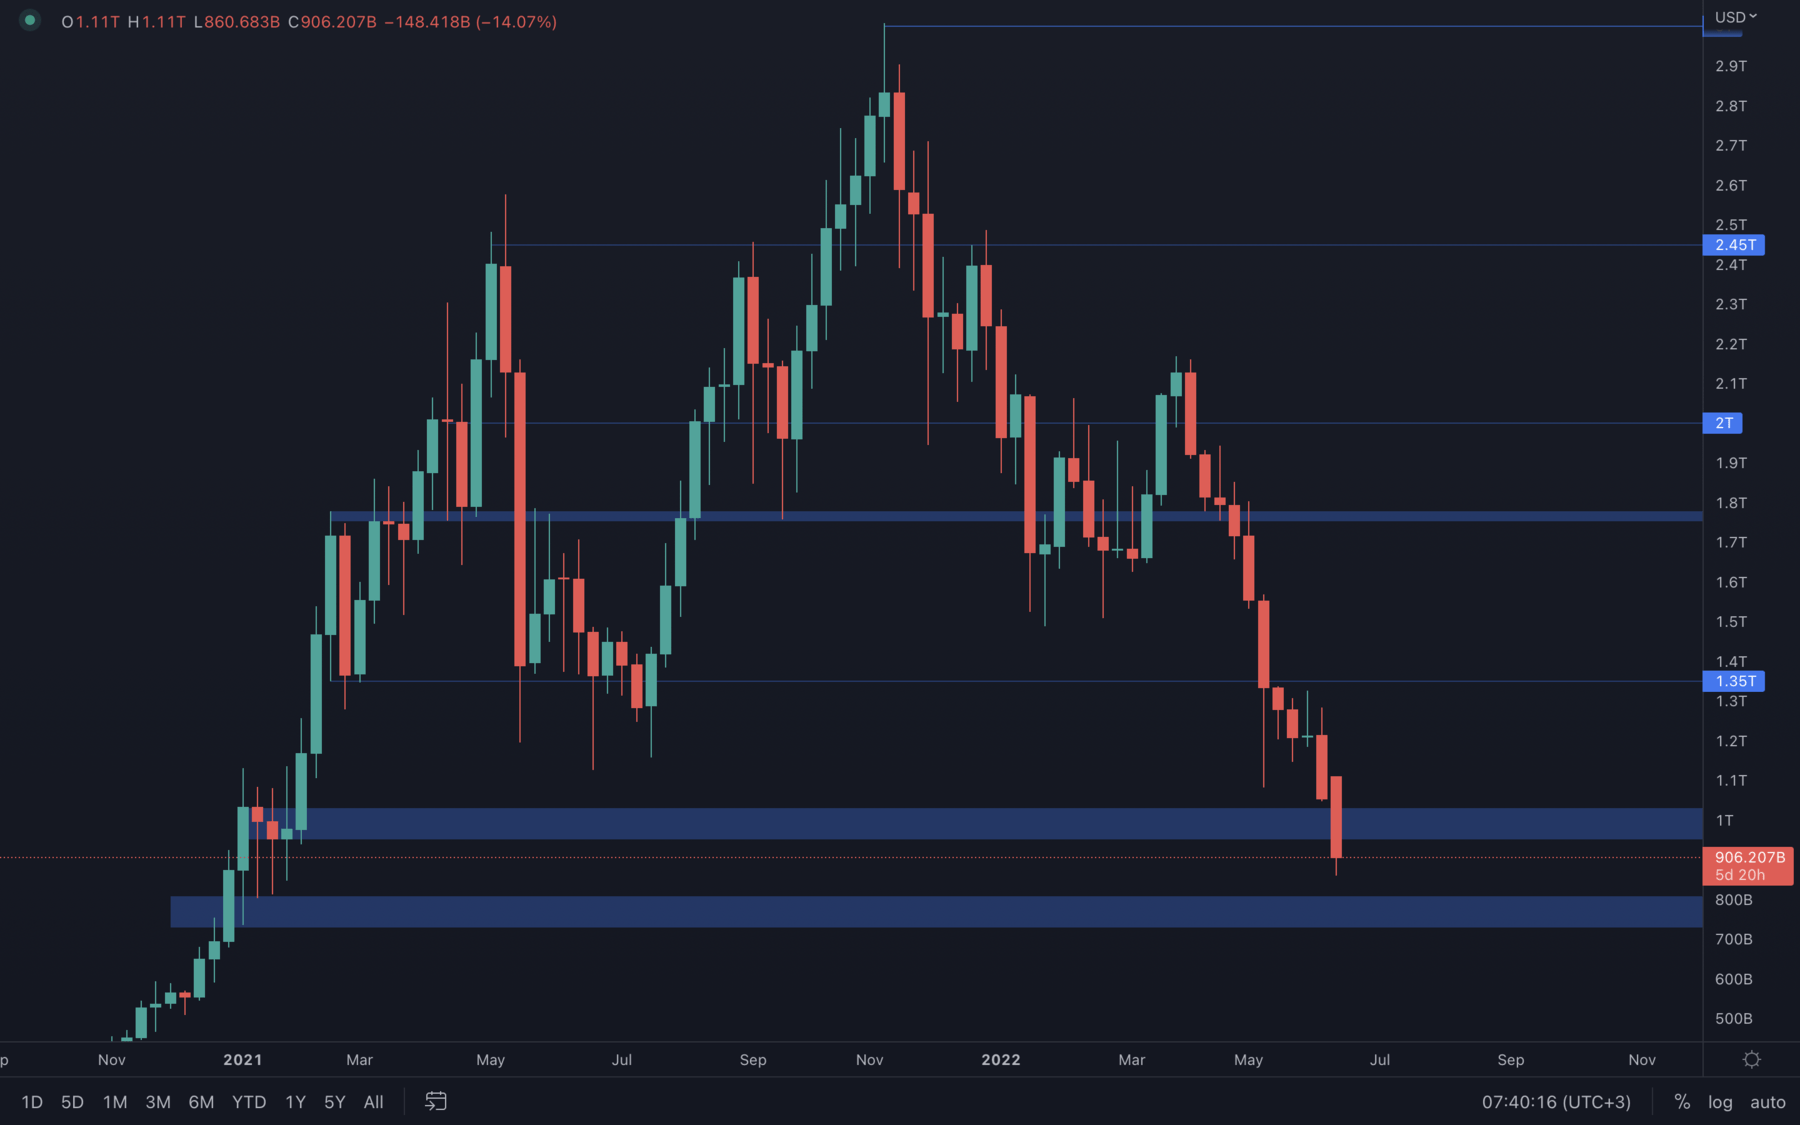 After the total market cap closed an extremely bearish candle last week, all odds of a relief rally have been taken out of the equation - at least for now. The total market cap is now even below its $1T psychological & technical support level and a weekly closure under would bring price to the $800B - $700B support area - this is equivalent with a $20k BTC.
Altcoins Market Cap
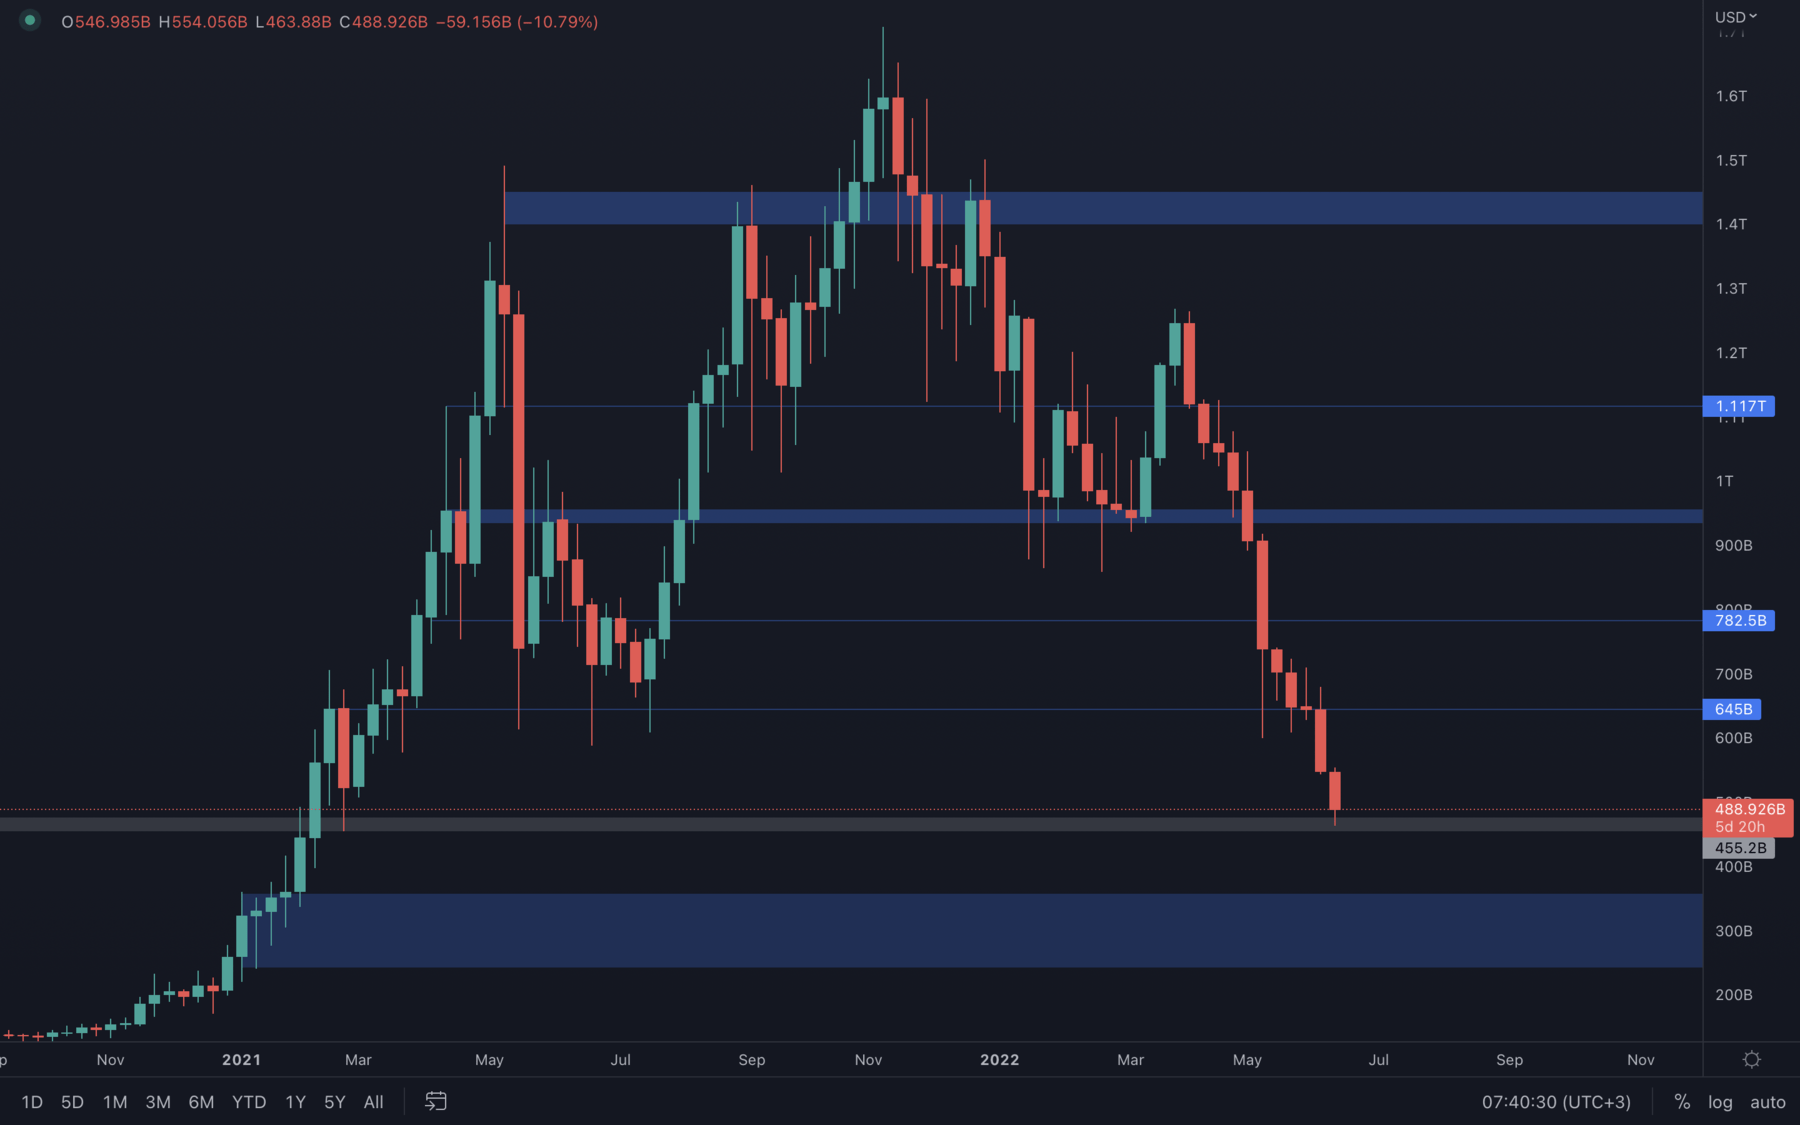 The Altcoins market cap isn't looking too great either, but it is just above an intermediate weekly support level which must be maintained in order to avoid further downside. Due to the previous rise on Bitcoin's dominance, alts have experienced an aggressive move down compared to Bitcoin, but with the altcoins market cap sitting just above a weekly support level and the Bitcoin dominance showing signs of exhaustion (scroll down for chart), it's more than possible to see capital starting to rotate into alts. However, the macro conditions haven't changed, selling pressure still continues to rule the market and, at least for now, we maintain a bearish bias overall, with the possibility of short-lived rises in price that will not change the higher timeframe market structure anytime soon.
Bitcoin - Technical & On-Chain Analysis
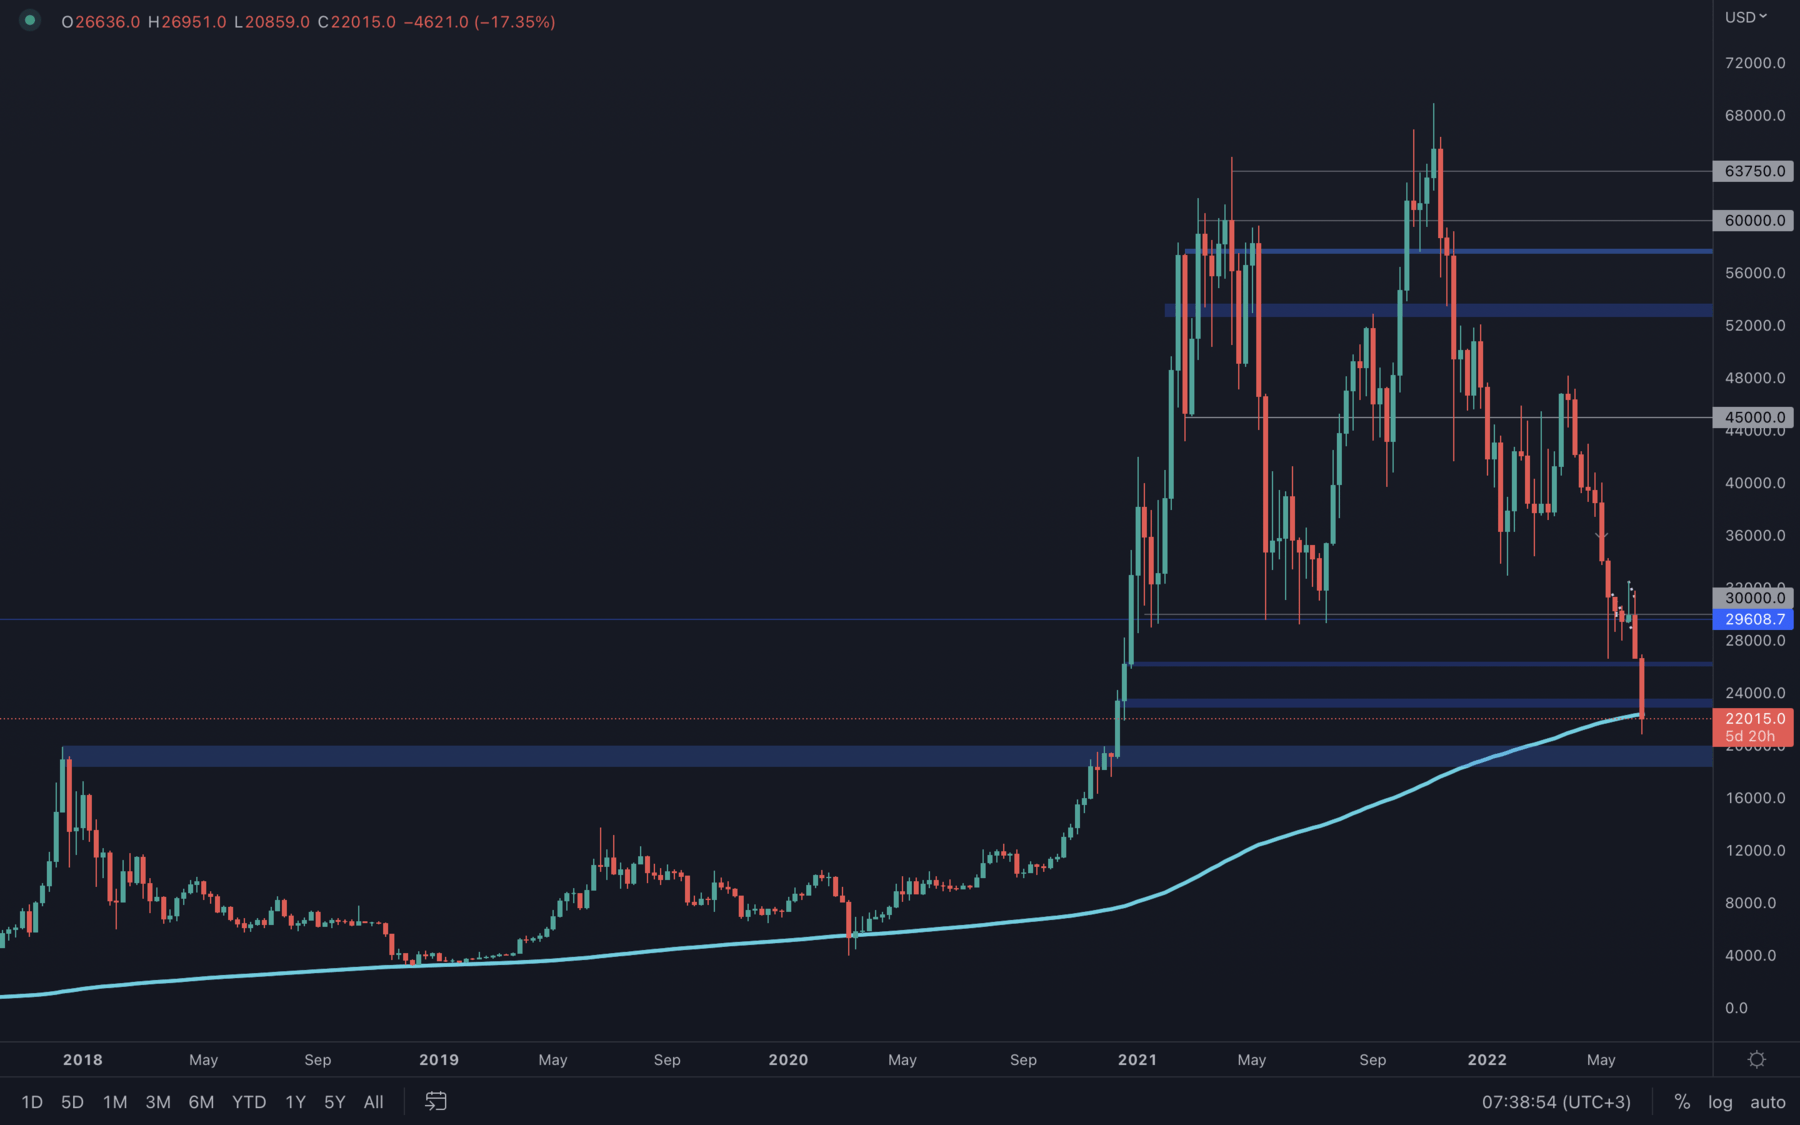 Probably the most interesting week we've seen for BTC. After a 15% loss in a single day, Bitcoin came back to test the 200 Moving Average on the weekly timeframe, which is currently sitting at ~$22k. The reason why we're mentioning this now is because the 200 Moving Average (MA) has acted as a bear market support level multiple times in the past, as we can see in the left side of the chart. Only thing we can deduce from here is that this can become the bear market bottom once again, but it is possible we could seen even lower prices caused by increased selling pressure - think of a capitulation style event. This possible drop may stop at the 2018 all-time high, but for now, maintaining price above the weekly 200 MA is extremely important.
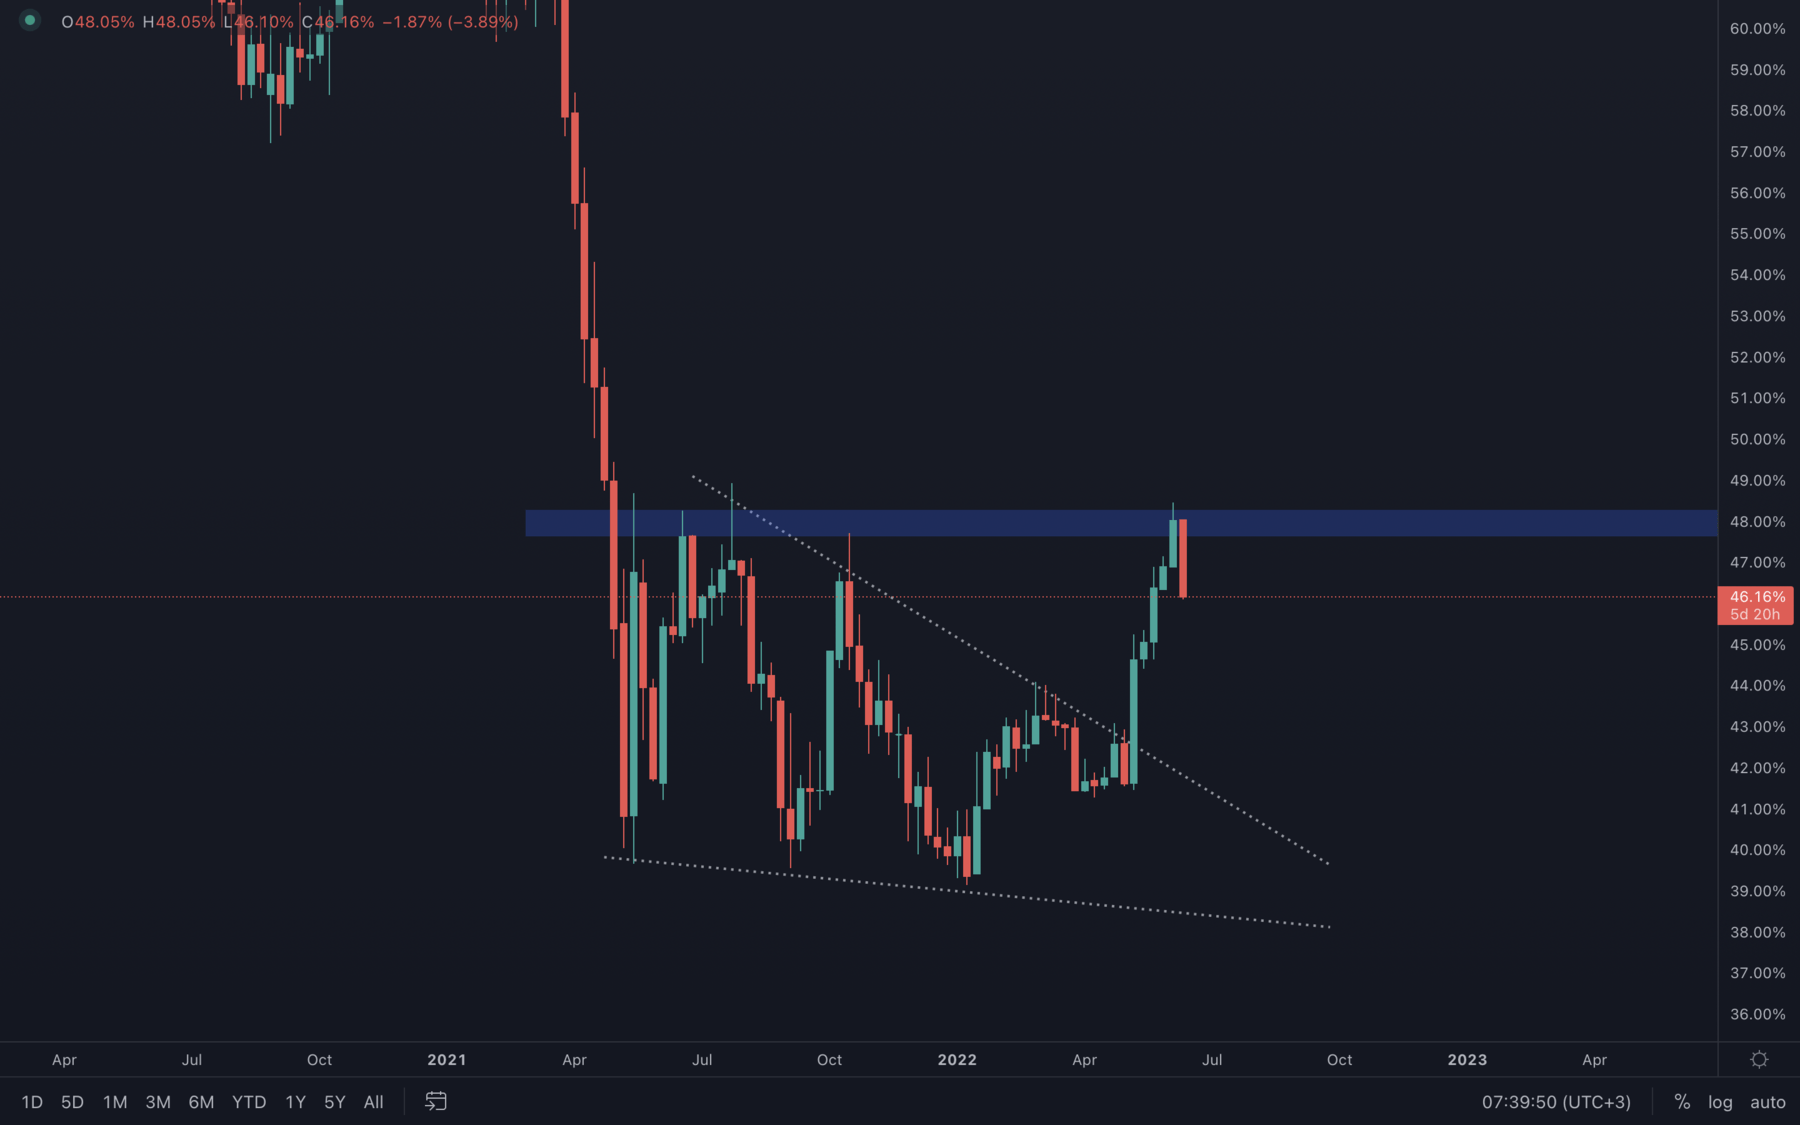
Another interesting thing to mention here, as confluence for the 200 MA weekly test is the fact that Bitcoin's dominance is showing signs of exhaustion. Its dominance just reached a key level and can now be seen getting rejected, which might imply that capital can soon start flowing into alts, or at least outside of BTC (stable coins). The current selling pressure stops that, however, as buyers are unable to maintain Bitcoin at stable prices. What we'd like to see in the coming weeks is for the market to take a timeout and start to range, otherwise this downtrend can continue further.
BTC Dominance
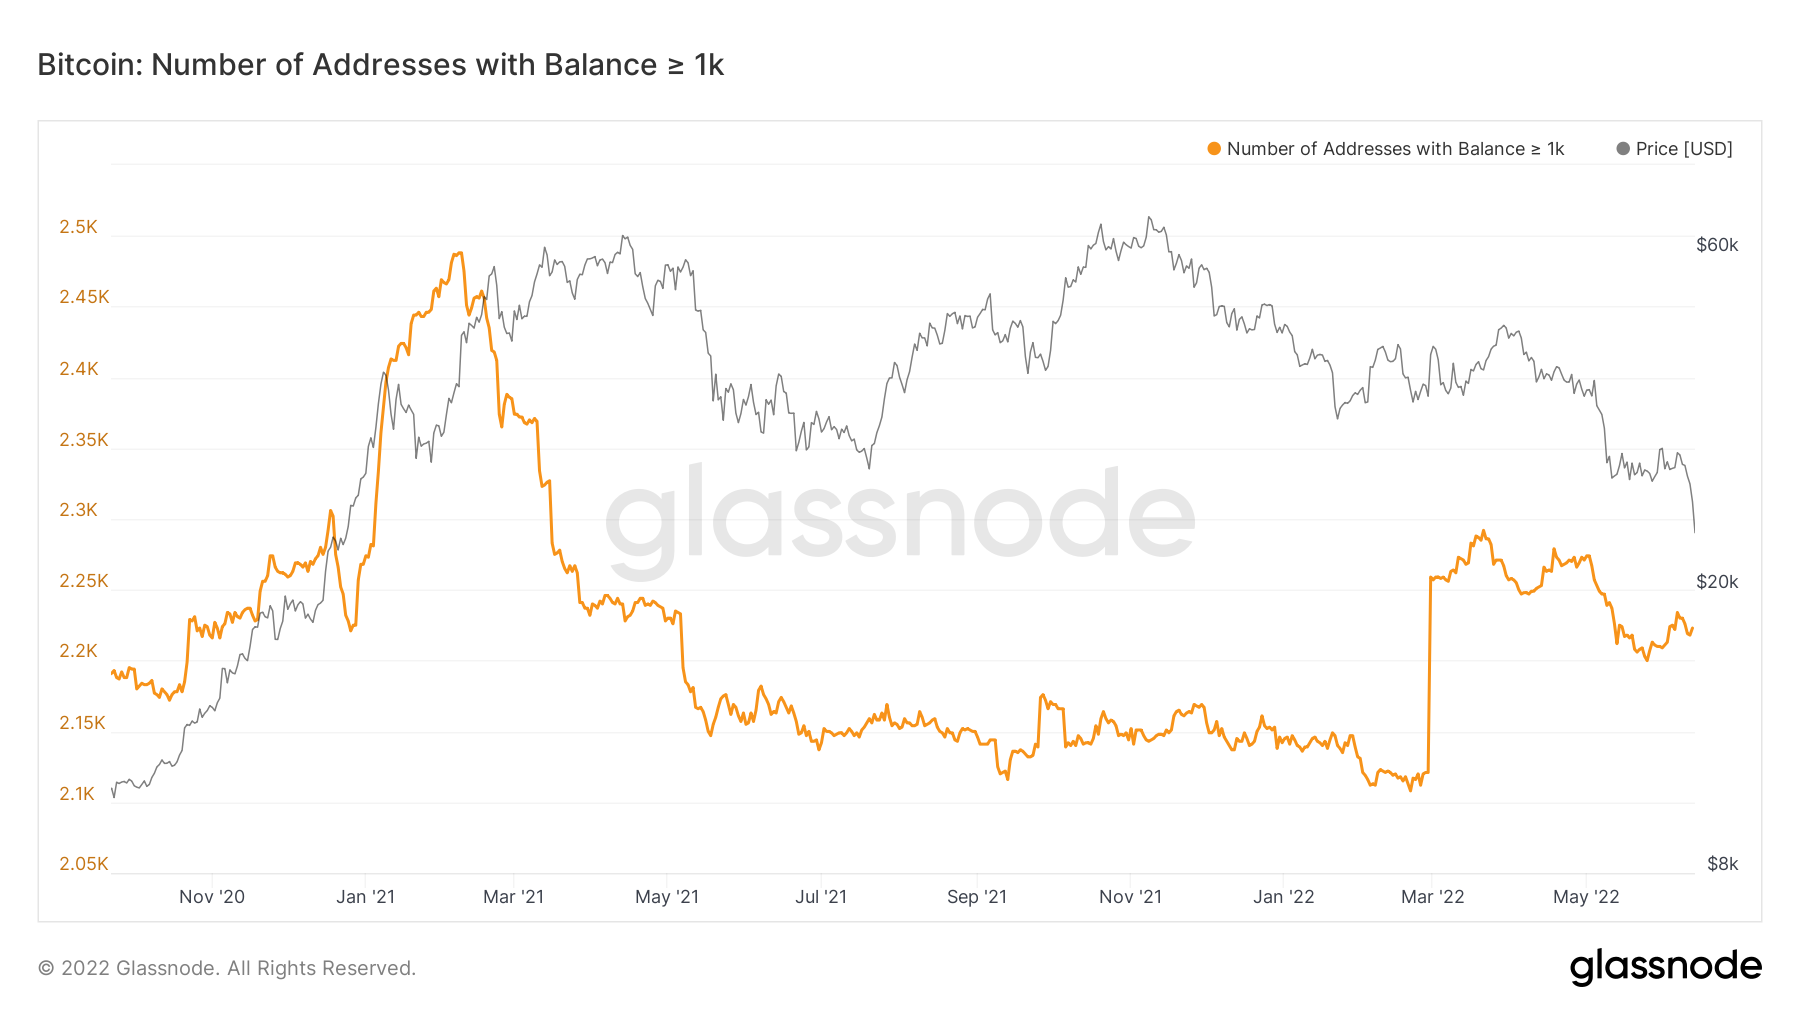
The first metric we will cover is the Address Balances, in order to assess if the largest wallet holders have begun to risk back on yet. We can see from the below chart that the Addresses with Balance > 1,000 Bitcoin has not increased hugely. The general trend is downwards, i.e., this wallet cohort are not adding to their balances. We track this wallet cohort as they are historically the most profitable.
Many of the wallet cohorts with less Bitcoin (shrimps), are seeing the number of wallets increase, which is typically the behaviour we have seen since the summer of 2021. We look to do the opposite of what these wallet cohorts are doing.
Bitcoin – Addresses with Balance > 1,000 Bitcoin
Metric 2 – Net Realised Profit/Loss
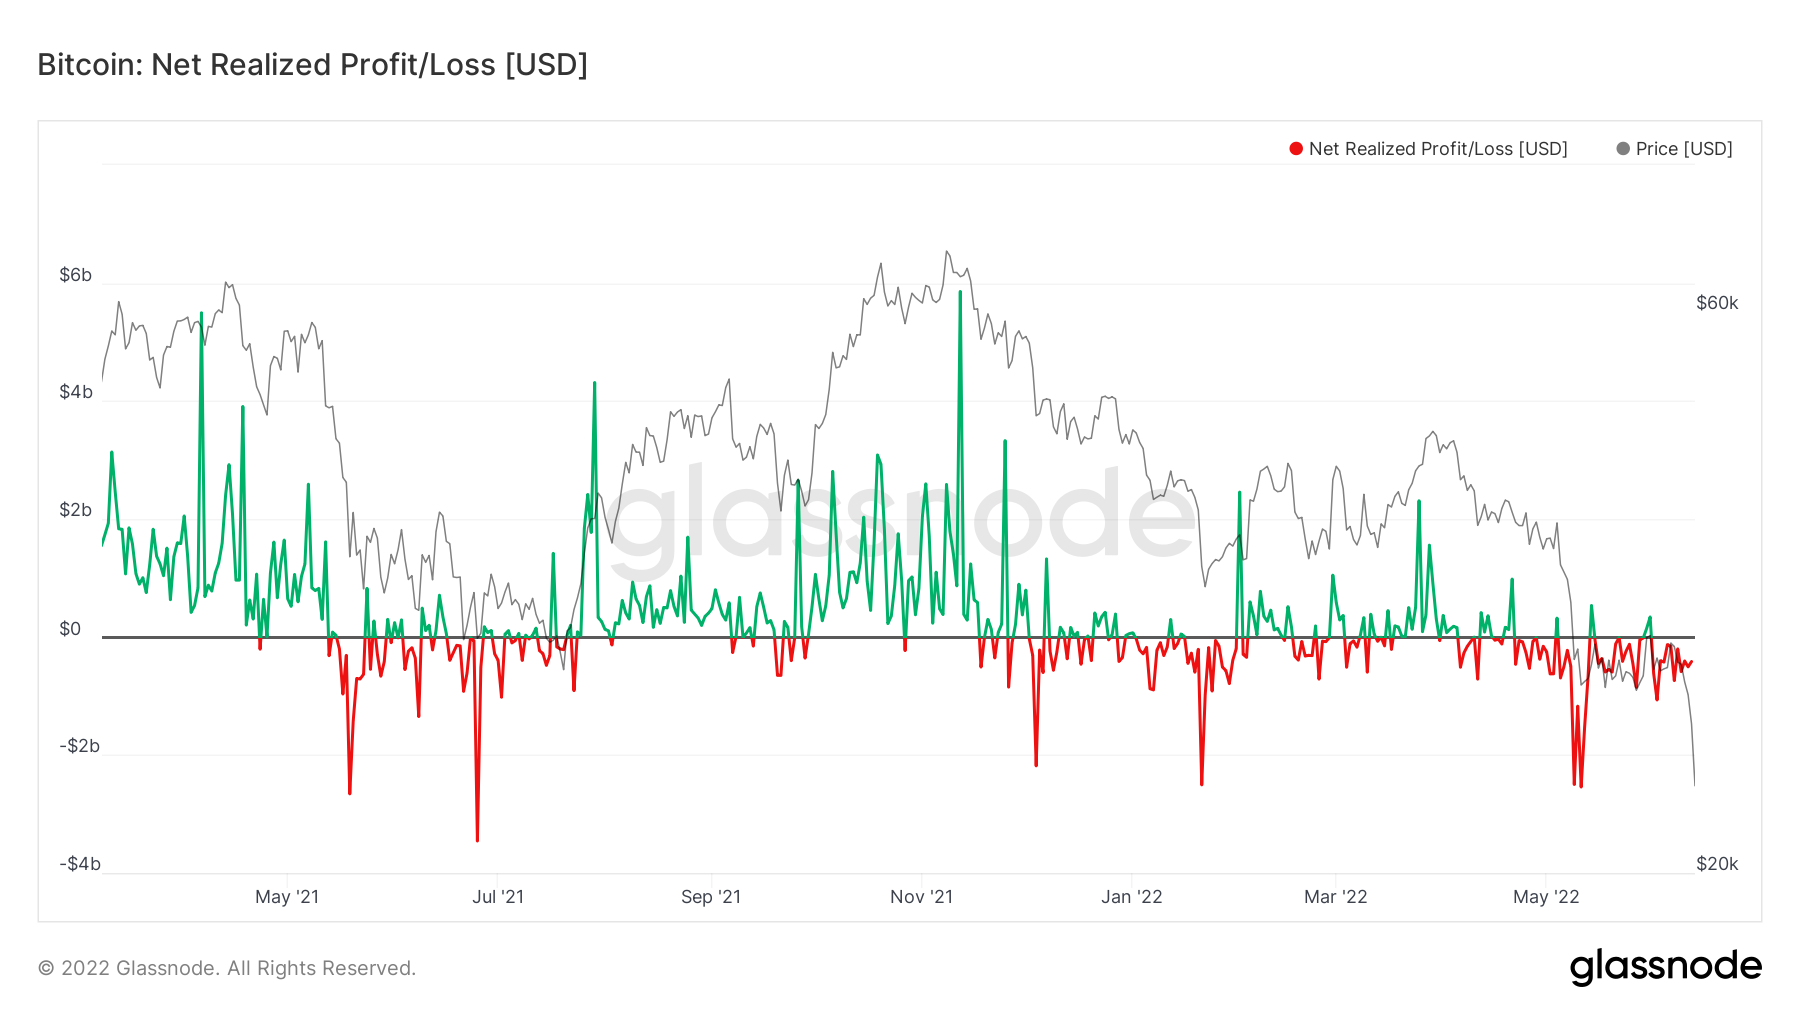
The Net Realised Profit/Loss is the net profit or loss of all coins that are sold to the market. We can see in the below graph that most of the past month has been red and the flat horizontal 0 line has acted almost as a resistance to the red/green line. What this means is that investors are selling their coins in losses or if they’re reaching a break-even level, they’re selling (meeting the black horizontal 0 line is that break-even line). However, what they’re not doing is holding their coins with any conviction that prices will go higher, and they’ll be able to sell their coins into those higher prices.
Note: This metric is not available for Ether, however, it could be taken that this metric is likely similar for Ether.
Bitcoin – Net Realised Profit/Loss
Metric 3 – Net Unrealised Profit/Loss
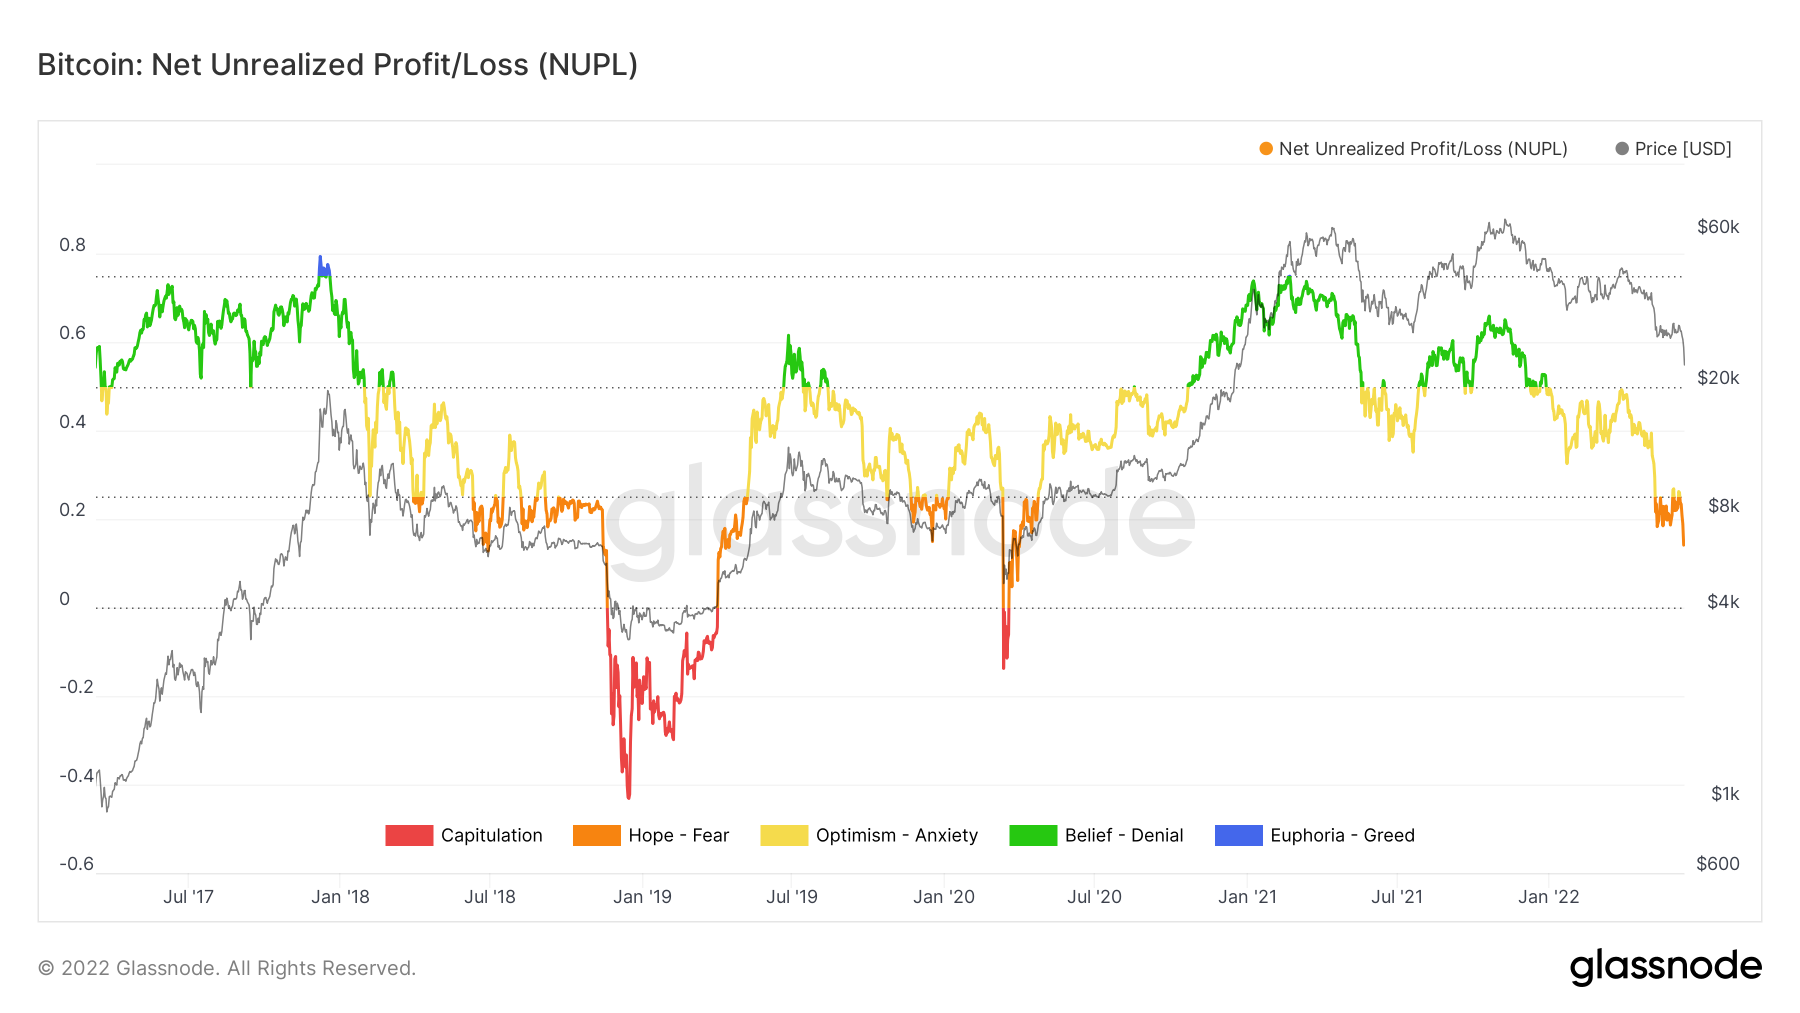
If we now turn to the Net Unrealised Profit/Loss (this is the unspent coins i.e., coins that have not yet been sold), we can see from the zoomed out chart below that historically we have had large moves down on this metric when a significant proportion of investors have gone into unrealised losses after prices have collapsed. From looking at the below charts, it looks as if we haven’t reached the pain threshold that would suggest that we have hit a bottom just yet.
Bitcoin – Net Unrealised Profit/Loss
Metric 4 – MVRV Z-Score
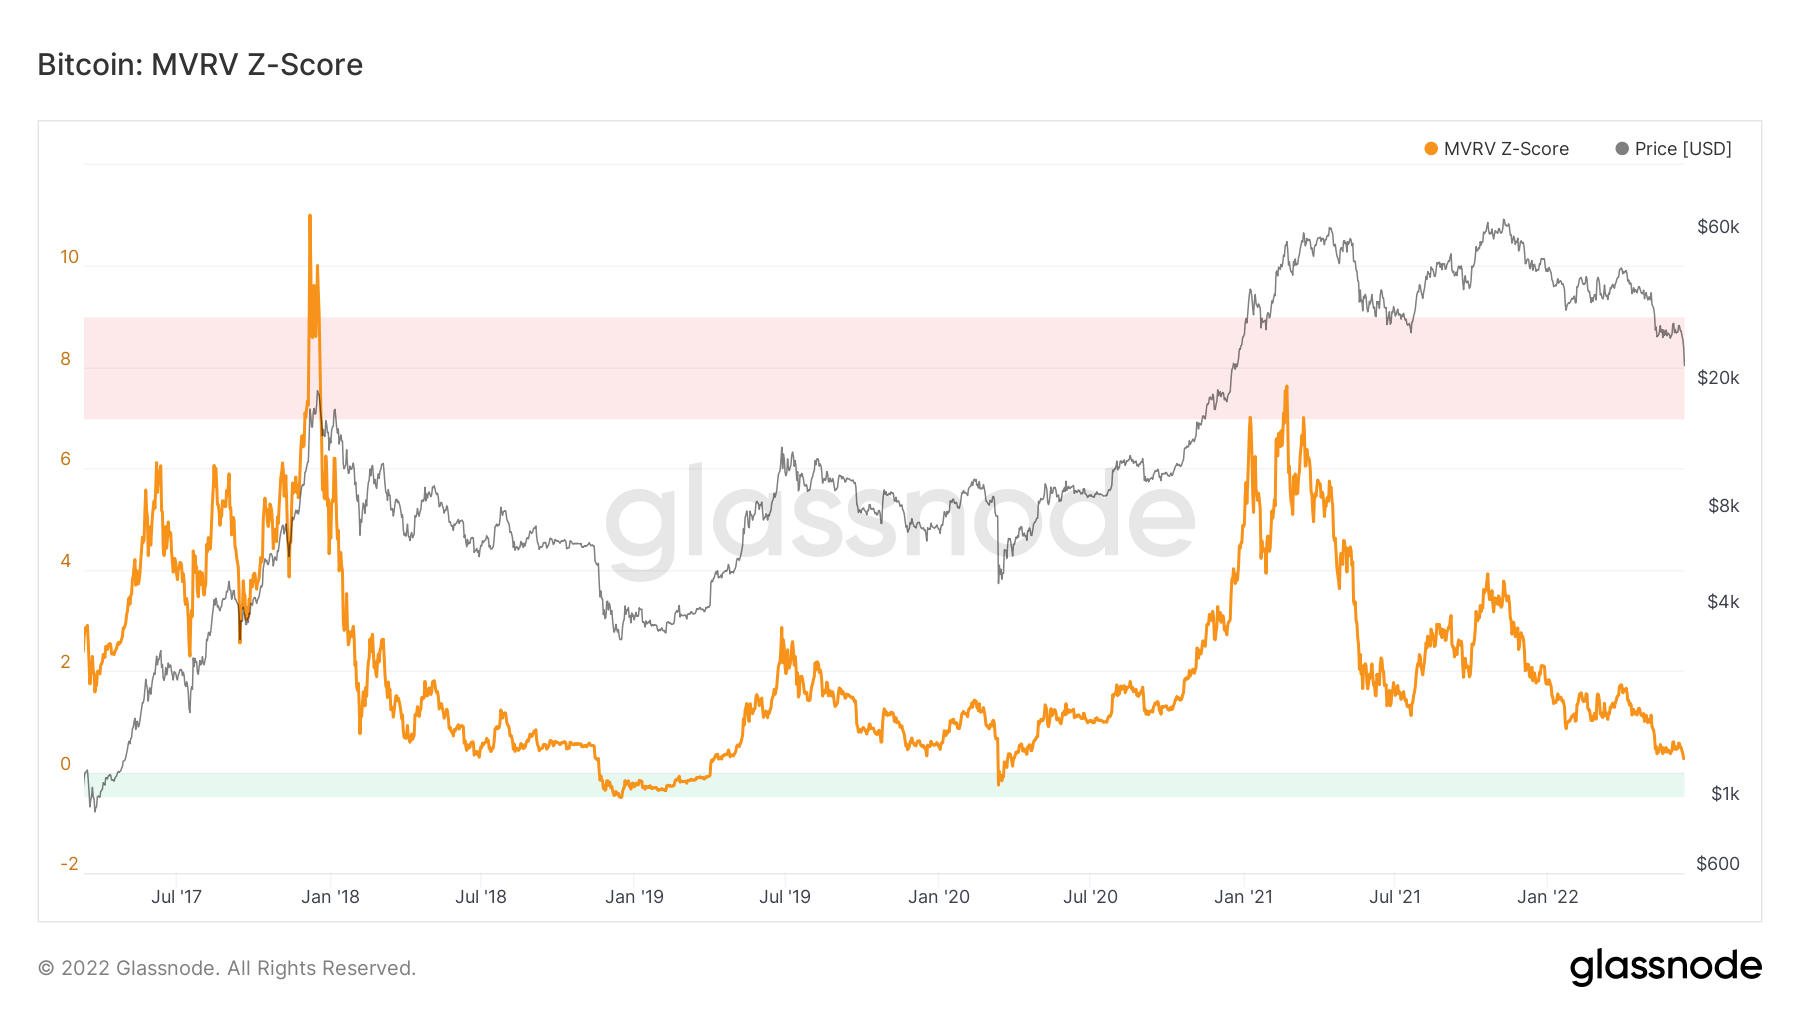
The MVRV Z-Score shows when Bitcoin is undervalued or overvalued relative to it’s realised price. The zoomed-out metric below shows that Bitcoin is very close to reaching its green zone.
Bitcoin – MVRV Z-Score
Ether - Technical & On-Chain Analysis
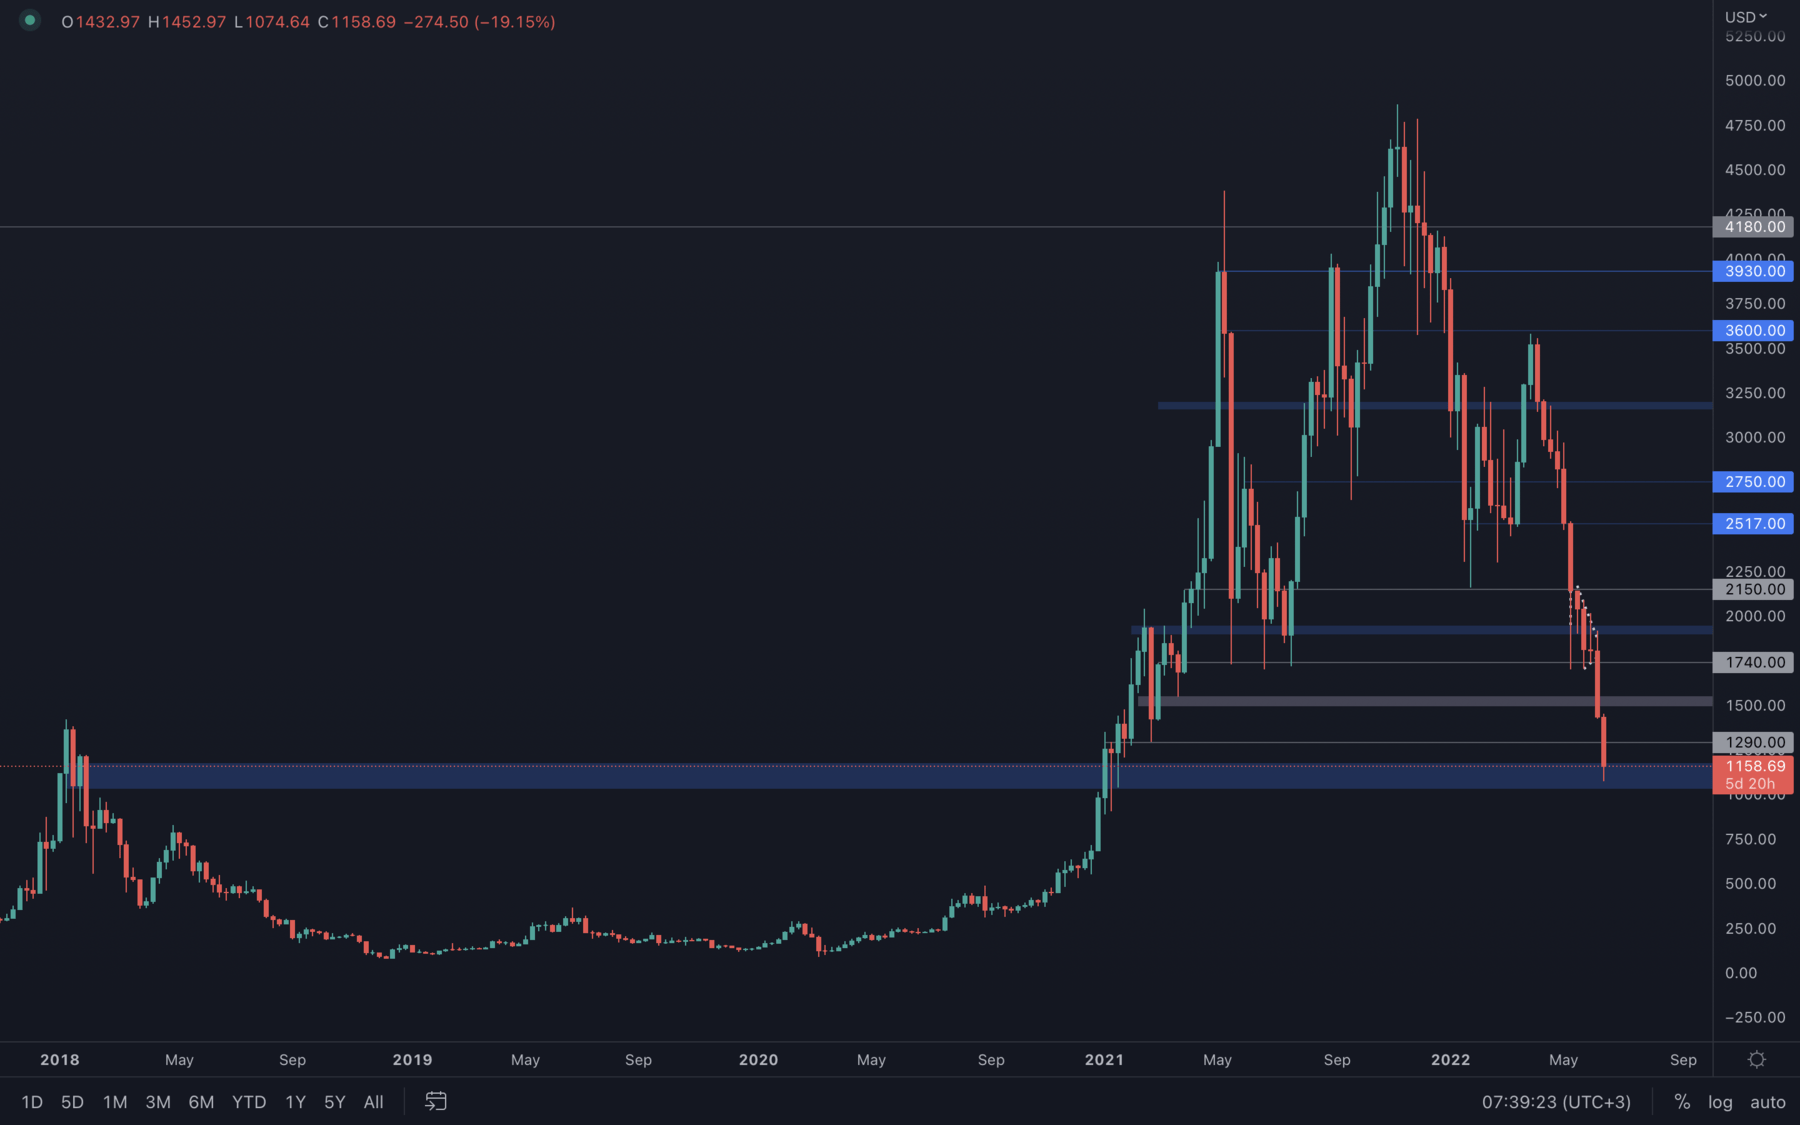 After losing $1500 by a weekly candle closure under, ETH rapidly came back to test the psychological & technical level of $1000 and is now sitting under its 2018 all-time high. Maintaining its price above $1000 is extremely important, otherwise ETH risks going as low as $600 - $800.
Compared to Bitcoin, Ether hasn't had a green weekly closure yet, which even though we were already aware of the fact, it is caused by Bitcoin's dominance increasing over the course of the past few weeks. Its dominance can now be seen getting rejected from a key level, so we'll continue to monitor the Bitcoin dominance carefully and give you daily updates.
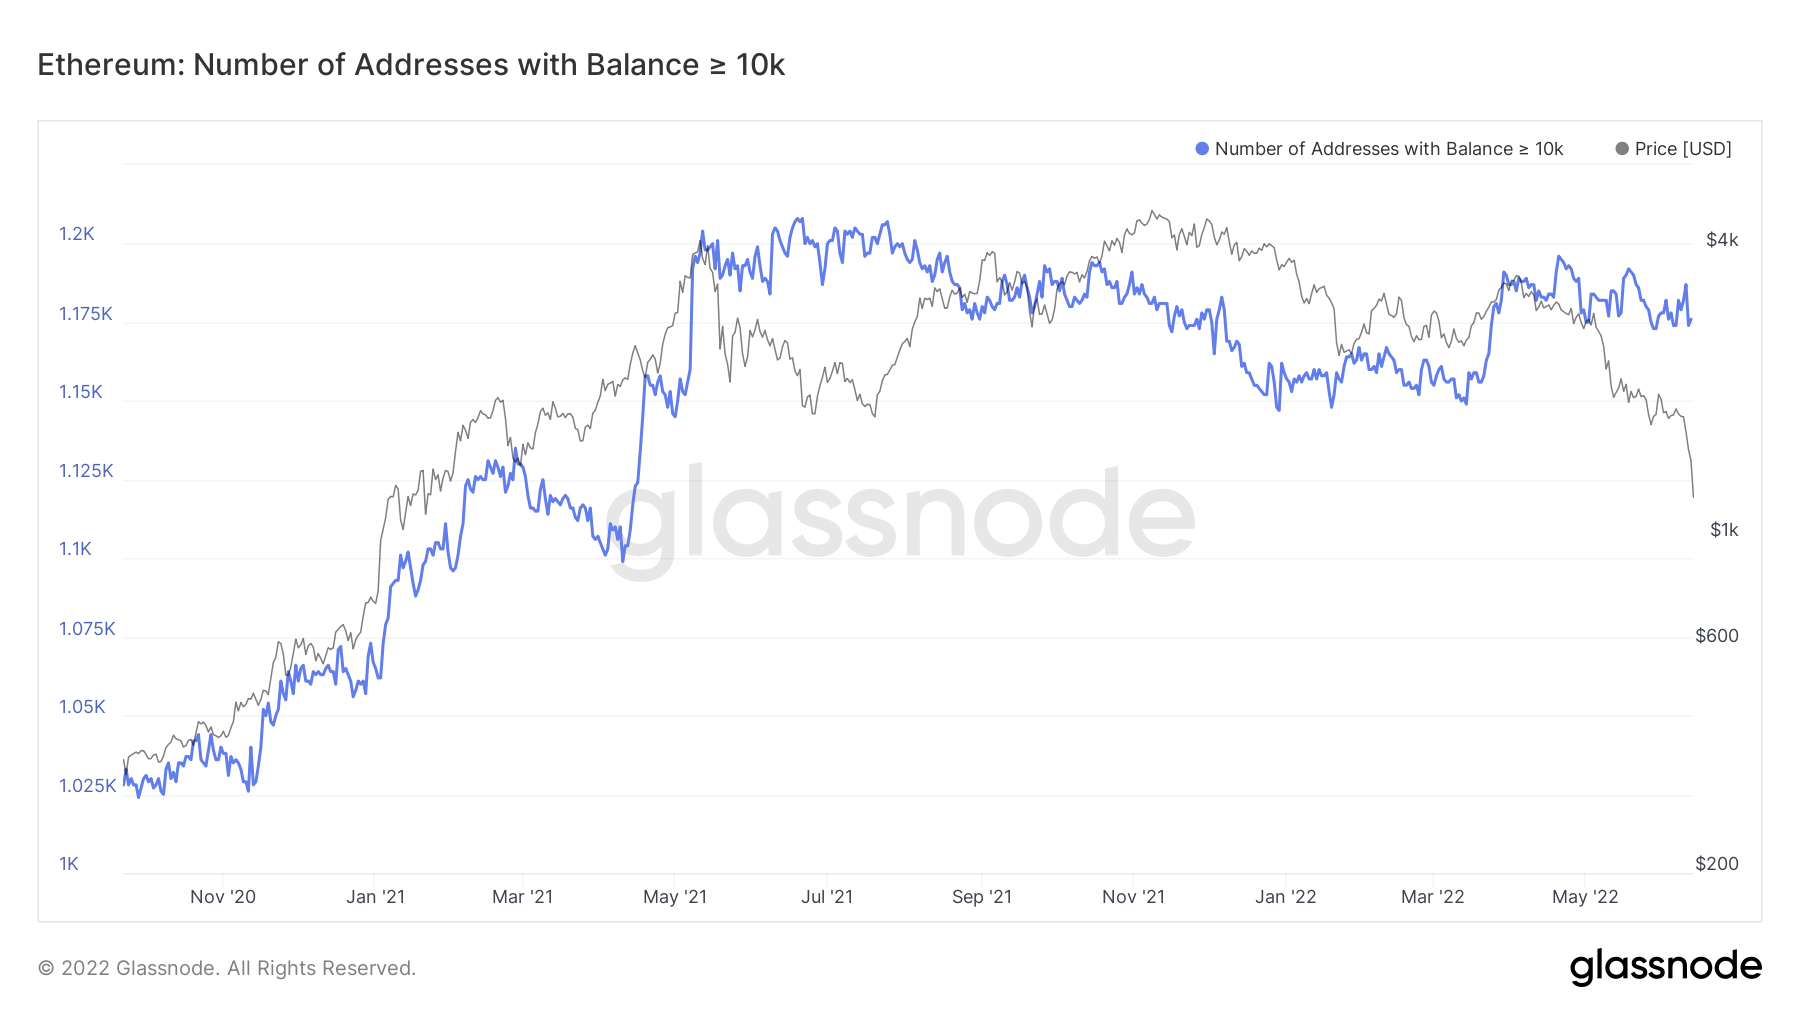
Ether – Addresses with Balance > 10,000 Ether
We can see that the small wallets are continuing to accumulate, the same as the smaller Bitcoin wallet cohorts are doing. However, if we look to the Addresses with Balance > 10,000 Ether, we can see that they haven’t really risked off (reduced the amount of Ether they own) but they also haven’t increased their risk (increased the amount of Ether they own).
Ether – Addresses with Balance > 10,000 Ether
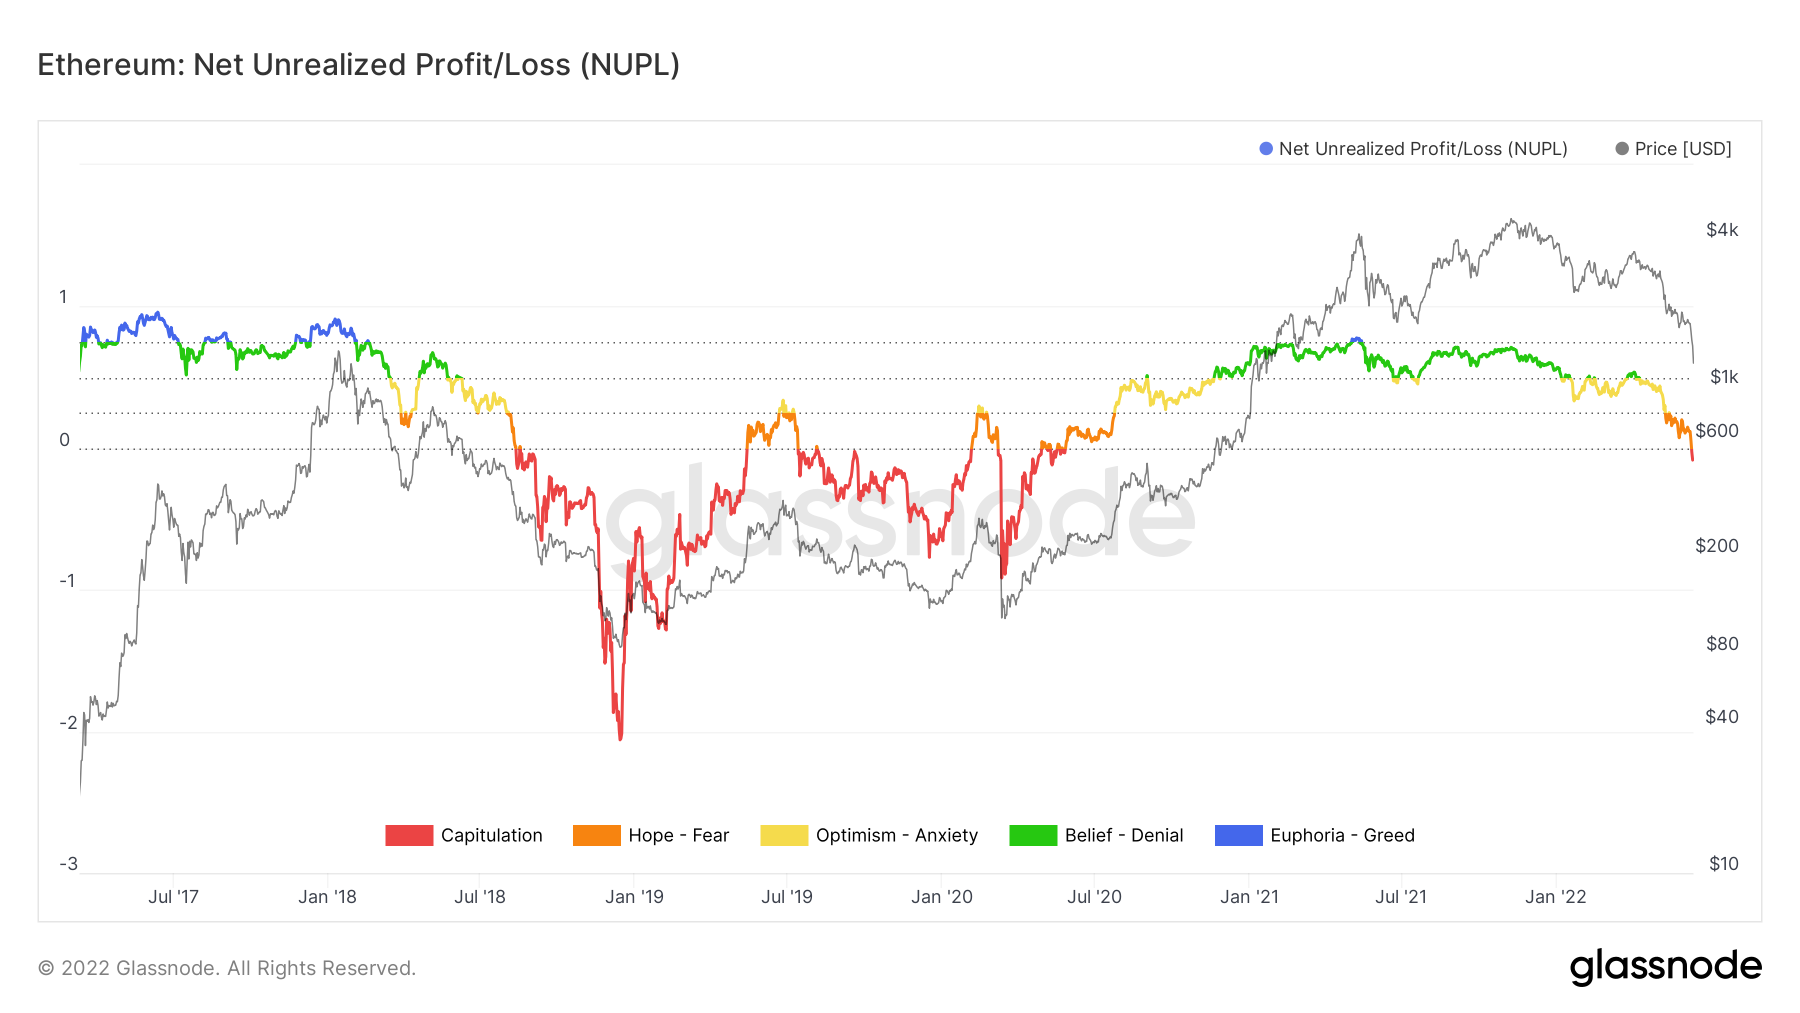
Metric 2 – Net Unrealised Profit/Loss
This metric shows that Ether has moved into the red zone. However, prior bear markets show us that Ether is capable of going a long way into this red zone, which can be described as a capitulation style event. This can suggest that even though Ether has found support around its $1000 key level, further downside can occur caused by increased selling pressure.
Ether – Net Unrealised Profit/Loss
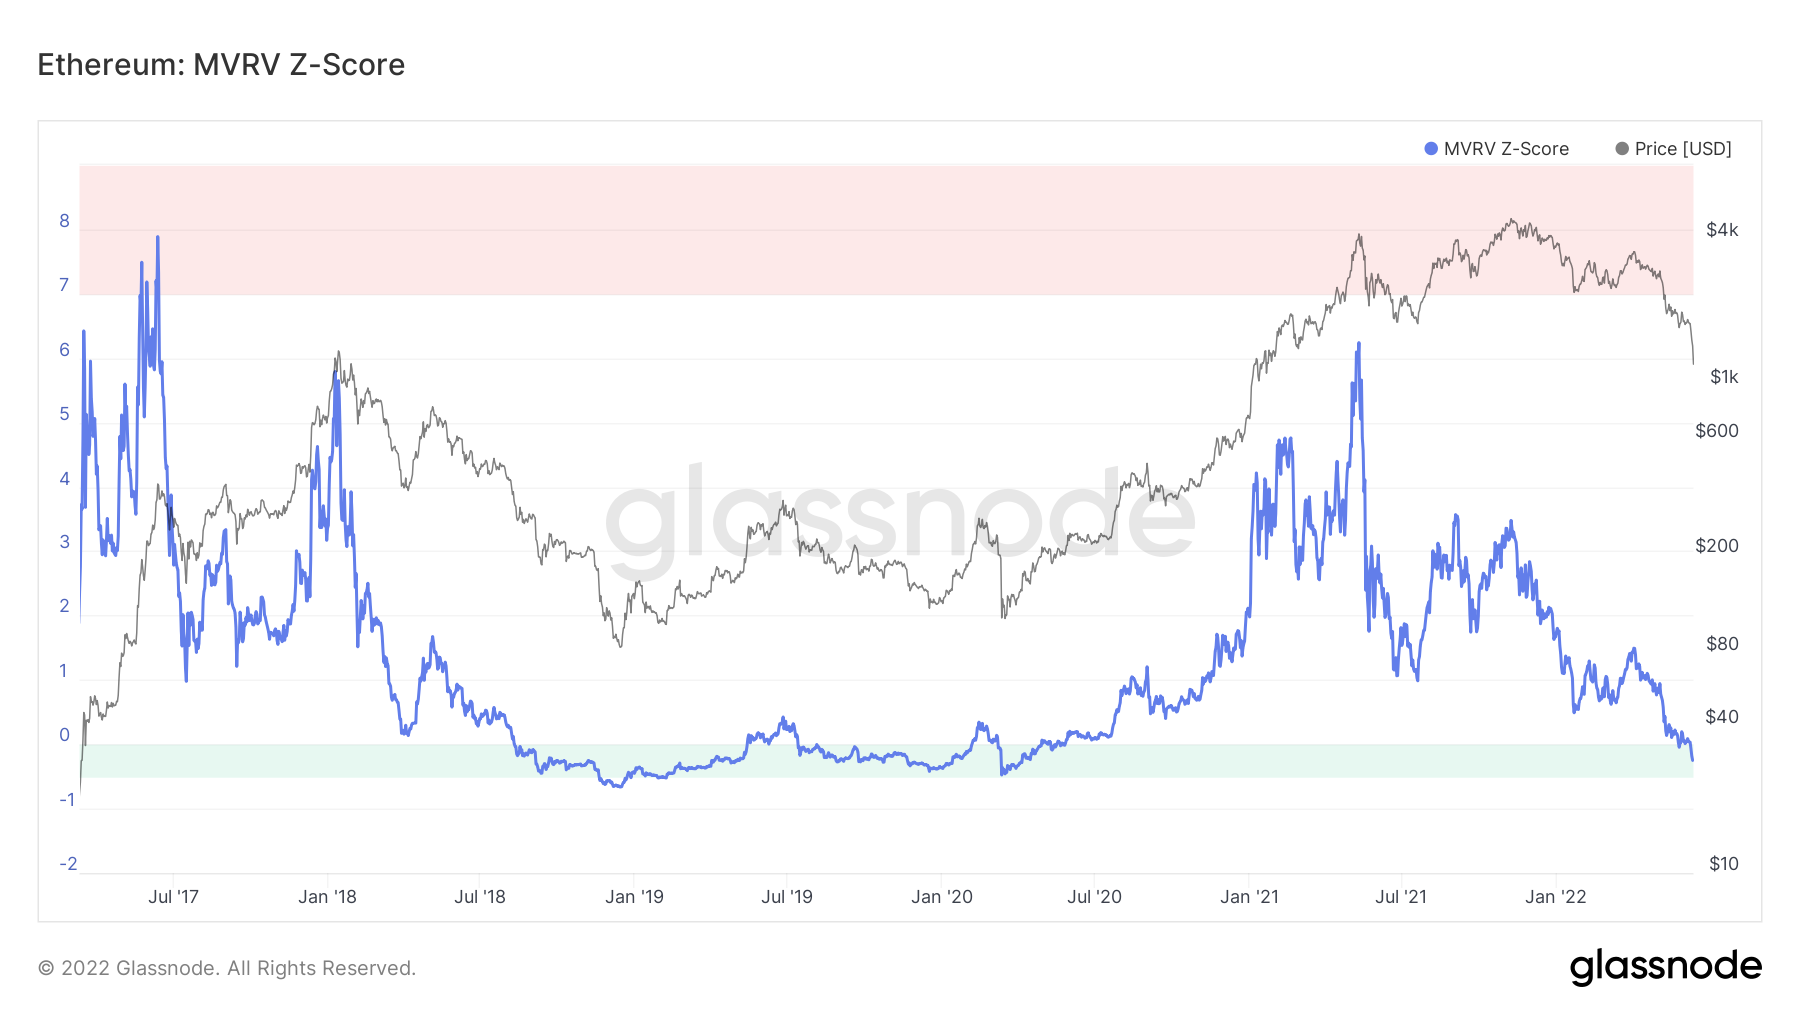
Metric 3 – MVRV Z-Score
This metric for Ether shows that Ether has already entered the green buy zone. However, prior bear markets have shown us that Ether is able to go under this green buy zone, so therefore a test of the bottom of this green channel is possible. In other terms, this metric is in perfect confluence with the rest of the metrics we've covered - further downside is possible, but this might be our bottom.
Ether – MVRV Z-Score
DOT
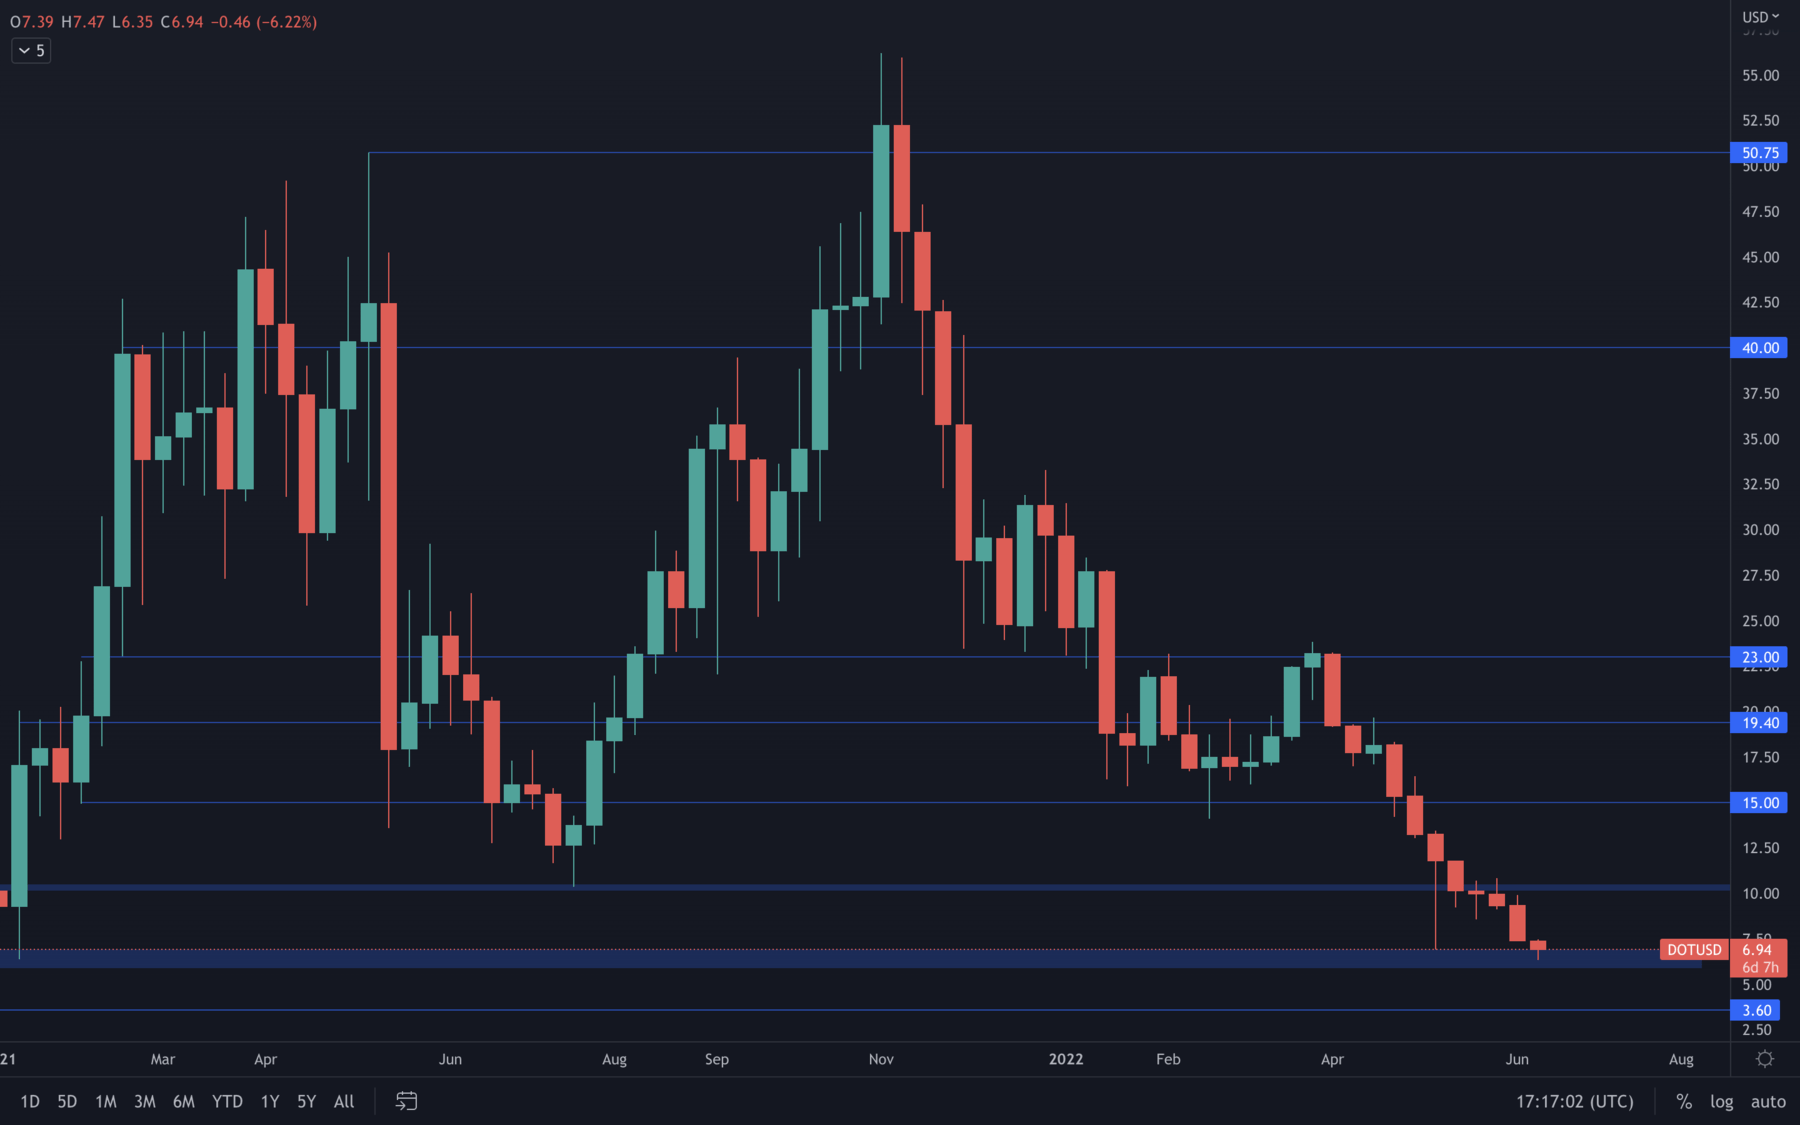 Last week's bearishness brought DOT to its $8 - $6.5 support area. Maintaining price above this level is as important as it can be, because a weekly loss of $6.5 can bring DOT back to $3.60, a price level we haven't seen for a long period of time. This would present us with a great opportunity to accumulate.
SNX
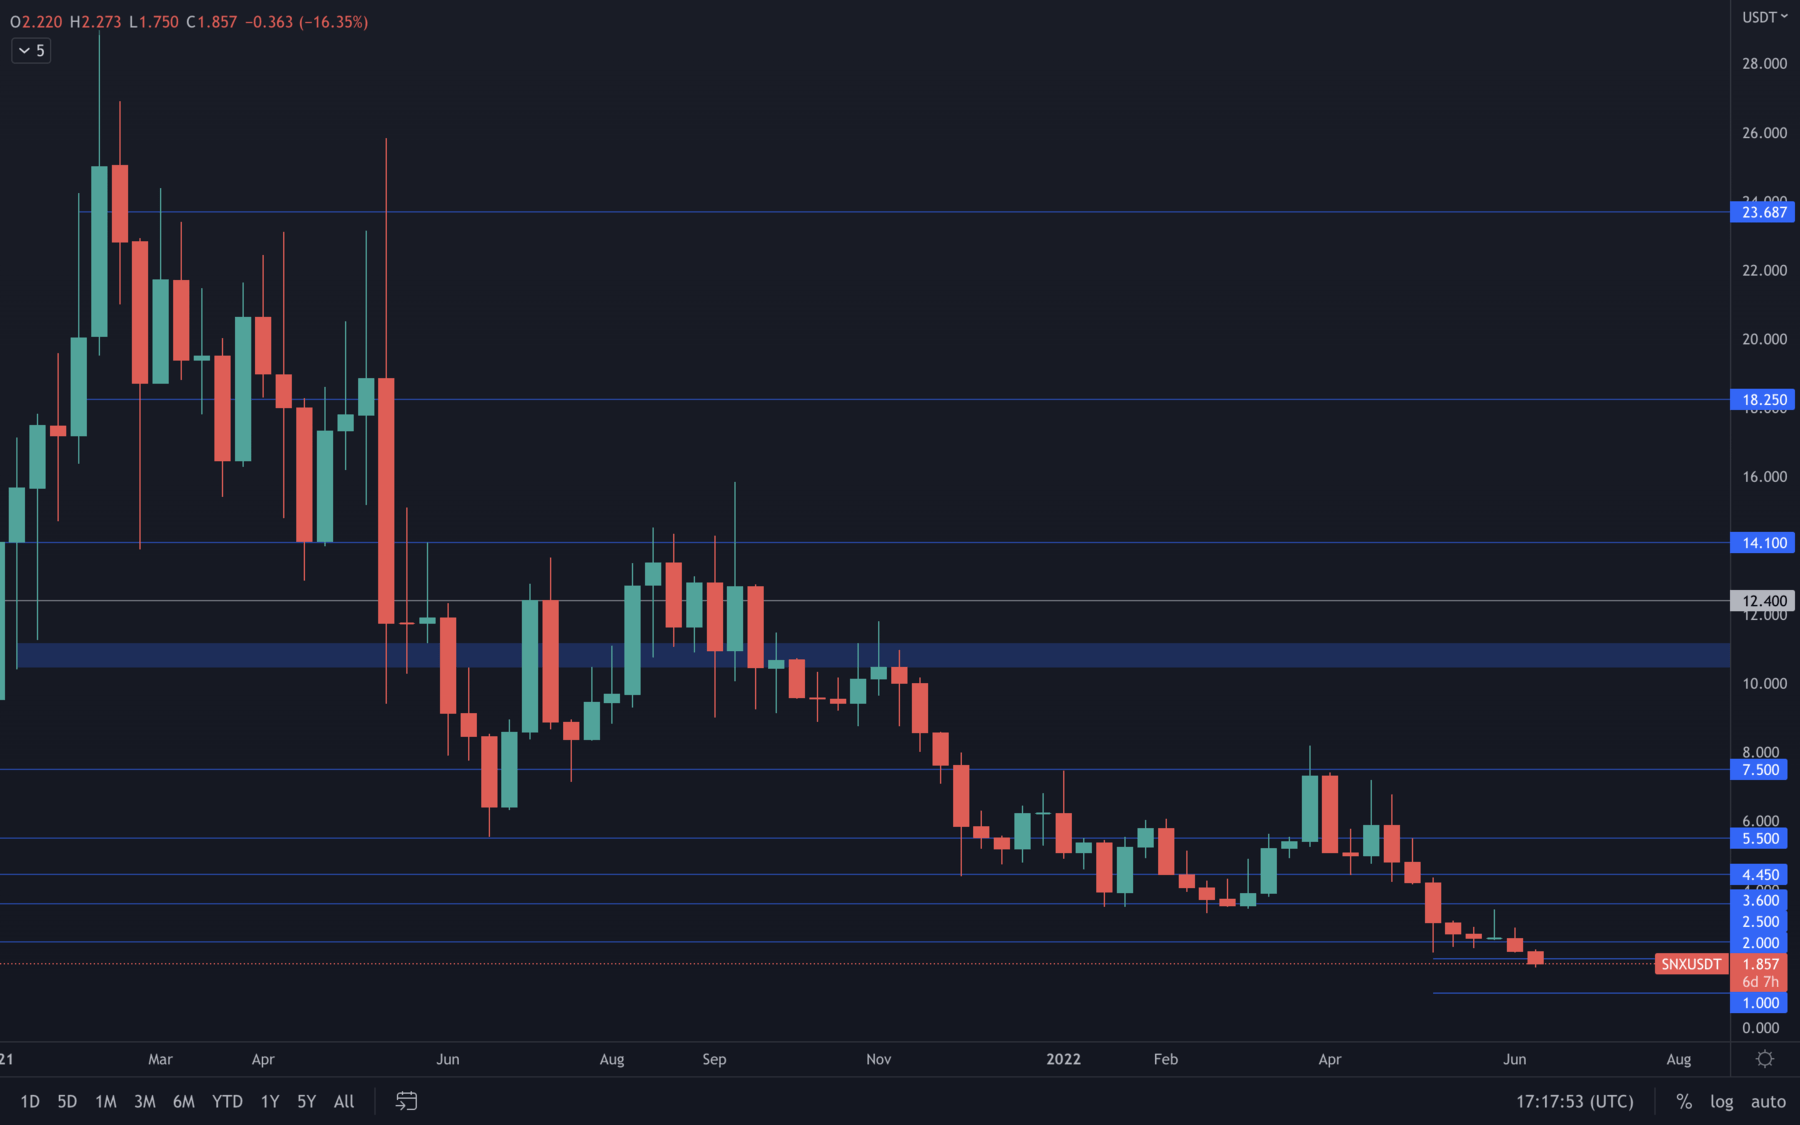 SNX is following the market's trajectory for now, and it seems $1 might be tested at some point in the future. The $1 price level is almost -50% away from the current price, so this level can only be achieved by increased selling pressure on the entire market, as there's no other reason for SNX to descend on personal factors such as fundamentals.
RUNE
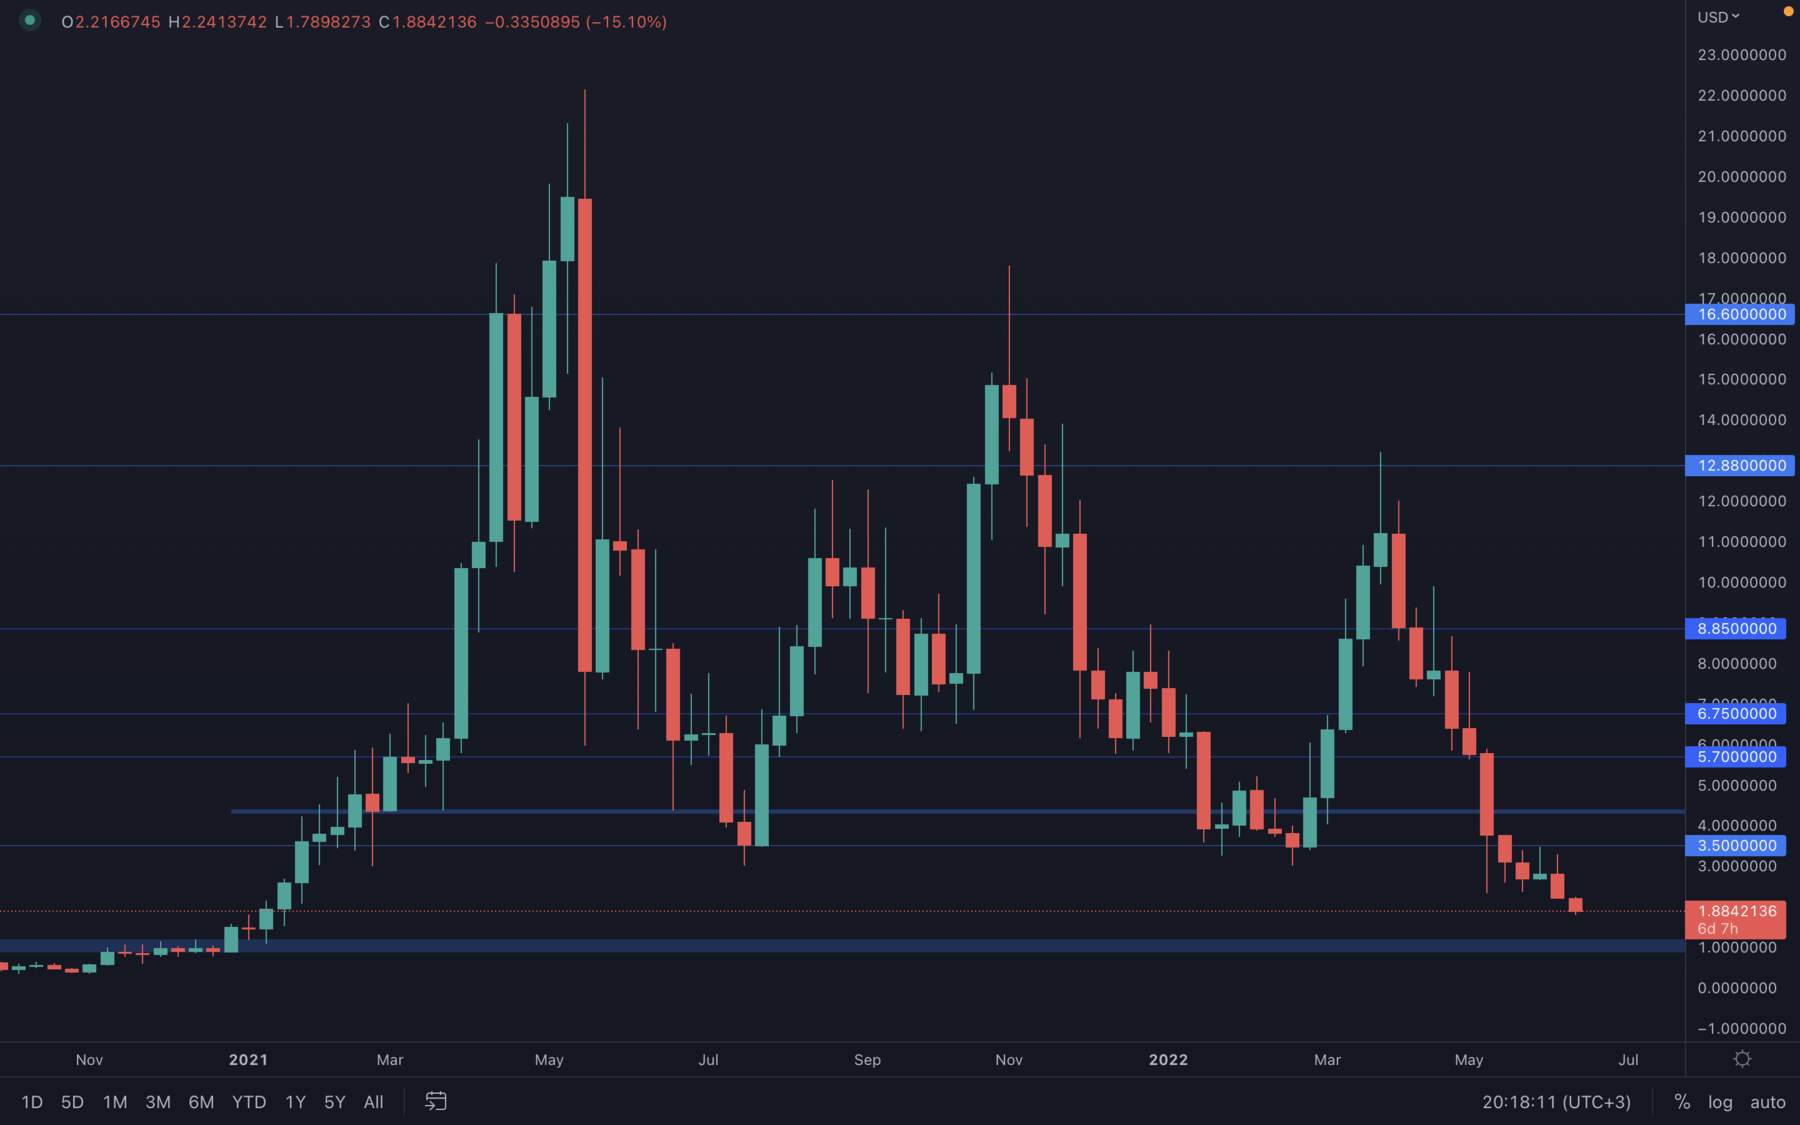 As there's no real strength until the $1 psychological & technical level, RUNE risks dropping to $1 at some point in the near future. There are no doubts about this price area being the greatest time to accumulate RUNE and we'll make sure to jump on the opportunity if it is presented to us.
SOL
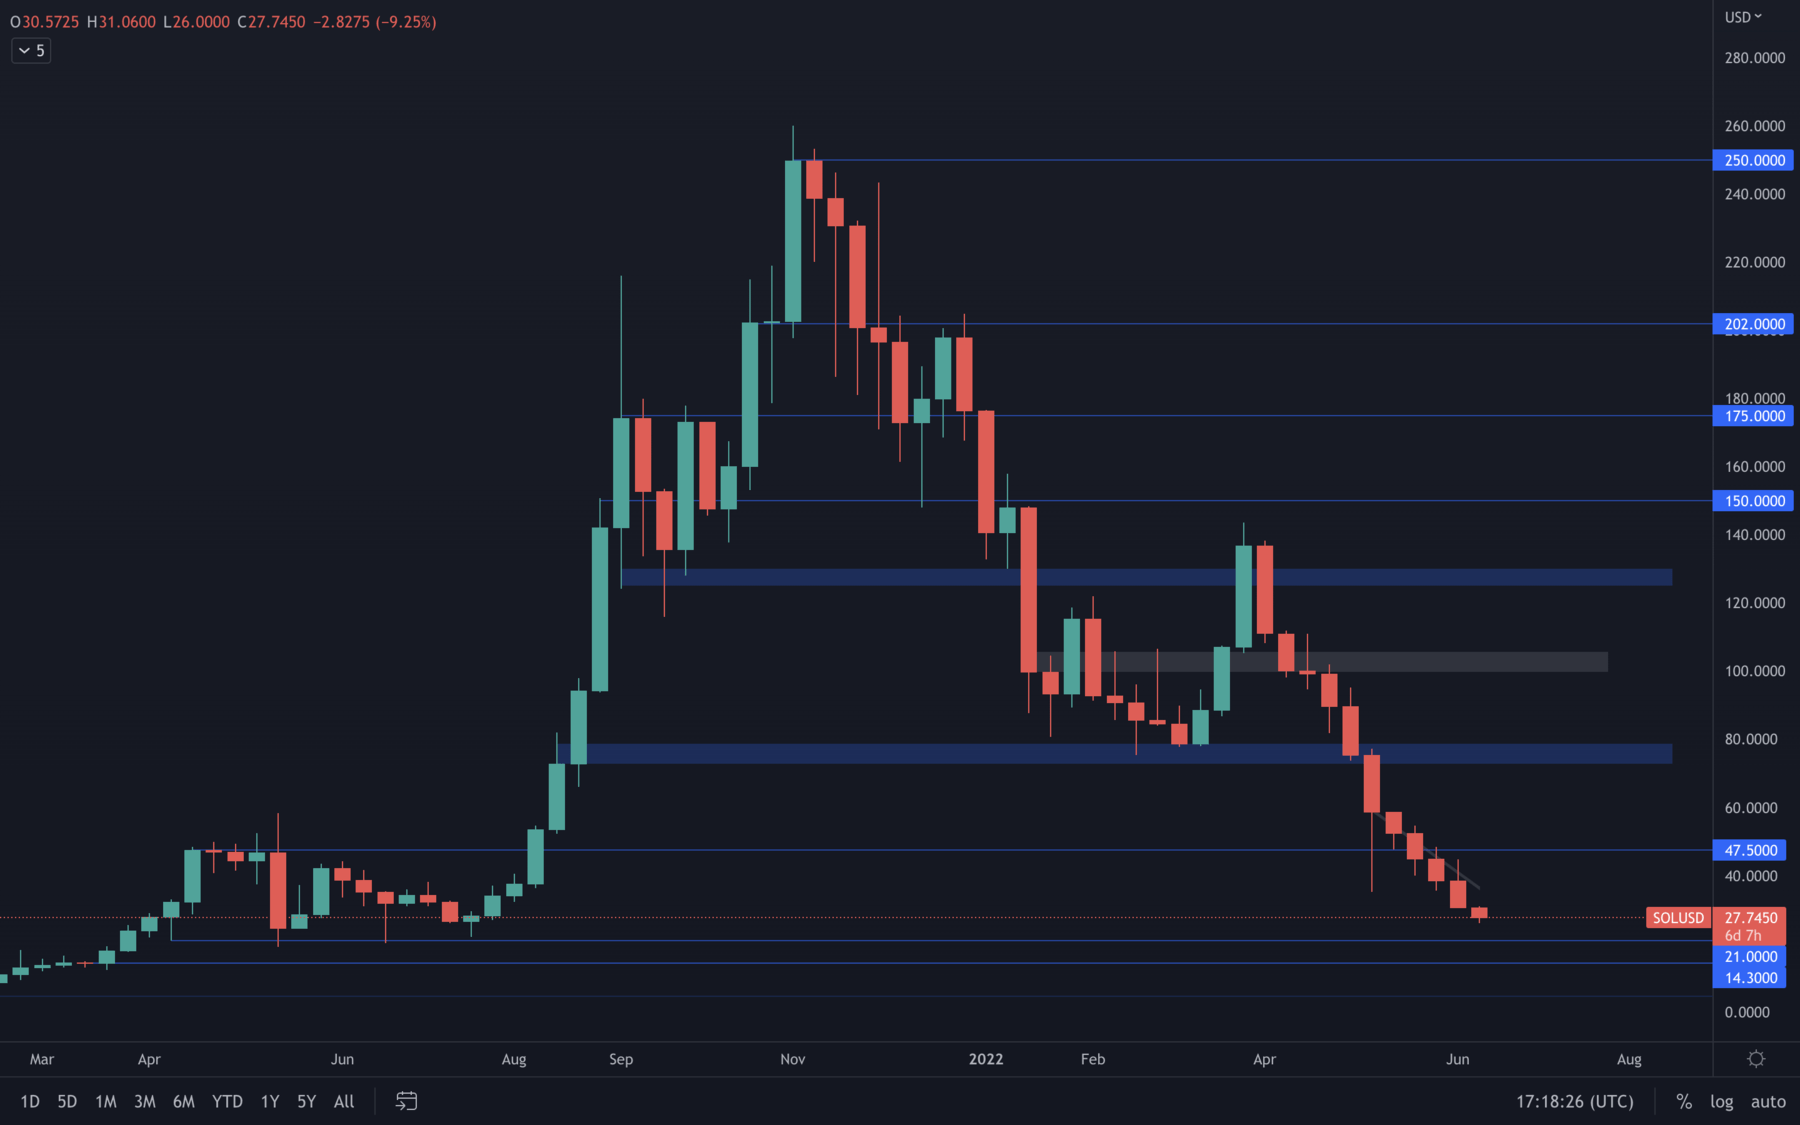 SOL has been having a somewhat steady descend over the past few weeks and it seems to be aiming for $21. Last week's weekly candle close can suggest sellers are now even more in control than before, and that a $21 test can be seen as early as this week.
SRM
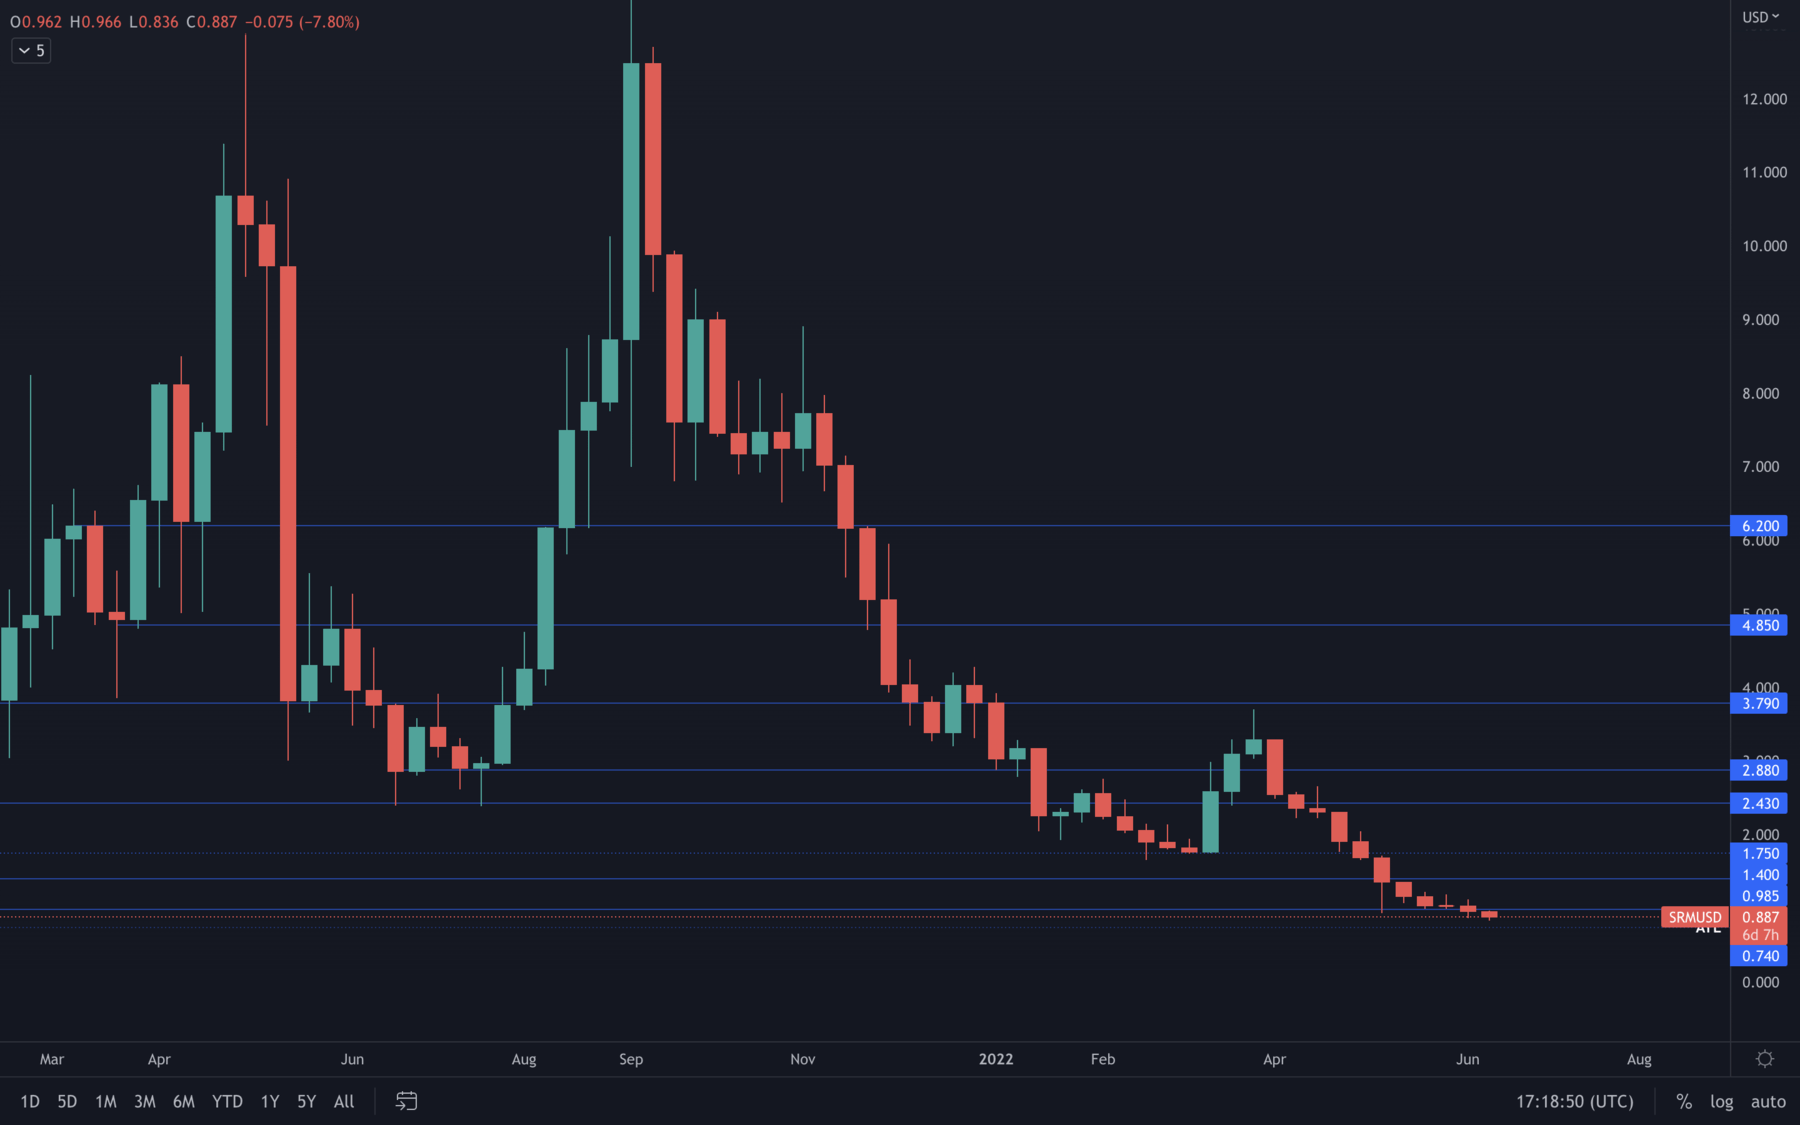 Interesting thing for SRM is that the selling pressure hasn't had that much of an impact compared to other assets we usually cover. We can see the drops have been quite small and that $0.74 might be SRM's last line of defence before starting to range for weeks and form a bottom. As candlesticks go, these are way more hopeful than those that can be seen on other assets.
FTT
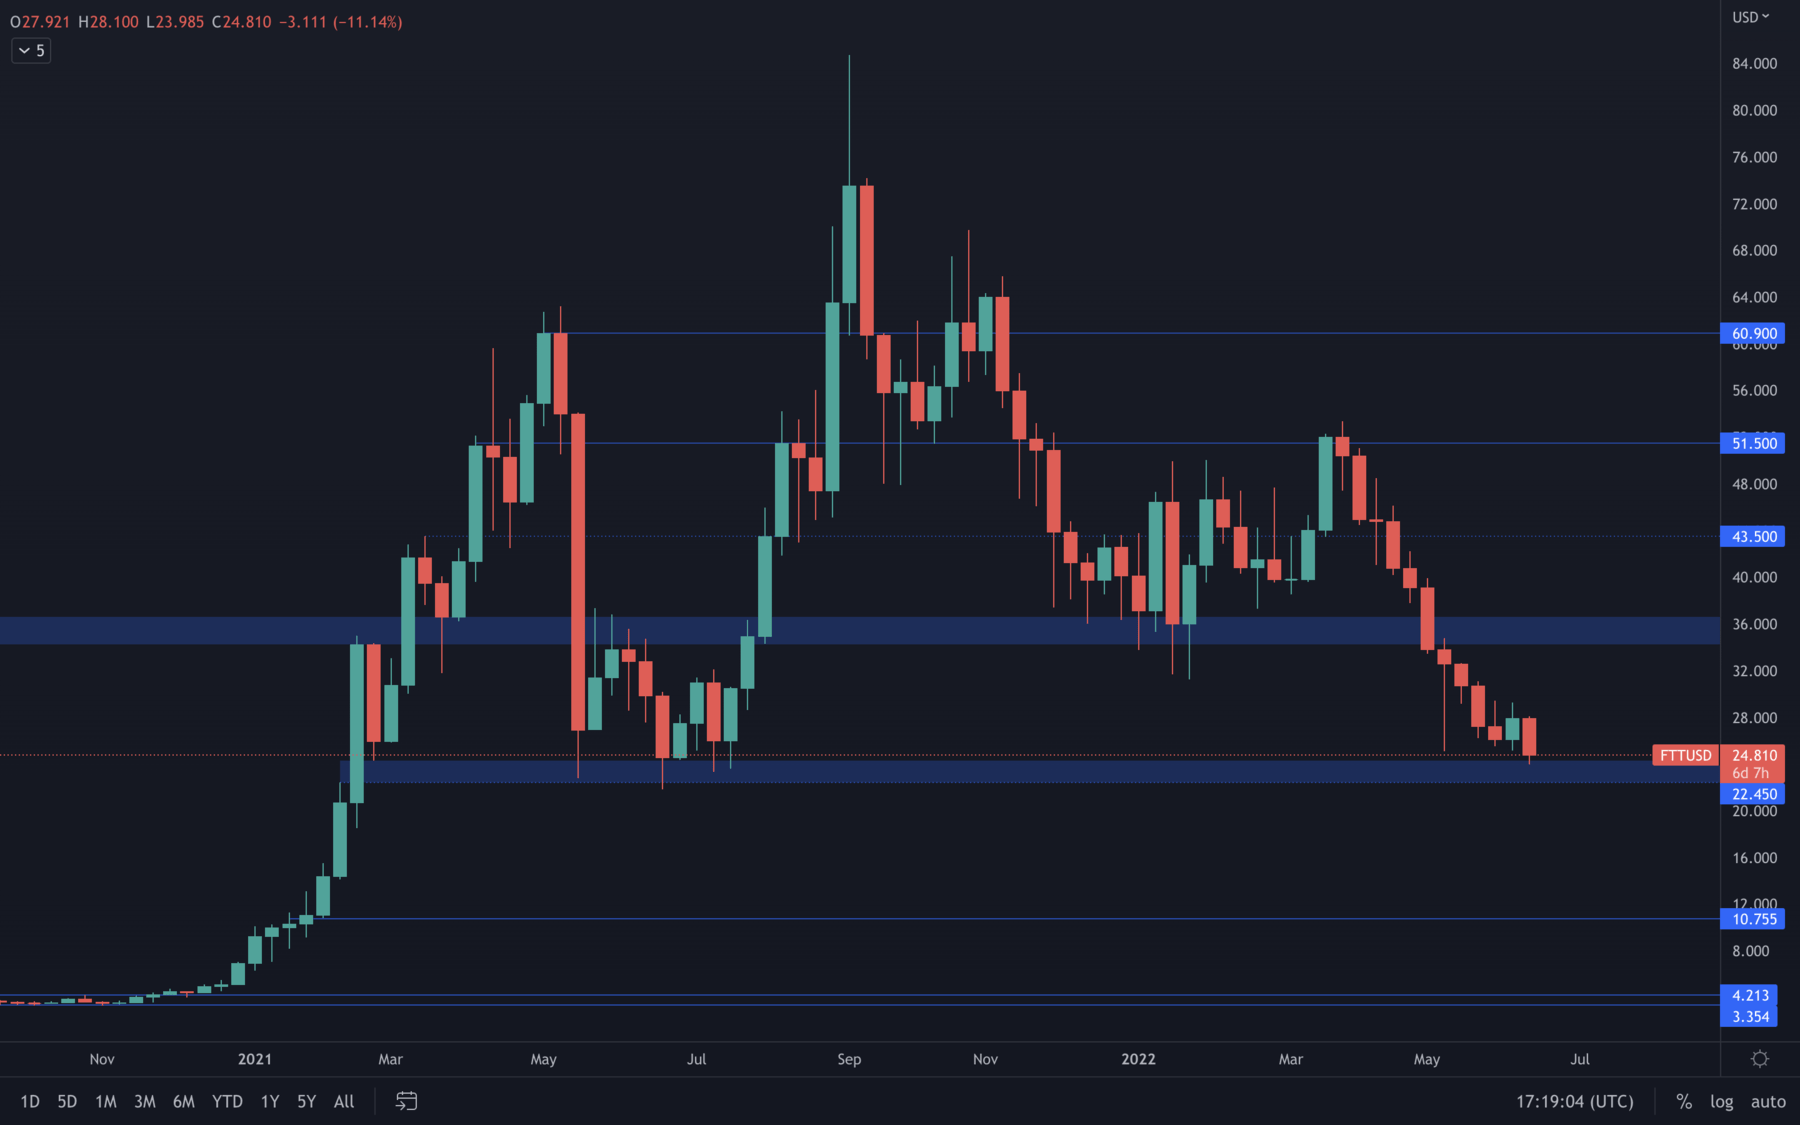 FTT was actually going to pull a 180 and closed a bullish engulfing candle last week. However, the buying pressure stood no chance to the aggressive selling we've been experiencing for some time - this invalidated any further upside for FTT and brought the price at the $24 - $22.5 support area. If price manages to maintain this support area, then further downside is invalidated until a weekly candle closes under the $22.45 price level.
MINA
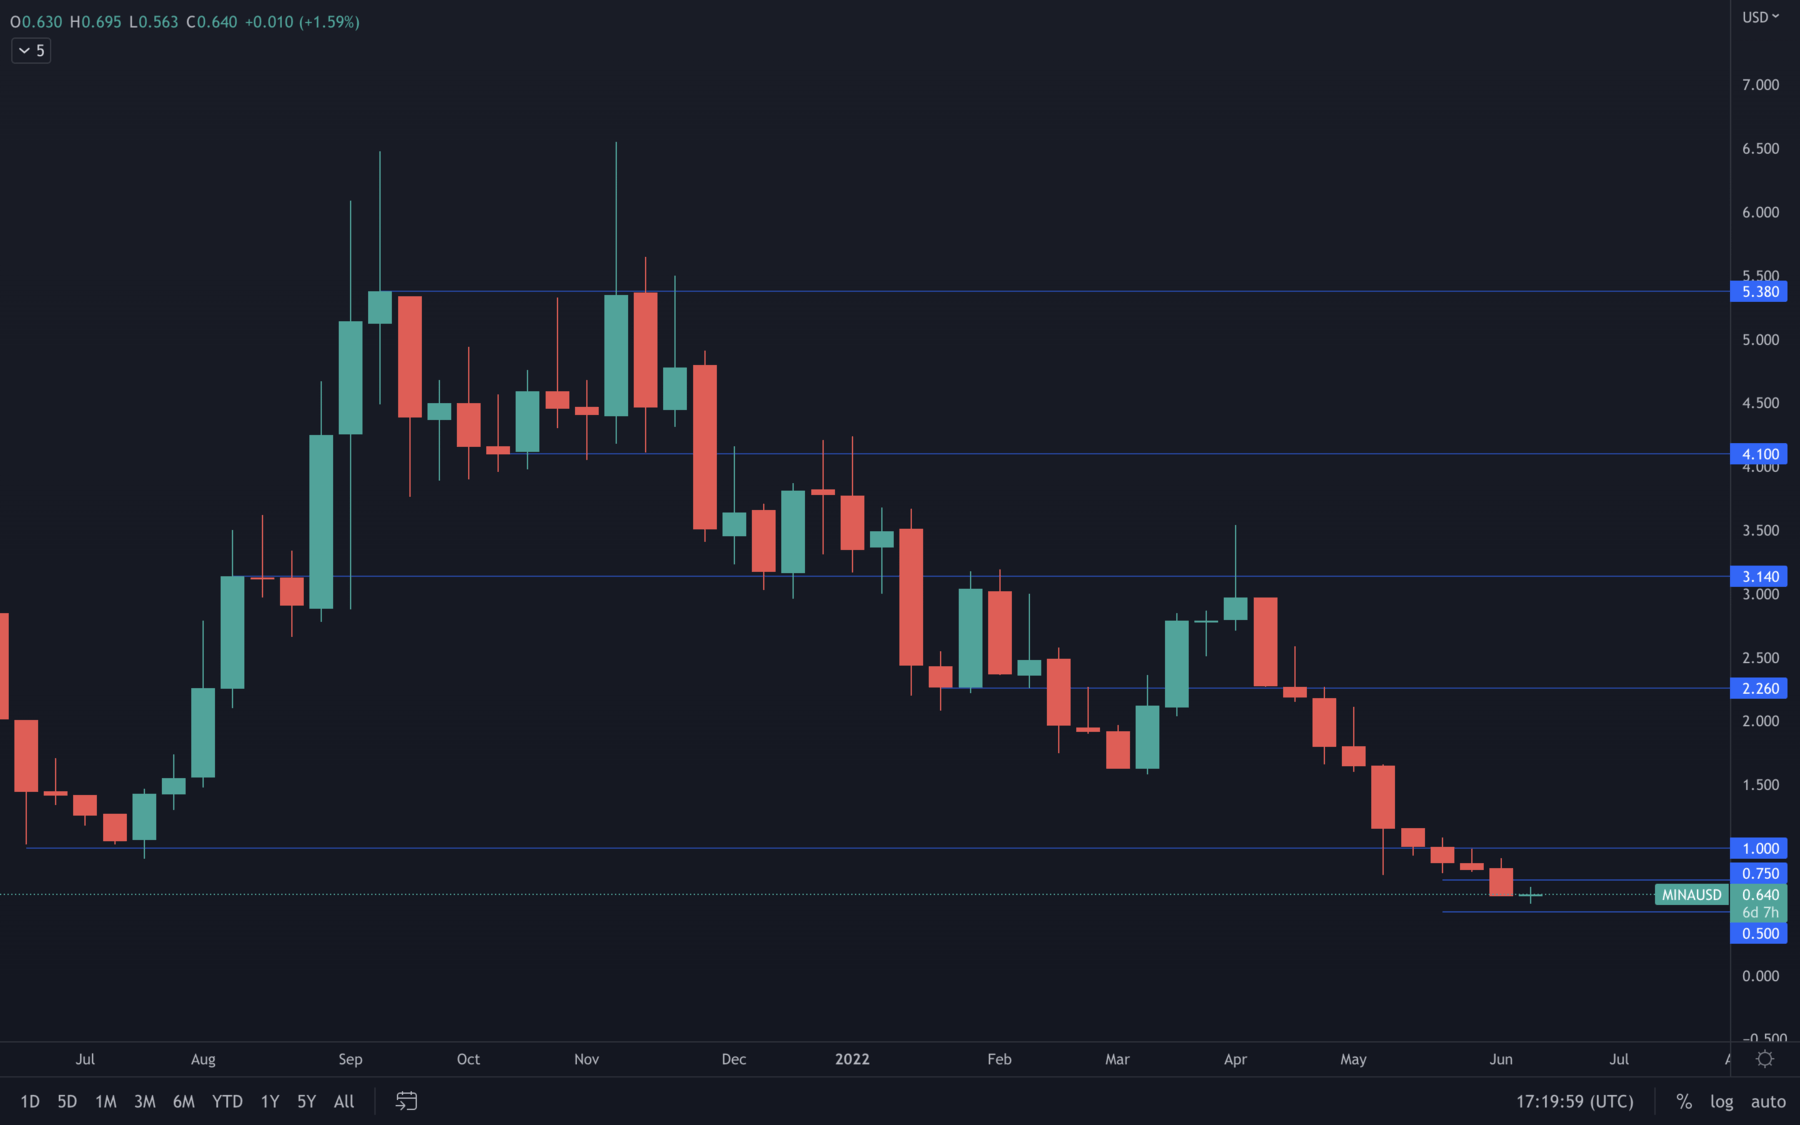 The $1 support level was crucial for MINA, it was a threshold between further upside or an all-time low spree. MINA chose the 2nd scenario and has been creating all- time lows for weeks, similar to how dYdX has been doing. For now, $0.50 remains the next psychological threshold for MINA and should be monitored at all times, as MINA presents one of the best risk/reward ratios in the entire list of assets we usually cover.
dYdX
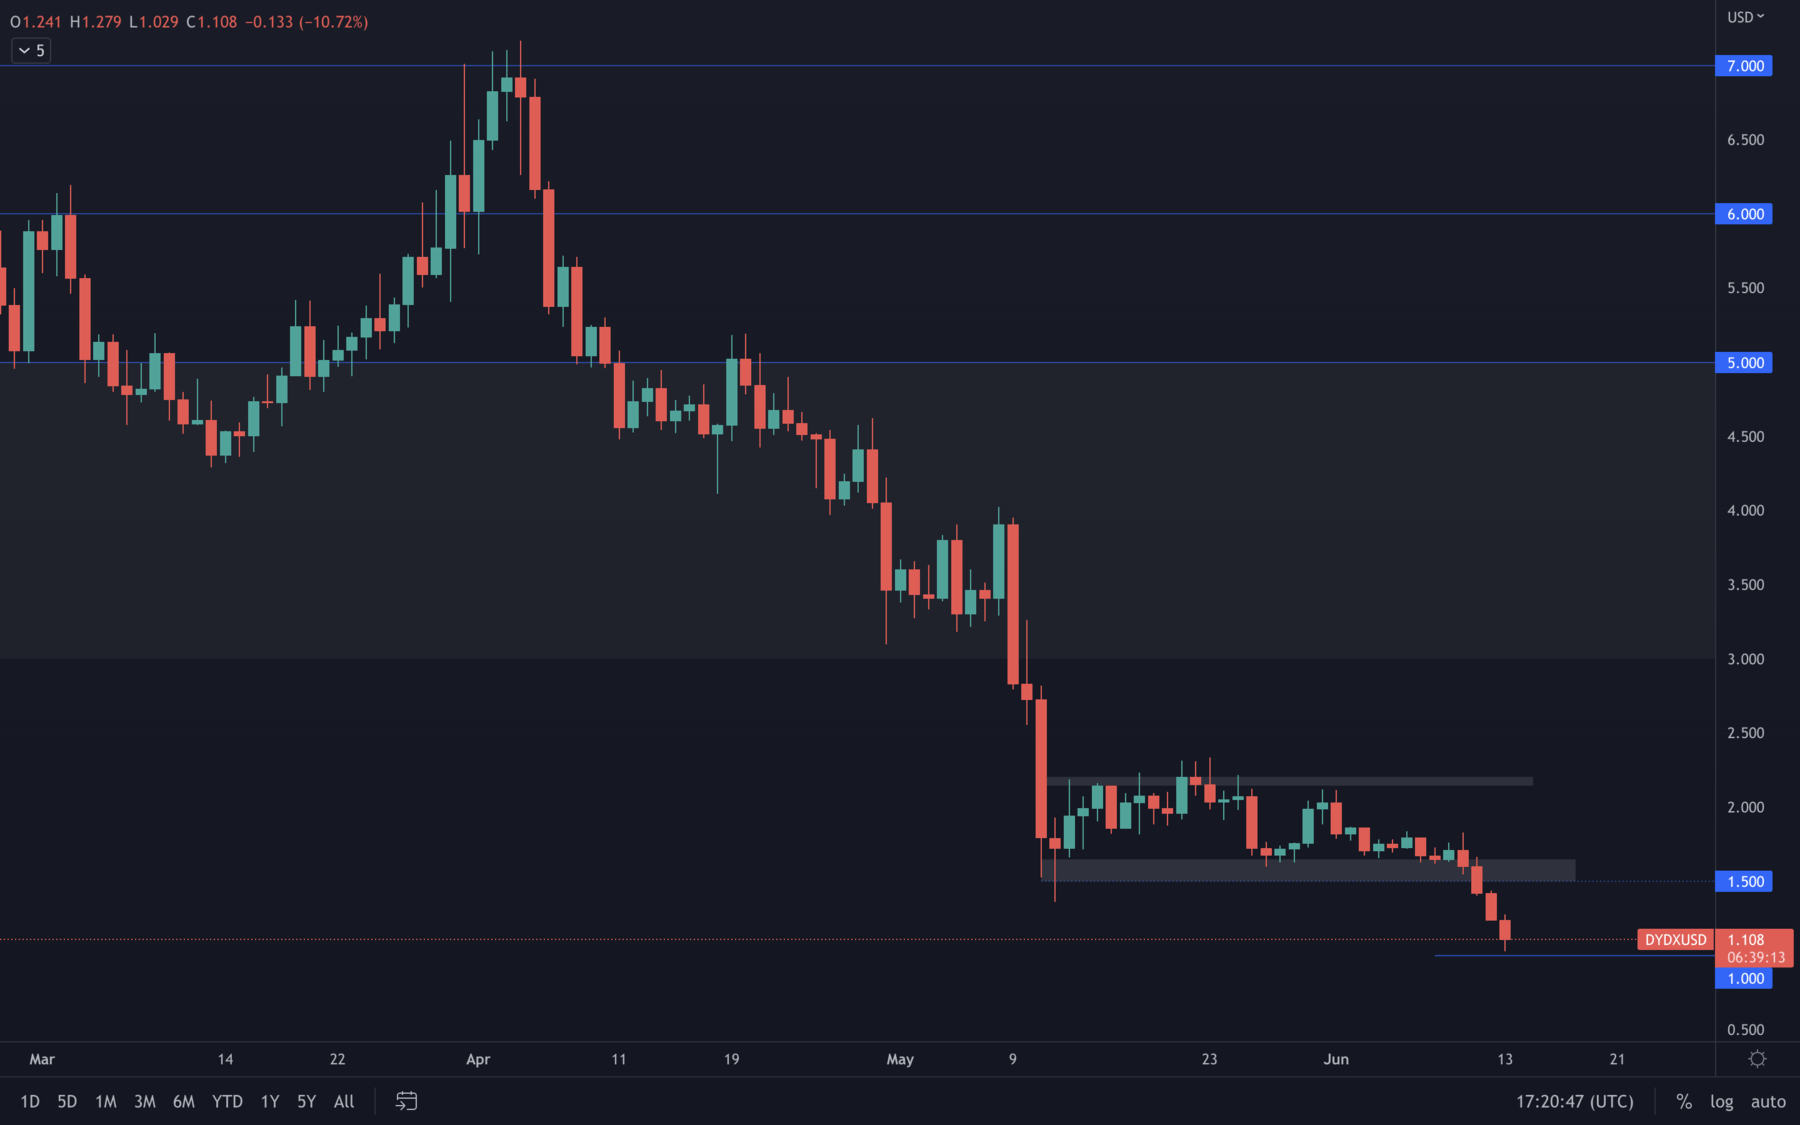 After a continuous all-time low spree, dYdX has finally found itself at the $1 mark. There's no discussion that the $1 level presents a huge risk/reward ratio, but further downside can easily occur due to uncertain market conditions. If we were to accumulate, now might be one of the best times to do so.
Summary
Many of the metrics we have covered this week are market indicator metrics. Many of them show that price has come down dramatically to levels where it would now be wise to begin considering buying back into Bitcoin and Ether. However, many of the metrics also suggest that there may still be more room to go, and with the macro-outlook still looking shaky, there may be another shock to come (possible 75 basis point rate hike). If this were to happen (possibilities now significantly increasing) crypto in general could decrease in value even further.However, most assets are at crucial support levels. With an overextended downtrend, it's safe to assume that a short-term rise still remains on the cards at some point, as neither selling nor buying can be constant. The prices we're seeing now have been awaited for a long time by market participants, and accumulating might not be as bad of an idea as many may suggest. As usual, we recommend extreme caution - trade responsibly, invest wisely and do not overexpose yourself under any conditions.
Recommended from Cryptonary


