Save 23% ($351) & Get a Free 1-1 Call with our Team ⏰ : 0d 2h 59m 43s

Disclaimer: Not financial nor investment advice. You are responsible for any capital-related decisions you make, and only you are accountable for the results.
Macro
In the past week, prices of the top coins have been range-bound/moved slightly higher. After the inflation print of 8.6% several weeks ago now, and the prices of coins plummeting, it is no wonder we have had some rebounds in prices. However, the rebounds have not been too significant, and this may be due to market anticipation of further macro headwinds. For example, only recently have the FED begun quantitative tightening (shrinking of their Balance Sheet), and this has resulted in the first month-on-month decrease in over 12 years. With continued quantitative tightening and with J. Powell coming out last week and suggesting that the FED may have to think about selling some FED-owned Mortgage-Backed Securities to the market, it can be expected that we still remain in a risk-off environment.TLDR
- This week saw the Large Wallet Inflows metric flash a large Bitcoin but from the Whale cohort. However, this was not shown in the address balances metric which showed the historically most profitable wallets had not risked back-on yet.
- The Seller Exhaustion Constant and the Hash Ribbon metrics suggest the bottom may not yet be in, but that we are moving into a later phase of the bear market.
- Bitcoin's price has found support at the 2017-2018 all-time high.
Total Market Cap
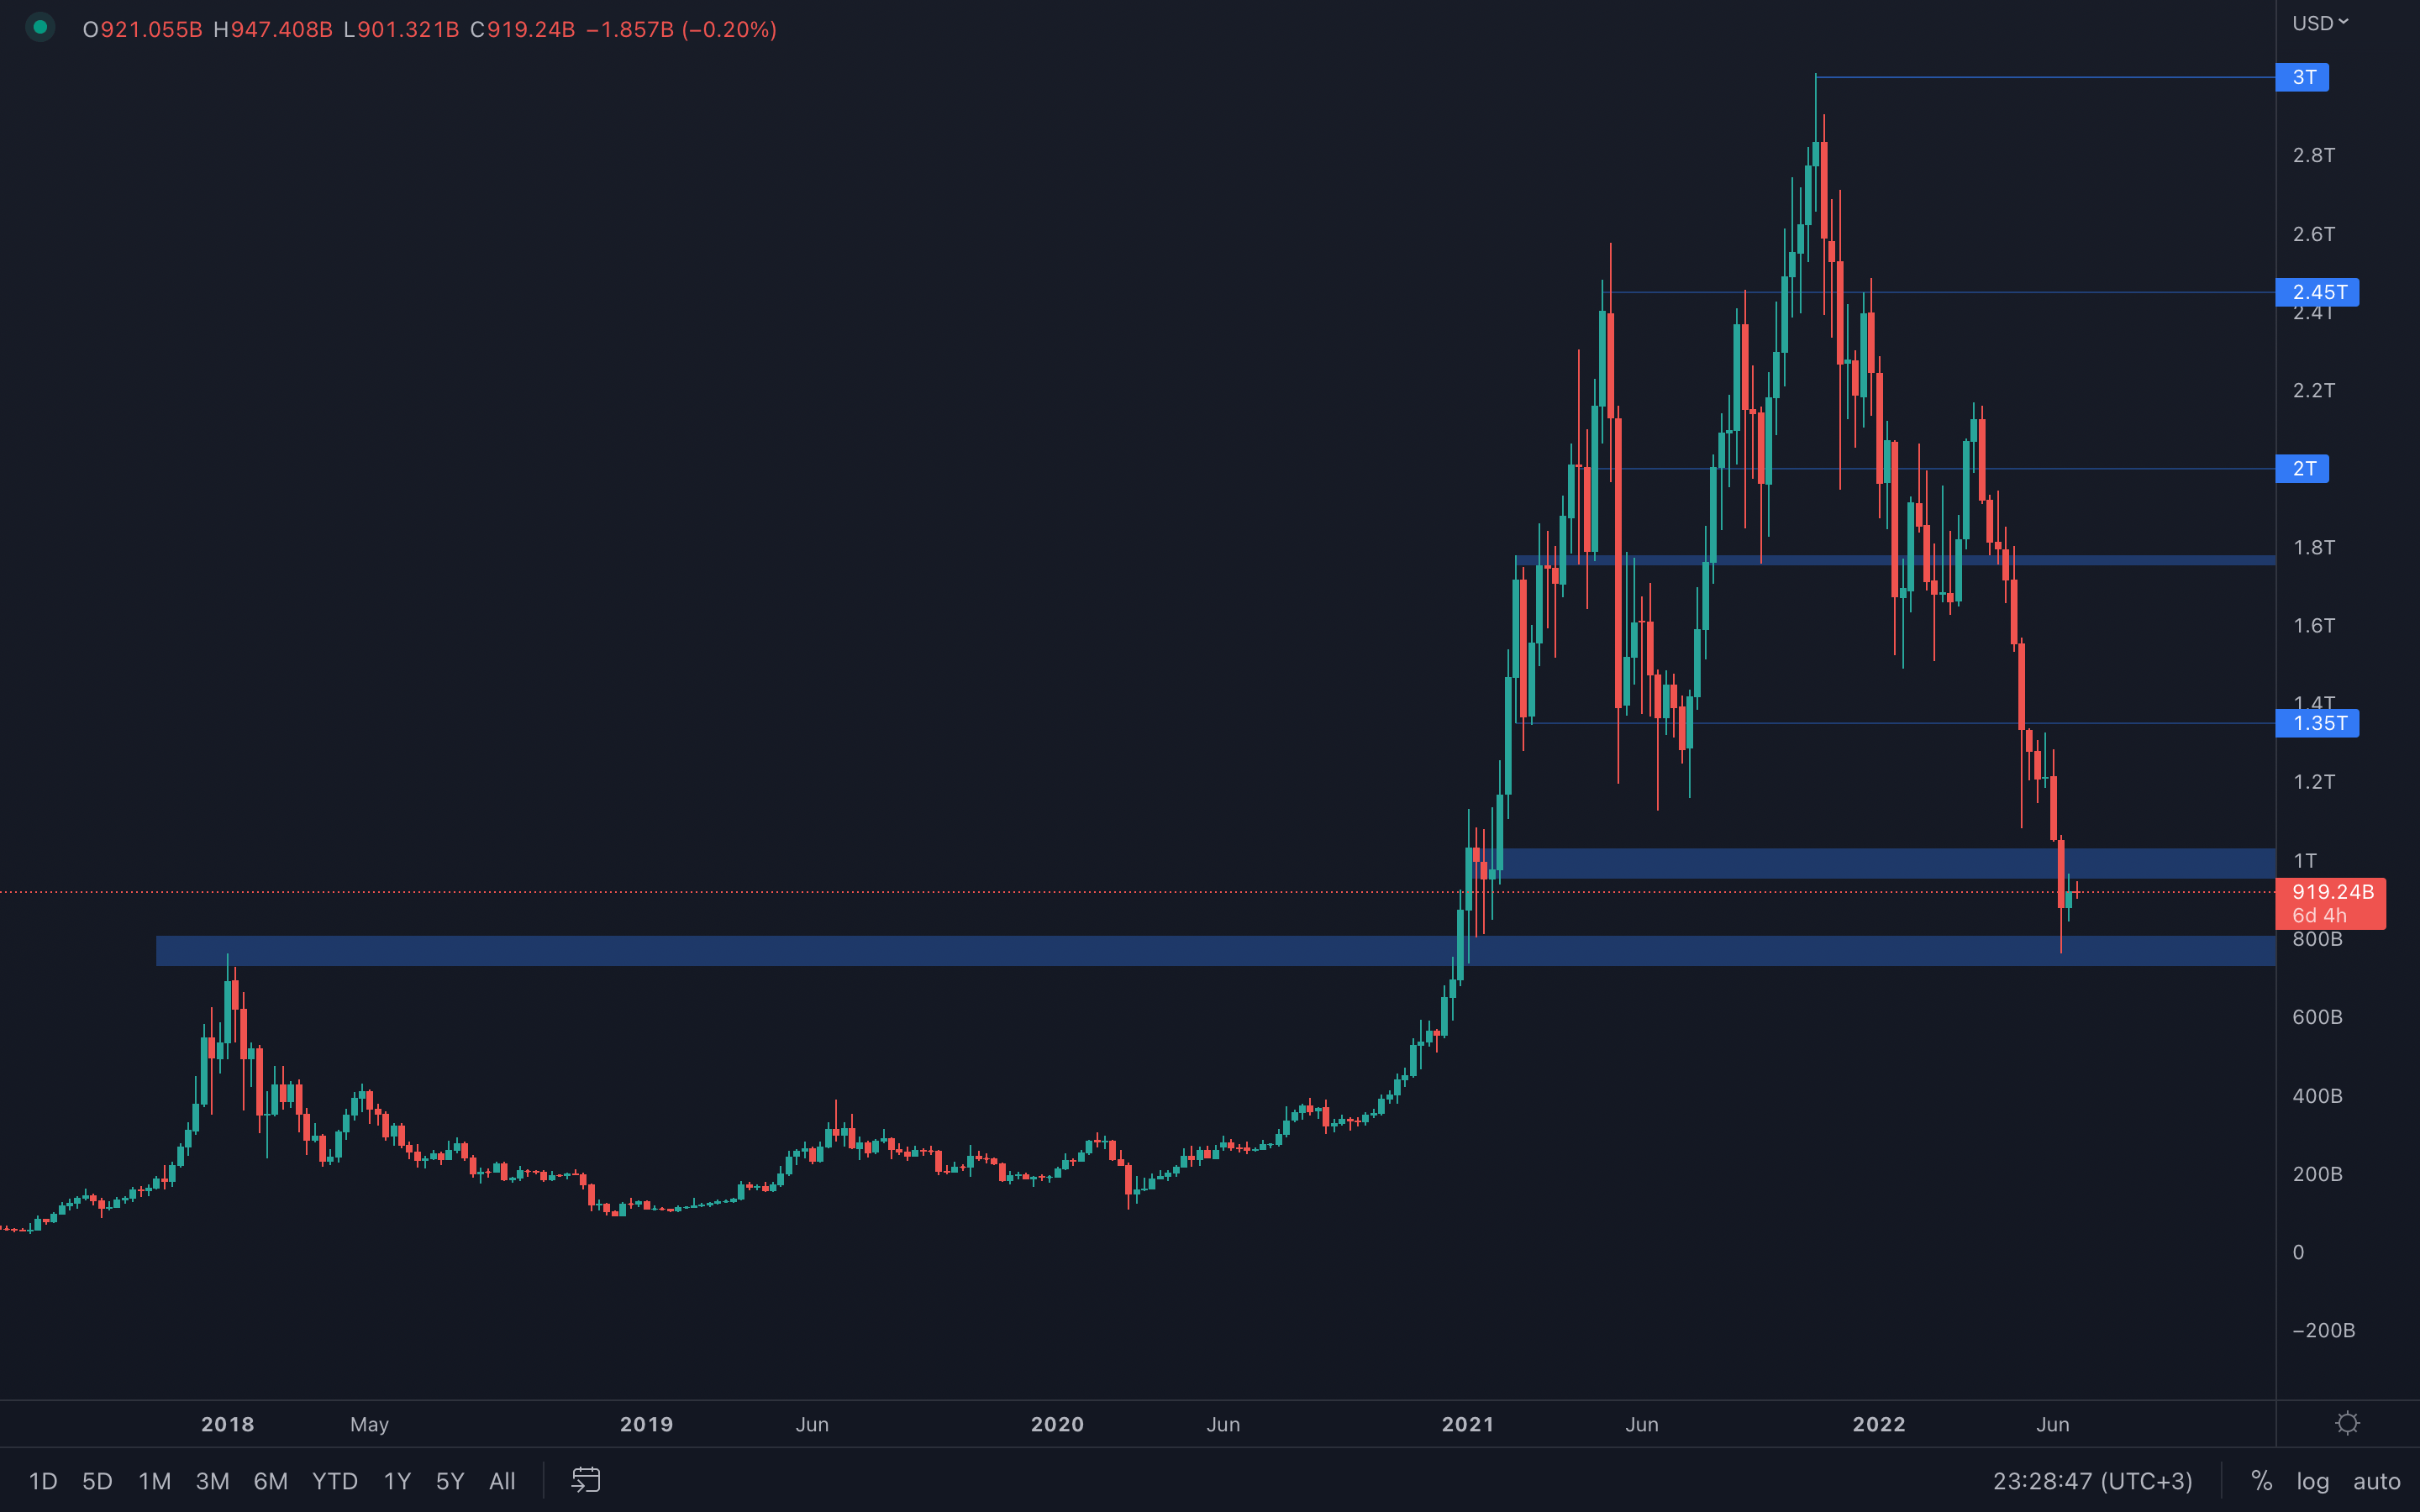 Not at all surprising, the Total Market Cap has experienced quite a slow week due to the indecisiveness of the current market. However, we're sitting just above the 2018 all-time high, an extremely important psychological & technical demand area on higher timeframes which will most likely end up forming a local bottom. CAN that be the case here? Absolutely. WILL it happen for sure? Not something we can deduce. For now, ranging between $800B and $1T should be expected, until either of these levels are broken.
Altcoins Market Cap
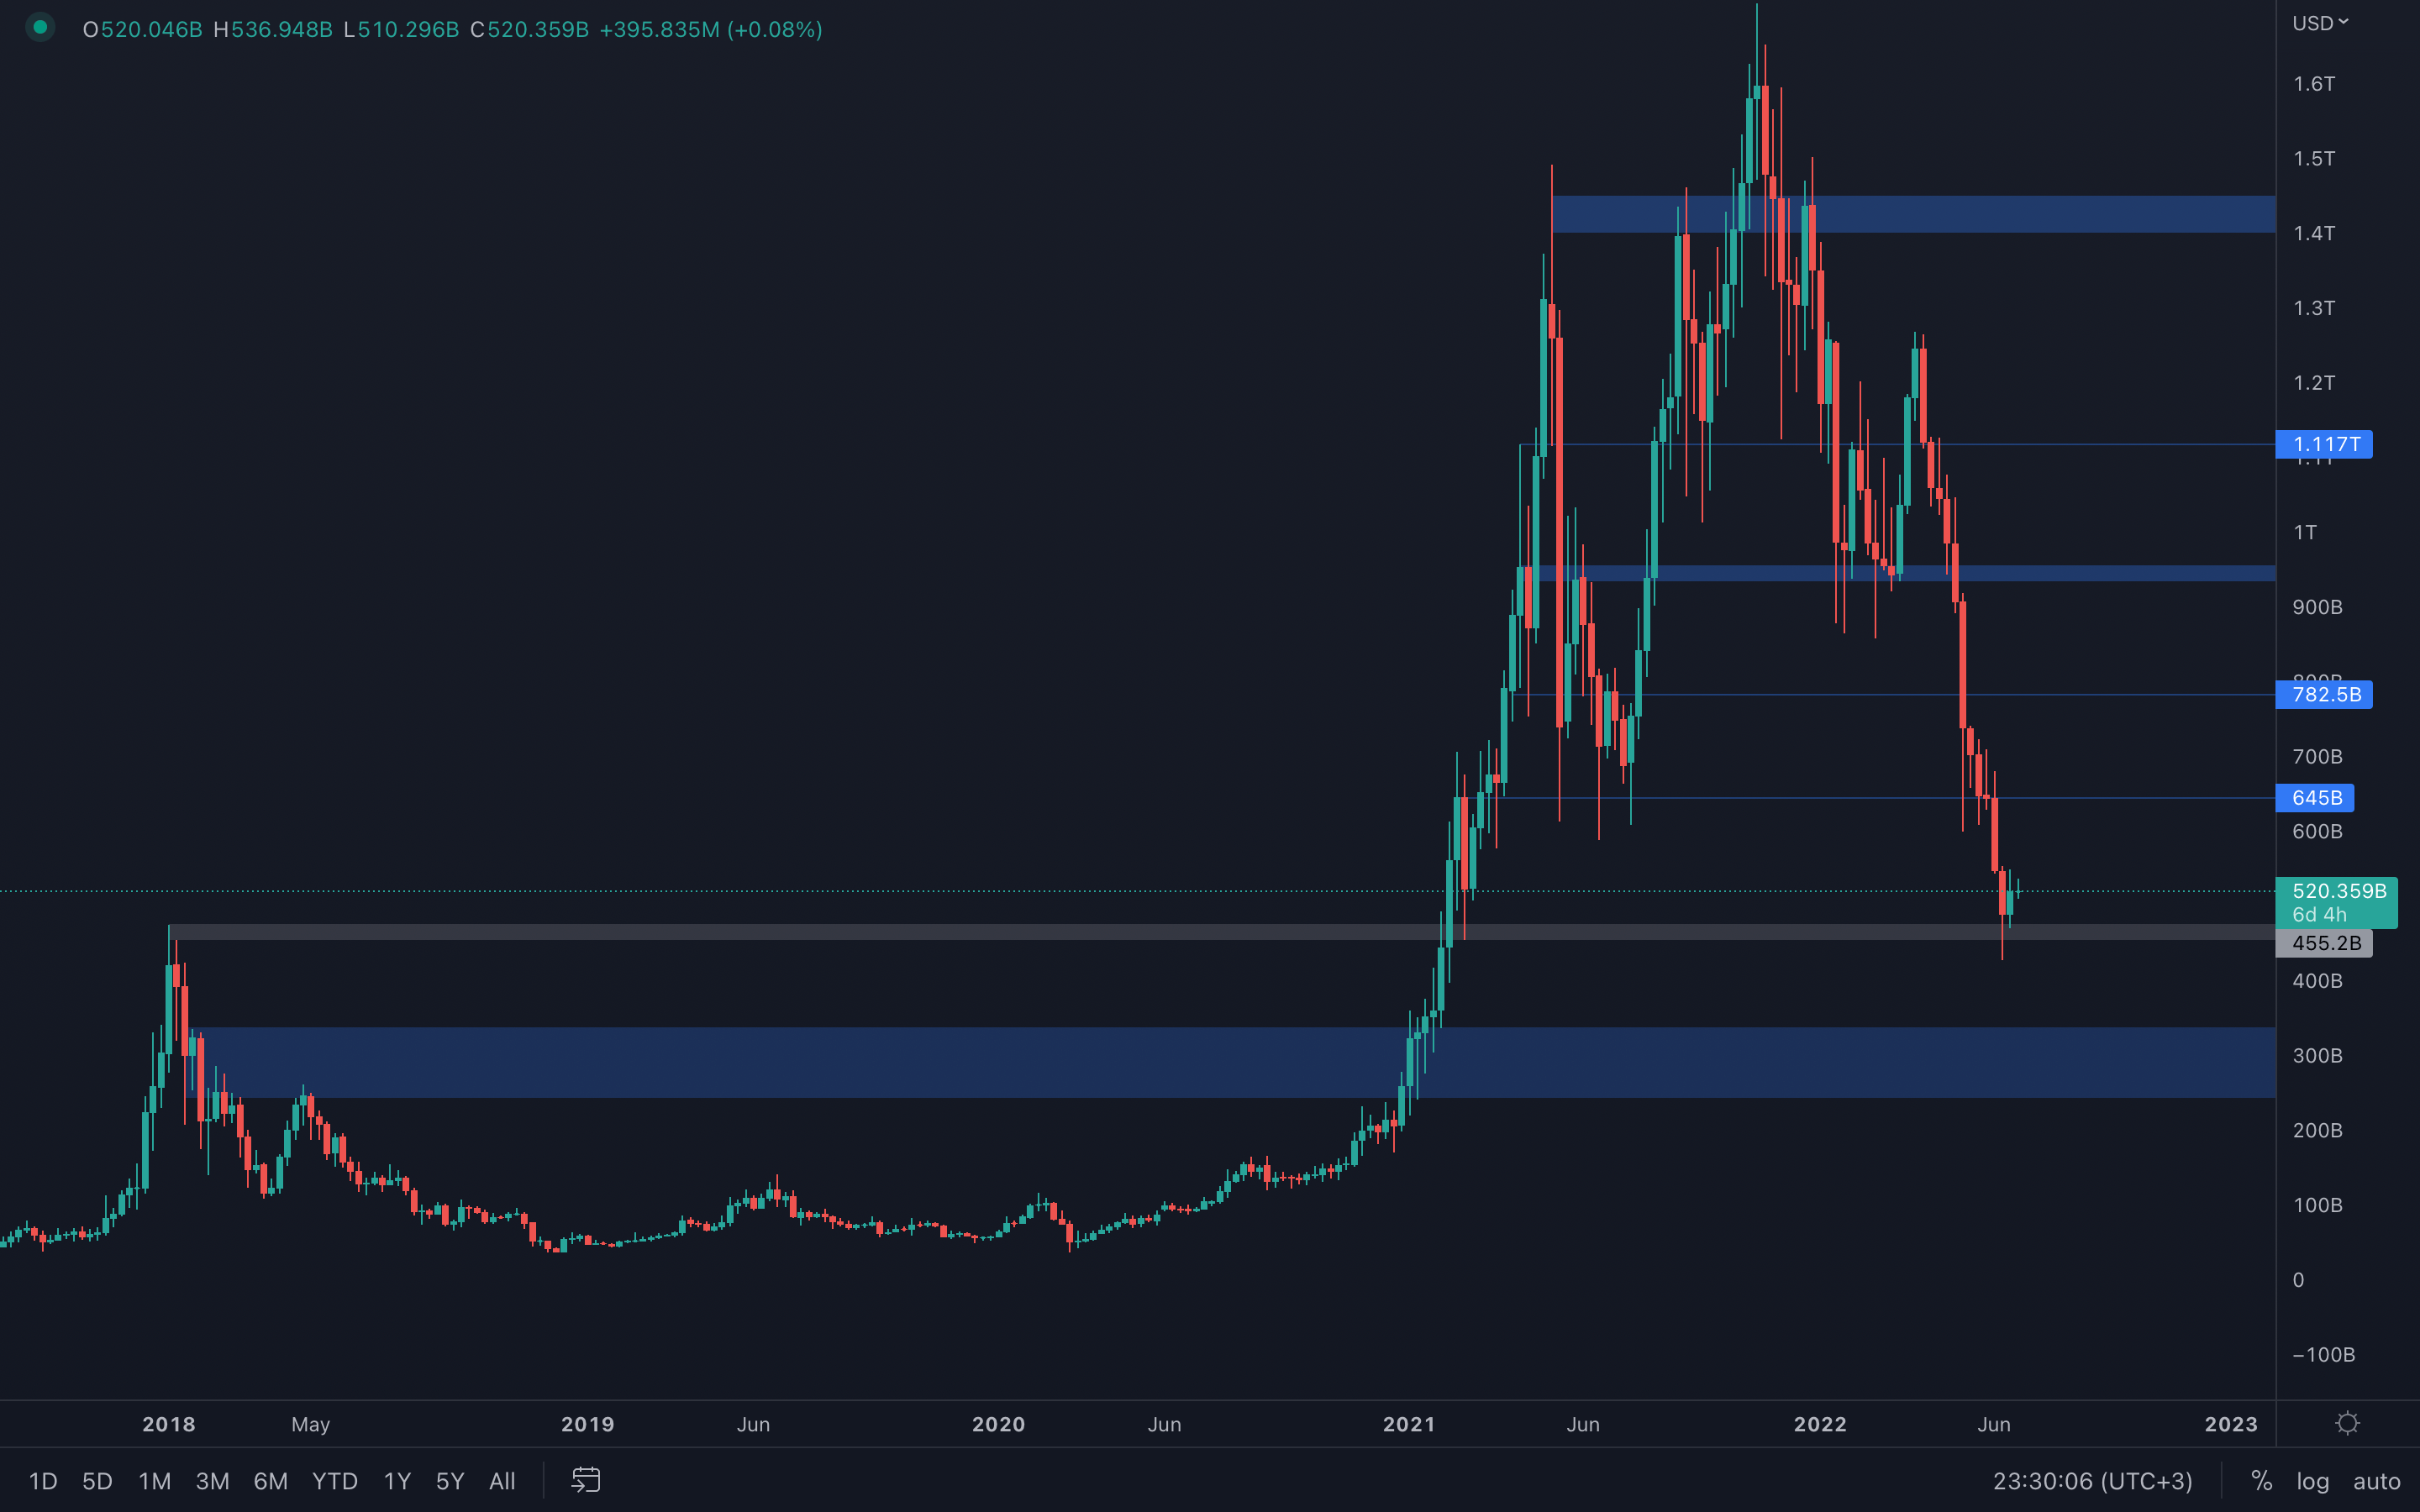 Since the Total Market Cap chart is obviously similar to the Altcoins Market Cap chart, we can also see it trading above its 2018 all-time high. There are certainly odds of this being our local bottom, especially with a green weekly closure, something we're getting kinda unfamiliar with unfortunately. If we assume the Total Market Cap will be testing its $1T resistance level, then the Altcoins Market Cap should rise to around $570B - $600B. Caution is advised, as usual.
Bitcoin - Technical & On-Chain Analysis
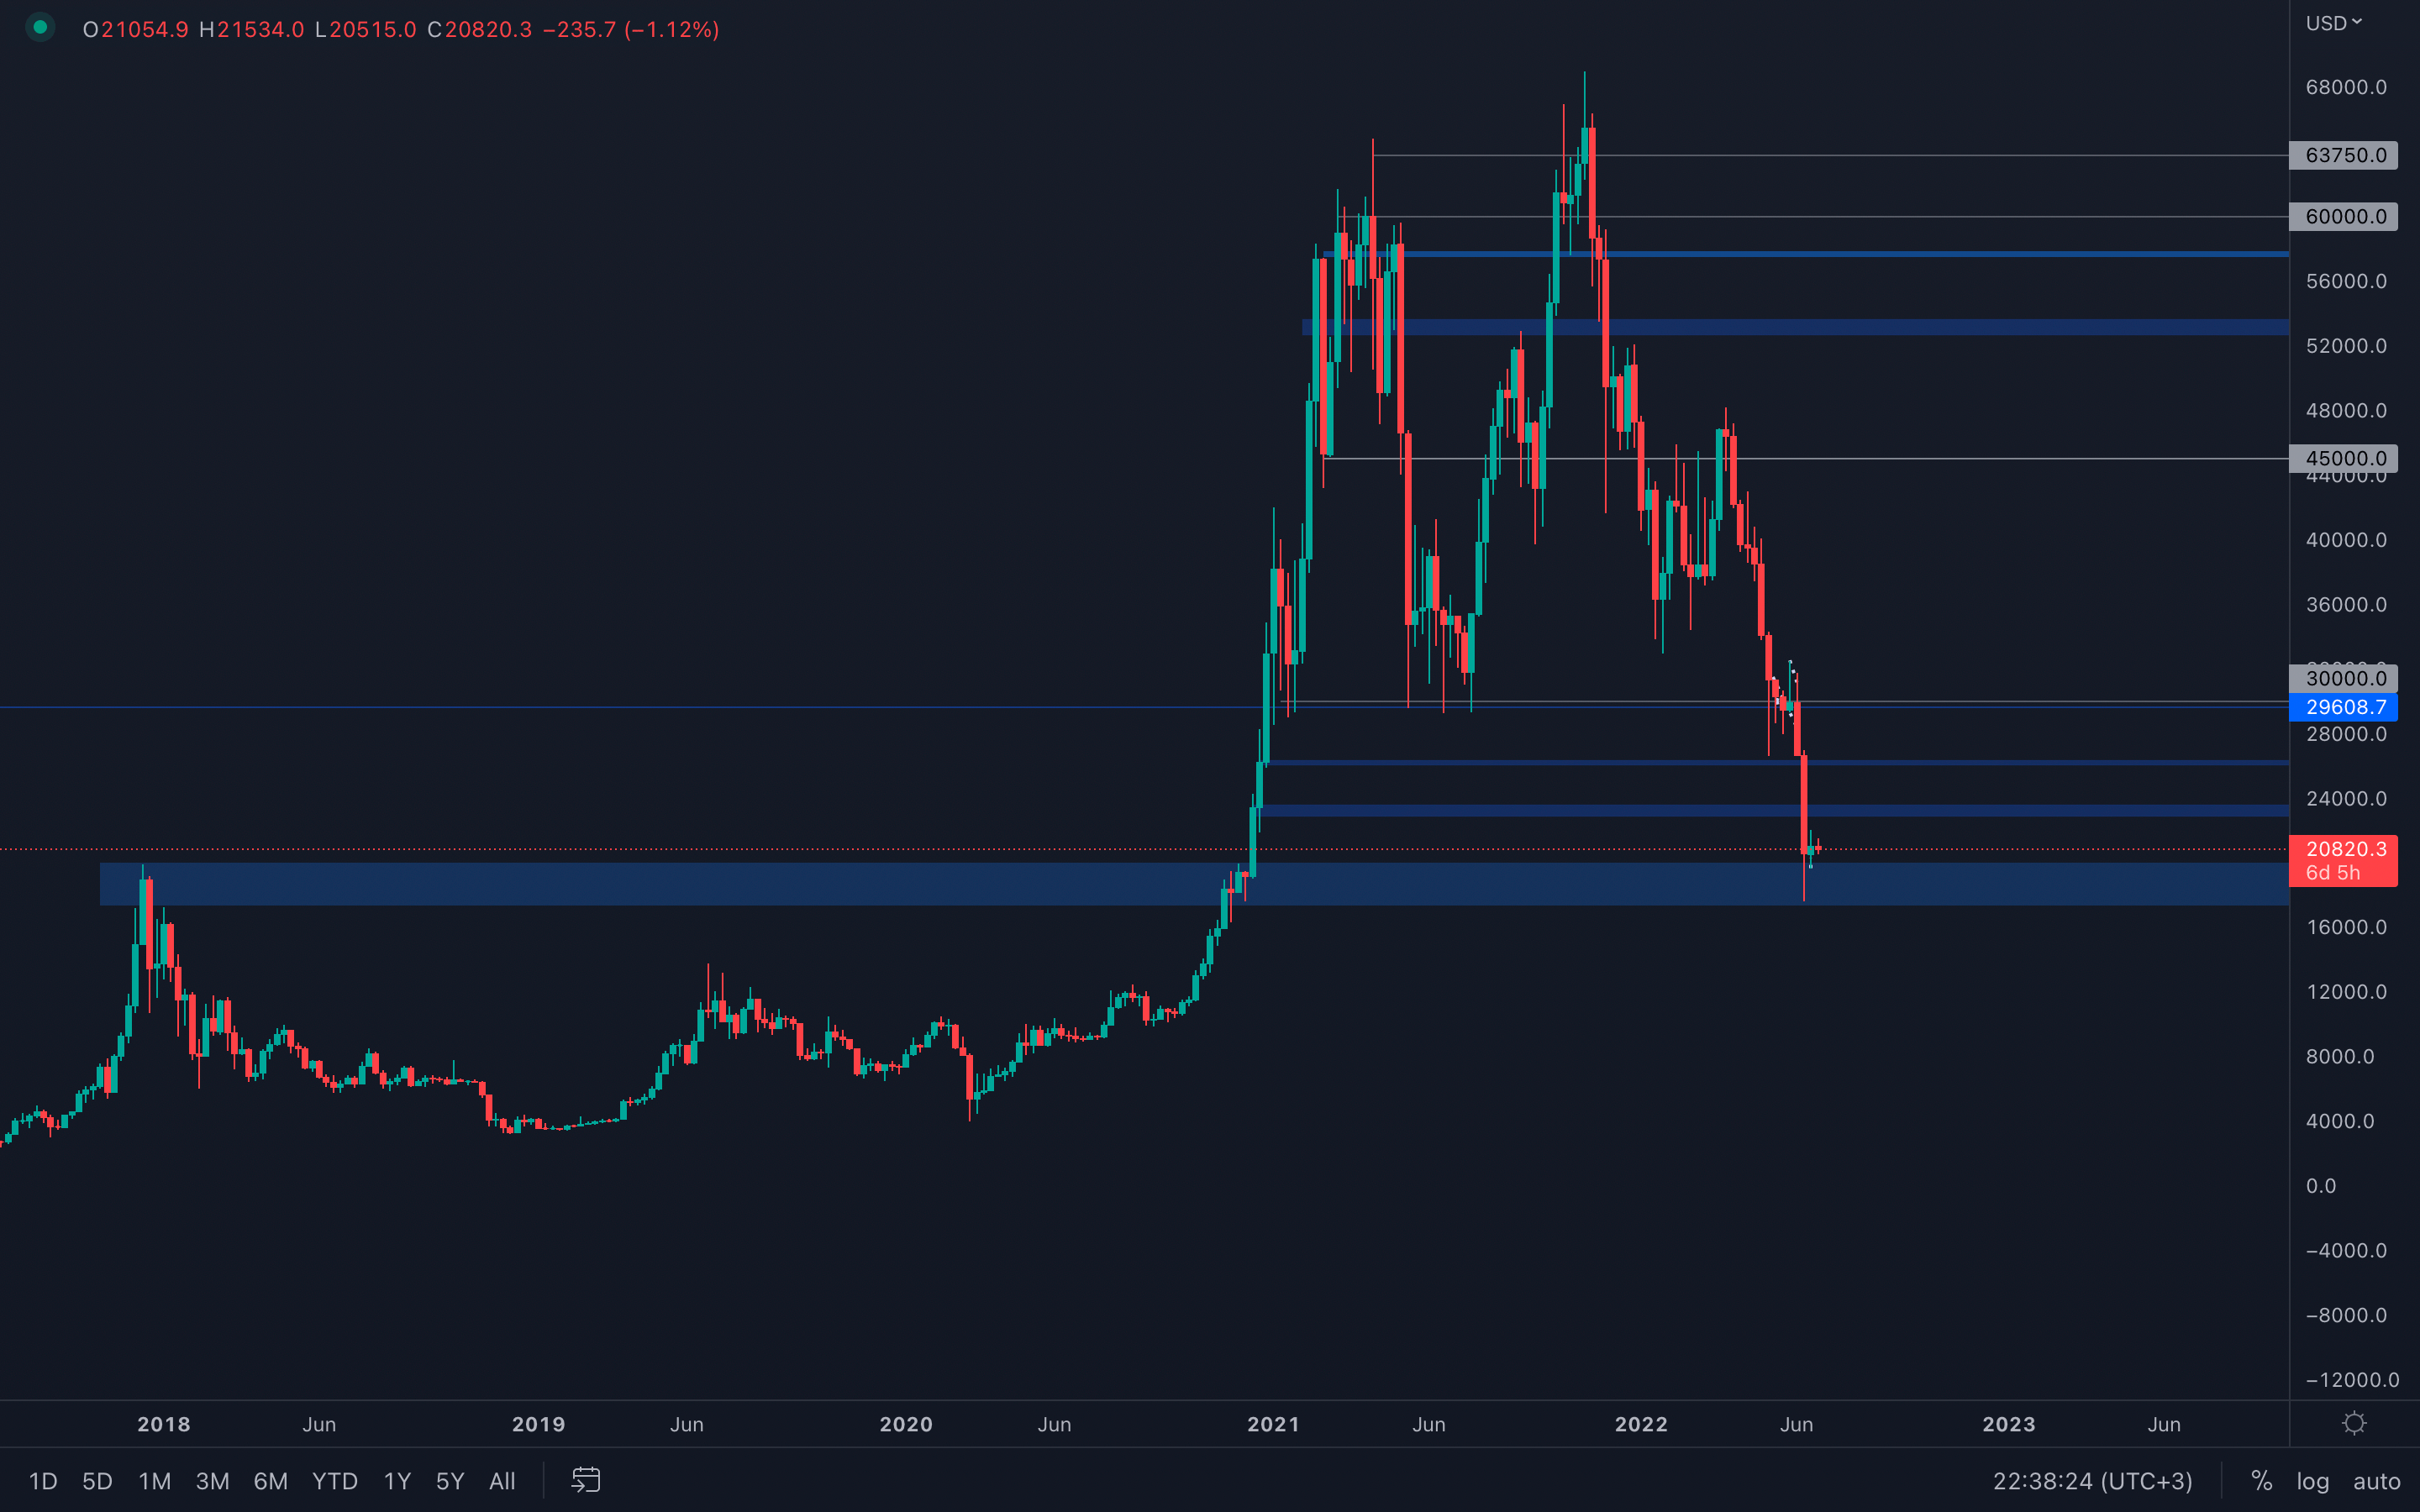 Bitcoin came back down to a decisive level - the 2017 - 2018 all-time high. This is the ultimate threshold, the level that keeps Bitcoin from getting absolutely crushed, or ranging for multiple months above $20k. Difference here is, we've never had the price of Bitcoin drop under the previous' bull market all-time high - and now we do. The price of Bitcoin has dropped under its 2017 - 2018 all-time high, as low as $17600. Does that change anything as of now? Not particularly. We still have no weekly closure under the 2017 - 2018 all-time high to confirm further downside, which is why we should be expecting ranging between $17600 and $24000 in the upcoming weeks.
Metric 1 – Large Wallet Inflows
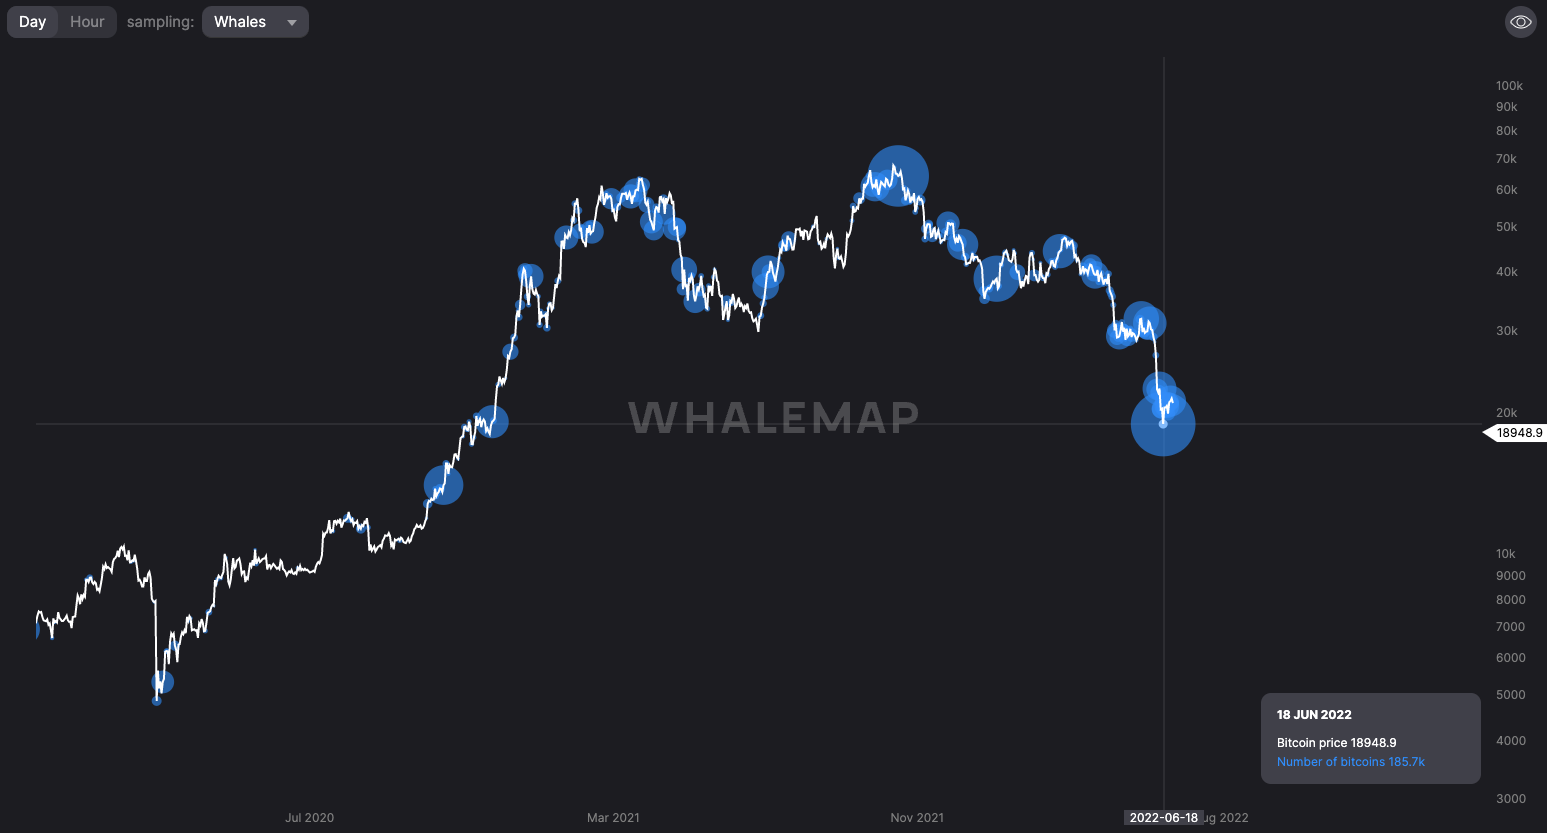
After the price lows were hit in mid-June, one of the key things we look out for is are the historically most profitable Bitcoin investors buying in? The large wallet inflows metric can show figuratively how much Bitcoin was bought. We can see in the graph below that there was a purchase of 185,000 Bitcoin at the $18,000 lows seen on June 18th.
Note: Unfortunately, there is no access for Ether in this same metric.
Bitcoin – Large Wallet Inflows
Metric 2 – Addresses
When seeing the above, we then will immediately look to the historically most profitable Bitcoin wallet address cohort to see if they have increased their exposure to the asset. If they have, then this would be a strong indicator towards swaying our opinion to potentially consider buying Bitcoin again.
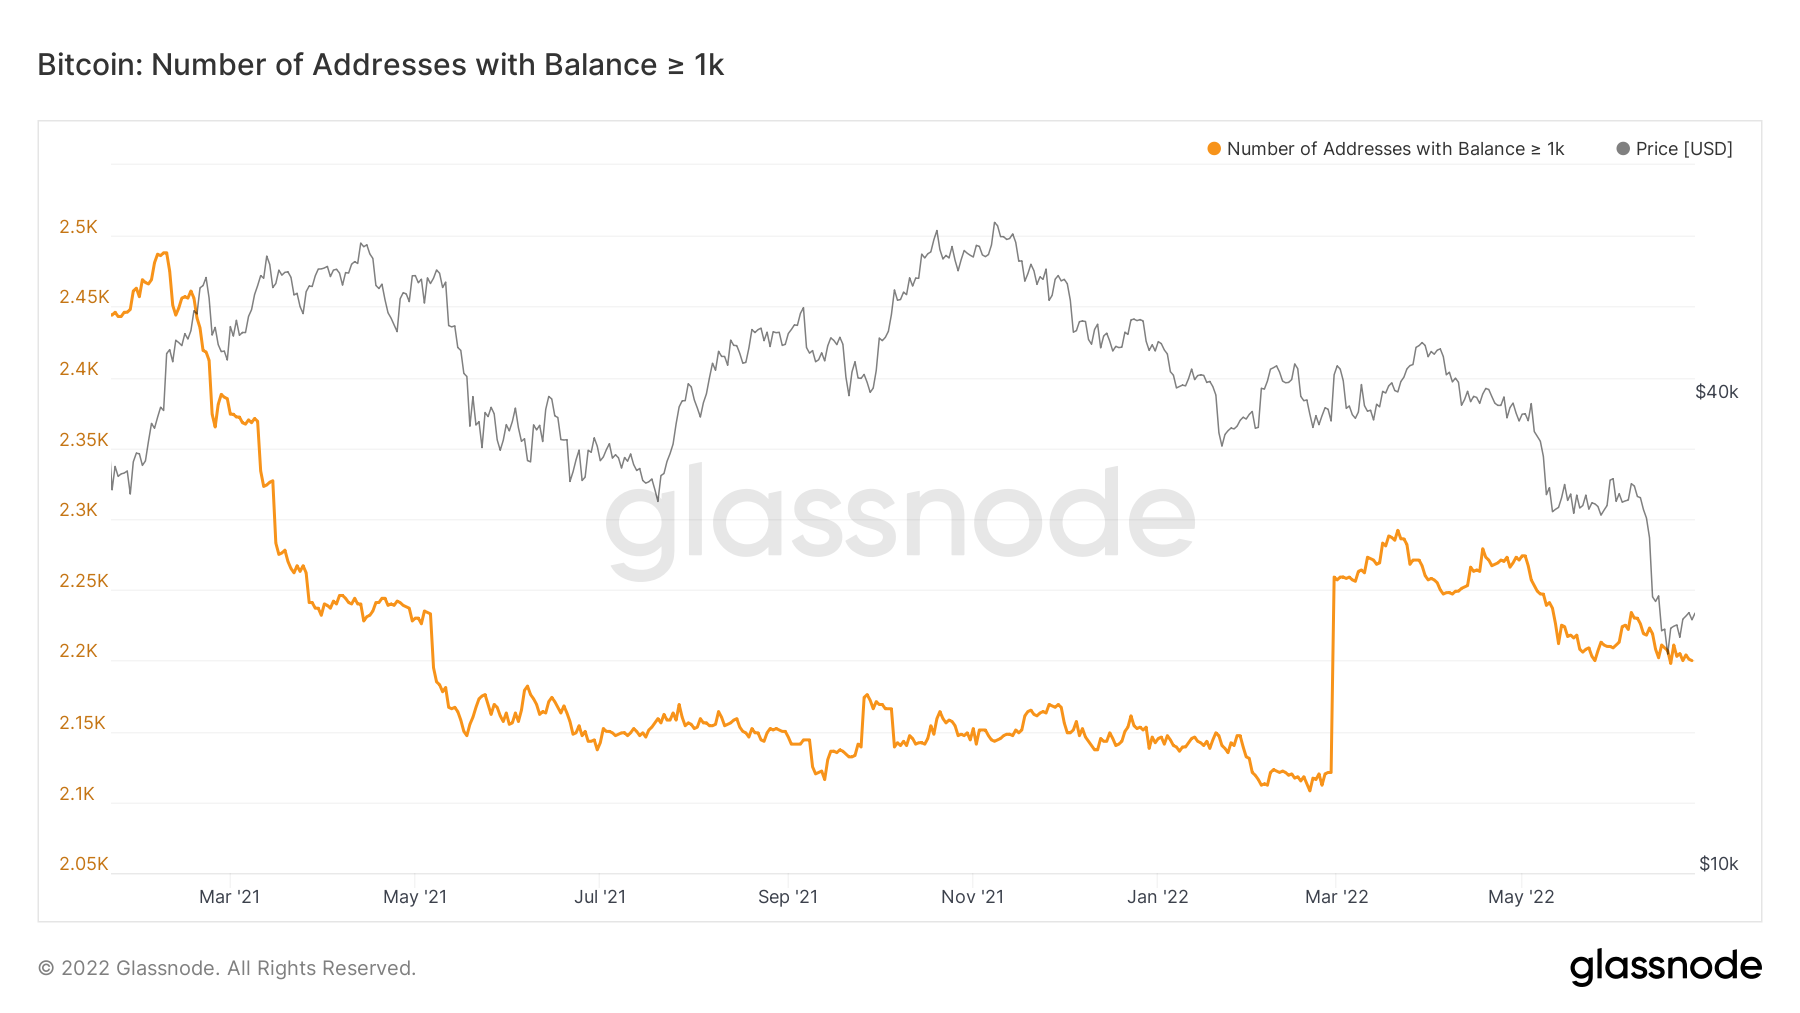
We can see in the below metric that the Bitcoin addresses holding more than 1,000 Bitcoin have not increased in number, in fact, the number of Bitcoin wallets holding more than 1,000 Bitcoin is continuing to decline, suggesting that this cohort of investors are still in a risk-off sentiment.
Bitcoin – Wallet Addresses with Balance > 1,000 Bitcoin
Metric 3 – Seller Exhaustion Constant
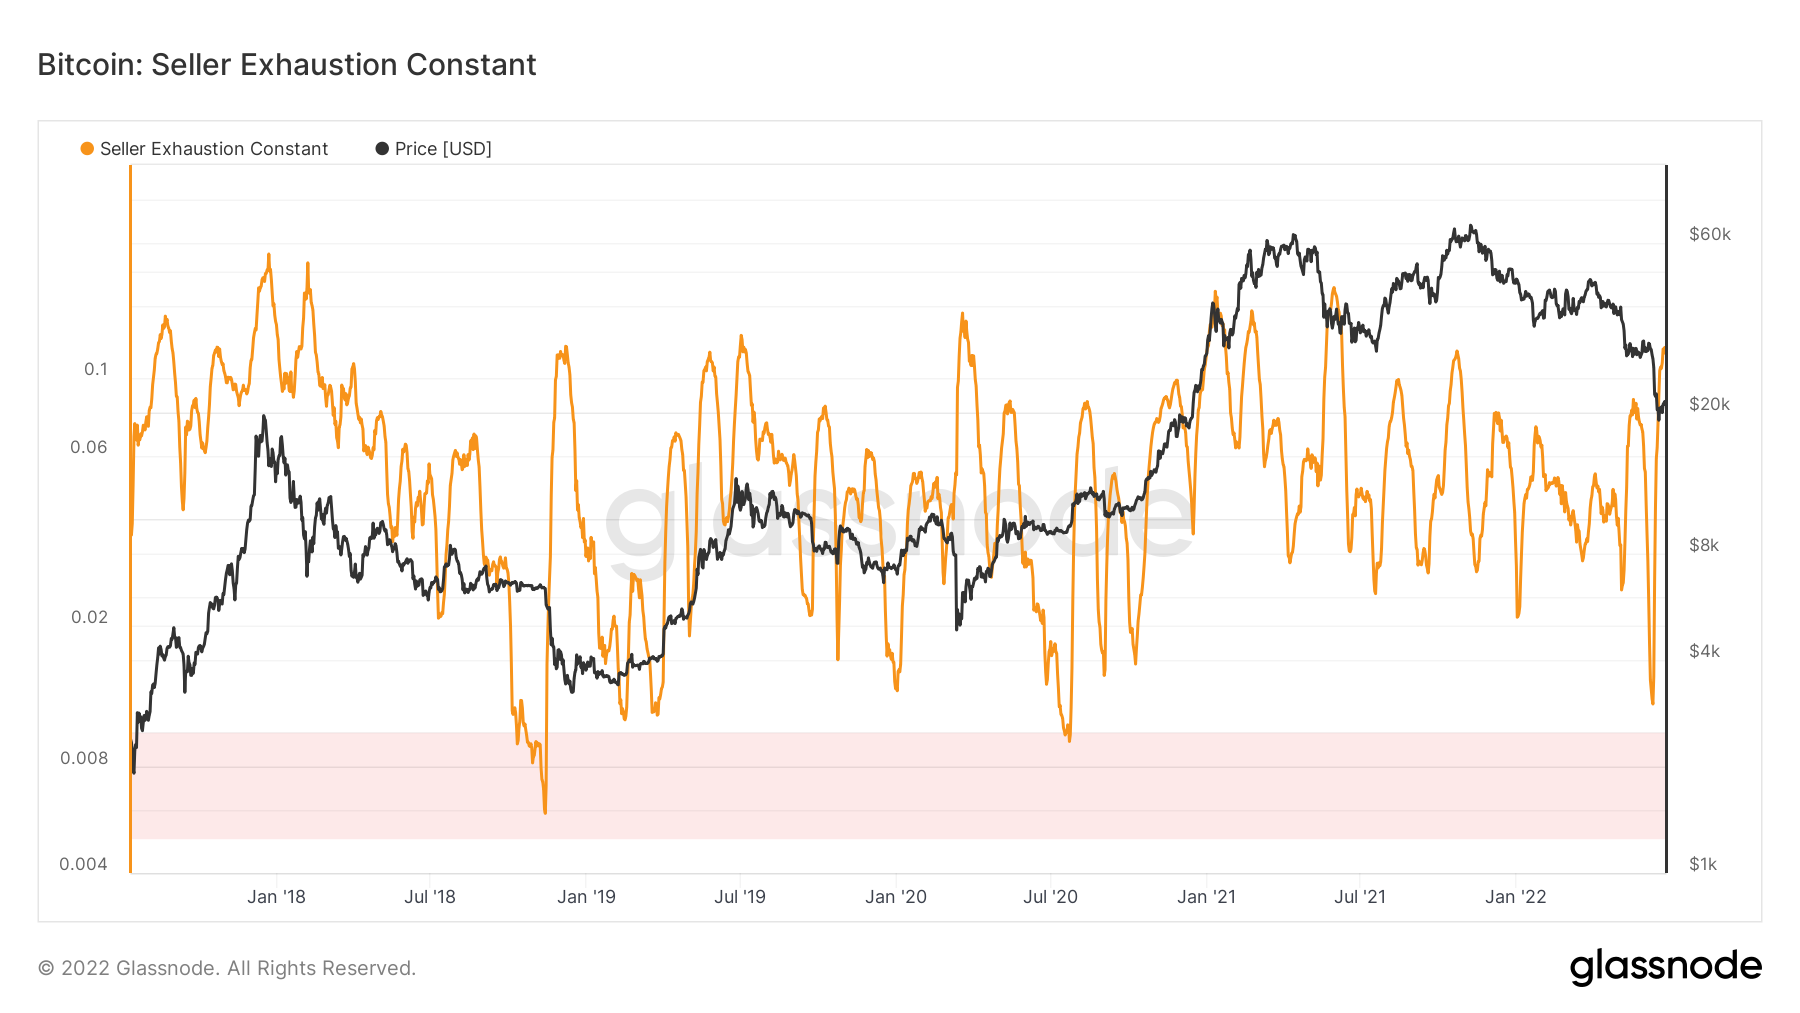
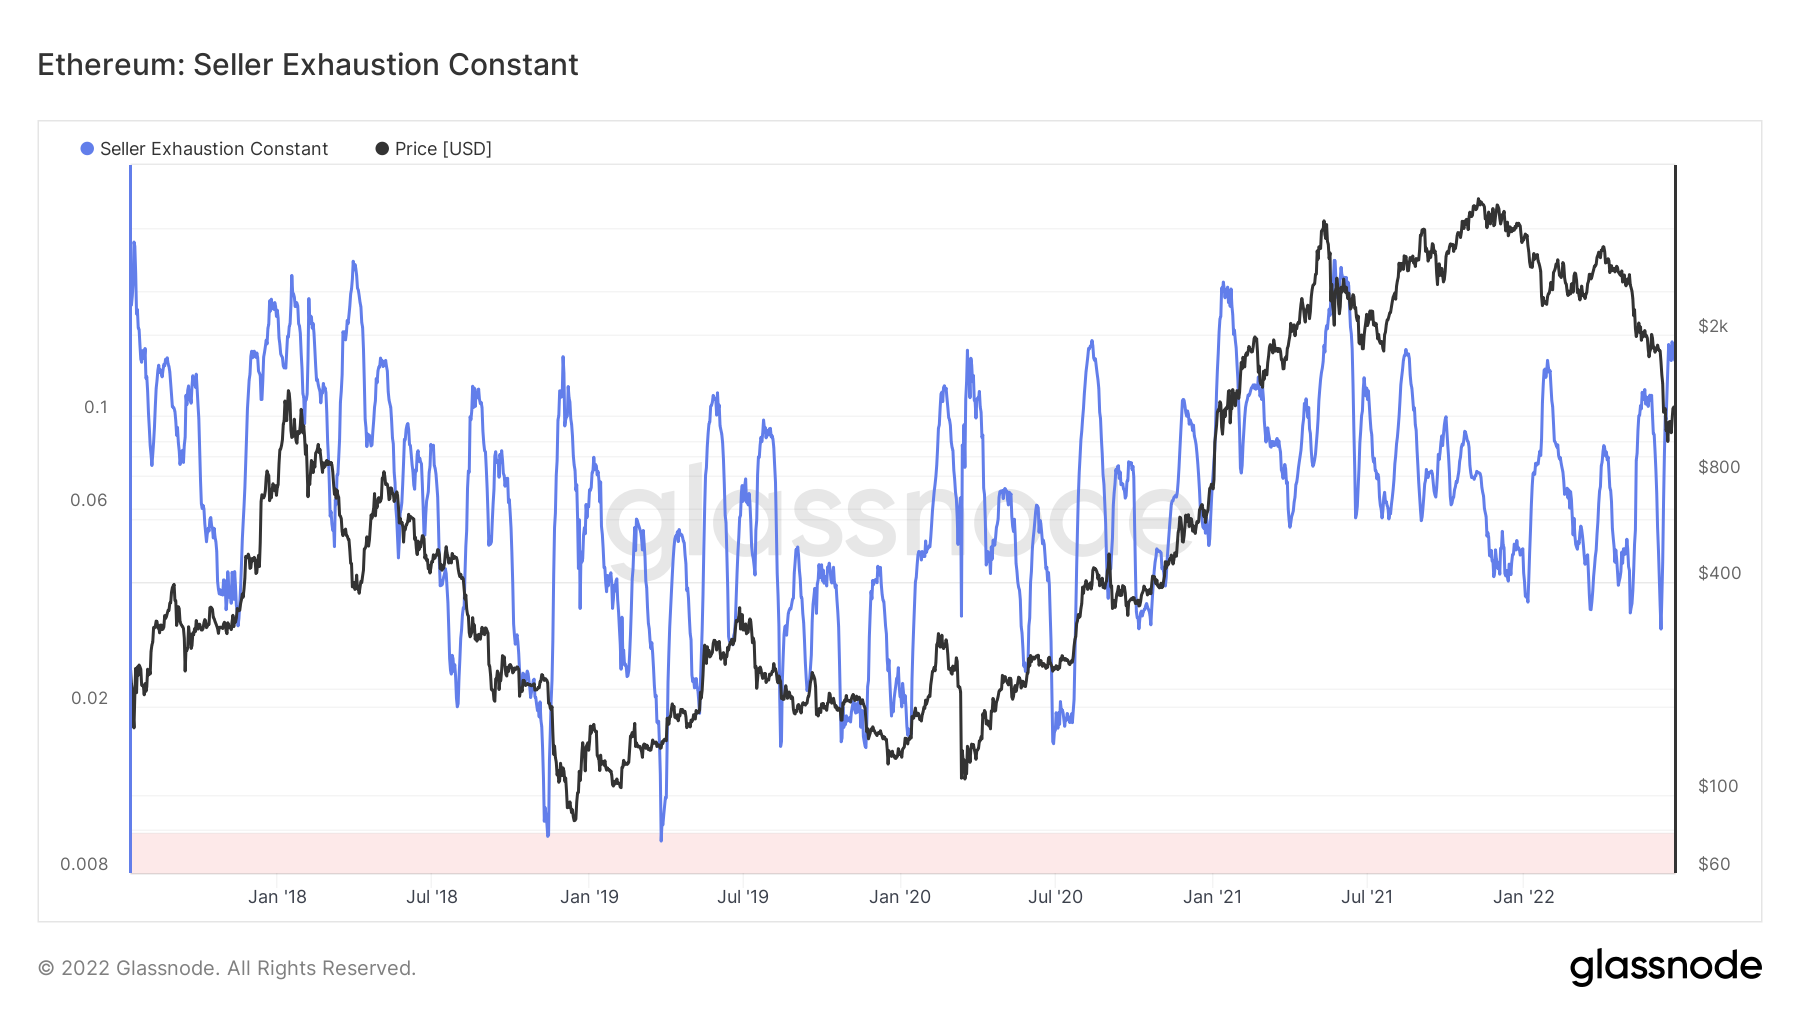
The Seller Exhaustion Constant detects when two factors align: low volatility and high losses, which as a result, produce low risk bottoms. At this moment in time, we can see from the below charts for both Bitcoin and Ether but particularly for Bitcoin, that this metric has spiked recently. The reason for this is likely due to the high amount of losses we have seen in the markets over the last few weeks (outlined in last week’s report). Ideally, we would want to see volatility decrease, as this would more strongly indicate a low-risk bottom (similar to what we saw back in 2018). So, it may therefore be the case that we need to see a reduction in volatility (a normal market state where there is a prolonged period after weak hands have been flushed out) before we can see a macro bottom.
Bitcoin – Seller Exhaustion Constant
CONTEXT:
Before we move on to our last metric, it is important to provide some context as to where we likely are in the market cycle. In many of Bitcoin’s cycles, we see prices come down 80-90% in the major caps and we then get a full reset in on-chain metrics such as Net Unrealised Profit/Loss, Net Realised Profit/Loss, MVRV Z-Score. We have seen the reset in these metrics that are now at zones that have historically been macro bottoms. However, one set of metrics that investors don’t usually look at in determining the macro bottoms is the activity of miners. One of the later stages of bear markets for Bitcoin is where the price drops to such a level that inefficient miners are no longer profitable and they turn off their mining rigs. Once this happens, the hash rate begins to drop and therefore difficulty to mine also drops, therefore this opens the door for more efficient miners to earn a greater portion of the rewards. These miners are then able to buy mining equipment at discounted rates and as result, push the rash rate and difficulty to mine higher. After a lengthy period of time, the price of BTC usually follows.
Metric 4 – Hash Ribbon
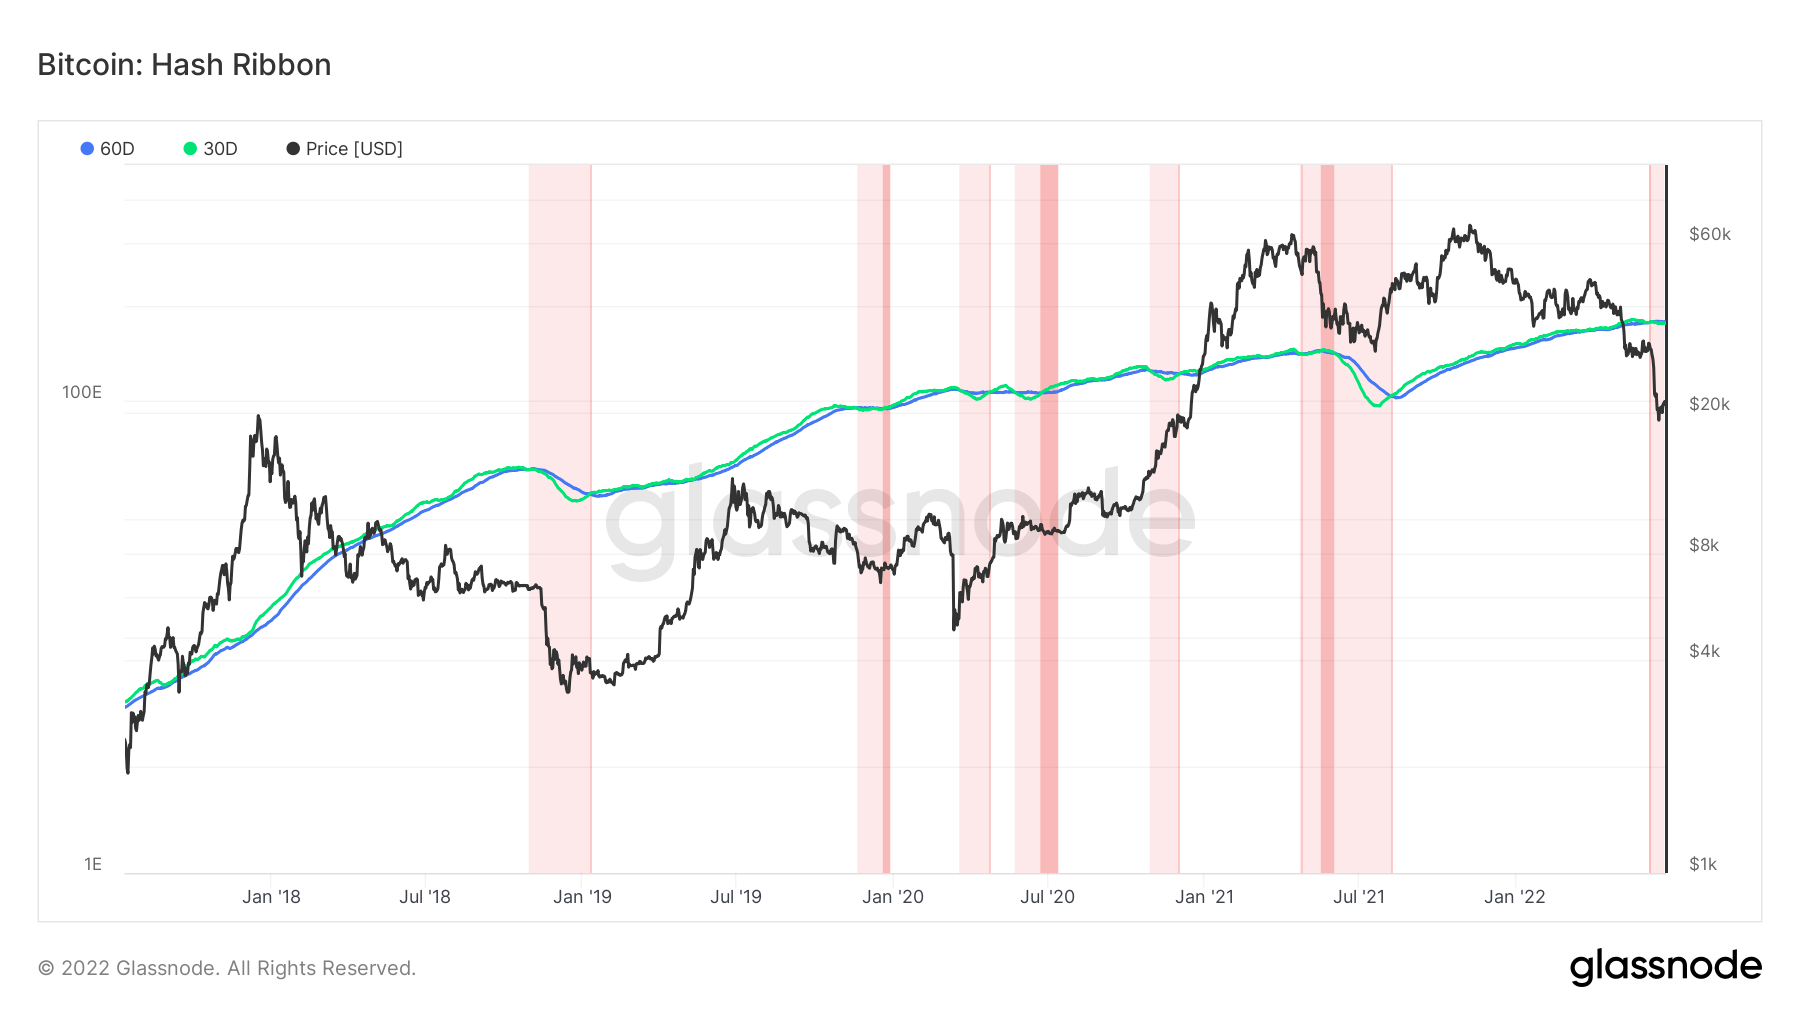
The Hash Ribbon is an indicator that suggests that the crypto market bottoms once miners have capitulated. Miner capitulation is over when the 30d MA of the hash rate crosses the 60d MA (switch from light red to dark red areas and then into white). We can see from the below graph that late 2018 is a great example of what we may be seeing with the current market. It’ll be important to continue tracking the light pink area we currently find ourselves in. This metric may become more clear in future weeks when there are possible flips out of the light pink zone. We will continue to track this over the coming weeks.
Bitcoin – Hash Ribbon
Ether - Technical & On-Chain Analysis
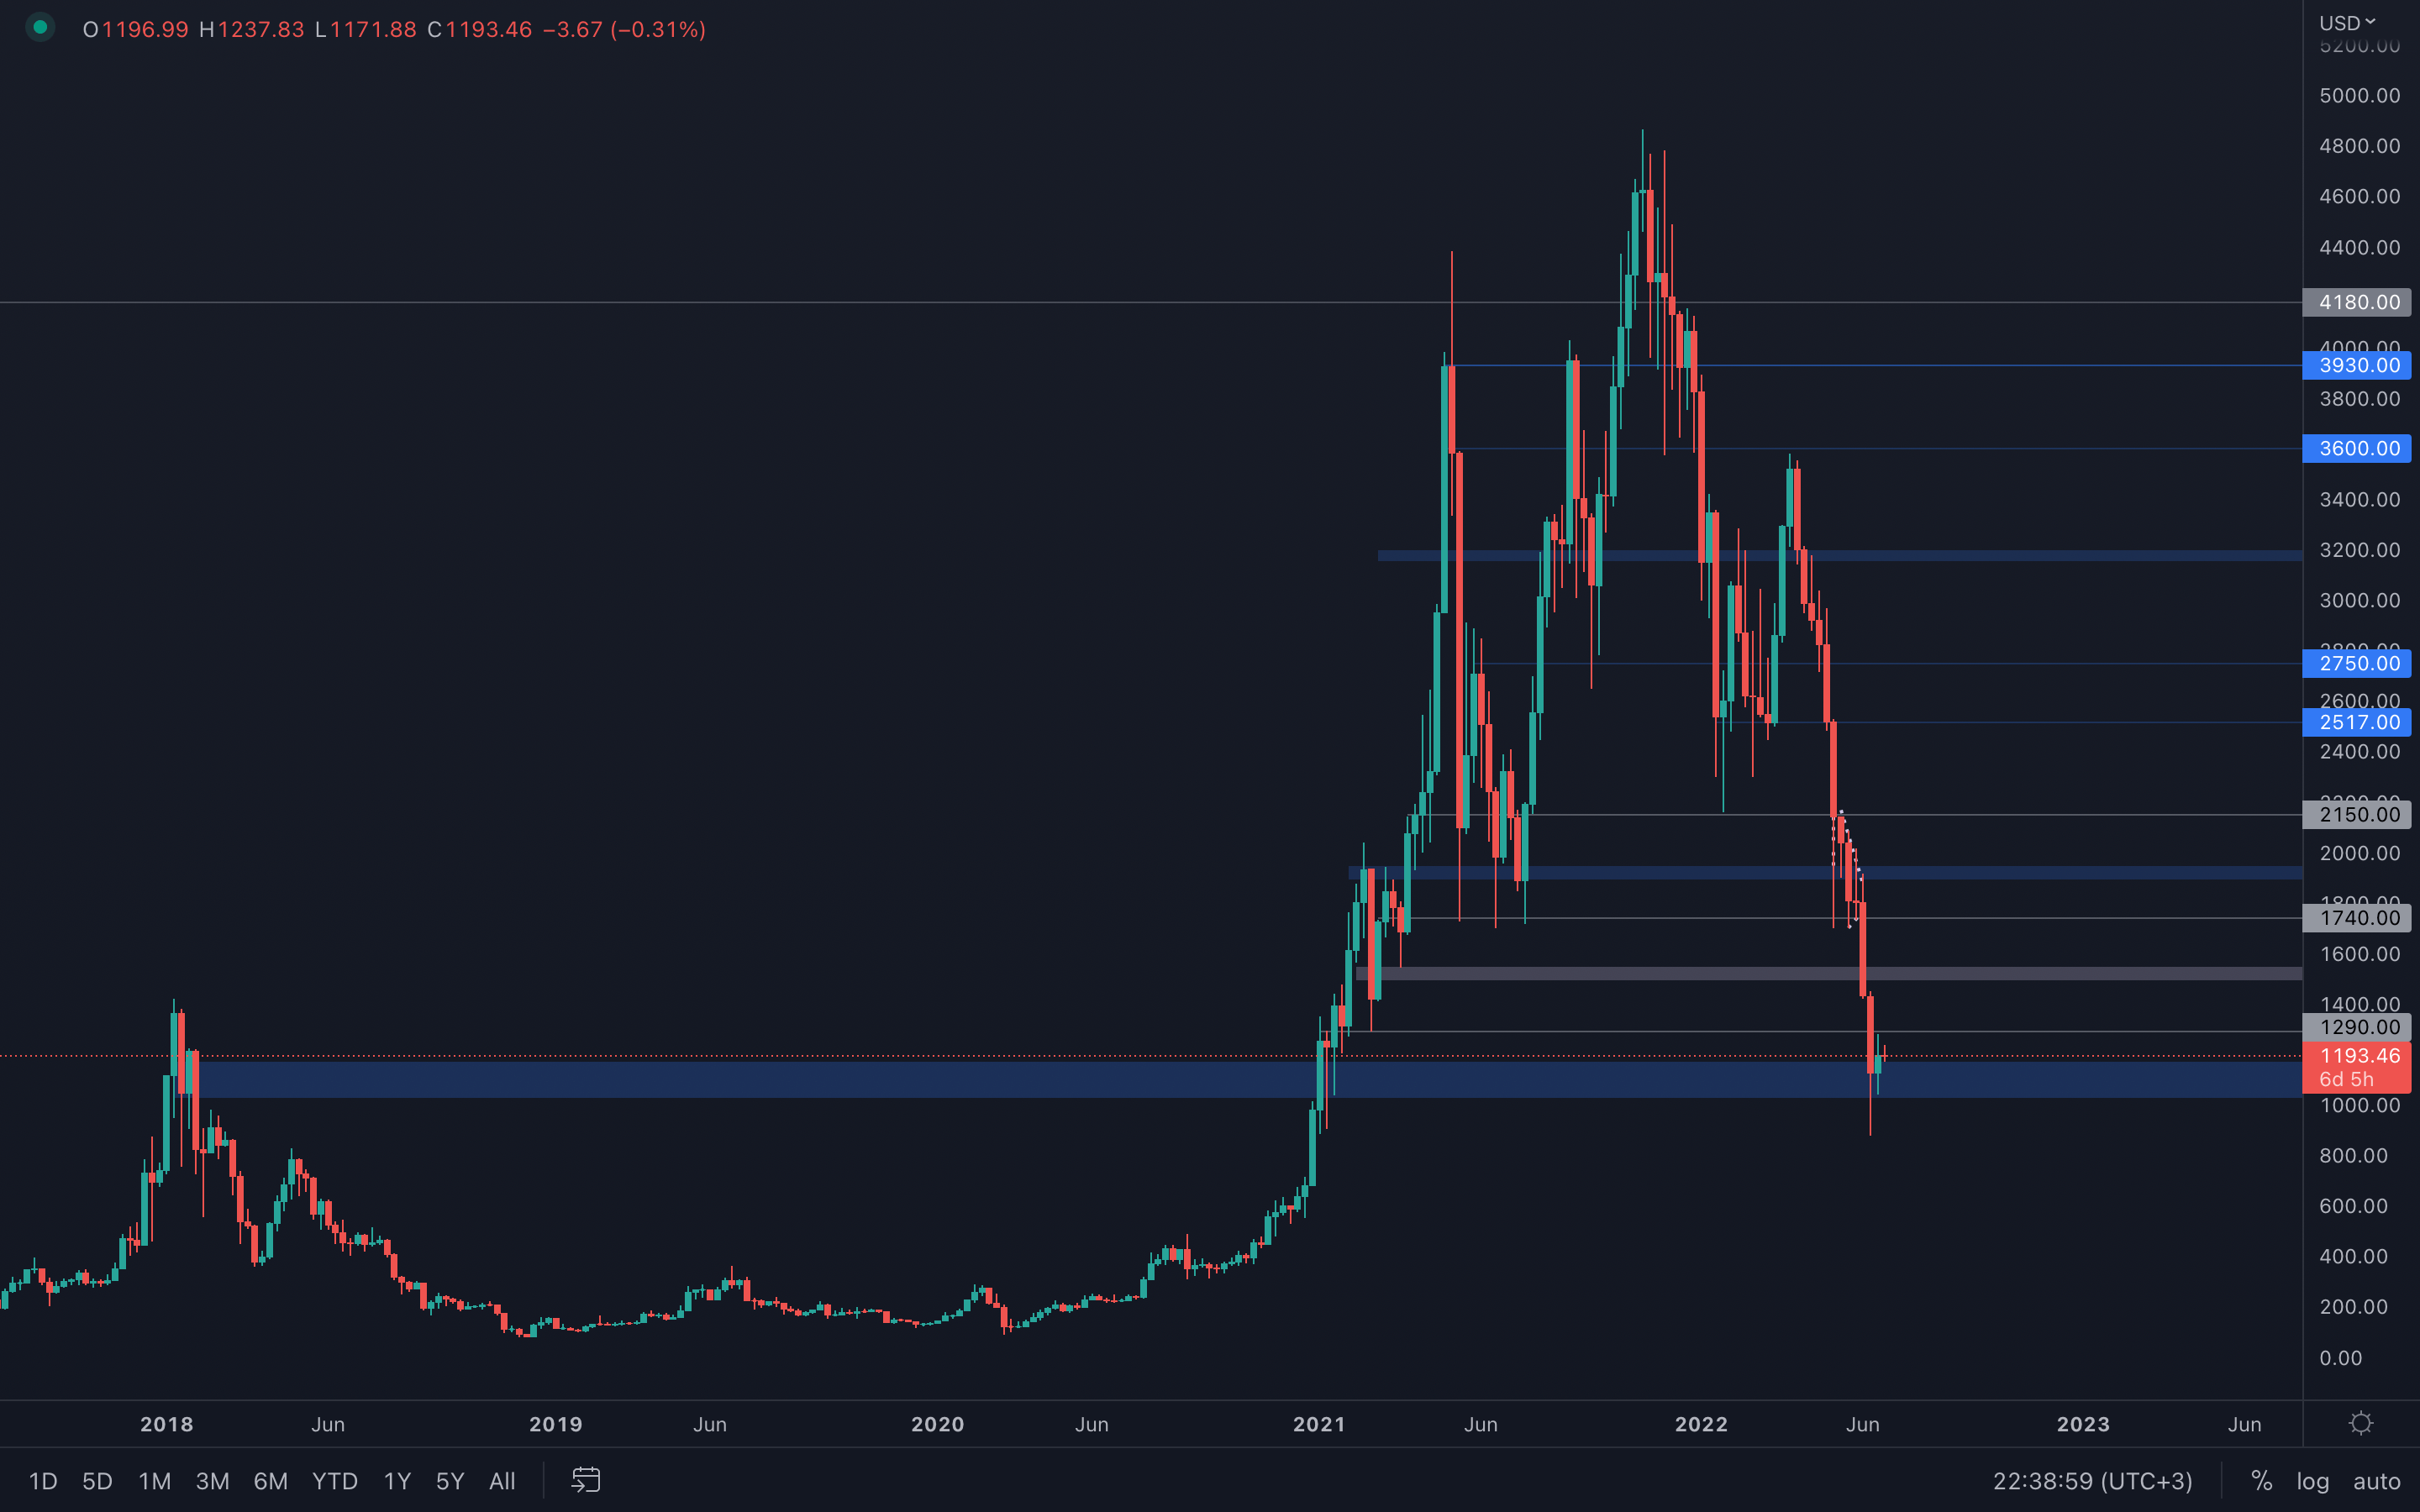 Ether has experienced a much more aggressive outcome compared to Bitcoin, as it has dropped under its 2018 all-time high and is currently still under it. An area of interest has been identified, however, and it seems Ether will continue to follow Bitcoin's price action perfectly (what a surprise!). As Bitcoin has no clear direction yet, same thing applies for Ether - expect ranging between $900 and $1300 for the coming weeks.
Metric 1 – Addresses
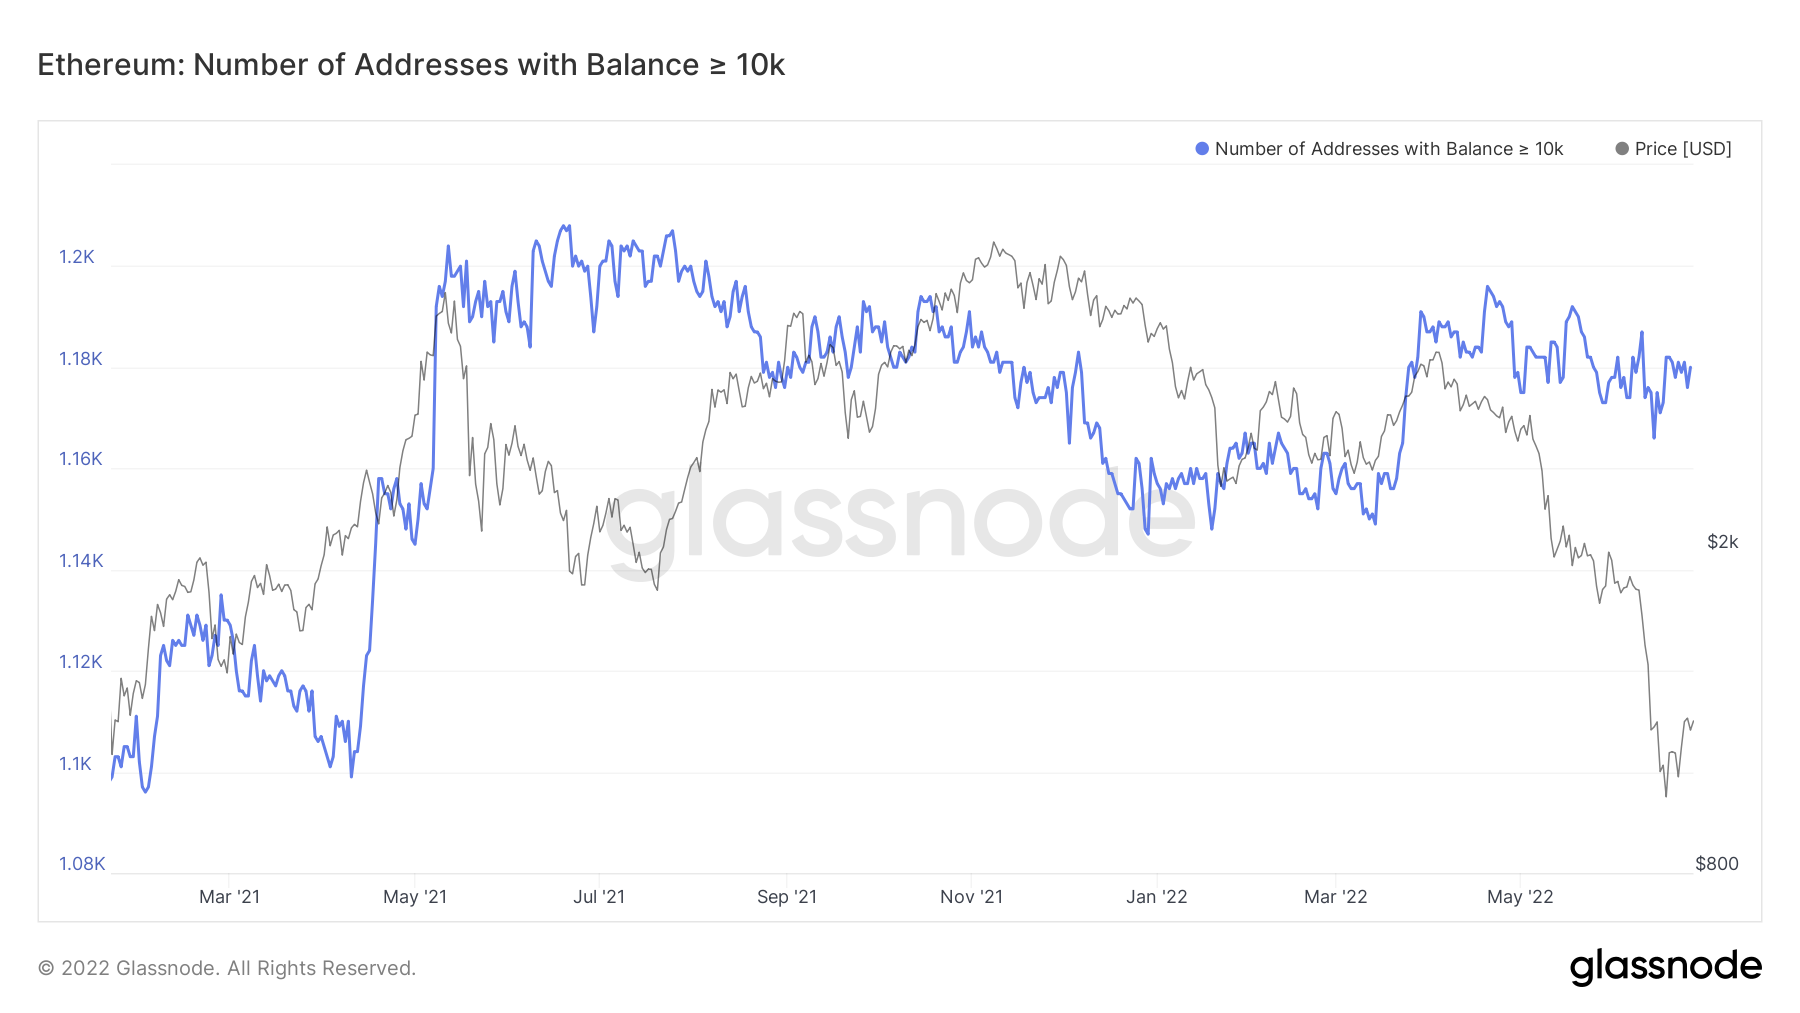
If we now turn our attention to a similar metric for Ether, we can see that the number of wallets that have more than 10,000 Ether in them has remained relatively high and has not risked off throughout all of 2022. Since the all-time high in price, we have seen the number of wallets actually remain unchanged, 1,181 wallets. It can therefore be determined that this metric for Bitcoin is a far better indicator of predicting future prices than the similar version of this metric for Ether.
Ether – Wallet Addresses with Balance > 10,000 Ether
Metric 2 – Seller Exhaustion Constant
DOT
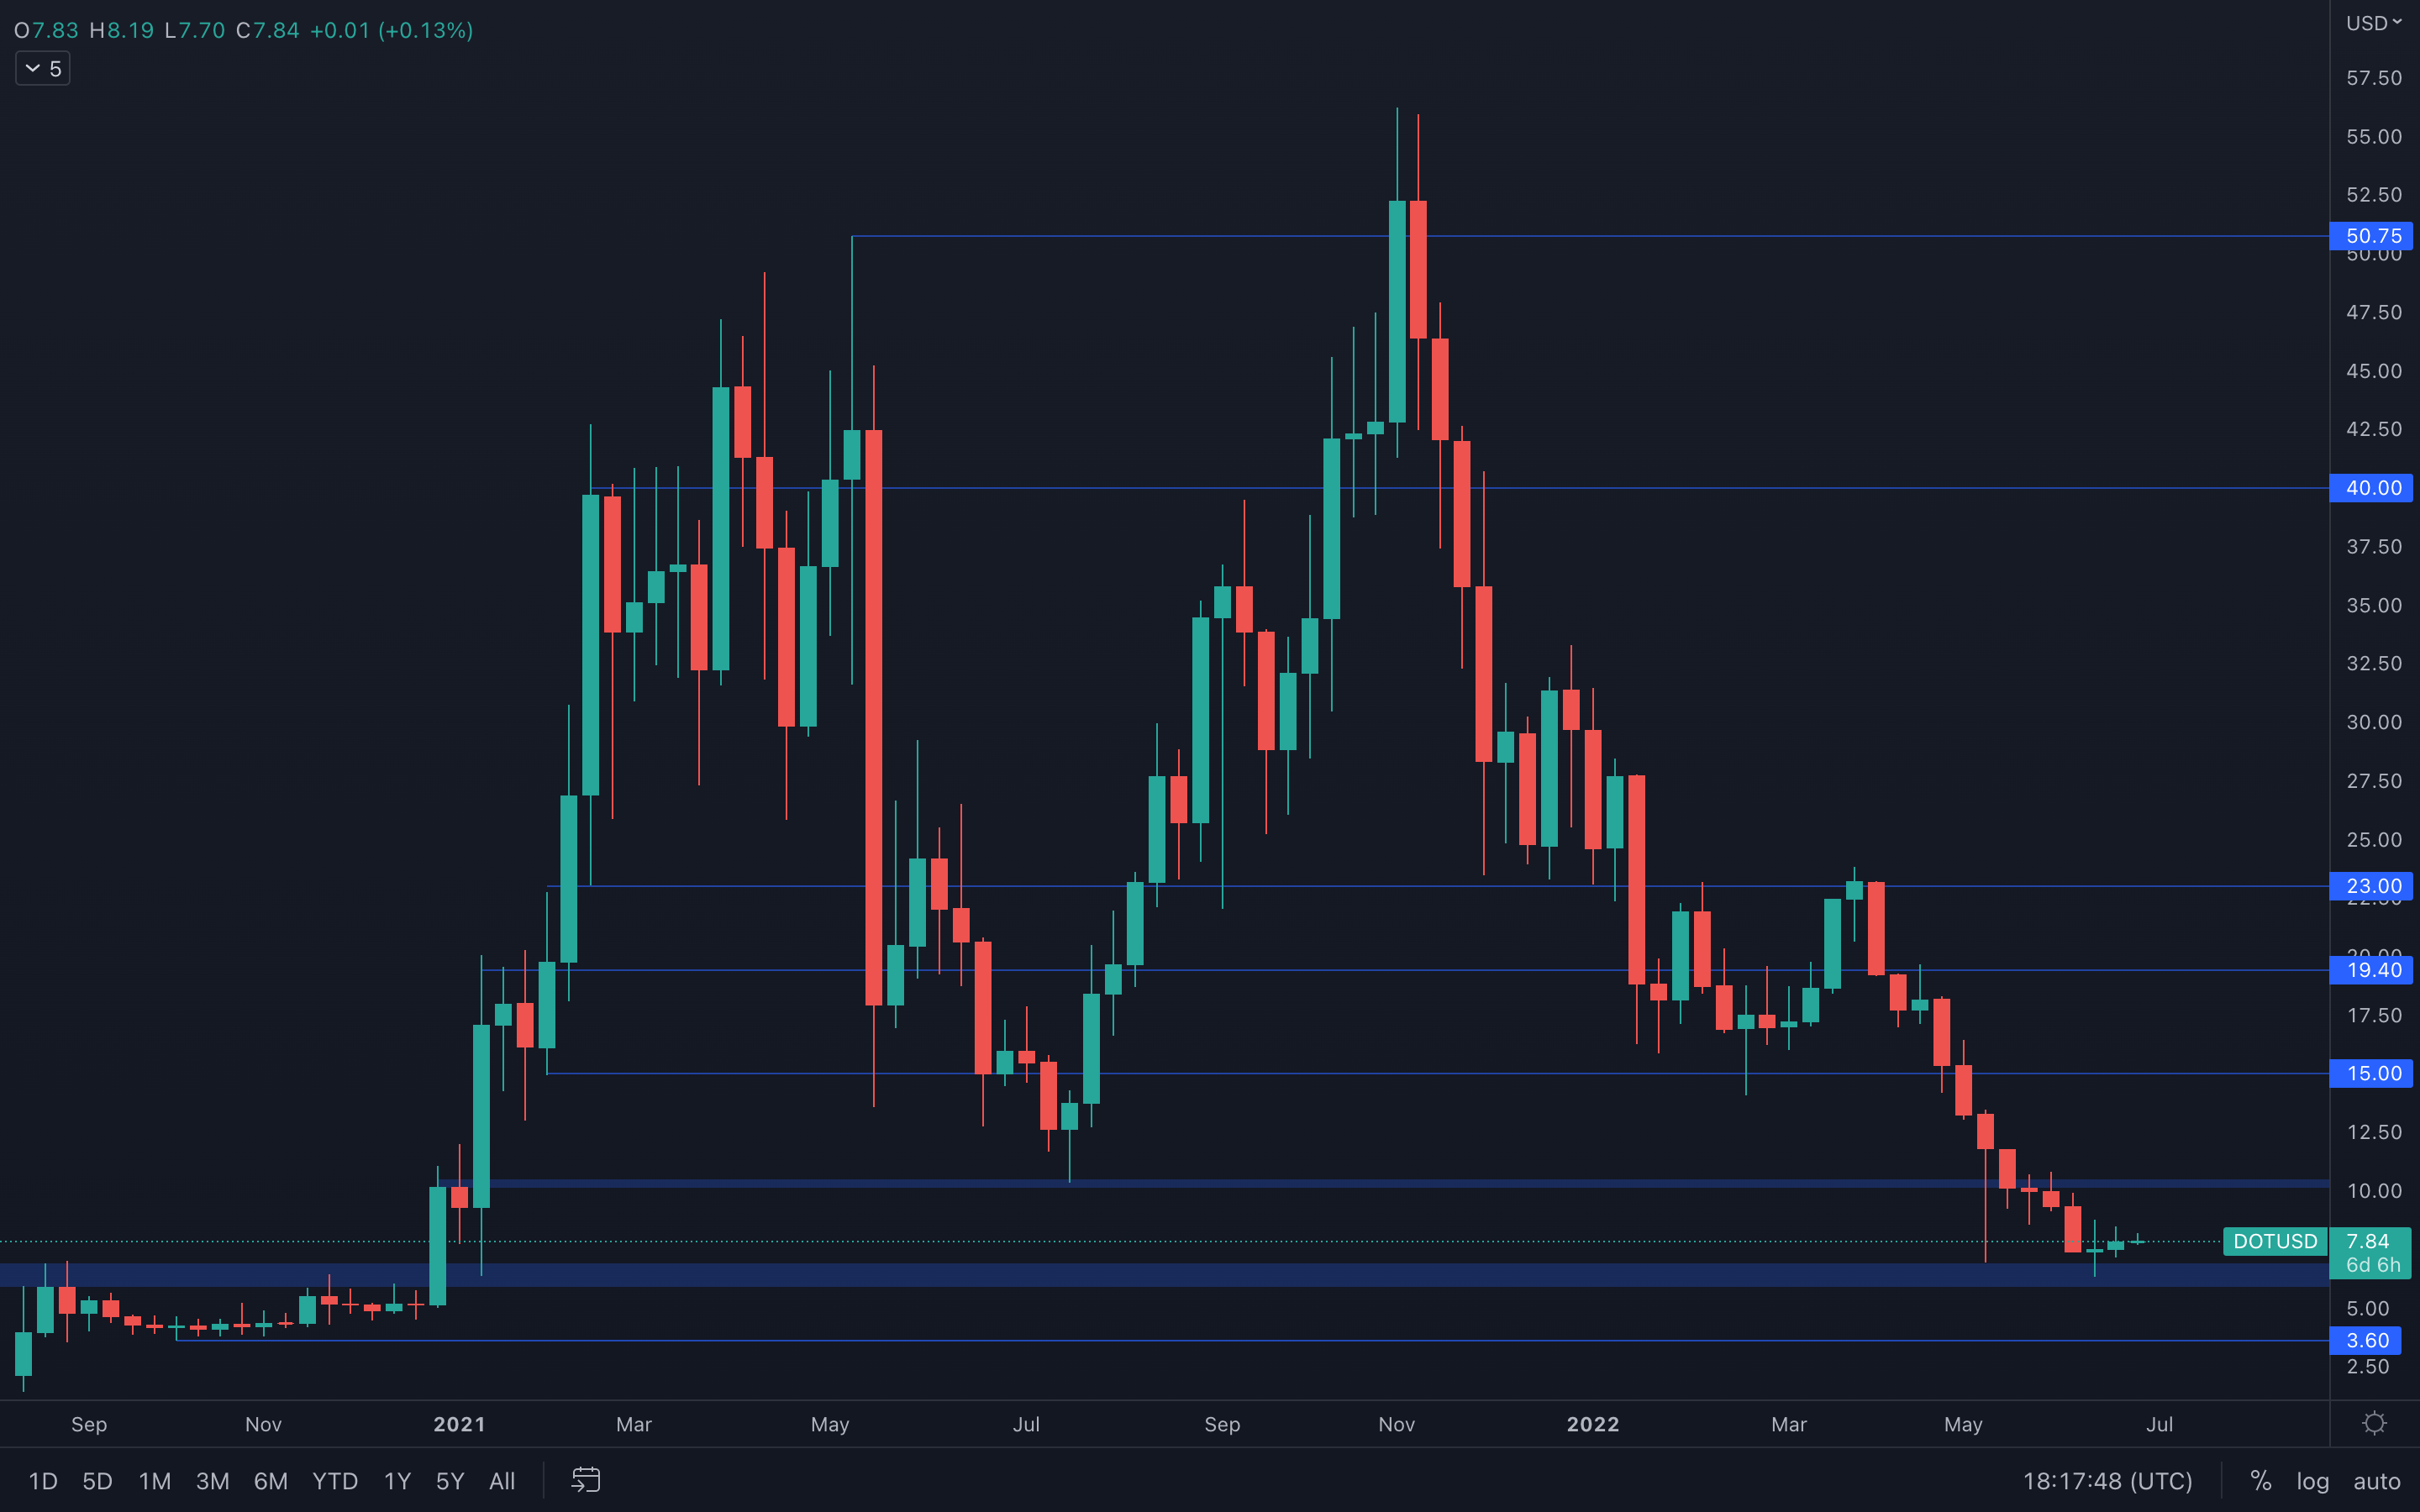 Surprising price action from DOT - there are two indecisive weekly candles that actually closed green, regardless of the rest of the market. With support just under at the $6.5 level, it's safe to assume DOT can test $10, but even that can be short-lived. Volume is still decreasing, and, as we know, when there isn't volume, there isn't clarity. For now, expect ranging between $10 and $6, plenty trades to be taken within this range, if opportunities appear.
SNX
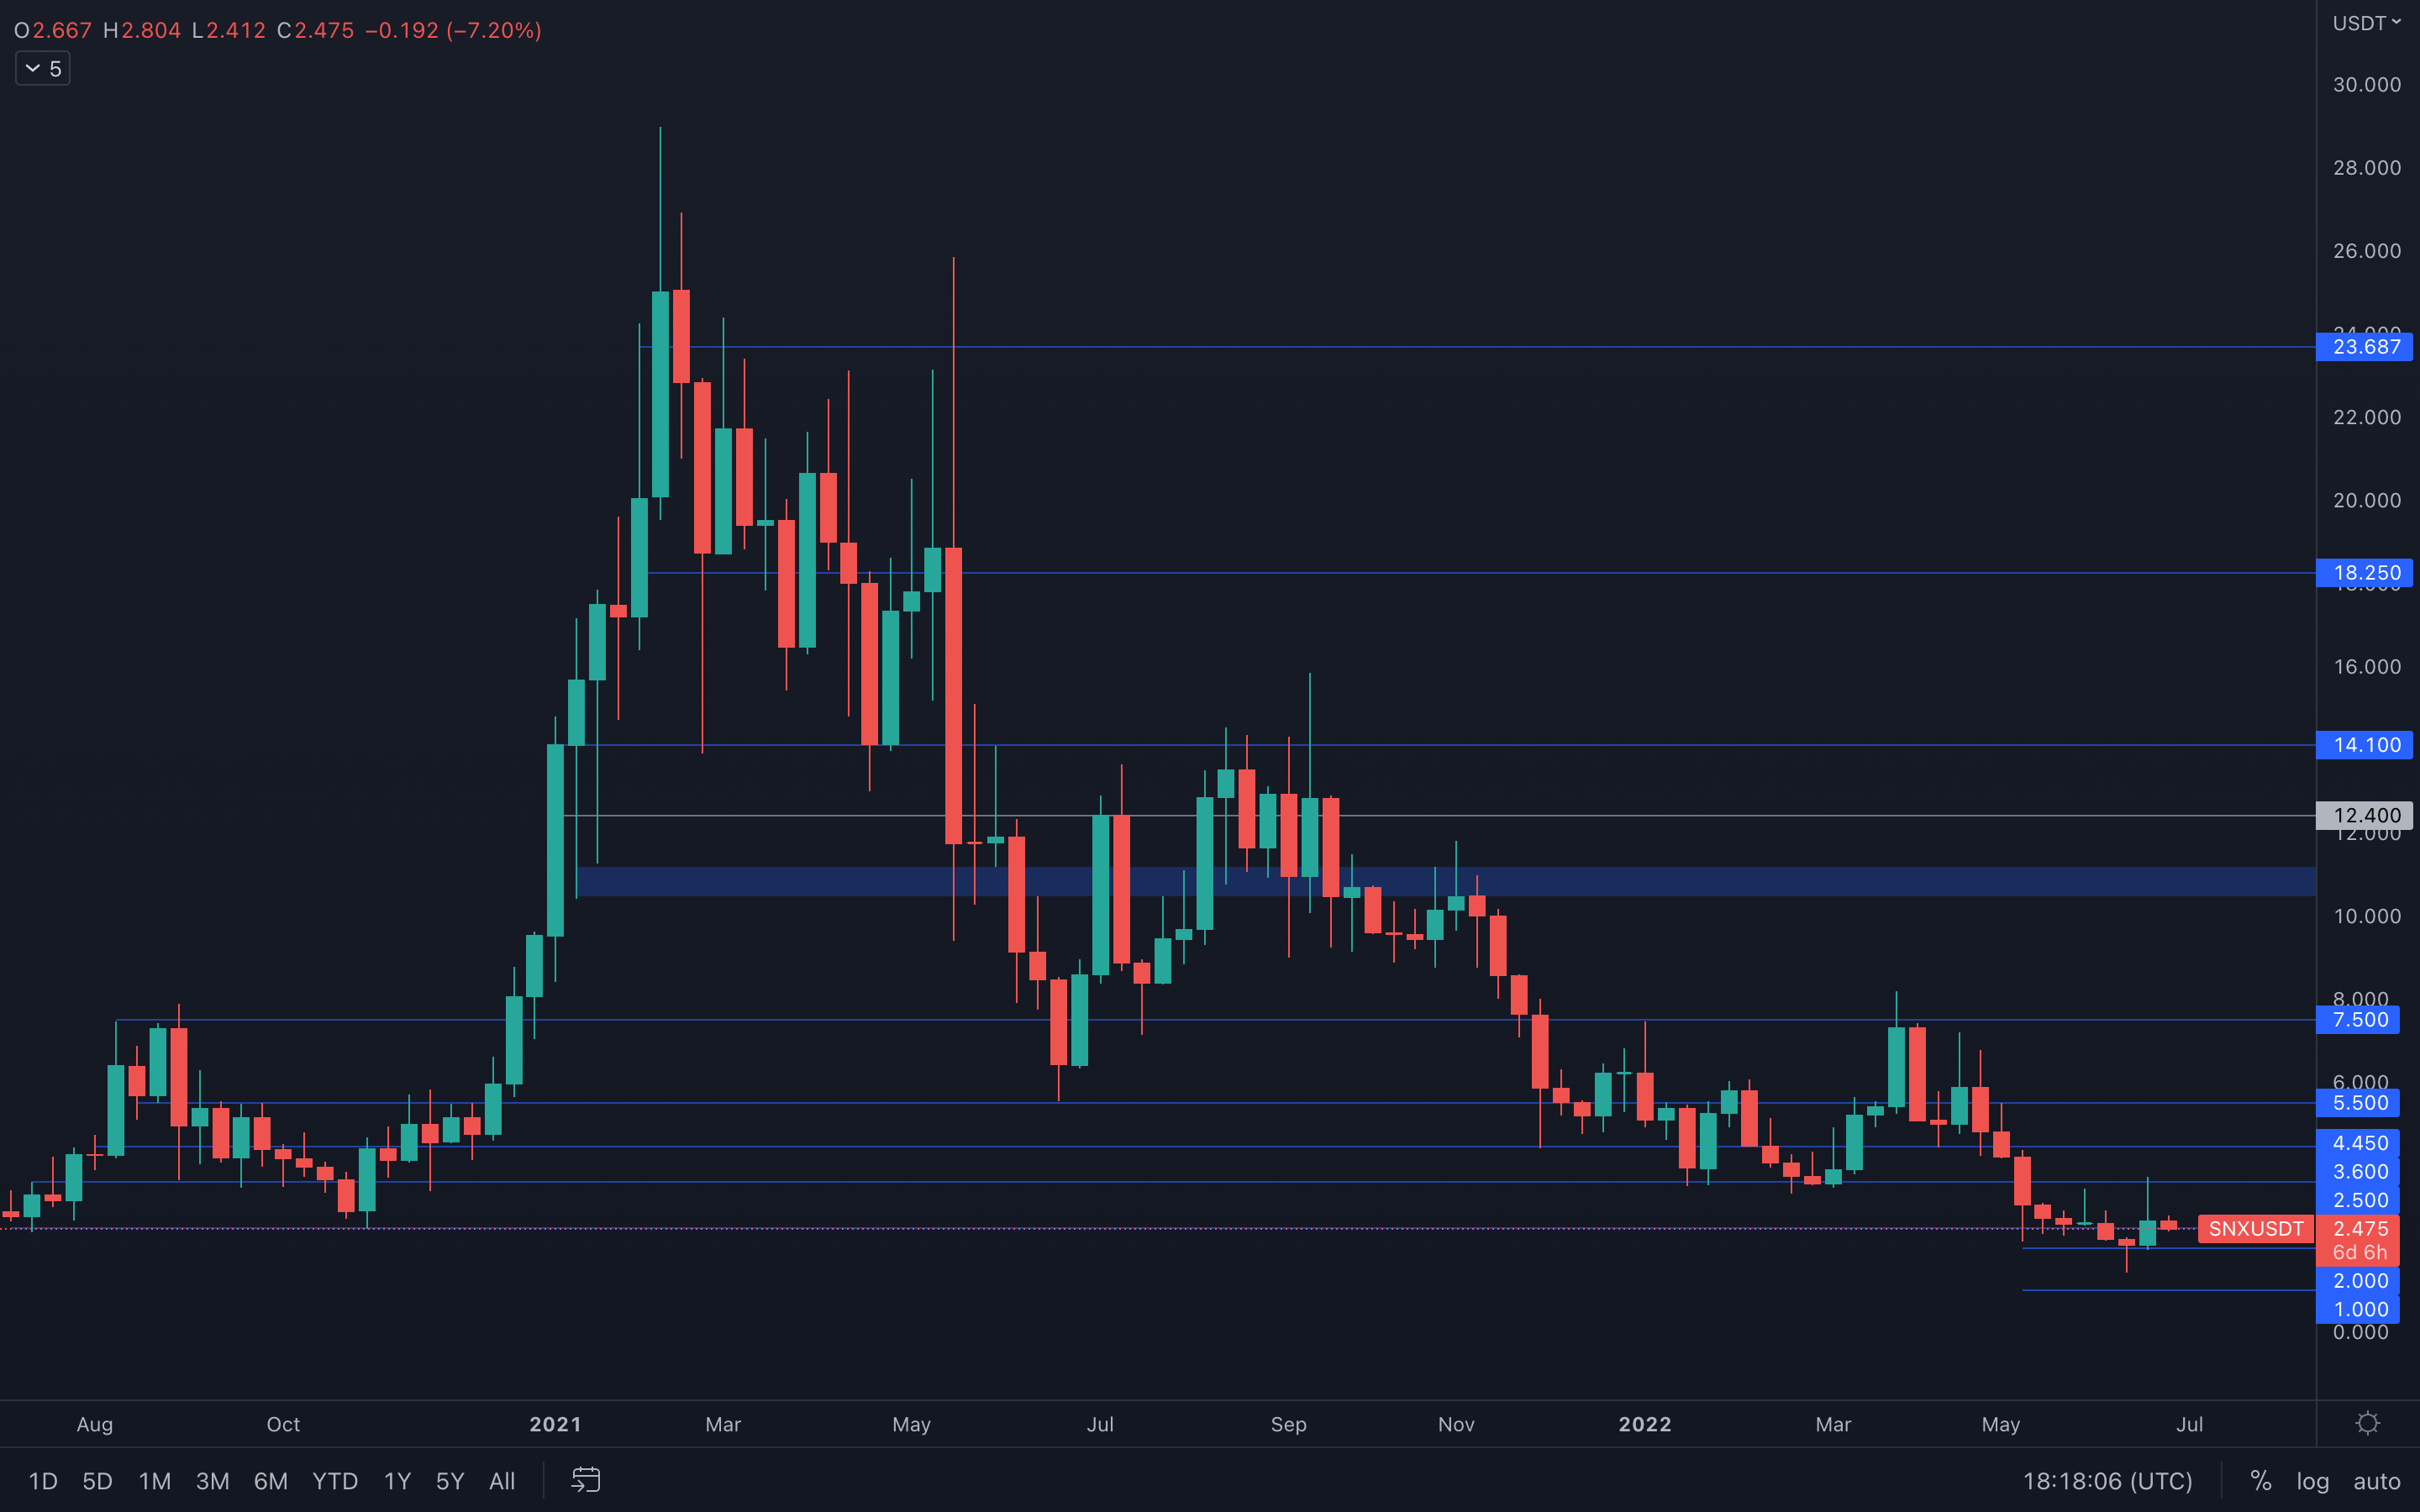 Extreme increase in volume last week, as SNX pumped almost 75% in a matter of two days, and is now slowly decreasing back to recent support levels, such as the $2.50 support level, which the price of SNX is currently testing. A weekly closure above $2.5 would certainly be bullish for SNX, especially with the increase in volume it has experienced just days ago, but let's not forget that all altcoins are correlated to Bitcoin's price action, and that includes SNX too. Monitoring Bitcoin is, as always, necessary, in order to understand where SNX might be headed.
RUNE
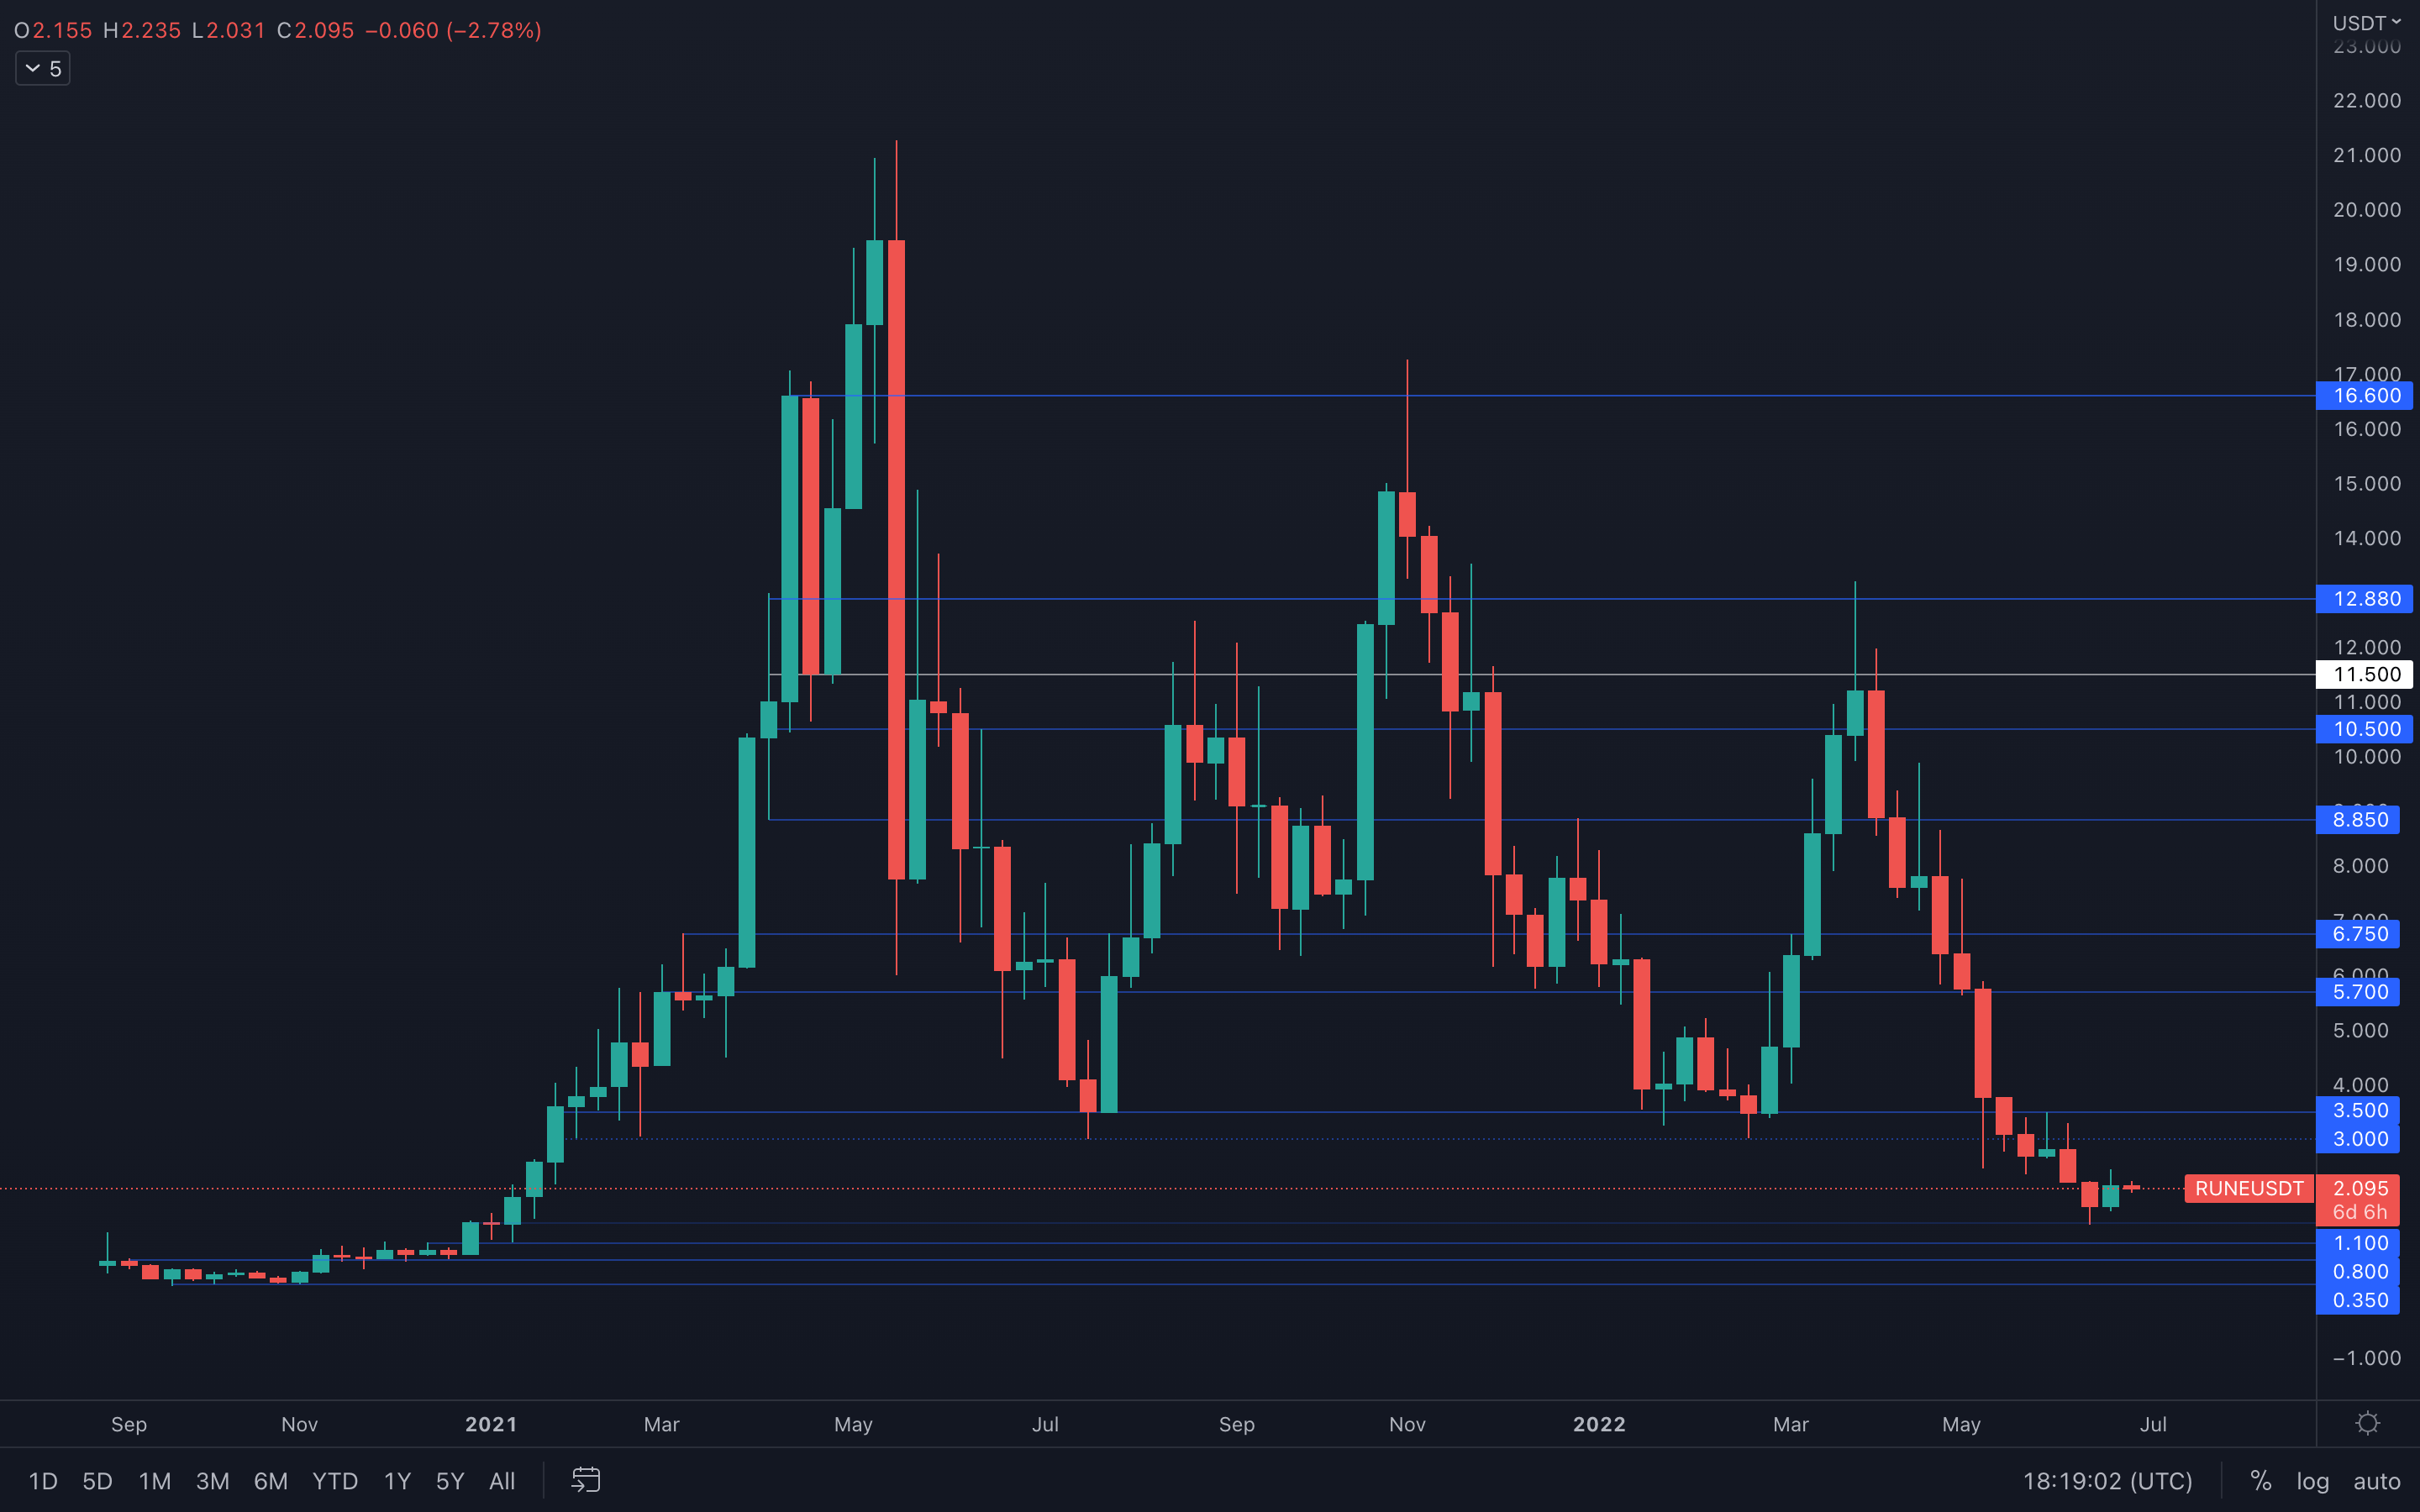 The mainnet launch certainly helped last week's price action for RUNE, but not to the extent that most were expecting. The price of RUNE has seen an increase of approximately 37%, but that might not be enough for any bullish momentum to take over at all. With recent volume still looking healthy, days after the mainnet launch, we should be expecting a push higher, unless sellers step in and reject RUNE from its local $2.40 resistance level (daily timeframe).
SOL
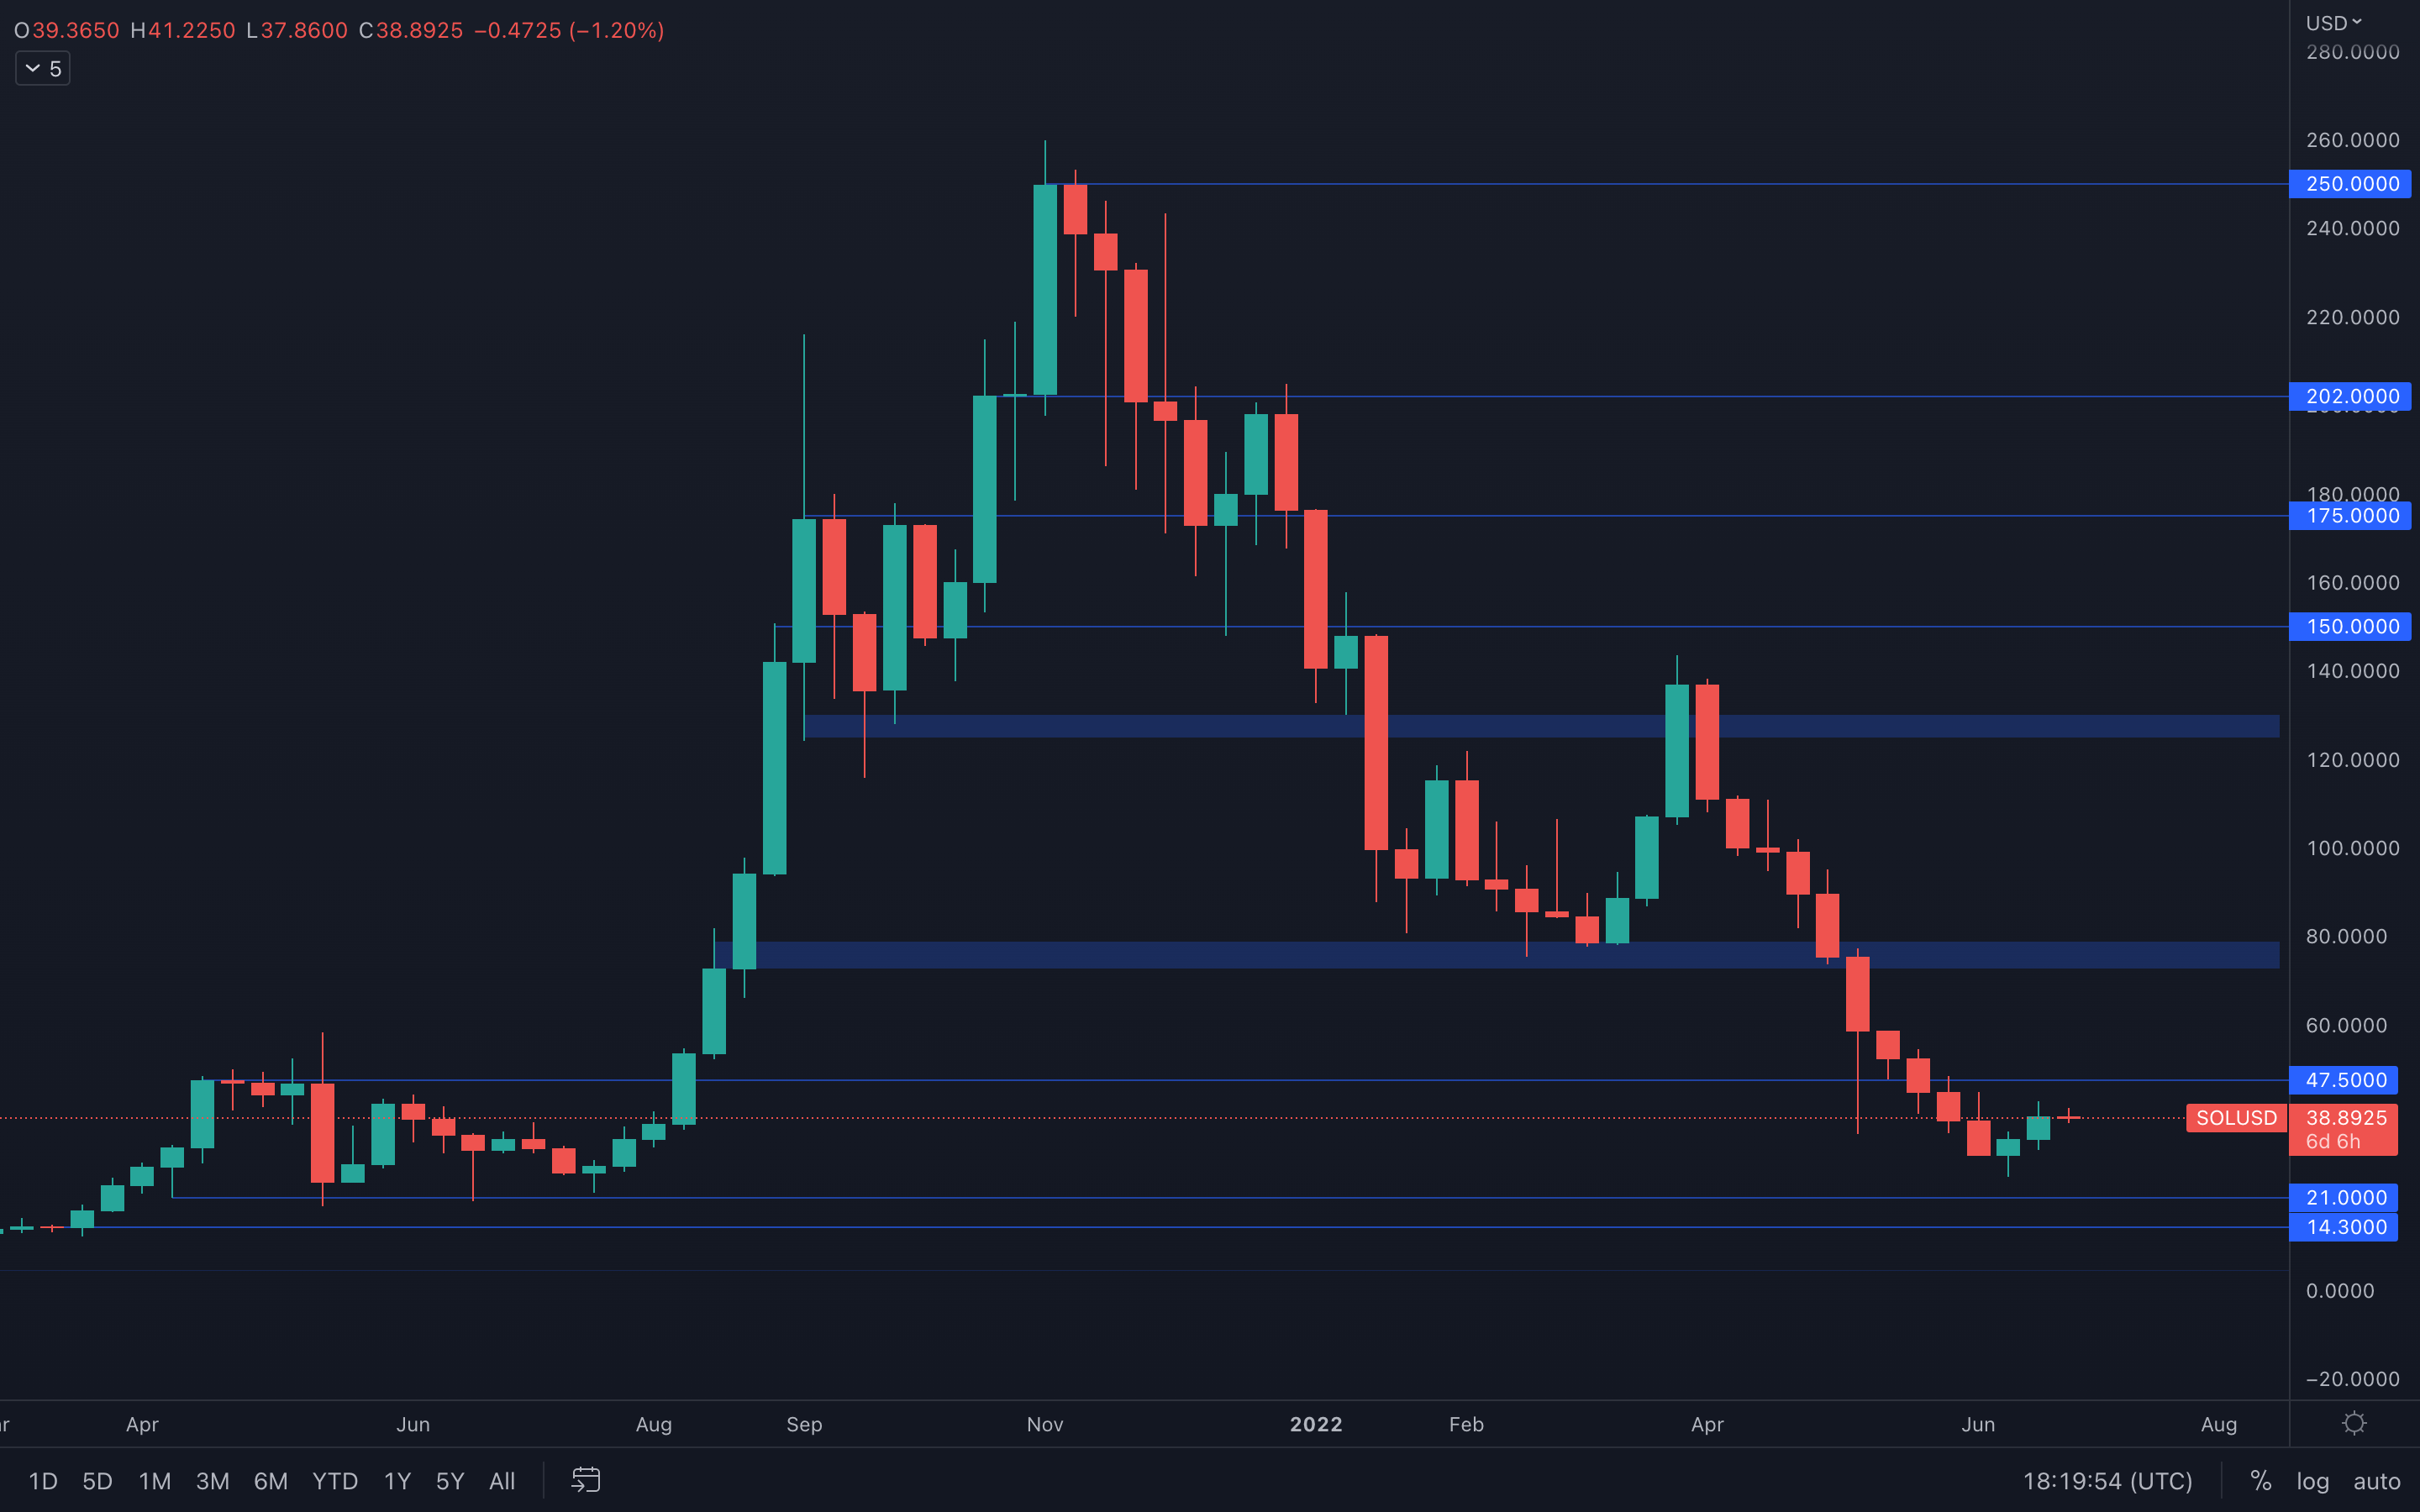 Clean short-term reversal, with a common candlestick formation known as a Morning Star. We've highlighted a potential double bottom setup in our Discord (7 days ago), which already hit its first target. We wouldn't recommend entering this trade now, as volume can be seen decreasing on lower timeframes (<1D, daily timeframe included) and can easily interfere with our final target of $47.5. Either way, the odds of SOL testing $47.5 are definitely there, but we recommend staying cautious & vigilante under any circumstances.
SRM
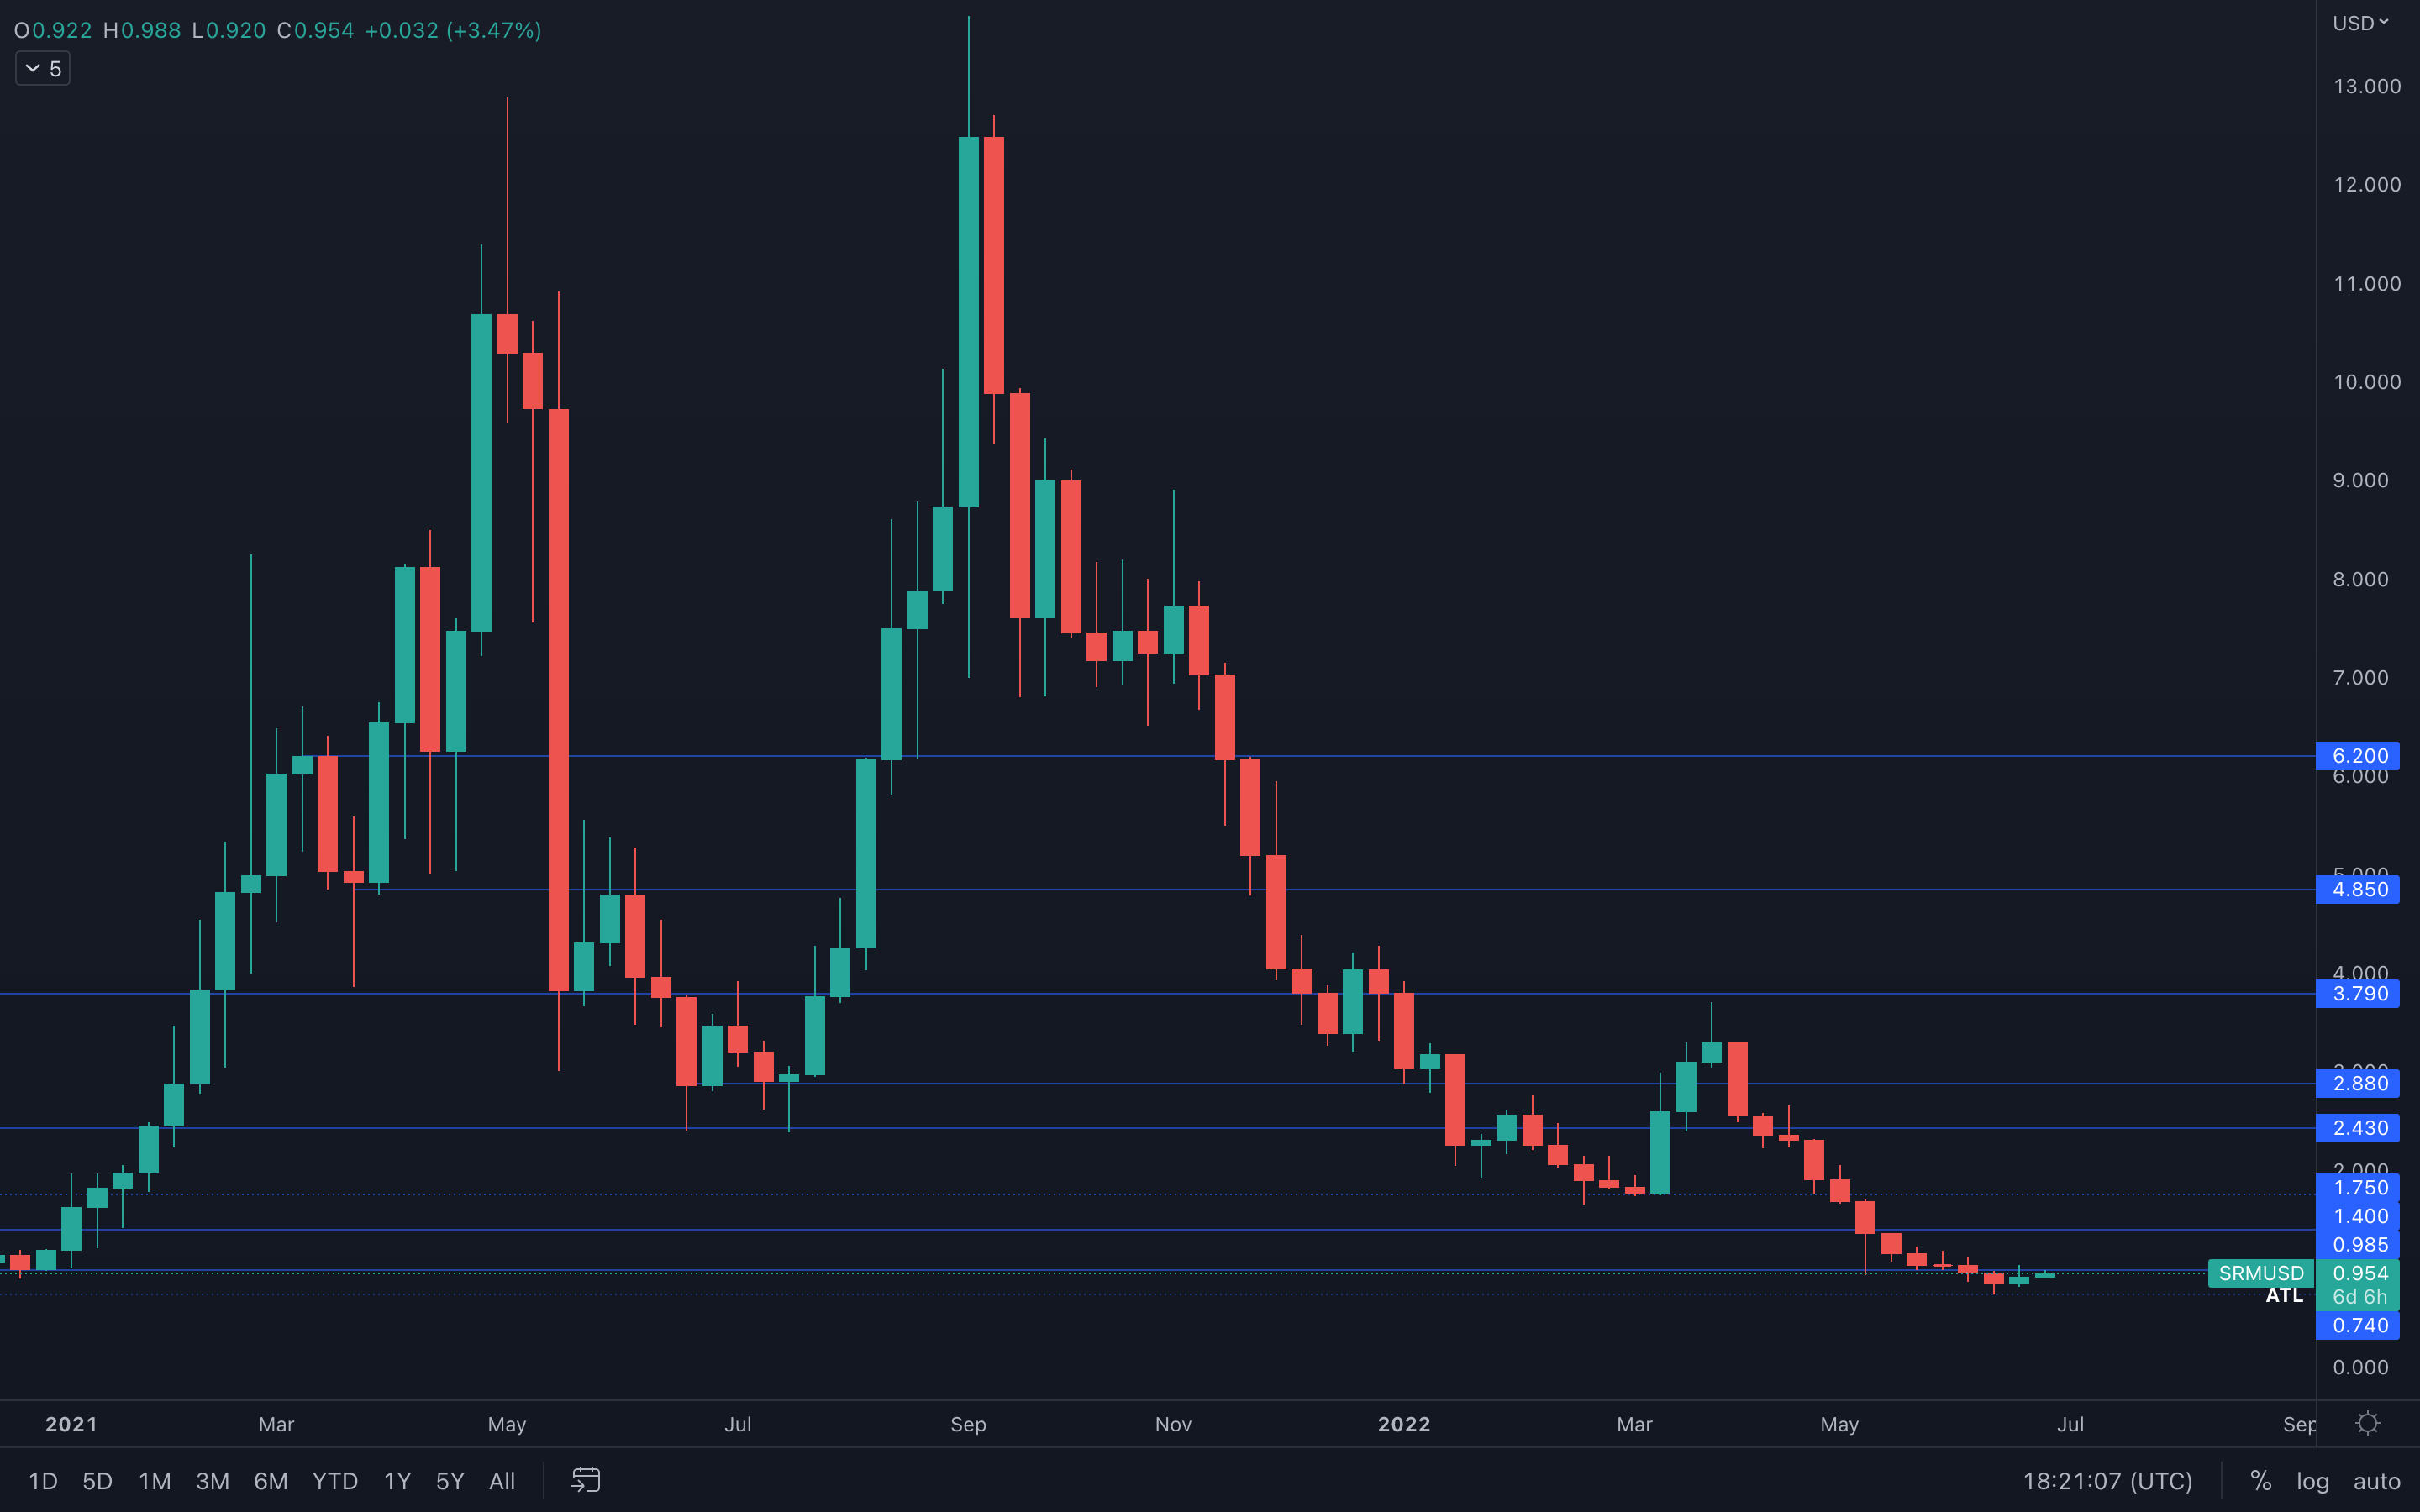 SRM has been dropping in a steady motion over the past weeks in somewhat of a bottoming form. The $1 psychological & technical level needs to be reclaimed in order to confirm (or at least expect) a $1.40 resistance test, otherwise SRM still risks going lower.
FTT
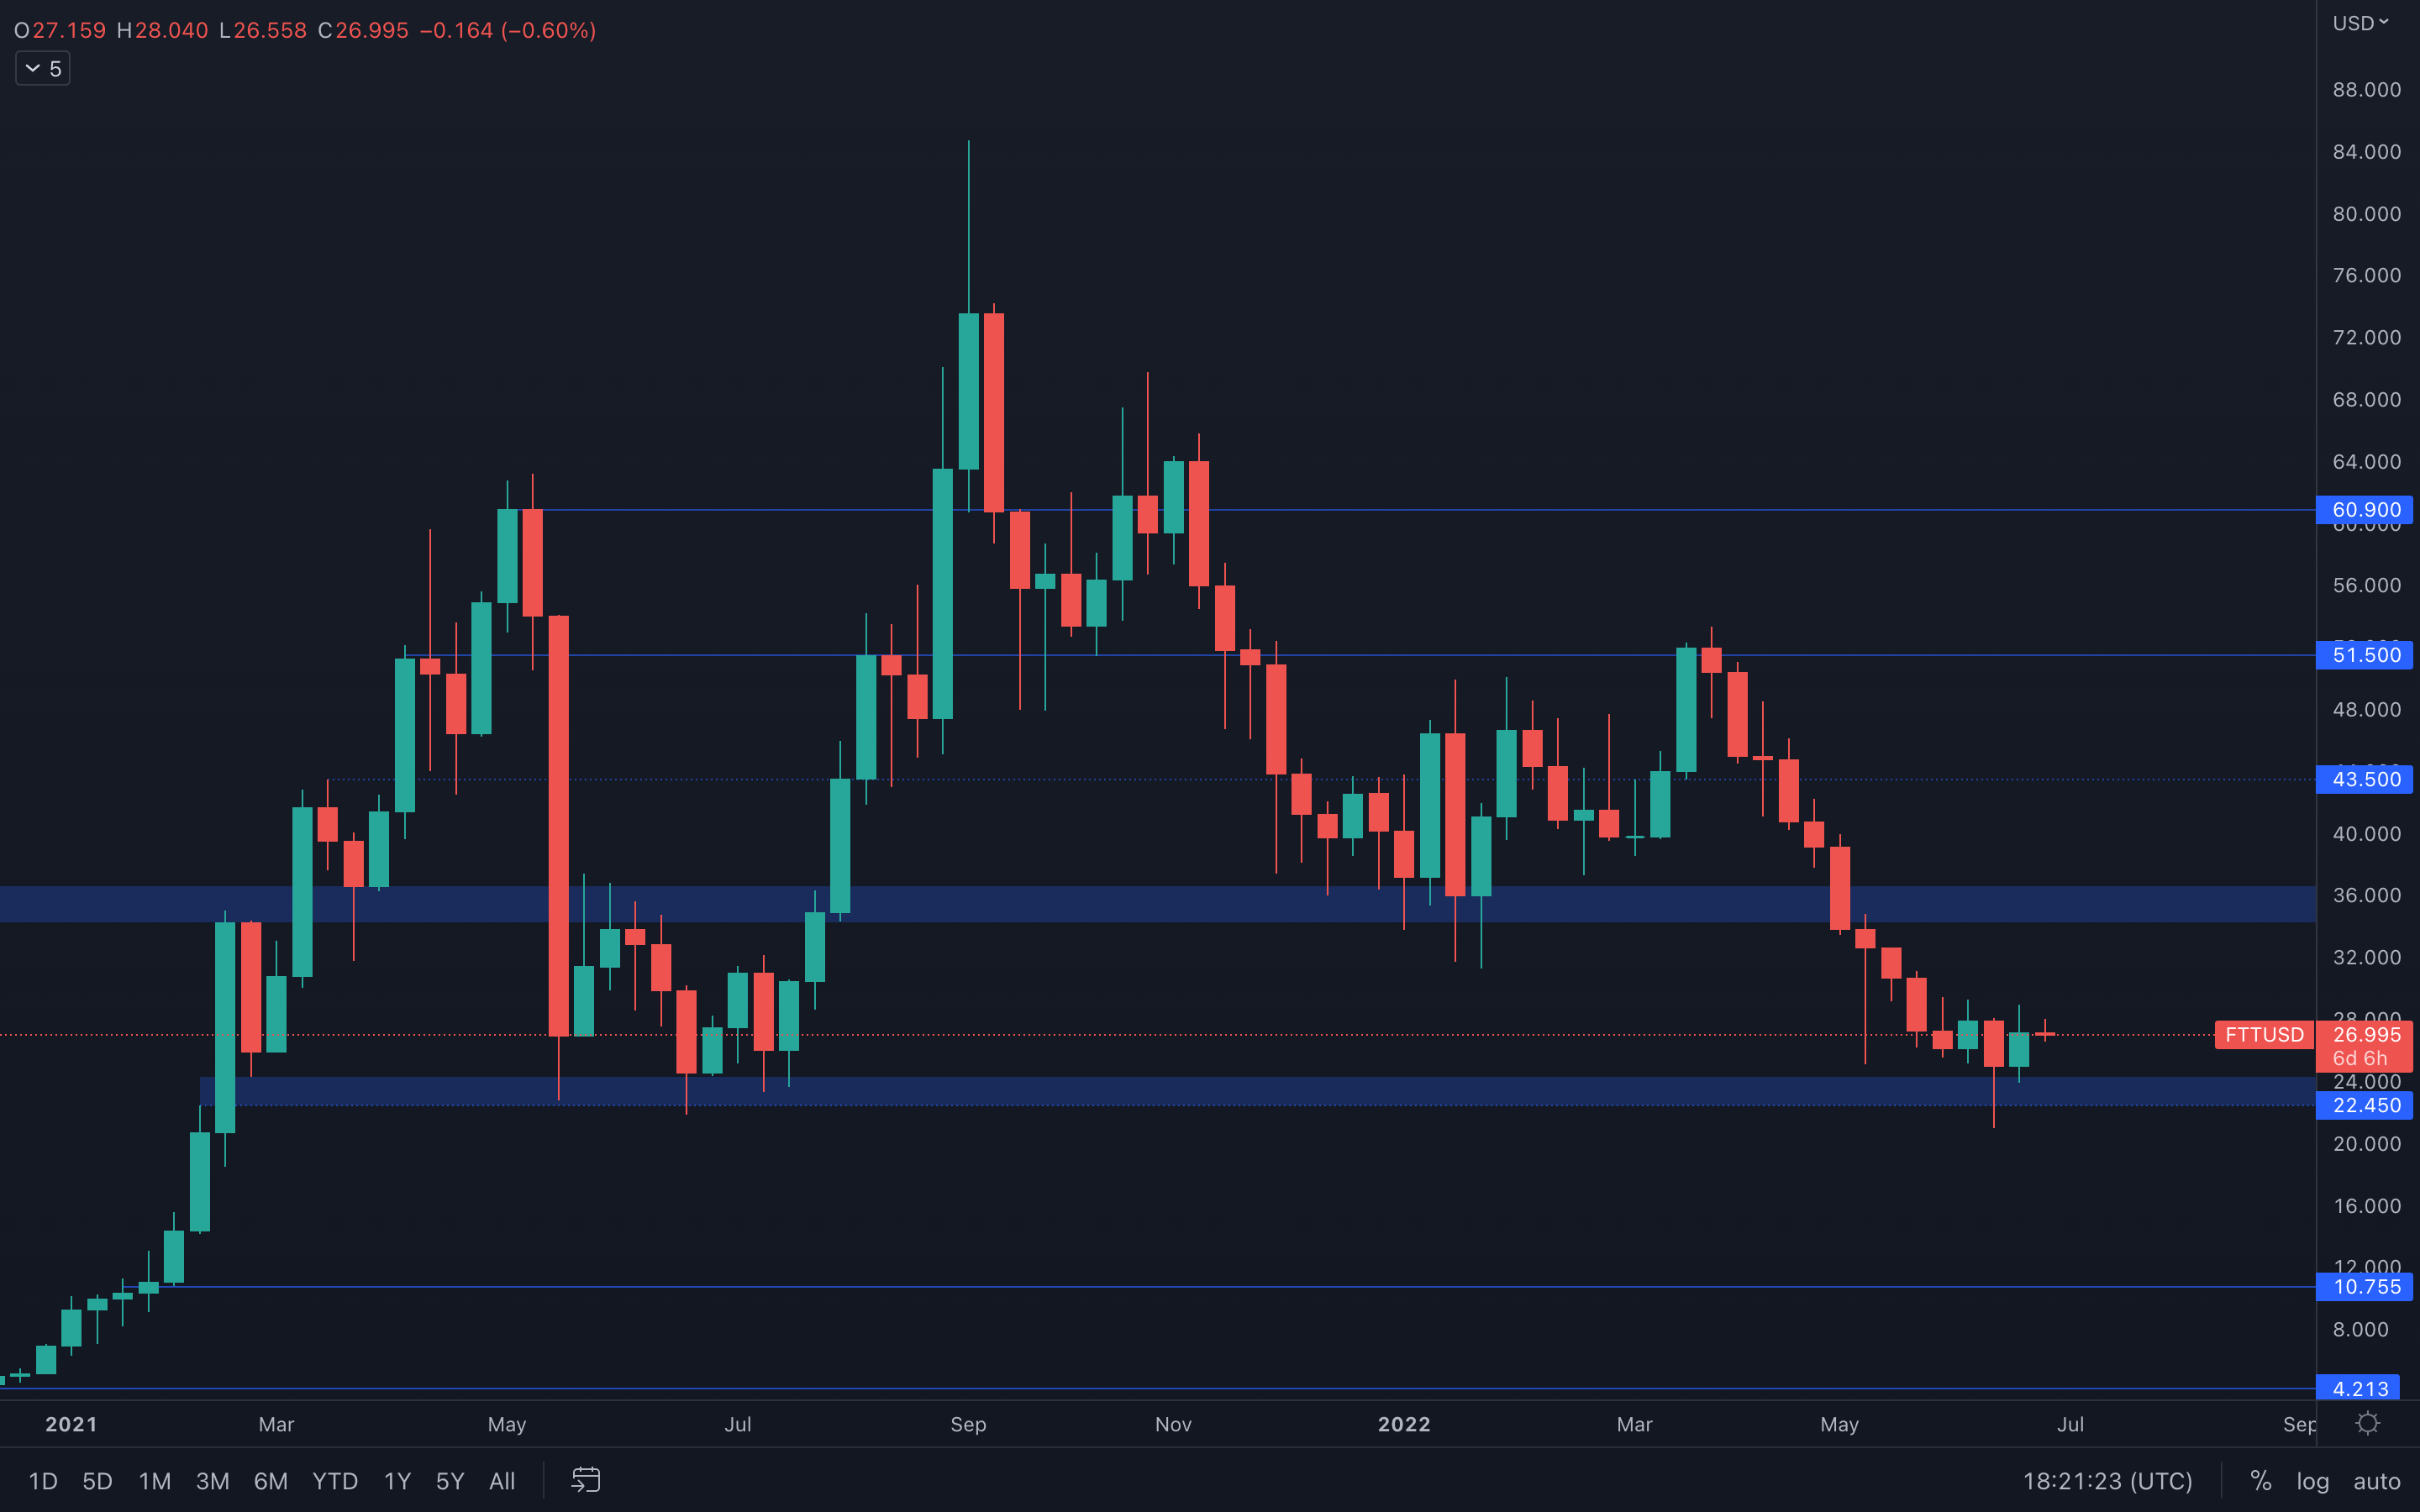 If indecisiveness was a cryptocurrency, FTT is the perfect canditate. The last few weeks have been quite indecisive for FTT, with constant fluctuations in price that don't really indicate any real direction. What we know is that the price of FTT is just under the $24 - $22.5 demand area, an area that has acted as a strong support in the past, specifically May - July 2021. Perfect price action for traders, but quite risky, which is why it might be best to not overtrade this specific price action and only try to catch solid opportunities.
MINA
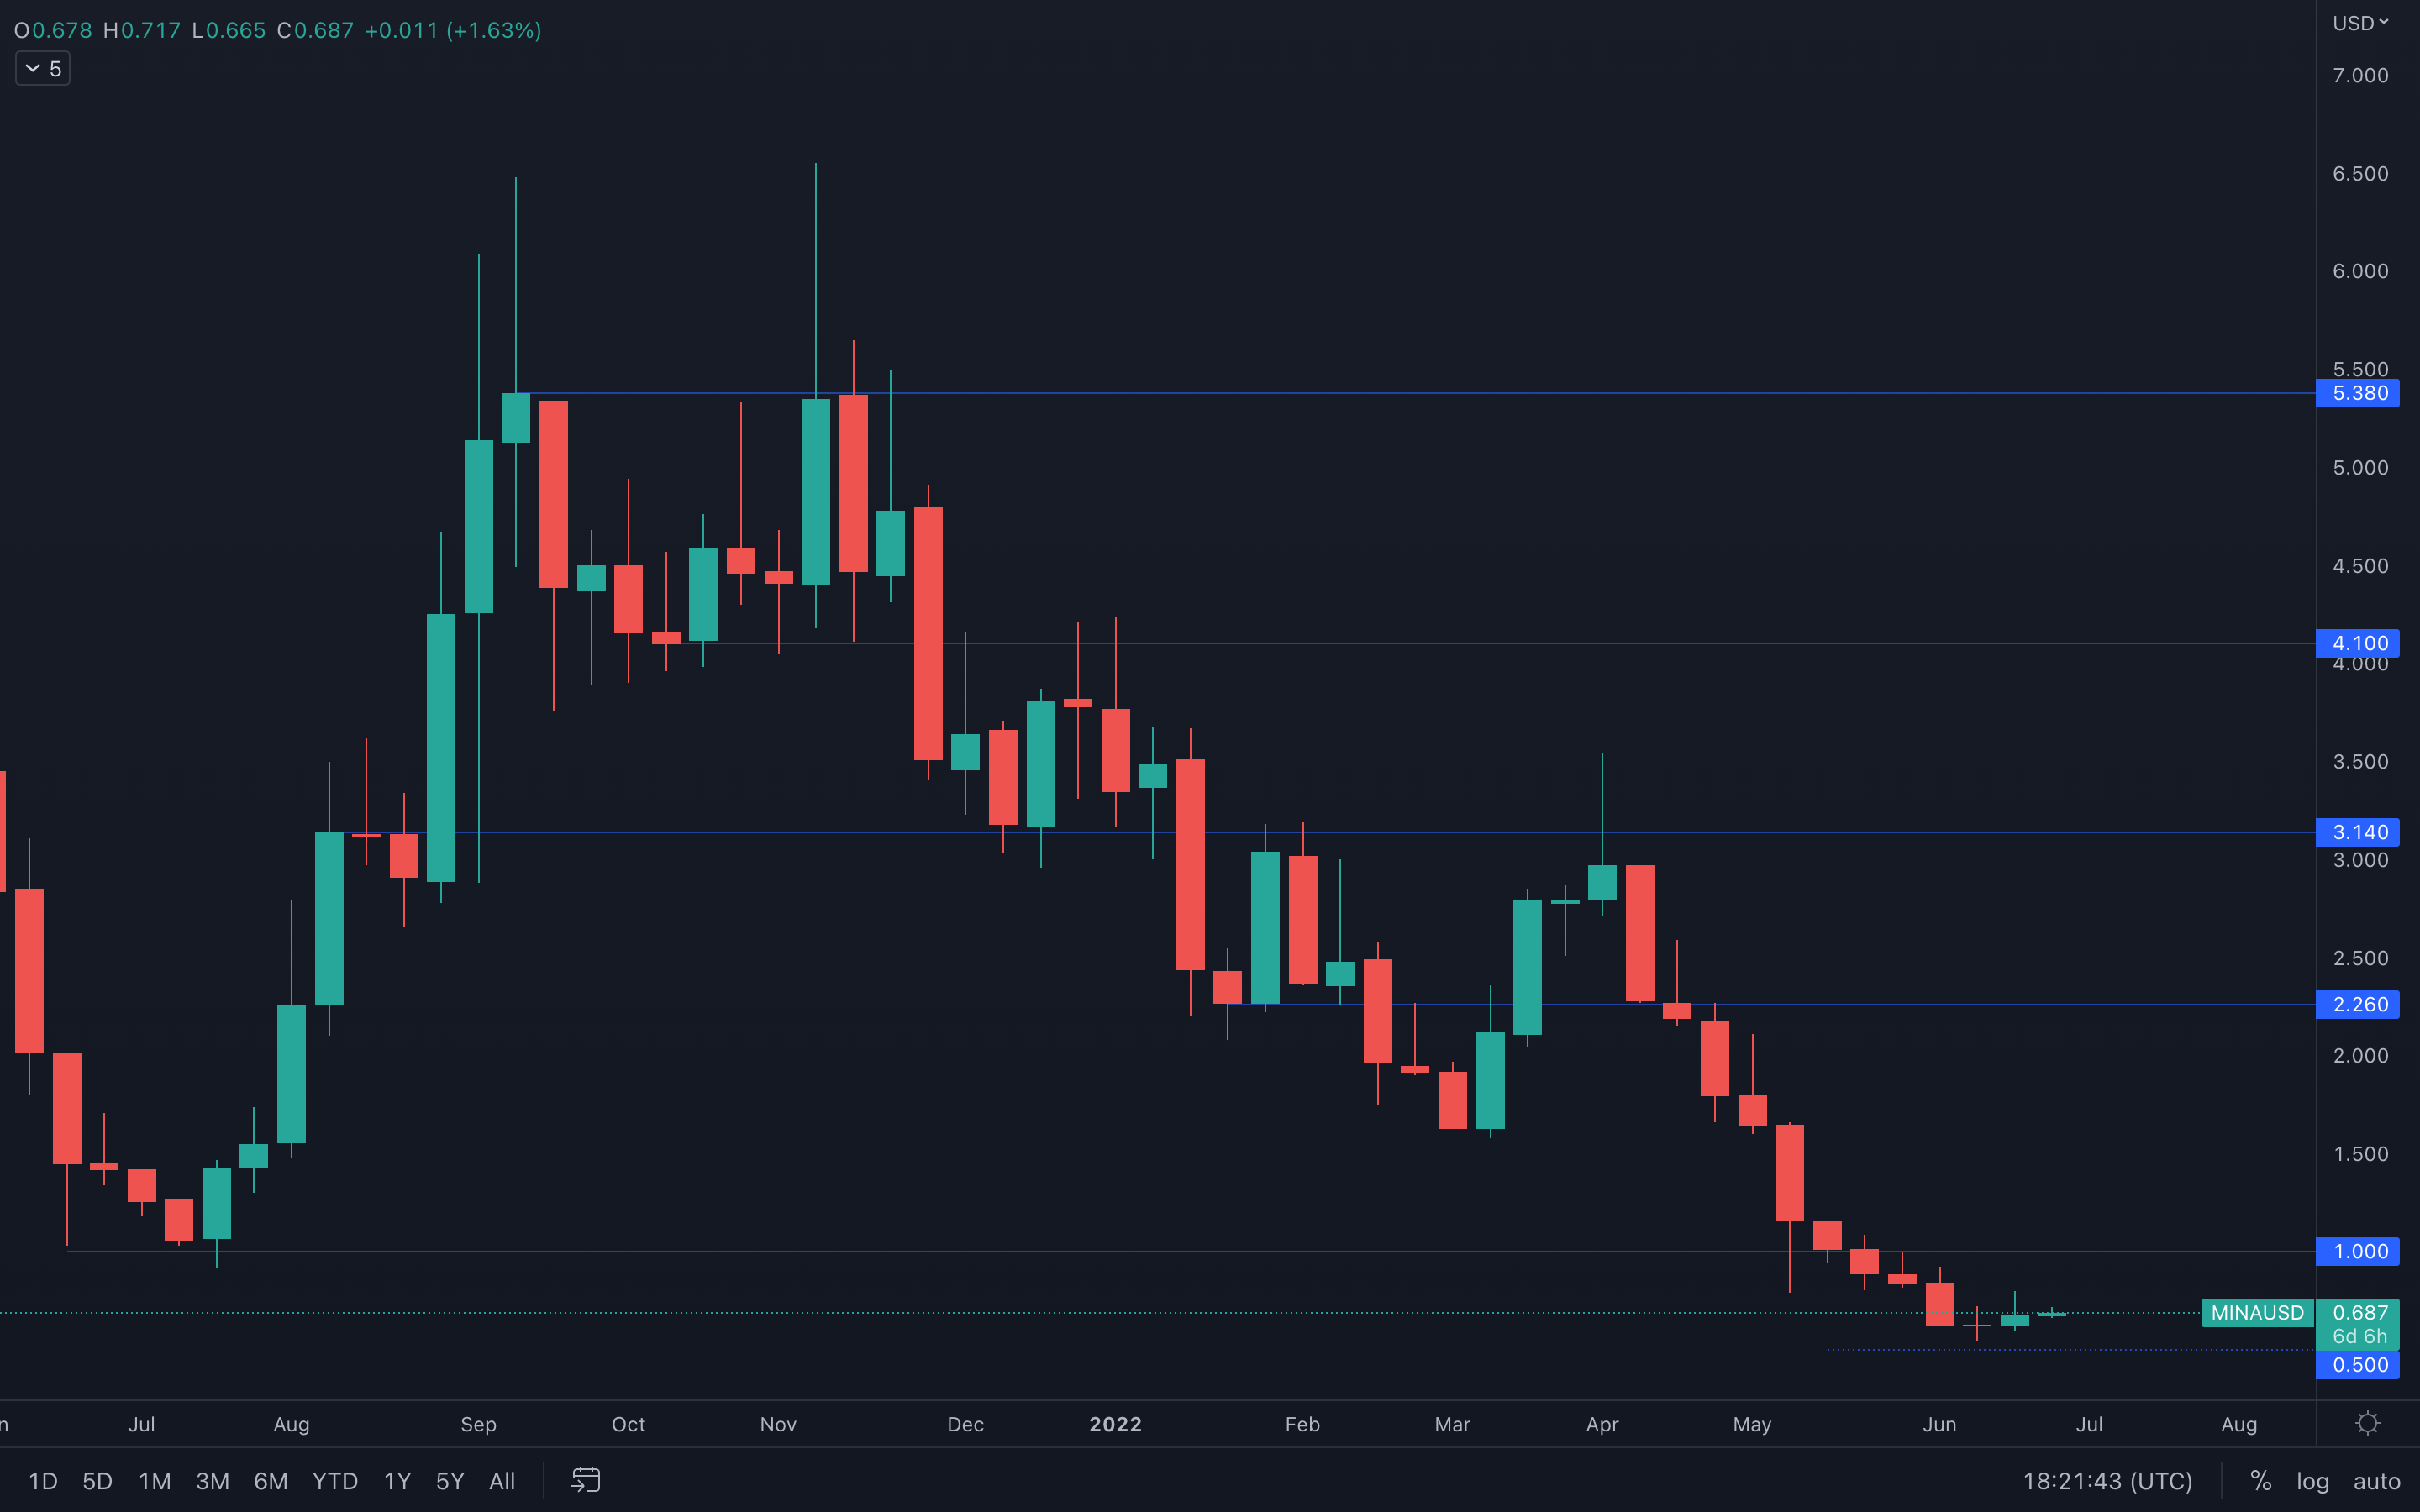 With another indecisive weekly closure, MINA is still battling between two main roads - reaching & testing its $1 resistance level, or descending to the psychological support level of $0.50 is yet to be met. Expect ranging between these two levels.
dYdX
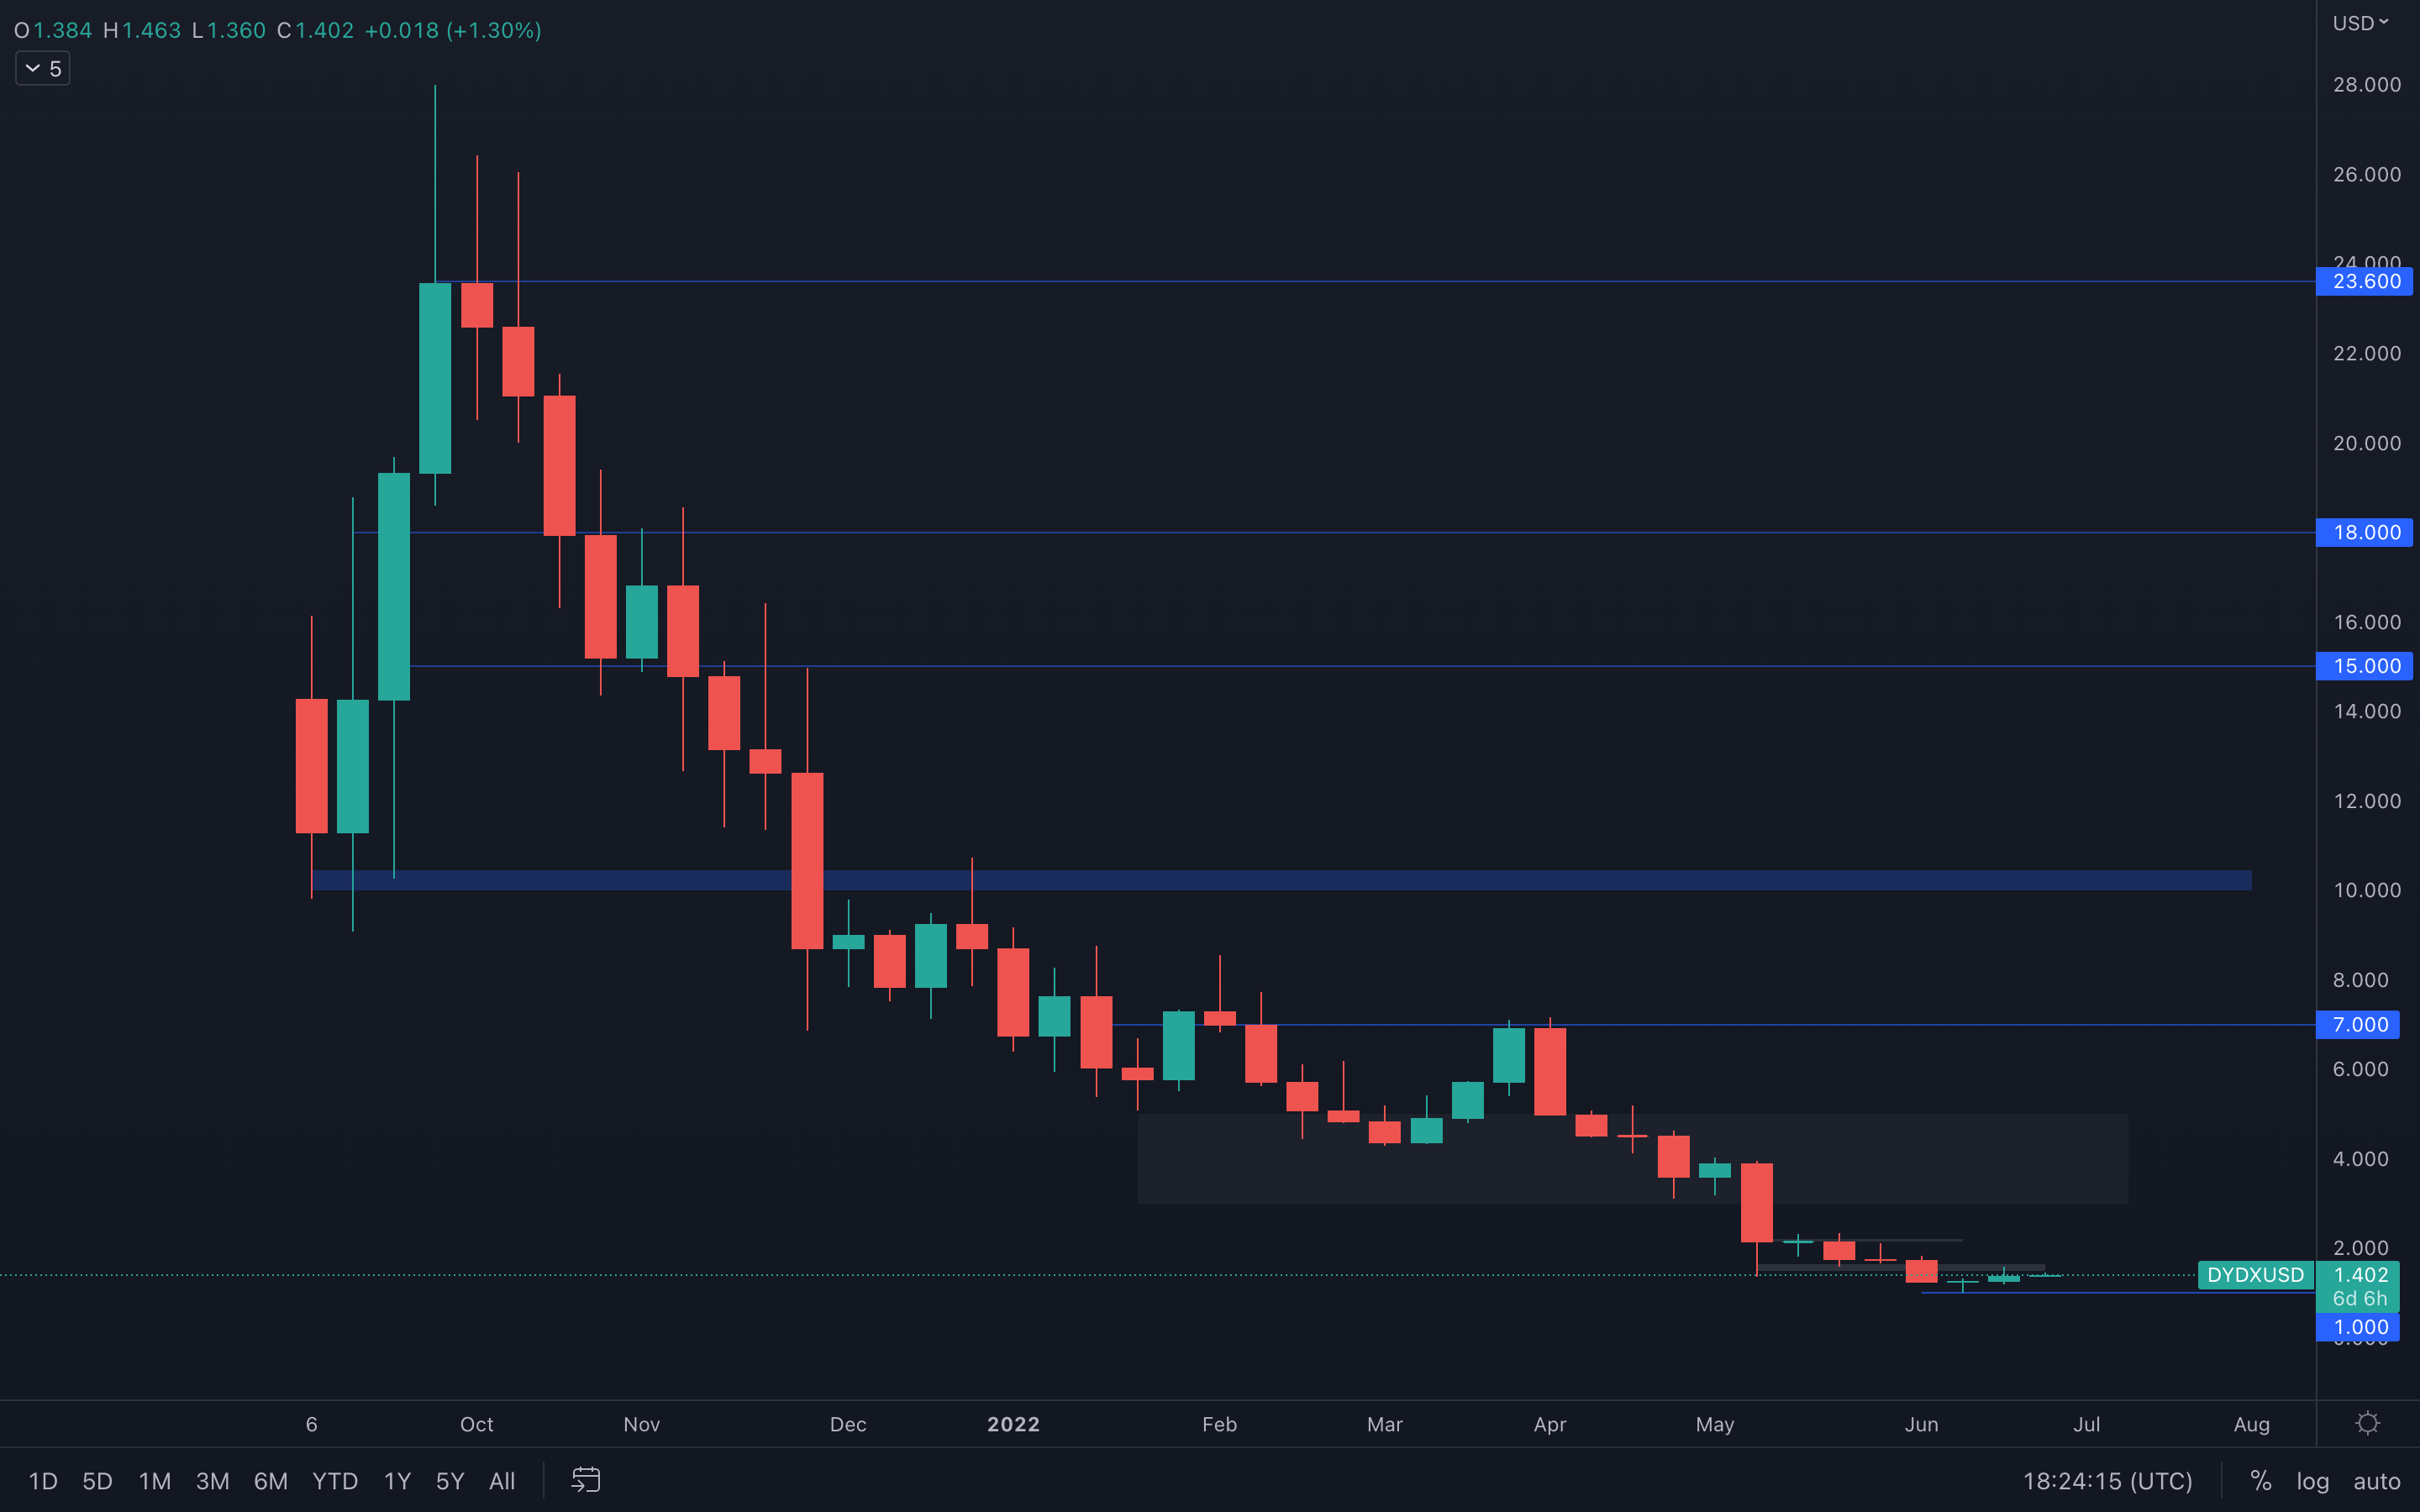 As we mentioned last week, we were expecting a push towards $1.50, a move that already happened, but without any real changes in day-to-day volume. Even though the weekly price action of dYdX might suggest a $2 resistance test now, this can easily be invalidated by a bearish sentiment taking over once more.
Summary
It can be said that many of the market indicator metrics we have been tracking for months now look to have reset, whether they have fully reset or not can be argued. However, with prices where they are, on-chain indicators approaching a full reset, and now with a close eye on how minor capitulation develops, it may be possible that we are approaching a macro bottom. The only contrast to this is the macro environment. Since, crypto’s invention, there has not been a sustained bear market, so it’ll be interesting to see what effect the bear market has on price action. However, it should be noted that crypto trades as a risk-on asset which is slightly higher on the risk spectrum than equities are, so with this knowledge, we can formulate the opinion that crypto will continue to struggle as equities do and only when the FED pivots to more dovish policy or QE begins again, will we likely see any real momentum come back into the space. Note: this does not mean we can’t bottom and be range-bound for a prolonged period of time in between.Recommended from Cryptonary


