
Disclaimer: Not financial nor investment advice. You are responsible for any capital-related decisions you make, and only you are accountable for the results.
Macro
In the last few weeks, Bonds have managed to catch a bid. The reason for this is that Bonds are no longer beginning to price in the FED Chairmans (Powell) hawkish comments. In fact, Bonds have caught a bid as it is becoming increasingly expected that there will be poor economic growth in the quarters ahead, therefore Bonds have become more attractive and have caught a bid. What this effectively means is that the Bond market has said “Ok J Powell, we get you are still extremely hawkish, but with some of the economic indicators showing signs of slowing, you surely can’t continue this hawkish narrative for much longer?”Bonds are known as the smartest money, and they have begun to move first. It is likely that in order for risk assets to catch a bid again, the FED needs to signal an end to aggressive tightening (with an eventual stopping or complete pivot in policy) or they need to stimulate the markets again (quantitative easing). QE seems much further down the line, but an easing in tightening may be sooner than some think. It is likely the next FED meeting (July) produces an increase in interest rates of 0.75% and then possibly 0.50% or 0.75% in September. By then it is expected that inflation will have peaked, and the FED will continue raising rates, but less aggressively, this will then be the signal for some of the smart money to risk back on and risk assets (equities, crypto) may begin to catch a bid.
TLDR
- It may be possible that the FED’s tightening policy begins to ease off in a few months’ time as we’re beginning to see economic indicators showing signs of slowing and the smart money (Bonds) have caught a bid in the past two weeks. Crypto may follow in the coming months.
- The Exchange Netflow Volume suggests that Ether has been sold whereas Bitcoin has been moved out of Exchanges into cold storage wallets – not so much accumulated, just a big movement to self-custody of coins.
- The key addresses data we follow are still not showing signs that the most profitable cohorts are risking back on yet (still not buying more crypto).
- The MVRV Z-Score and the Realised Price indicators both suggest that Bitcoin and Ether are cheap in comparison to their fair values, with both showing possible significant buying opportunities at current prices.
Total Market Cap
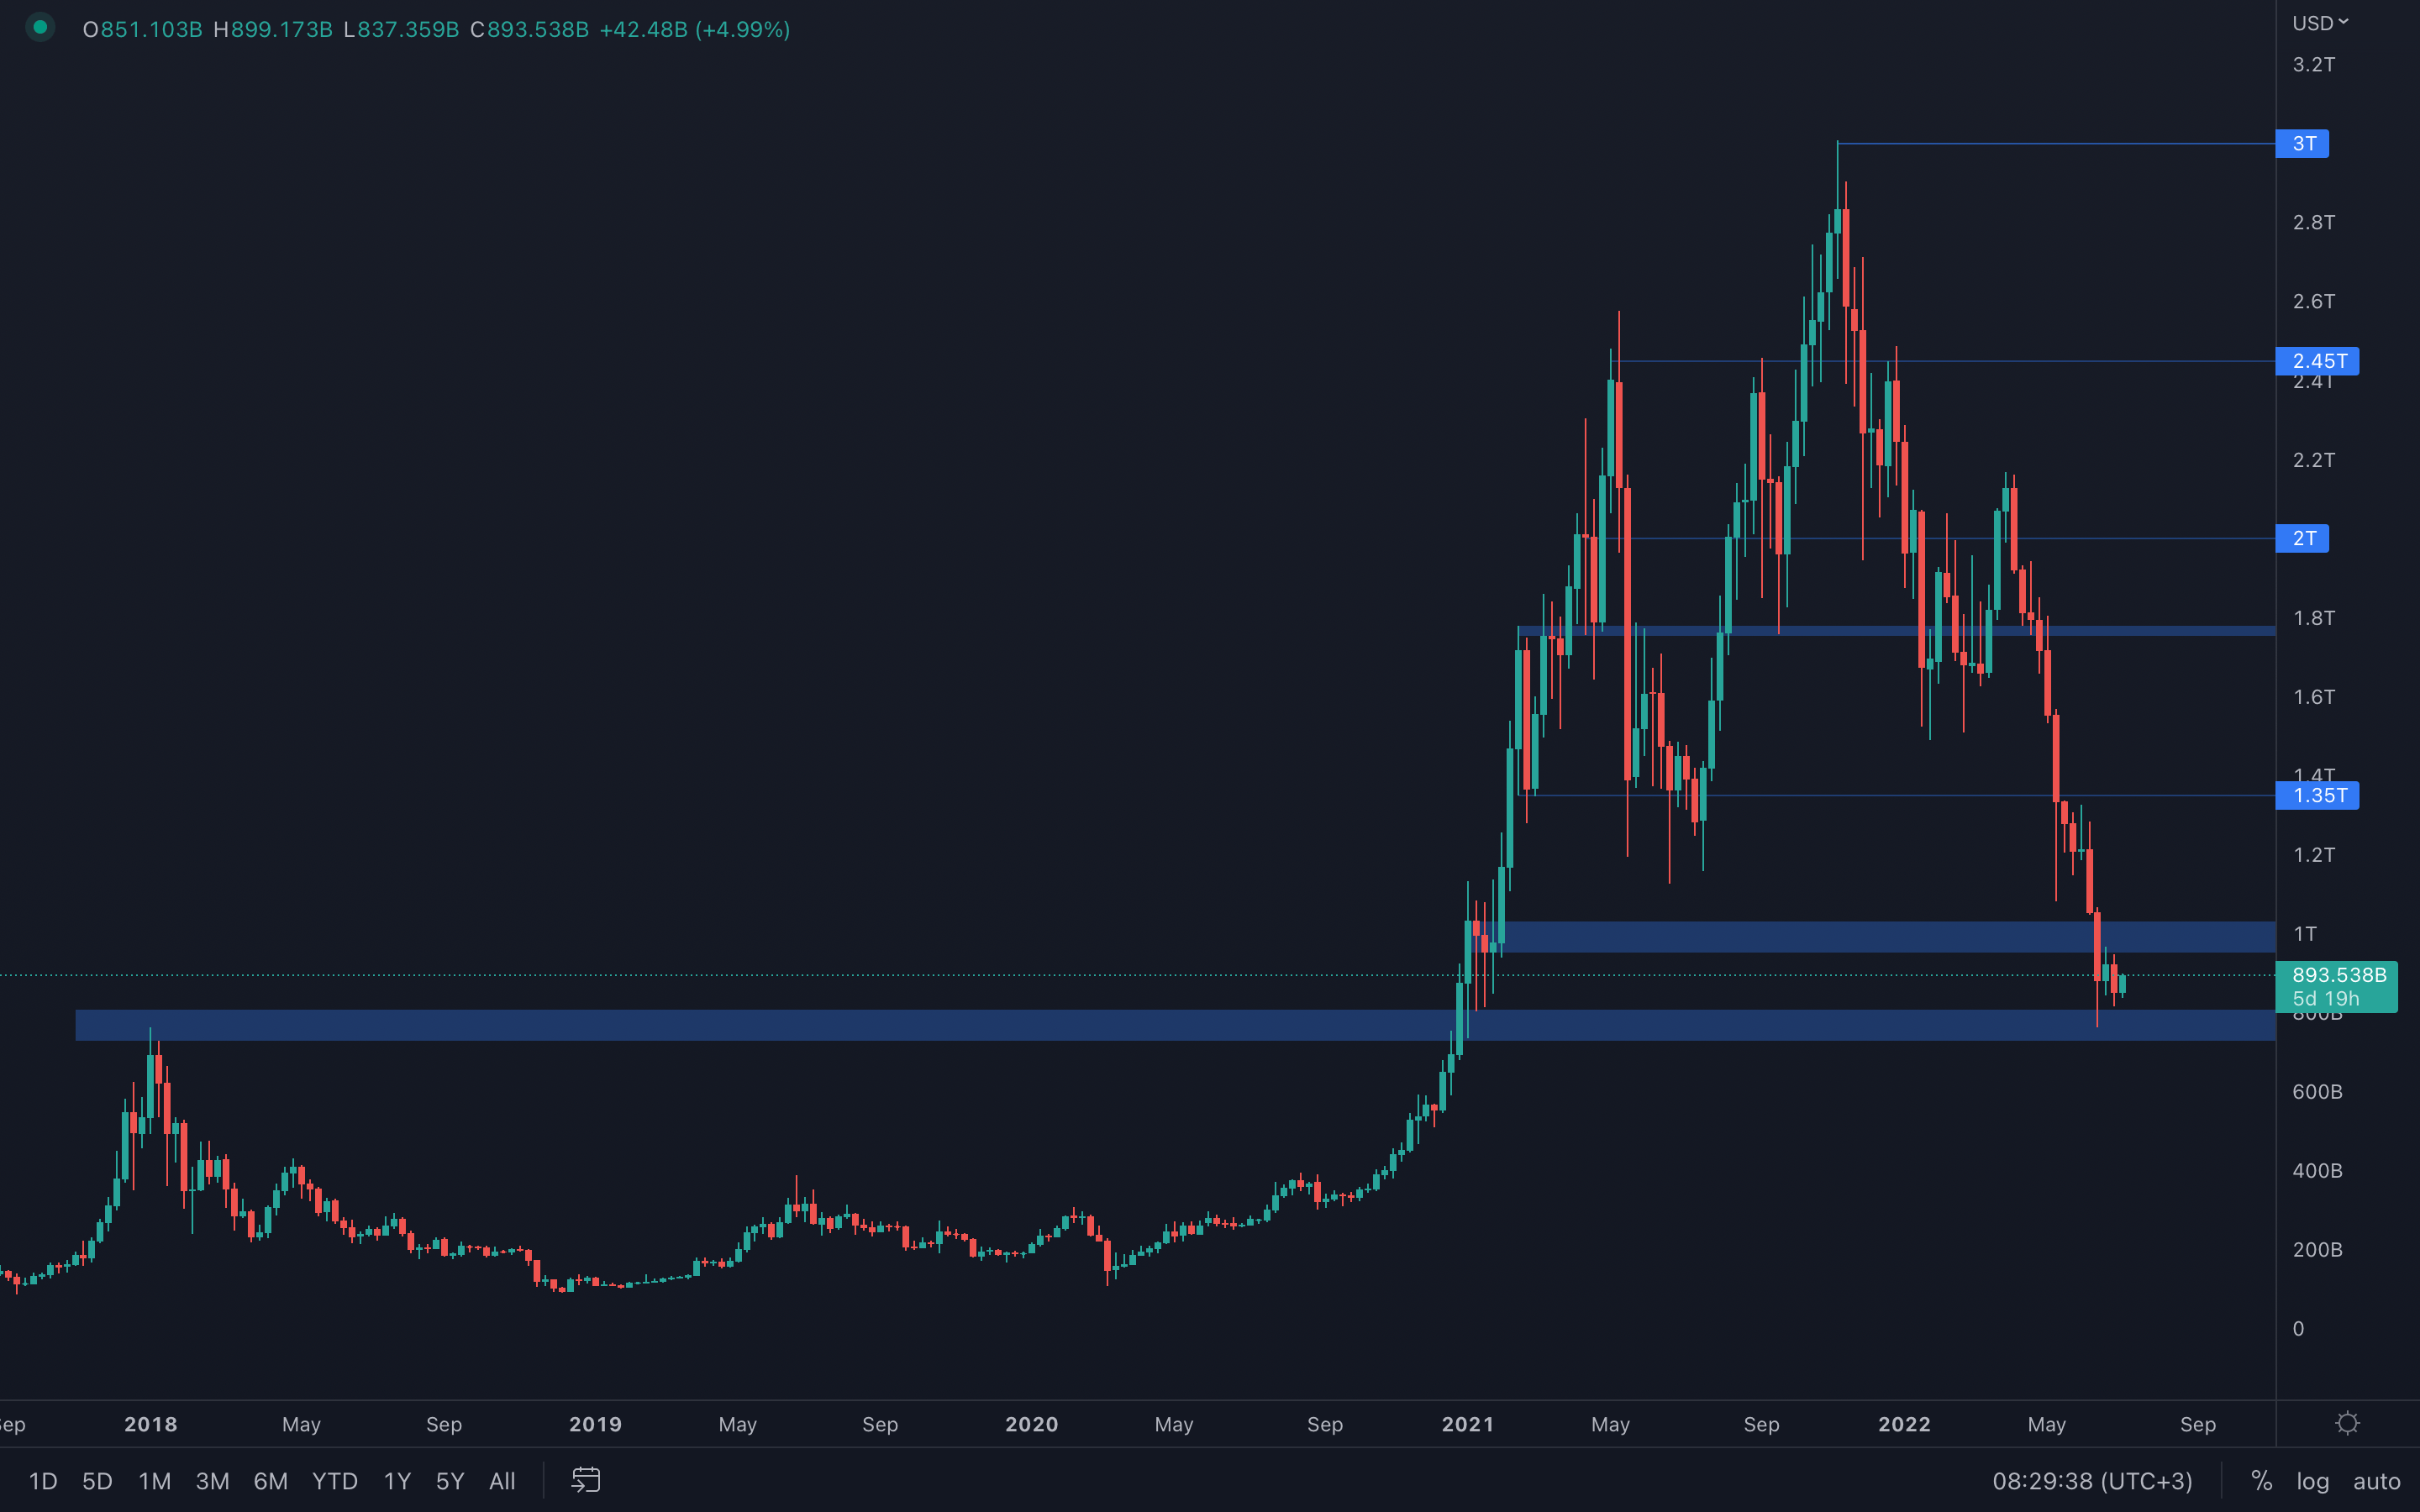 Not much has changed for the crypto market since last week - the Total Market Cap chart has just closed yet another bearish candle last week that serves as the lowest weekly candle closure since December 2020. We can only assume that this suggests the bearish momentum is still overpowering the bullish momentum, and that we should be expecting prices to go lower, most likely to around $700B in the coming weeks. We still have a huge support area between $800B and $700B, so until this area is lost via a weekly candle closure under, then we should expect further ranging between $700B and the psychological level of $1T.
Altcoins Market Cap
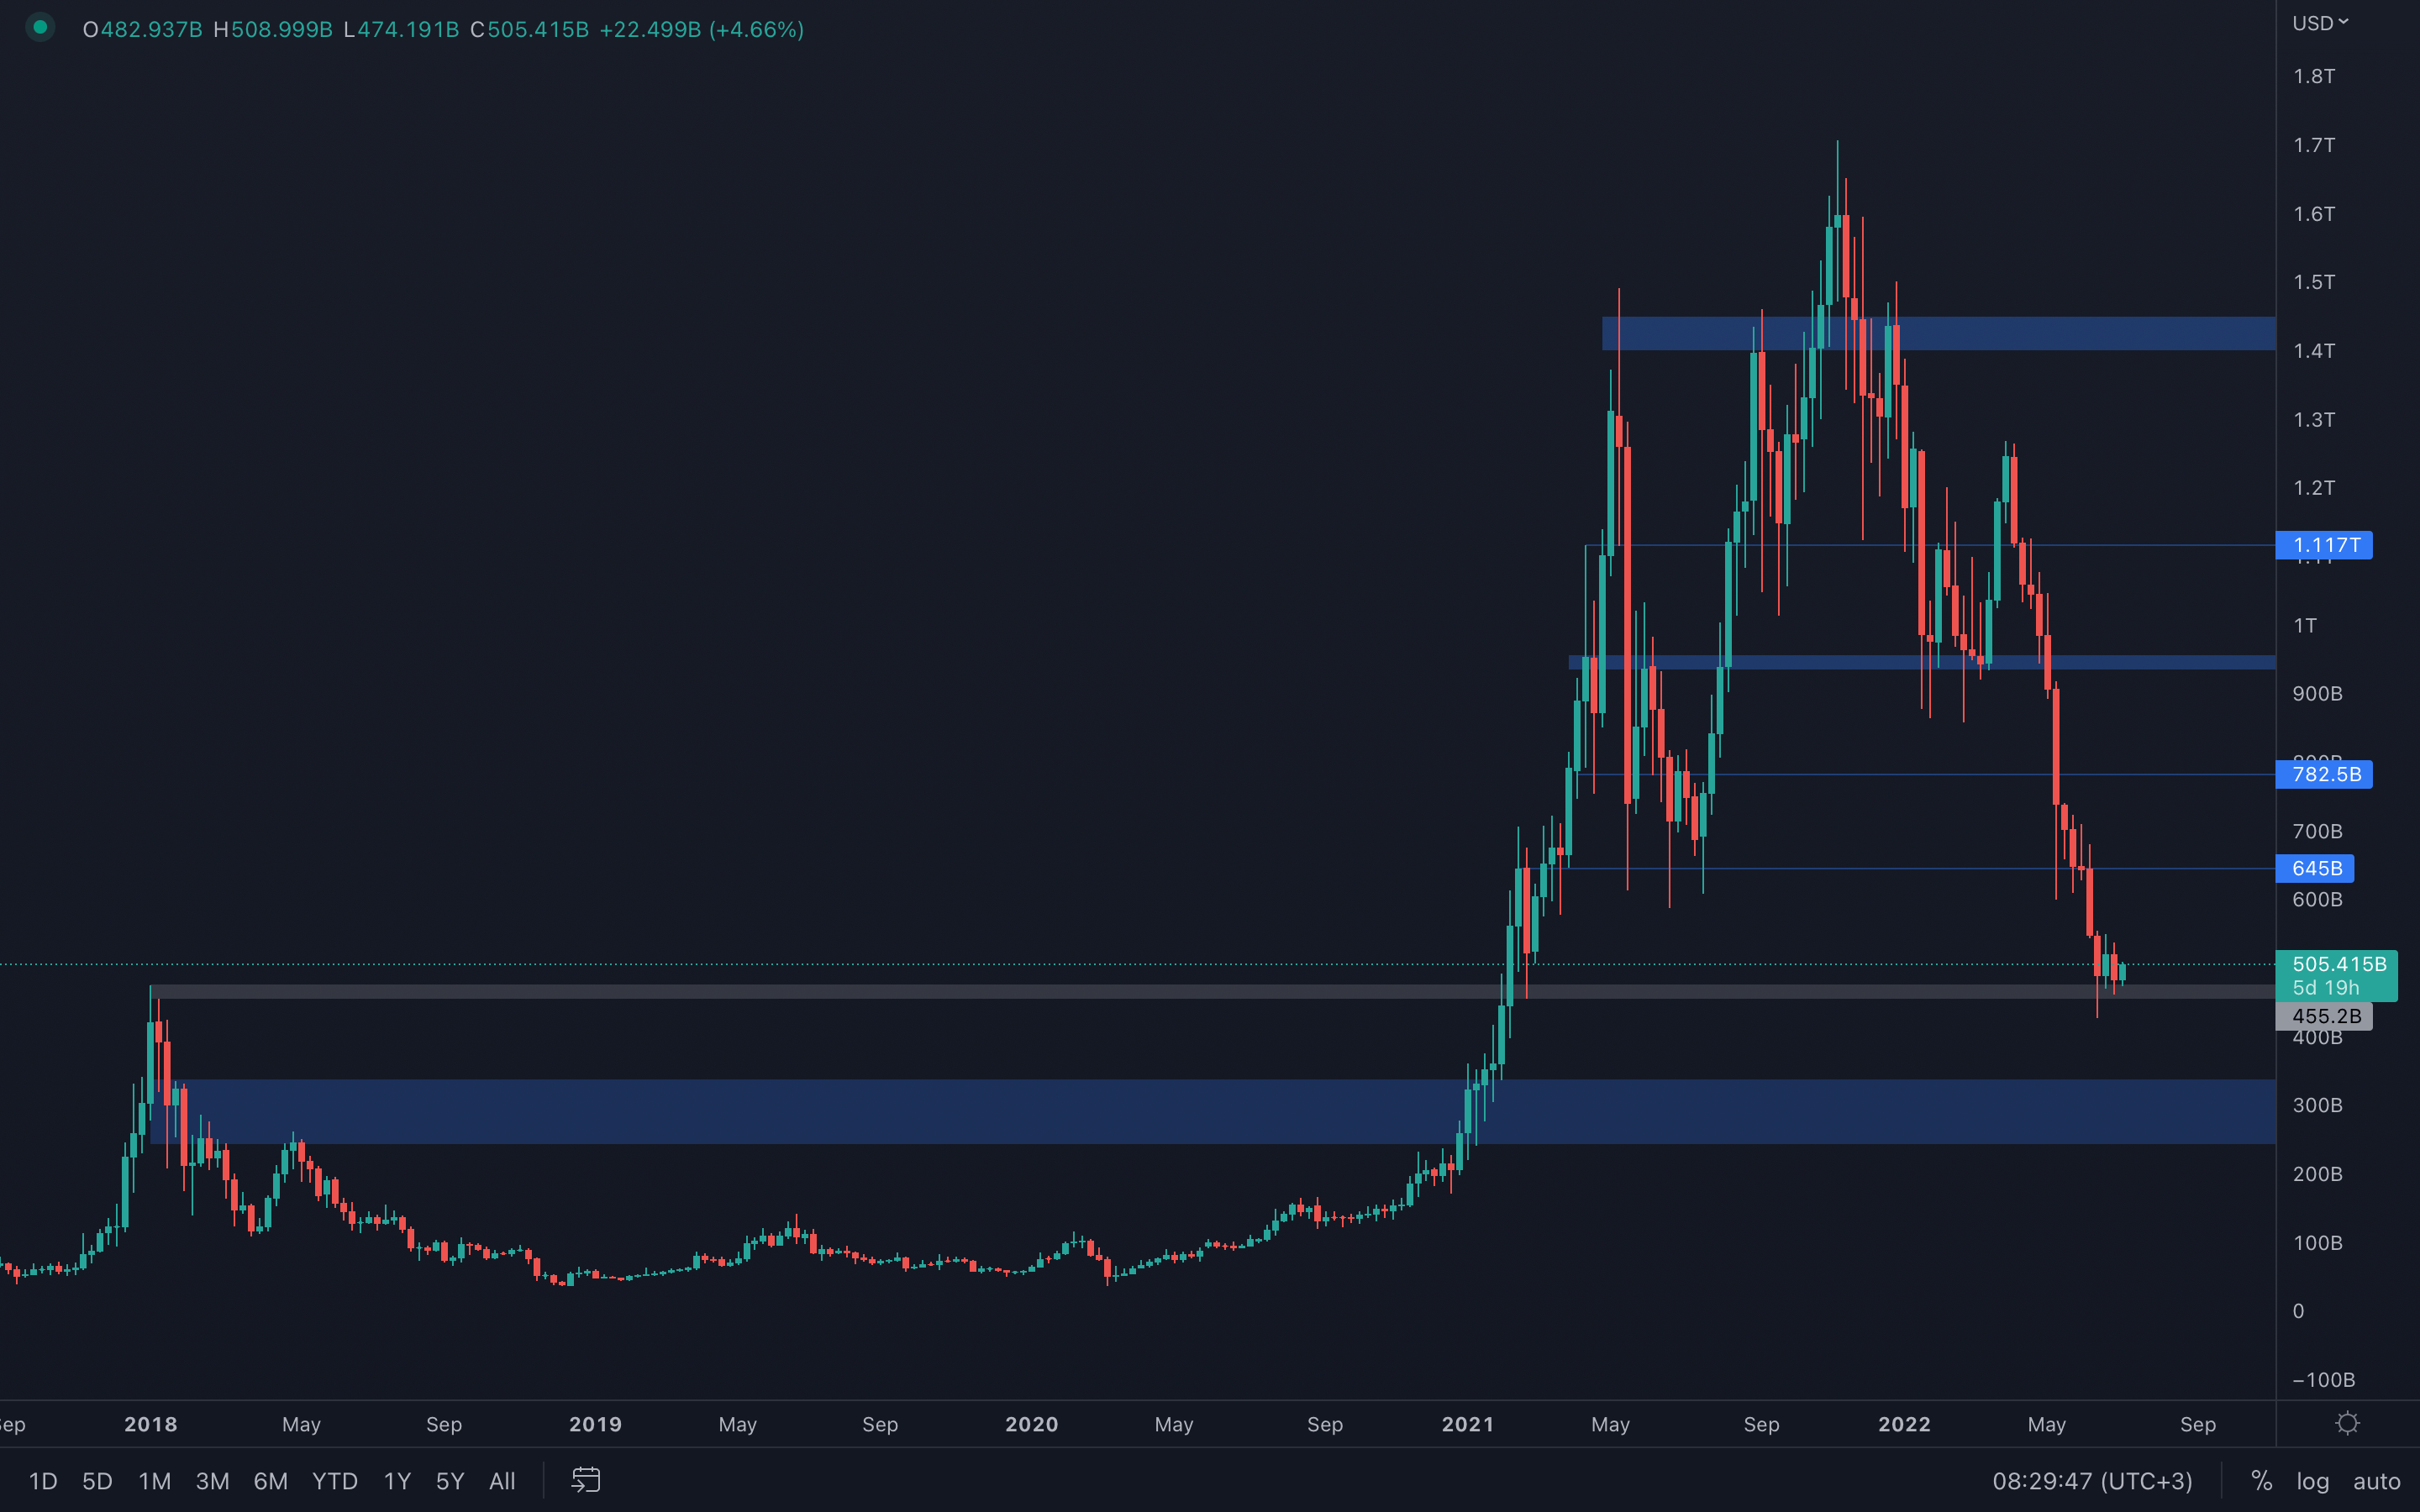 The Altcoins Market Cap index is battling with its 2018 all-time high, struggling to hold the support. A loss of this support will most likely push prices to the $300B - $200B demand area, an approximately -30% move. Of course, this scenario is only confirmed once the 2018 all-time high support is lost. Until then, we shouldn't be surprised if prices start to catch a bit of bullish momentum in early June.
Bitcoin - Technical & On-Chain Analysis
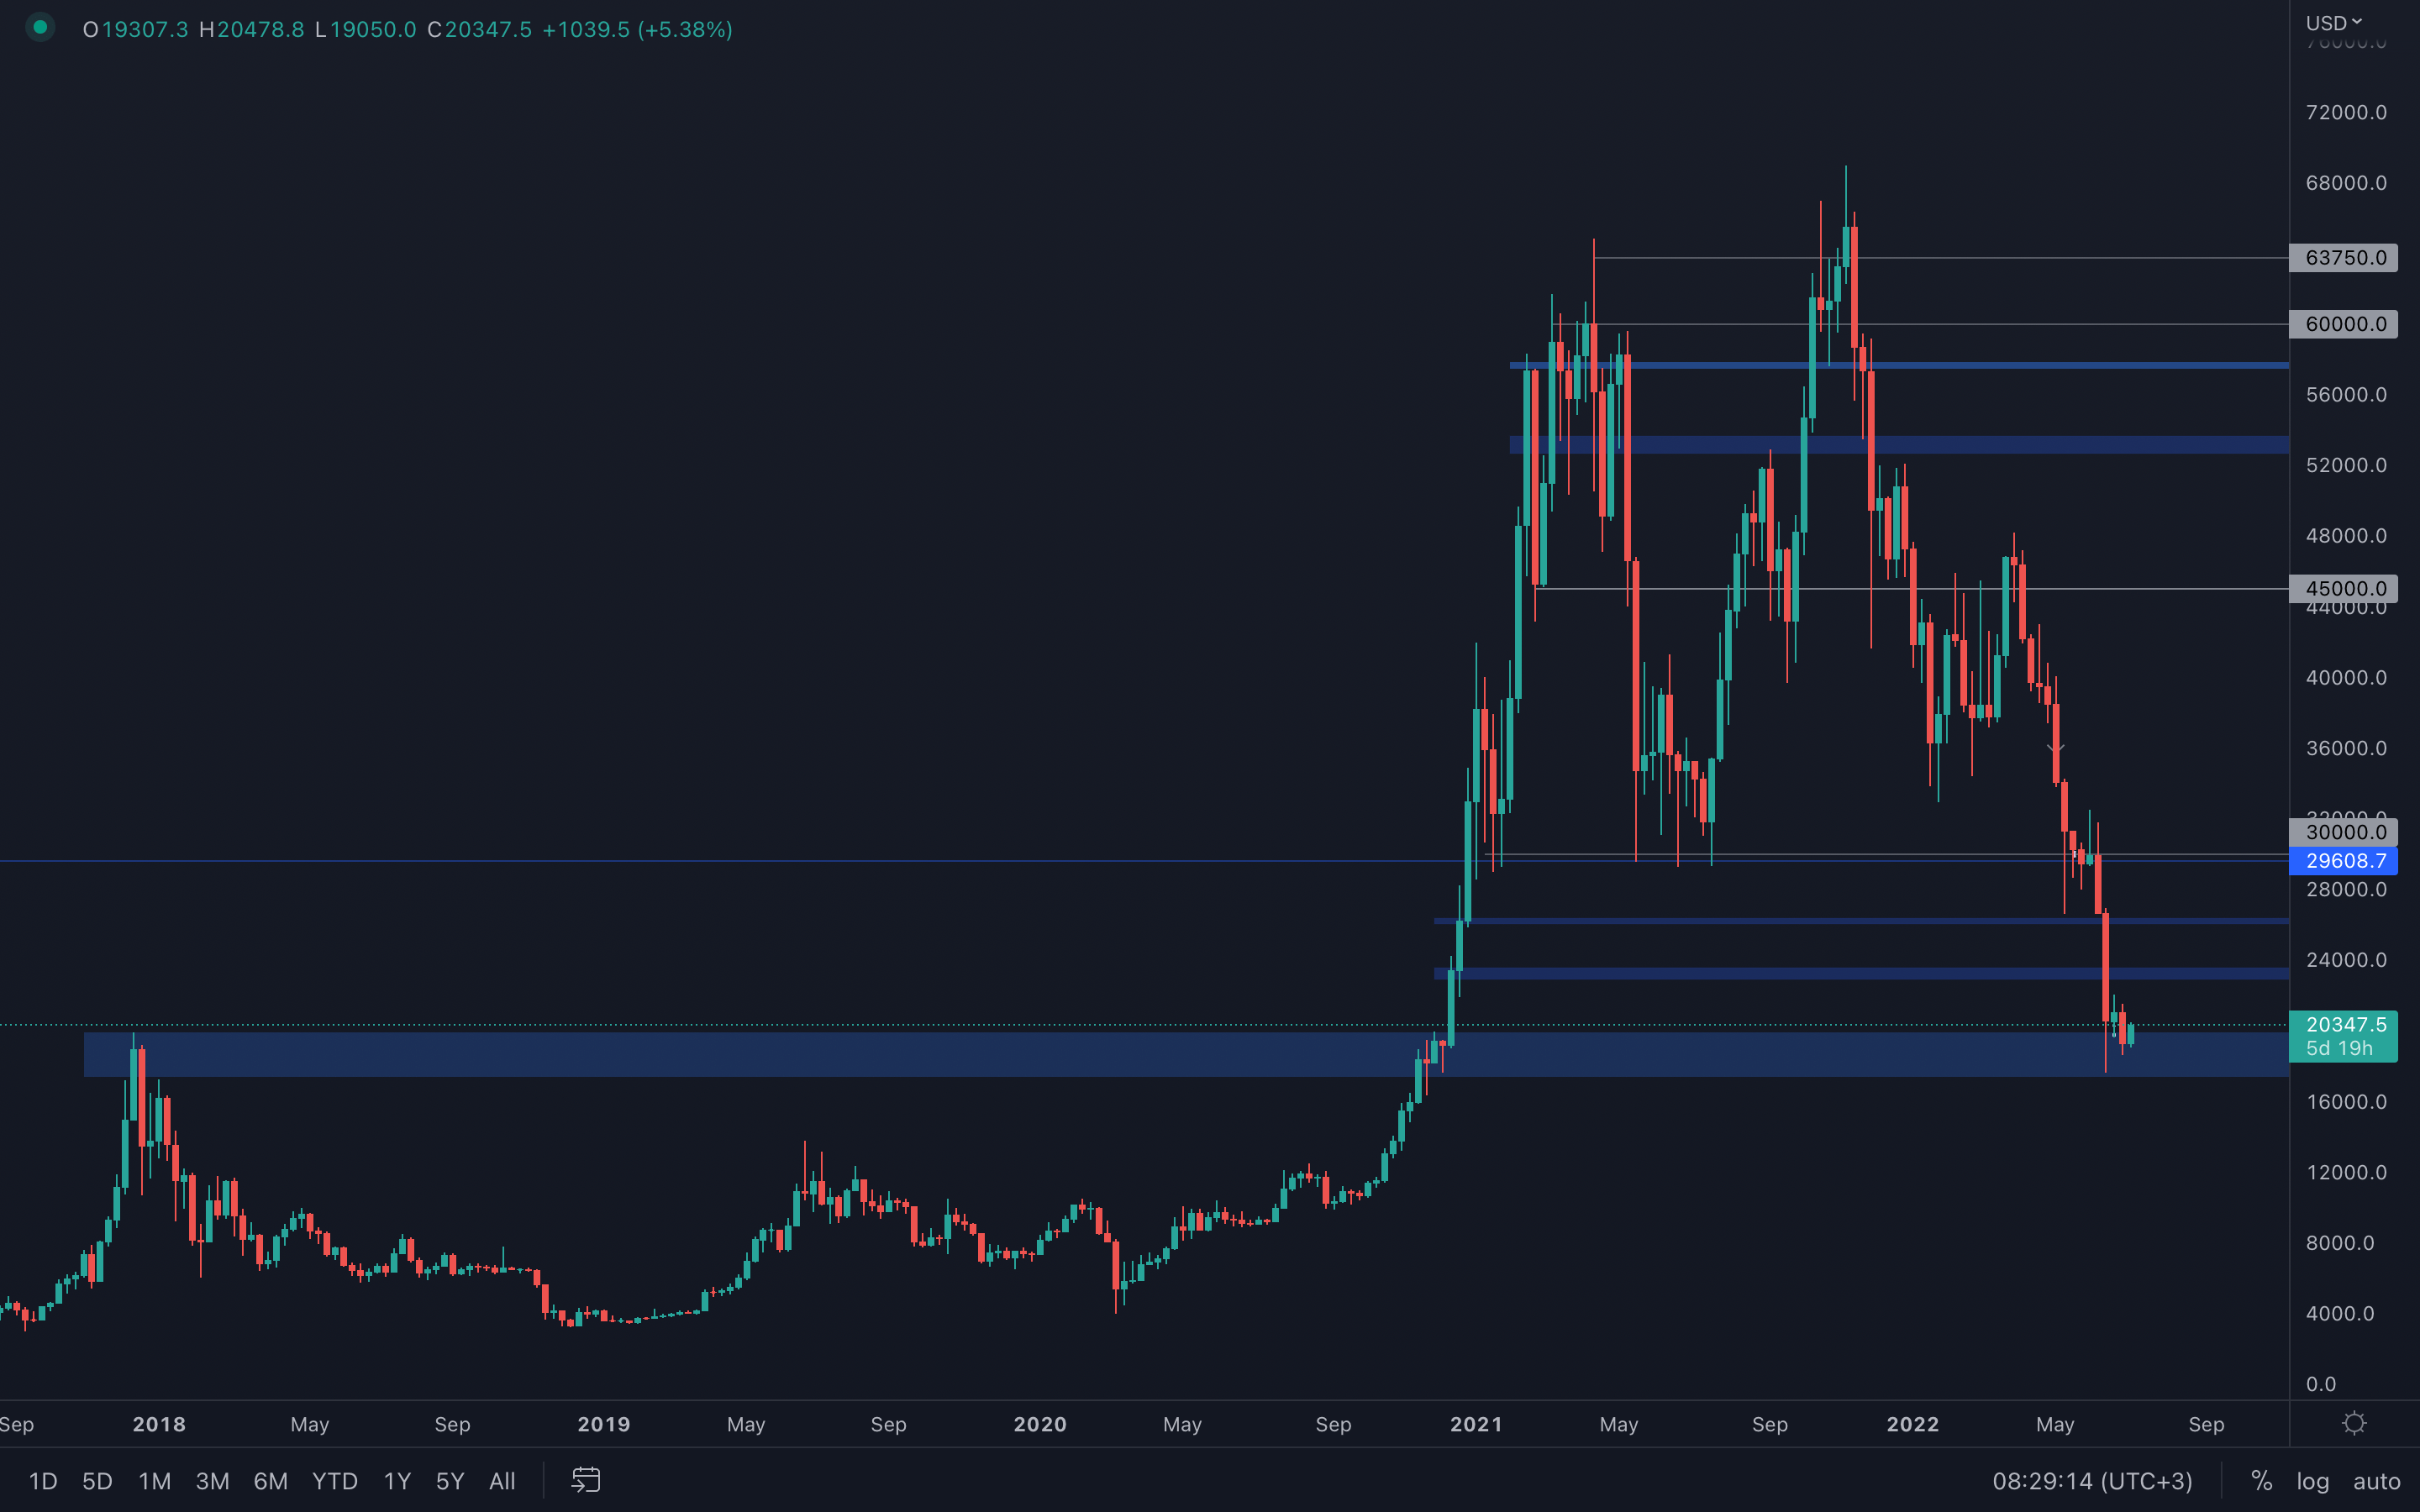 Bitcoin registered its lowest weekly candle closure since February 2021 last week, which only implies that we are most likely going to see lower prices. However, the $20k level has been reclaimed on the daily timeframe, which suggests that we can see some bullish momentum in the market this week and most likely close green. This basically causes a "wait until it's confirmed" scenario, where uncertainty is at its highest.
Metric 1 – Exchange Netflow Volume
If we begin by looking at the Exchange Netflow Volume, in order to be bullish we usually look for large amounts of outflows of coins from Exchanges, as this usually means coins are being purchased and pulled off Exchanges and transferred to cold storage wallets to be held. However, large outflows from Exchanges may not just be investors buying and moving to cold storage, it may be investors have become spooked by holding coins on Exchanges and instead have decided to move those coins to cold storage in fear that the Exchange may collapse and they may not be able to access their holdings. We can see in the graph below that Bitcoin has had significant outflows. It may be the case that investors have begun taking custody of their coins after issues such as Celsius, Voyager, and Anchor…..maybe even more to come after recent articles from Sam Bankman-Fried, suggesting that some Exchanges are near insolvency.
Bitcoin – Exchange Netflow Volume
 Metric 2 – Addresses
We will now look at the two most profitable cohorts of addresses for Bitcoin and Ether to see if the number of addresses in this cohort has increased (a sign that this cohort bought).
We can see from the Addresses with Balance > 1,000 Bitcoin, that the number of wallets continues to decrease, suggesting this cohort still has not risked back-on yet (hasn’t bought more Bitcoin).
Bitcoin – Addresses with Balance > 1,000 Bitcoin
 Metric 3 – MVRV Z-Score
If we look at the MVRV Z-Score, we can see that Bitcoin is beginning to move in the green “buy zone”, indicating a bottom may be near.
Bitcoin – MVRV Z-Score
 Metric 4 – Realised Price
The last metric we’re going to cover today is the Realised Price. Historically, Bitcoin has spent much of its time above the Realised Price as we can see in the graph below. We now currently sit below this price point. Back in late 2018 to early 2019, we saw Bitcoin price considerably below this Realised Price, so perhaps we can still go lower. However, timing the bottom perfectly is very tricky, but what we do know is that the below chart signals that Bitcoin is currently cheap in comparison to its fair value.
Bitcoin – Realised Price
Ether - Technical & On-Chain Analysis
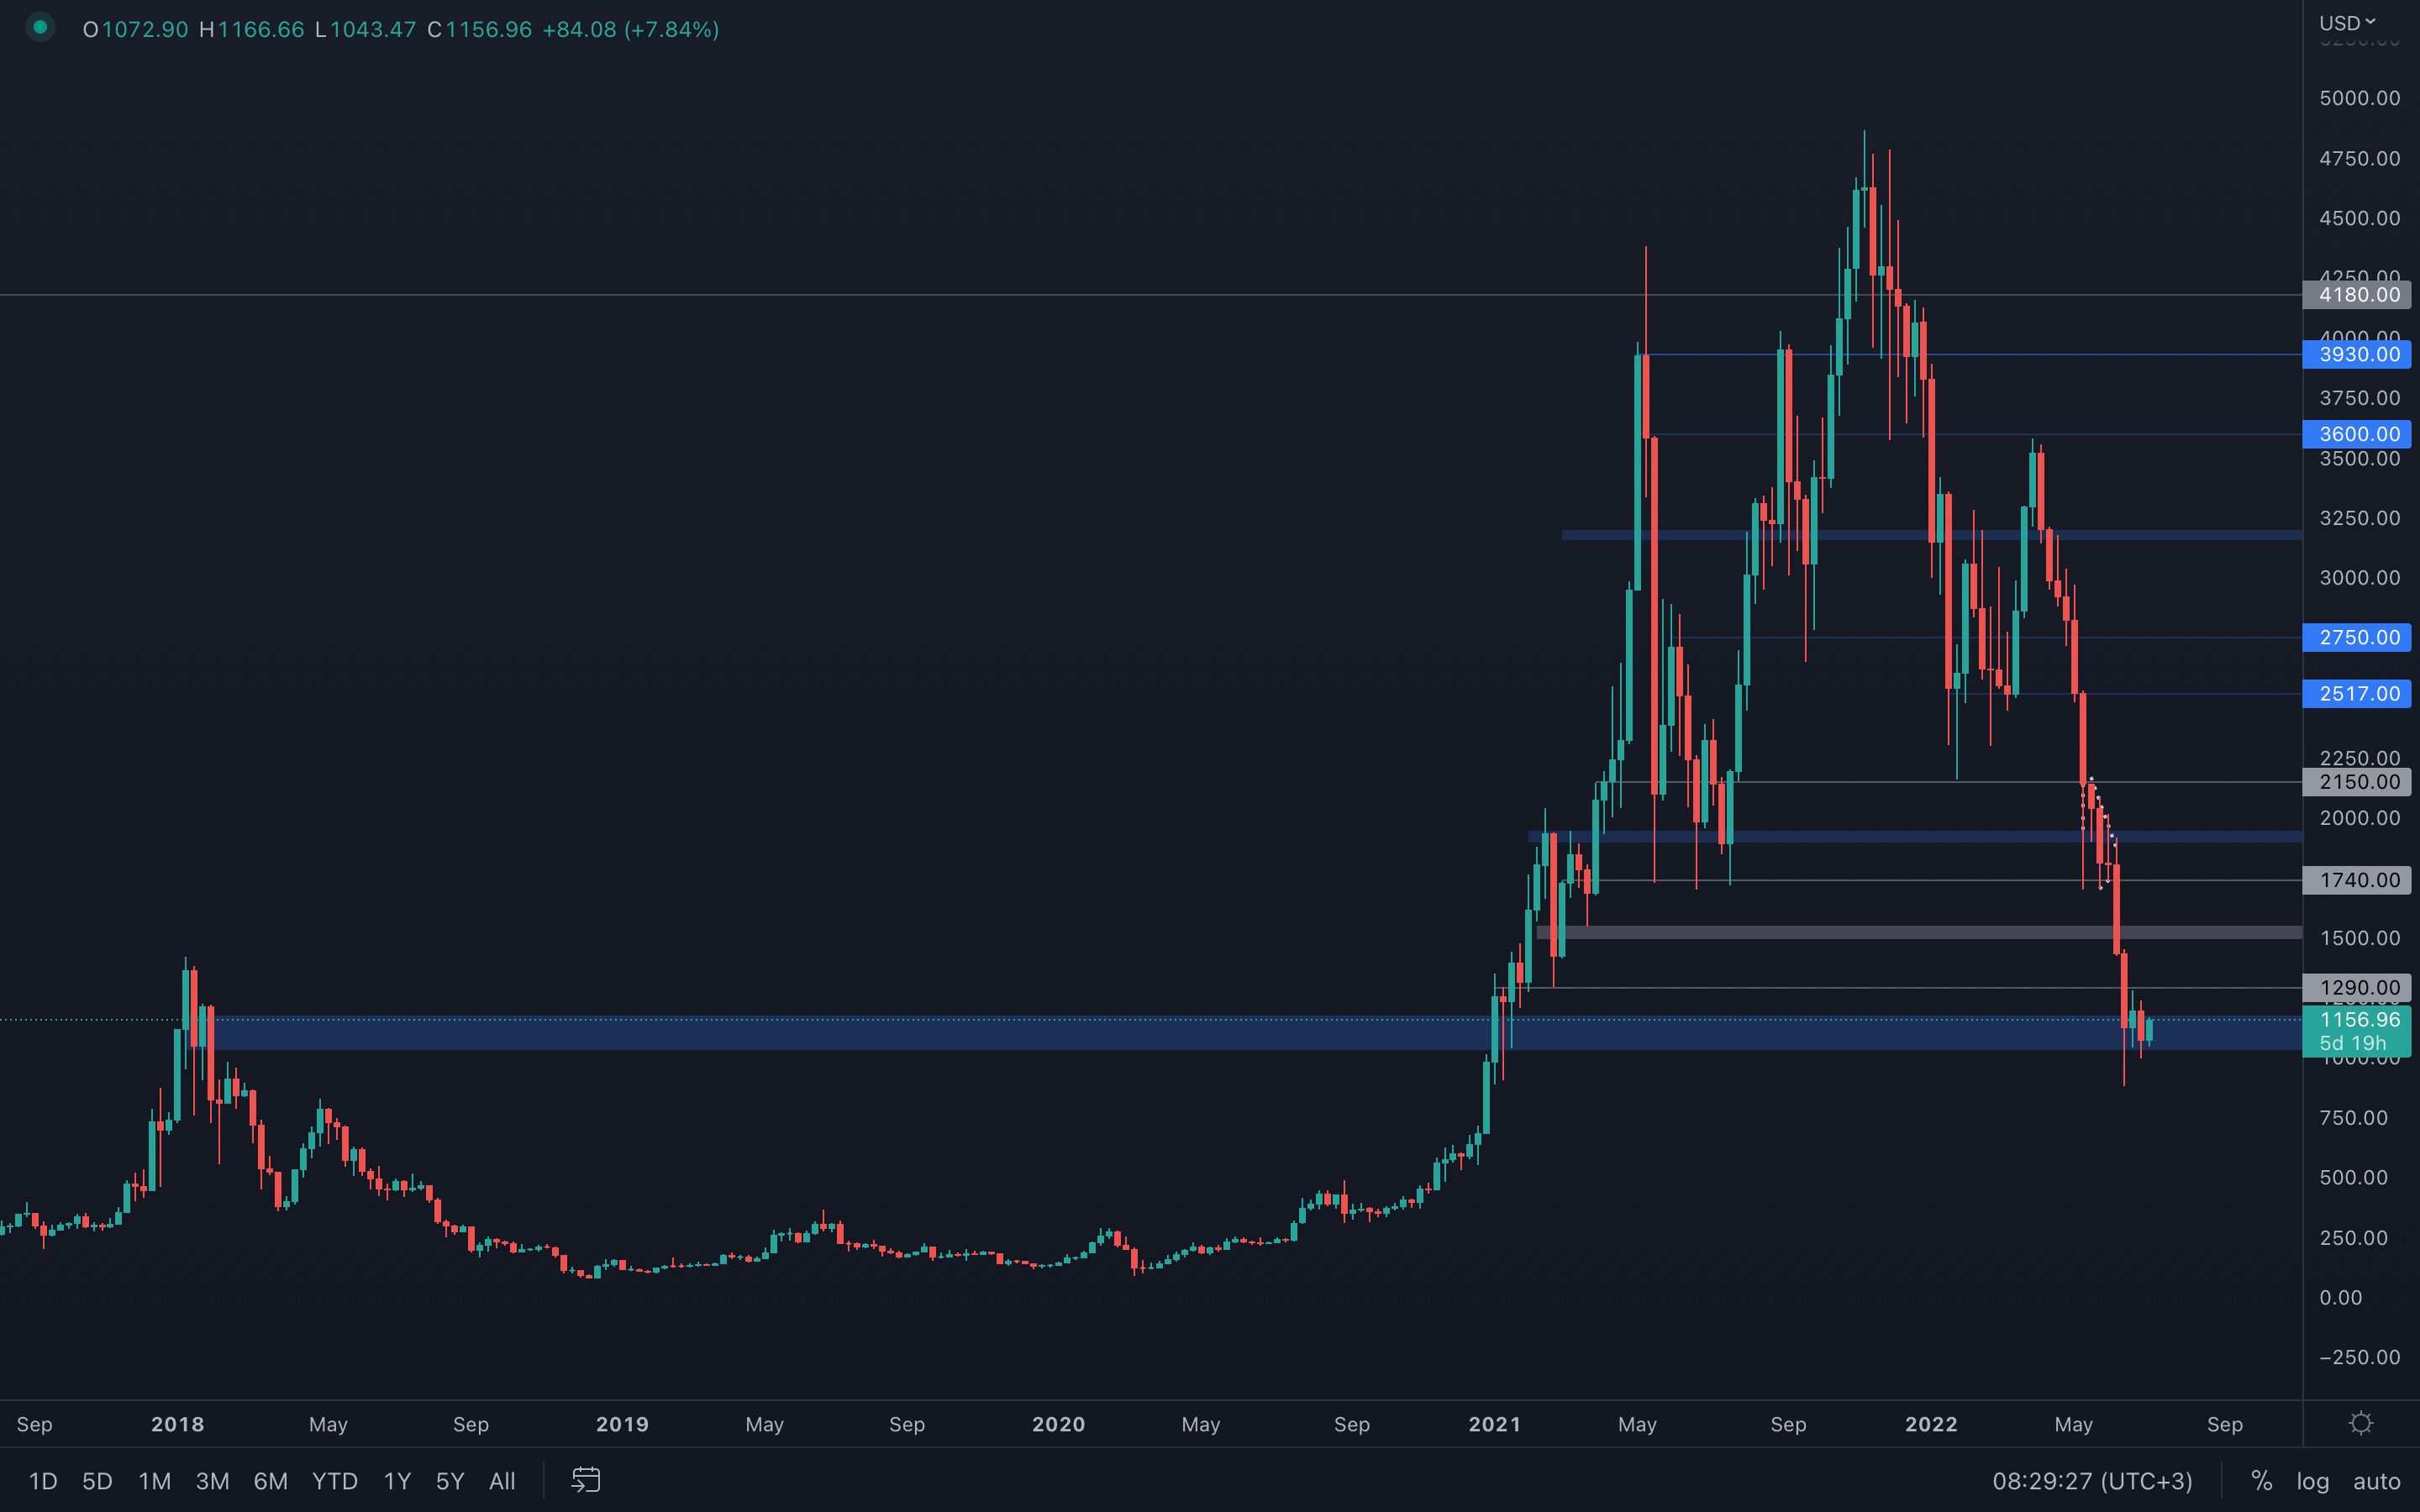 Ether has experienced a much more aggressive outcome compared to Bitcoin, as it has dropped under its 2018 all-time high and is currently still under it. An area of interest has been identified, however, and it seems Ether will continue to follow Bitcoin's price action perfectly (what a surprise!). As Bitcoin has no clear direction yet, same thing applies for Ether - expect ranging between $900 and $1300 for the coming weeks.
Metric 1 – Exchange Netflow Volume
If we now turn our attention to a similar metric for Ether, we can see that the number of wallets that have more than 10,000 Ether in them has remained relatively high and has not risked off throughout all of 2022. Since the all-time high in price, we have seen the number of wallets actually remain unchanged, 1,181 wallets. It can therefore be determined that this metric for Bitcoin is a far better indicator of predicting future prices than the similar version of this metric for Ether.
Ether – Exchange Netflow Volume

Metric 2 – Addresses
If we now look at Ether, we look at the Addresses with a Balance > 10,000 Ether. They have never really decreased significantly but they have been in a general downtrend. Overall, the major thing we can determine is that they have not increased dramatically since the first and second quarters of 2021.
Ether – Addresses with Balance > 10,000 Ether

Metric 3 – MVRV Z-Score
If we now look at the same metric but for Ether, we can see that it has actually breached below the historical green “buy zone”. Again, this zone has proven to be a great time to buy both Bitcoin and Ether. The bottom may be much closer than perhaps many in the market are predicting.
Ether – MVRV Z-Score

Metric 4 – Realised Price
If we look at the Realised price for Ether, we can see that Ether has traded significantly lower than its Realised price, however, it now also trades significantly below its Realised price, again indicating that Ether may be providing us with a great buying opportunity in the very near term.
Ether – Realised Price

DOT
 DOT closed even lower than before last week, but it is still above its bottom part of the current support area sitting at $6.30. Until this area is lost via a weekly candle closure under it, then we should expect further ranging between $6.30 and $10, as also mentioned in last week's analysis report.
SNX
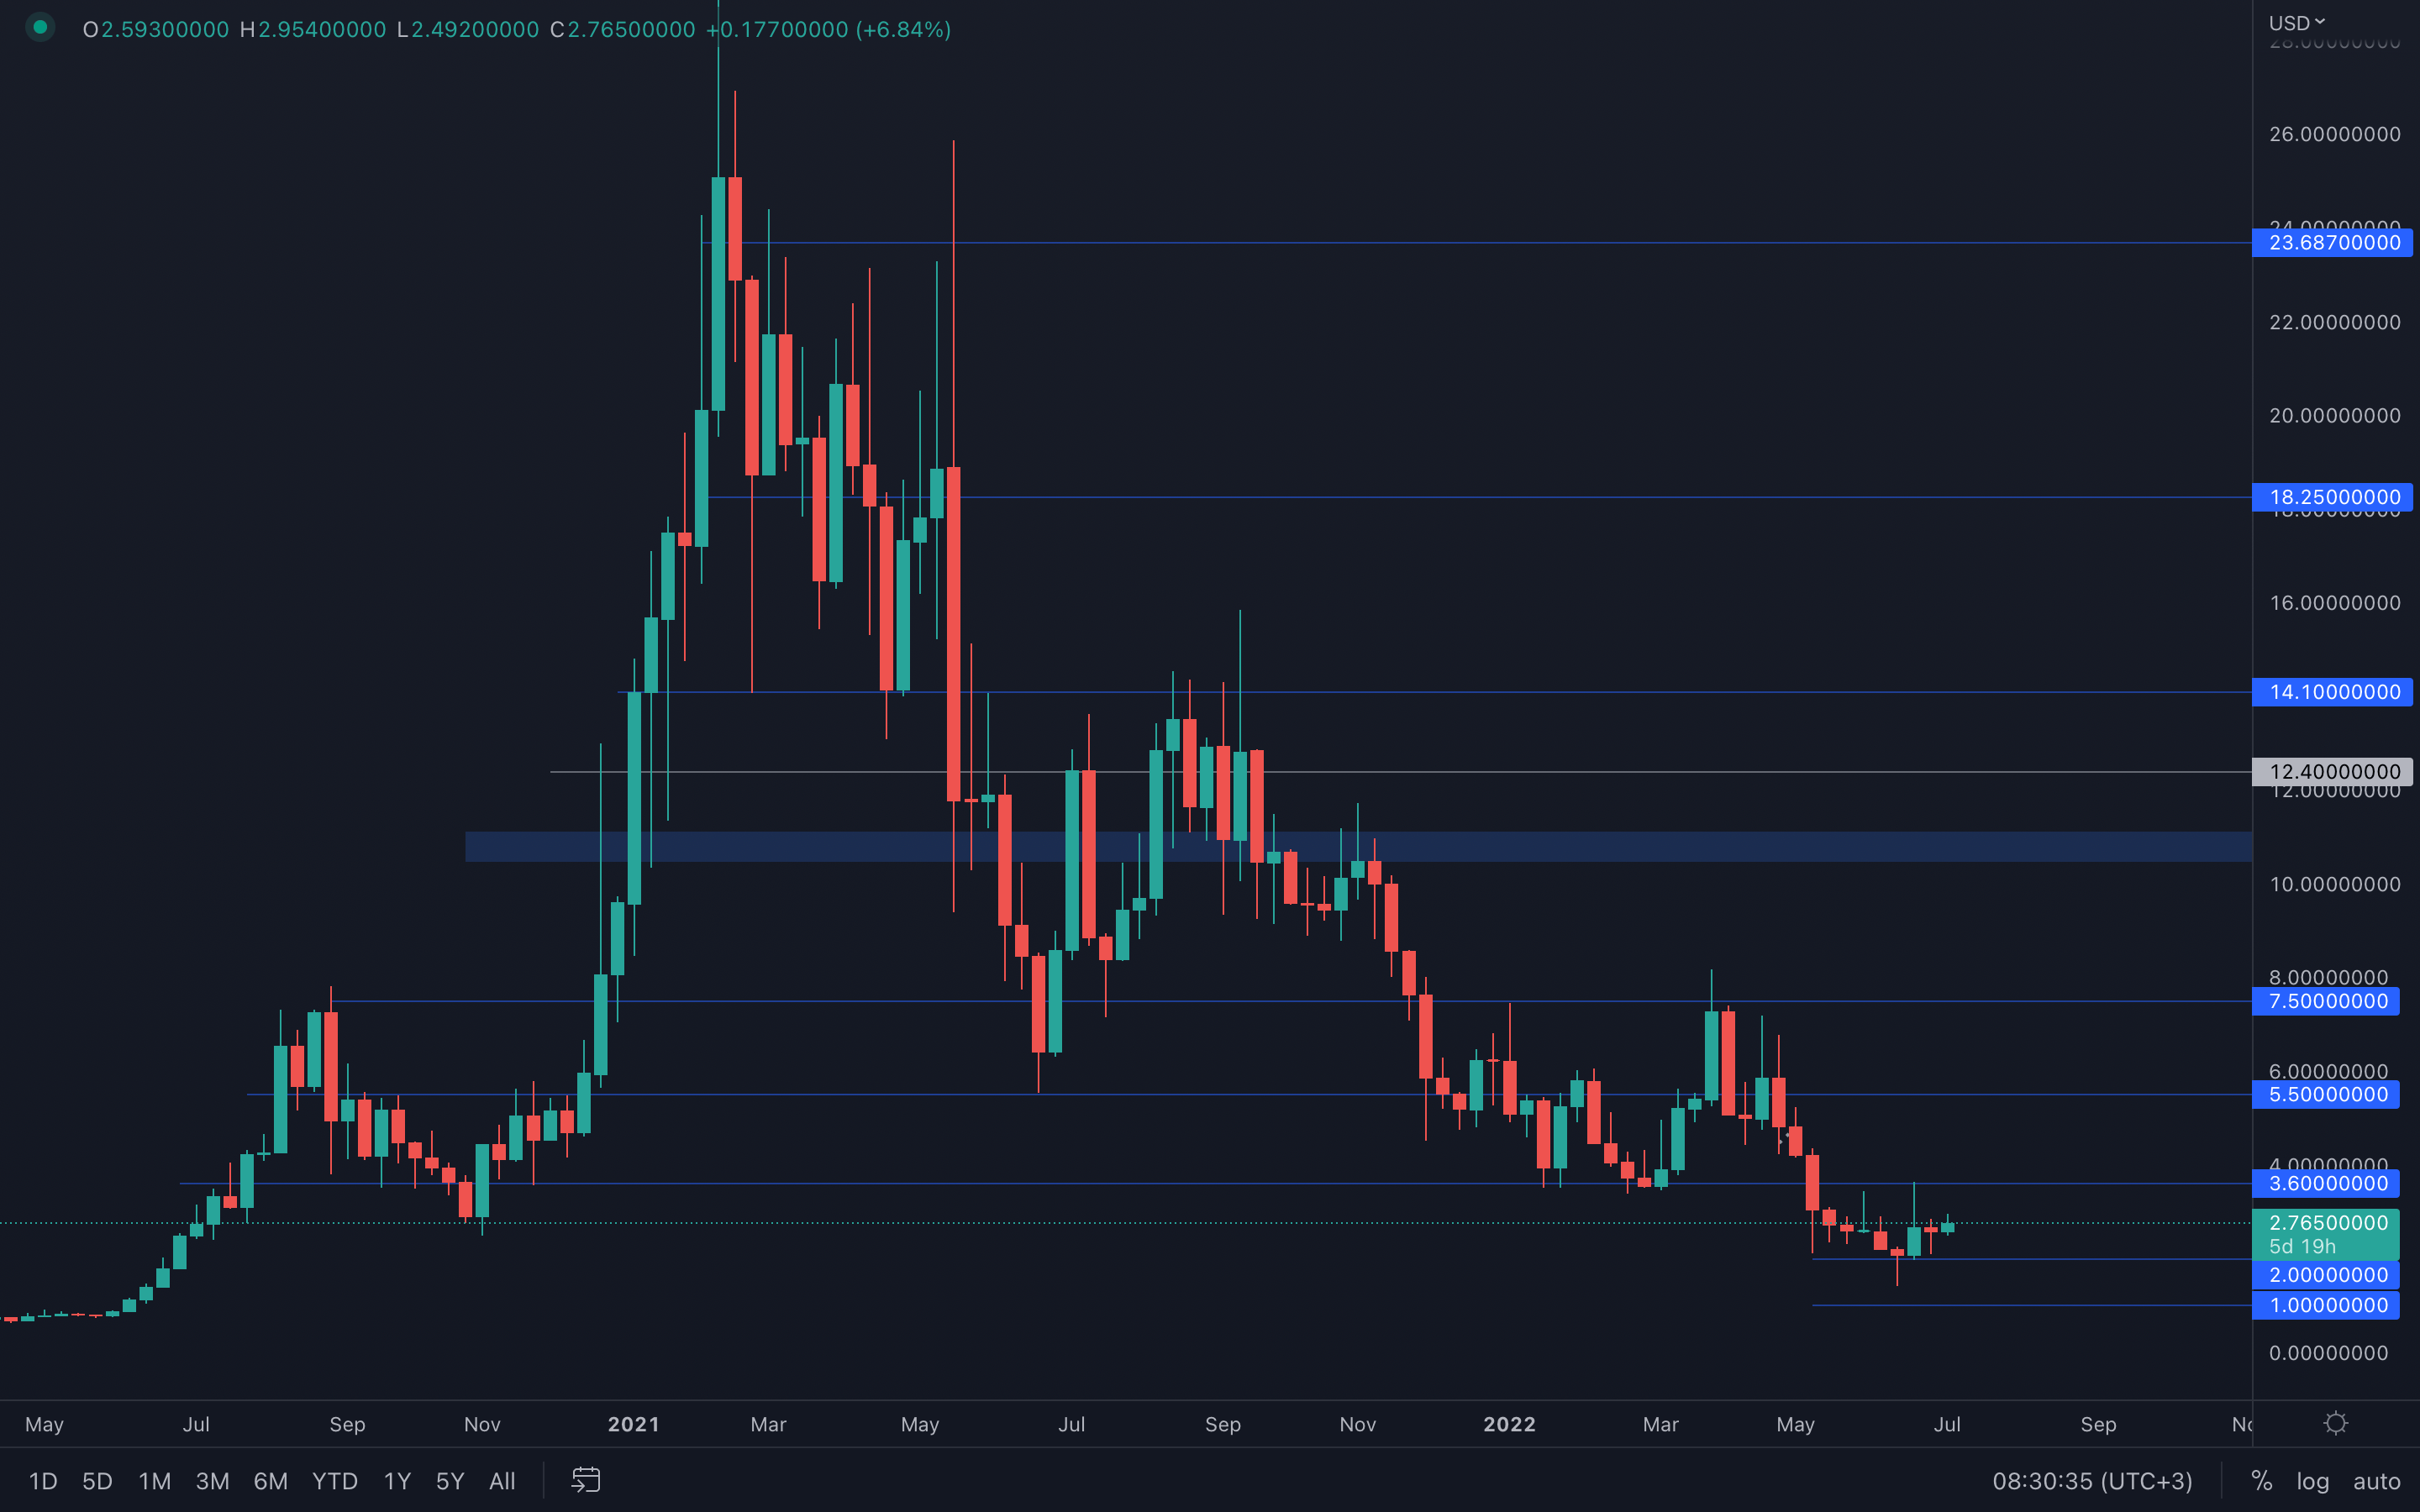 SNX looks a bit better than most assets we covered in this report, as it perfectly took the $2 level as support and strongly bounced to its $3.6 resistance level. With buyers showing their hand and taking control over the price, it's safe to assume that a $3.6 resistance test is possible once more, of course, if BTC also plays along.
RUNE
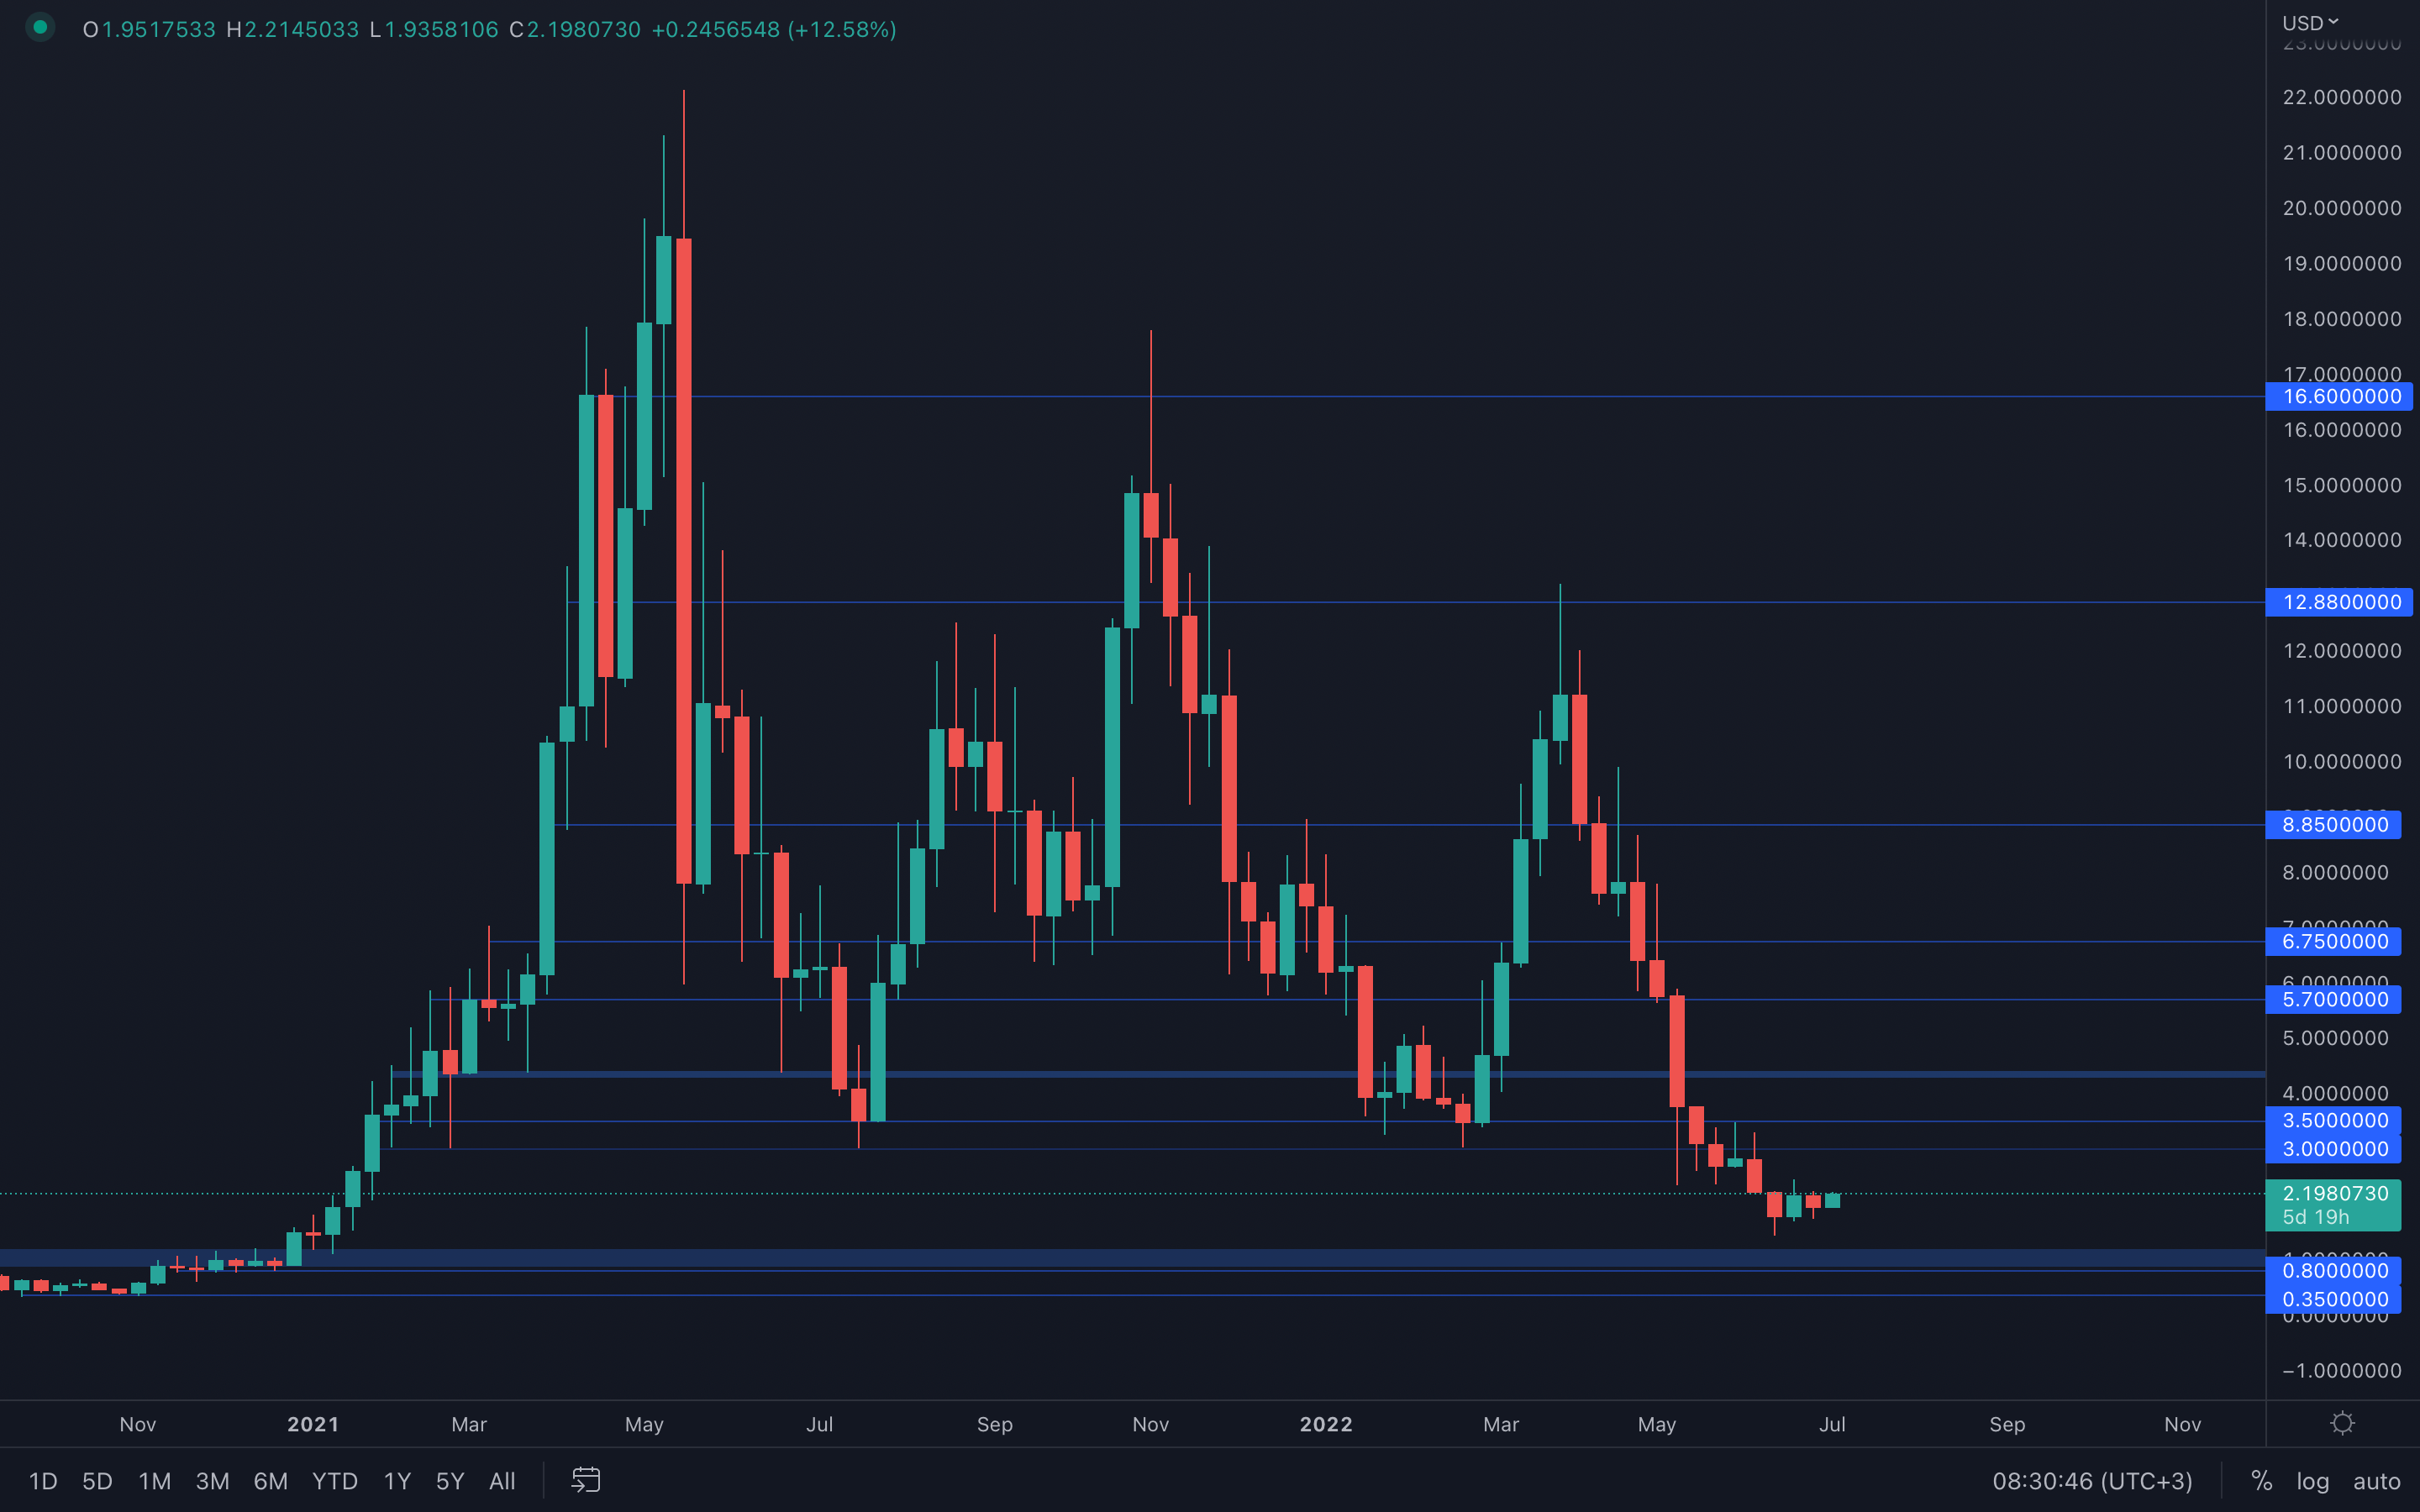 Interesting candlestick formation for RUNE - if this week closes above $2.20, then we are looking at a potential $3 resistance test. Due to the recent mainnet launch, volume is at extreme levels, which indicates increased volatility - volatility can be described as a double-edged sword, so we shouldn't blindly follow it, but rather take advantage of it. As a recap, if RUNE closes this week above $2.20, then chances are it could test its $3 resistance level shortly after. However, if this is not the case, we should be expecting further downside to its long-awaited $1 psychological level.
SOL
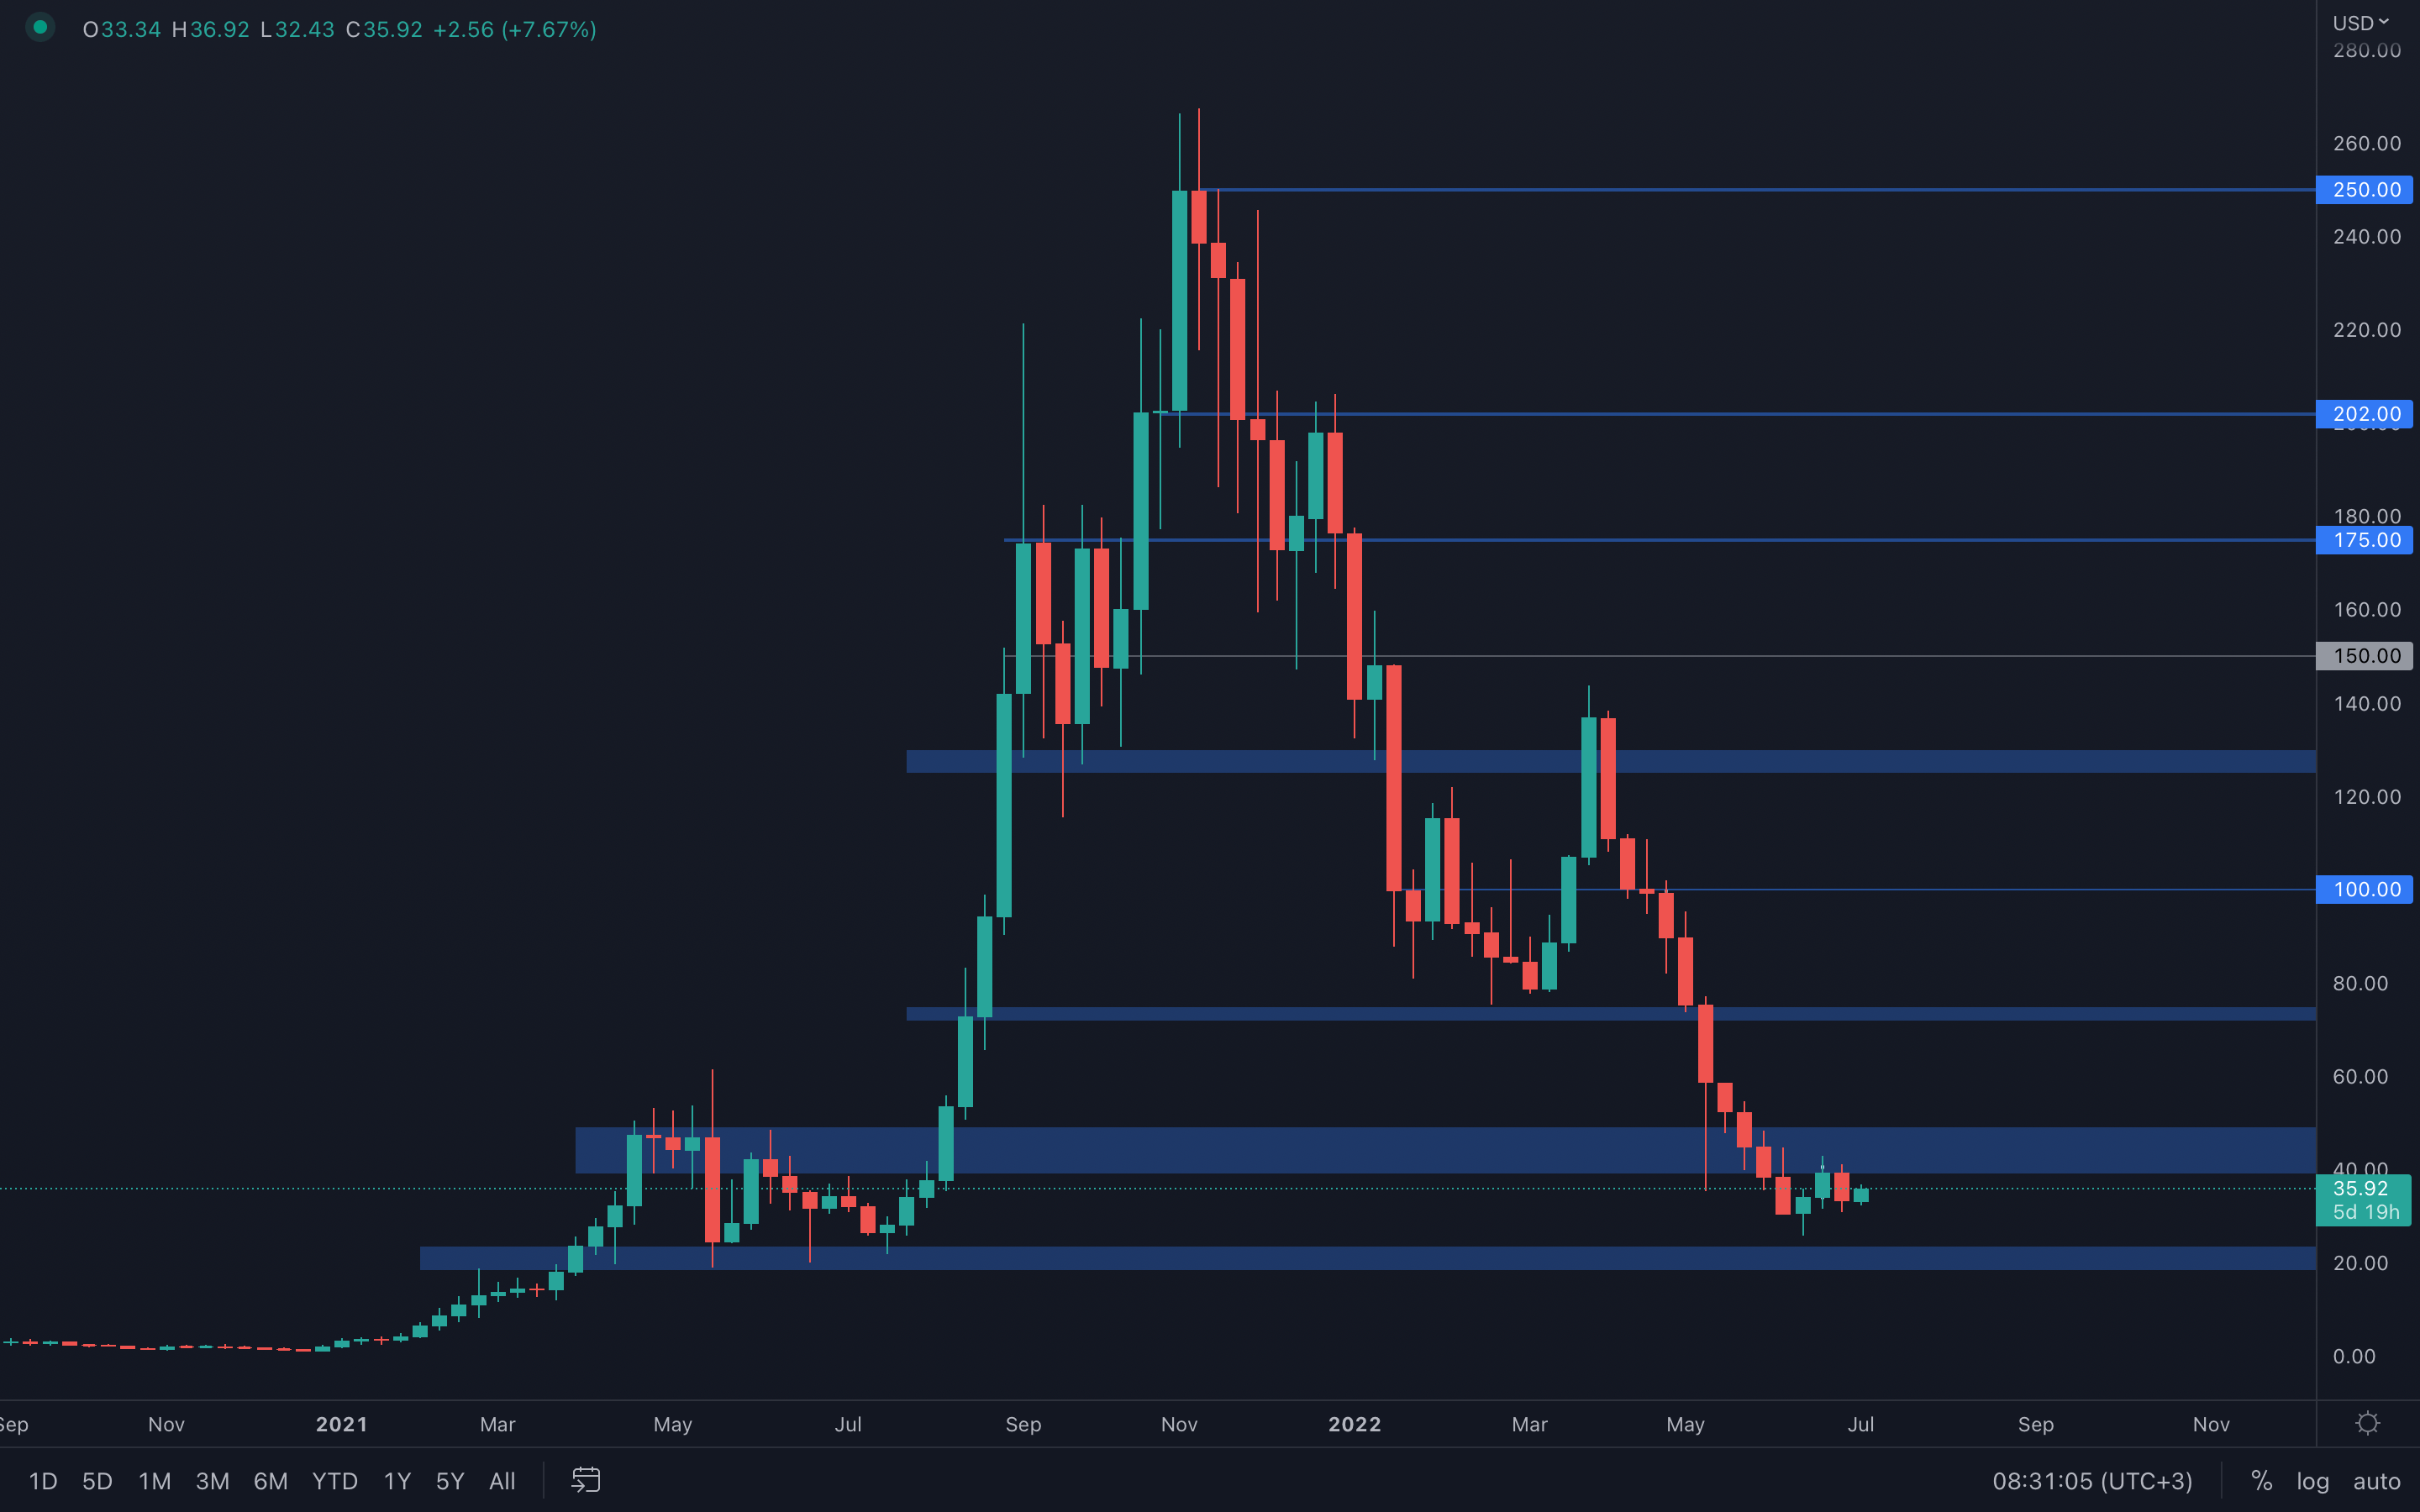 Interesting price action compared to the other assets - SOL registered a bearish engulfing candle last week, after getting rejected from its $40 resistance level. Engulfing candles are extremely powerful, as simple as they may seem for only one reason - we understand who is in control and who isn't, and in this case, sellers have taken over control. With that said, we should be expecting further downside, most likely to SOL's closest support area sitting at $20. Only a weekly reclaim of $40 invalidates this scenario - until then, trade with caution.
SRM
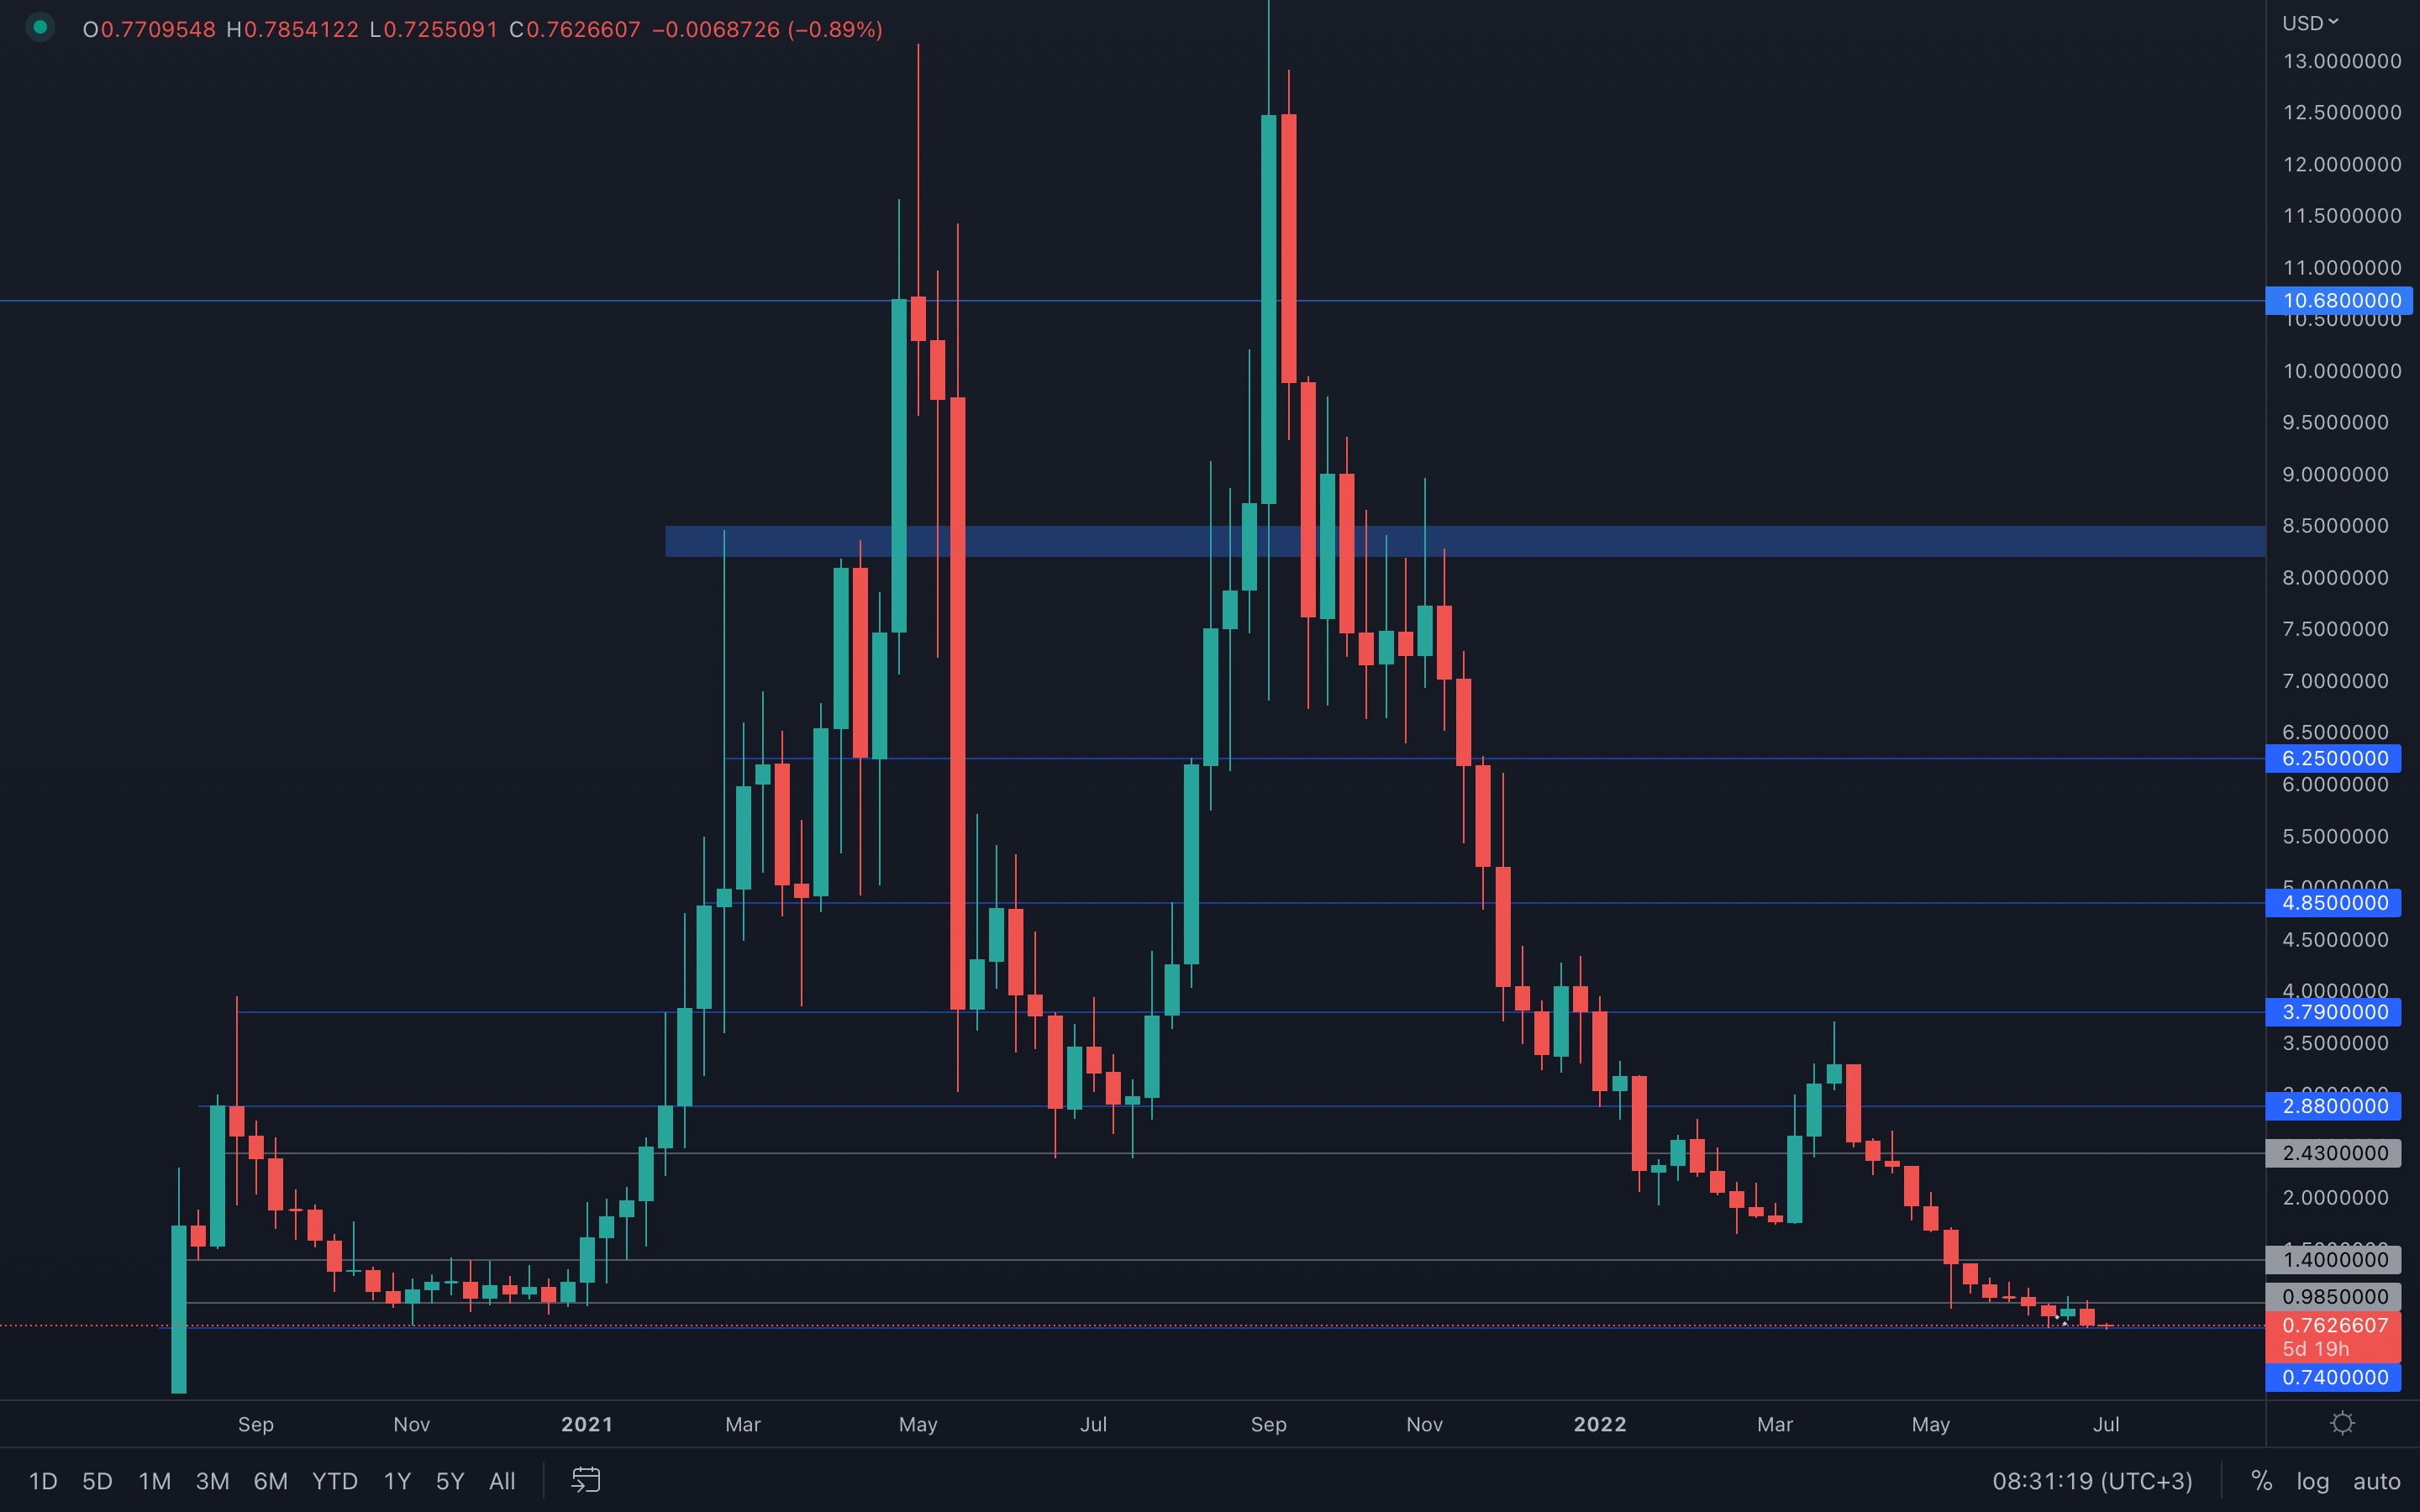 Weekly candle closure right into SRM's $0.74 support level, this suggests increased selling pressure. However, due to the fact that this level hasn't been lost yet, we cannot assume further downside will follow until proven otherwise. A daily closure under the $0.74 support level will bring price into the unknown, with $0.50 as the closest psychological level.
FTT
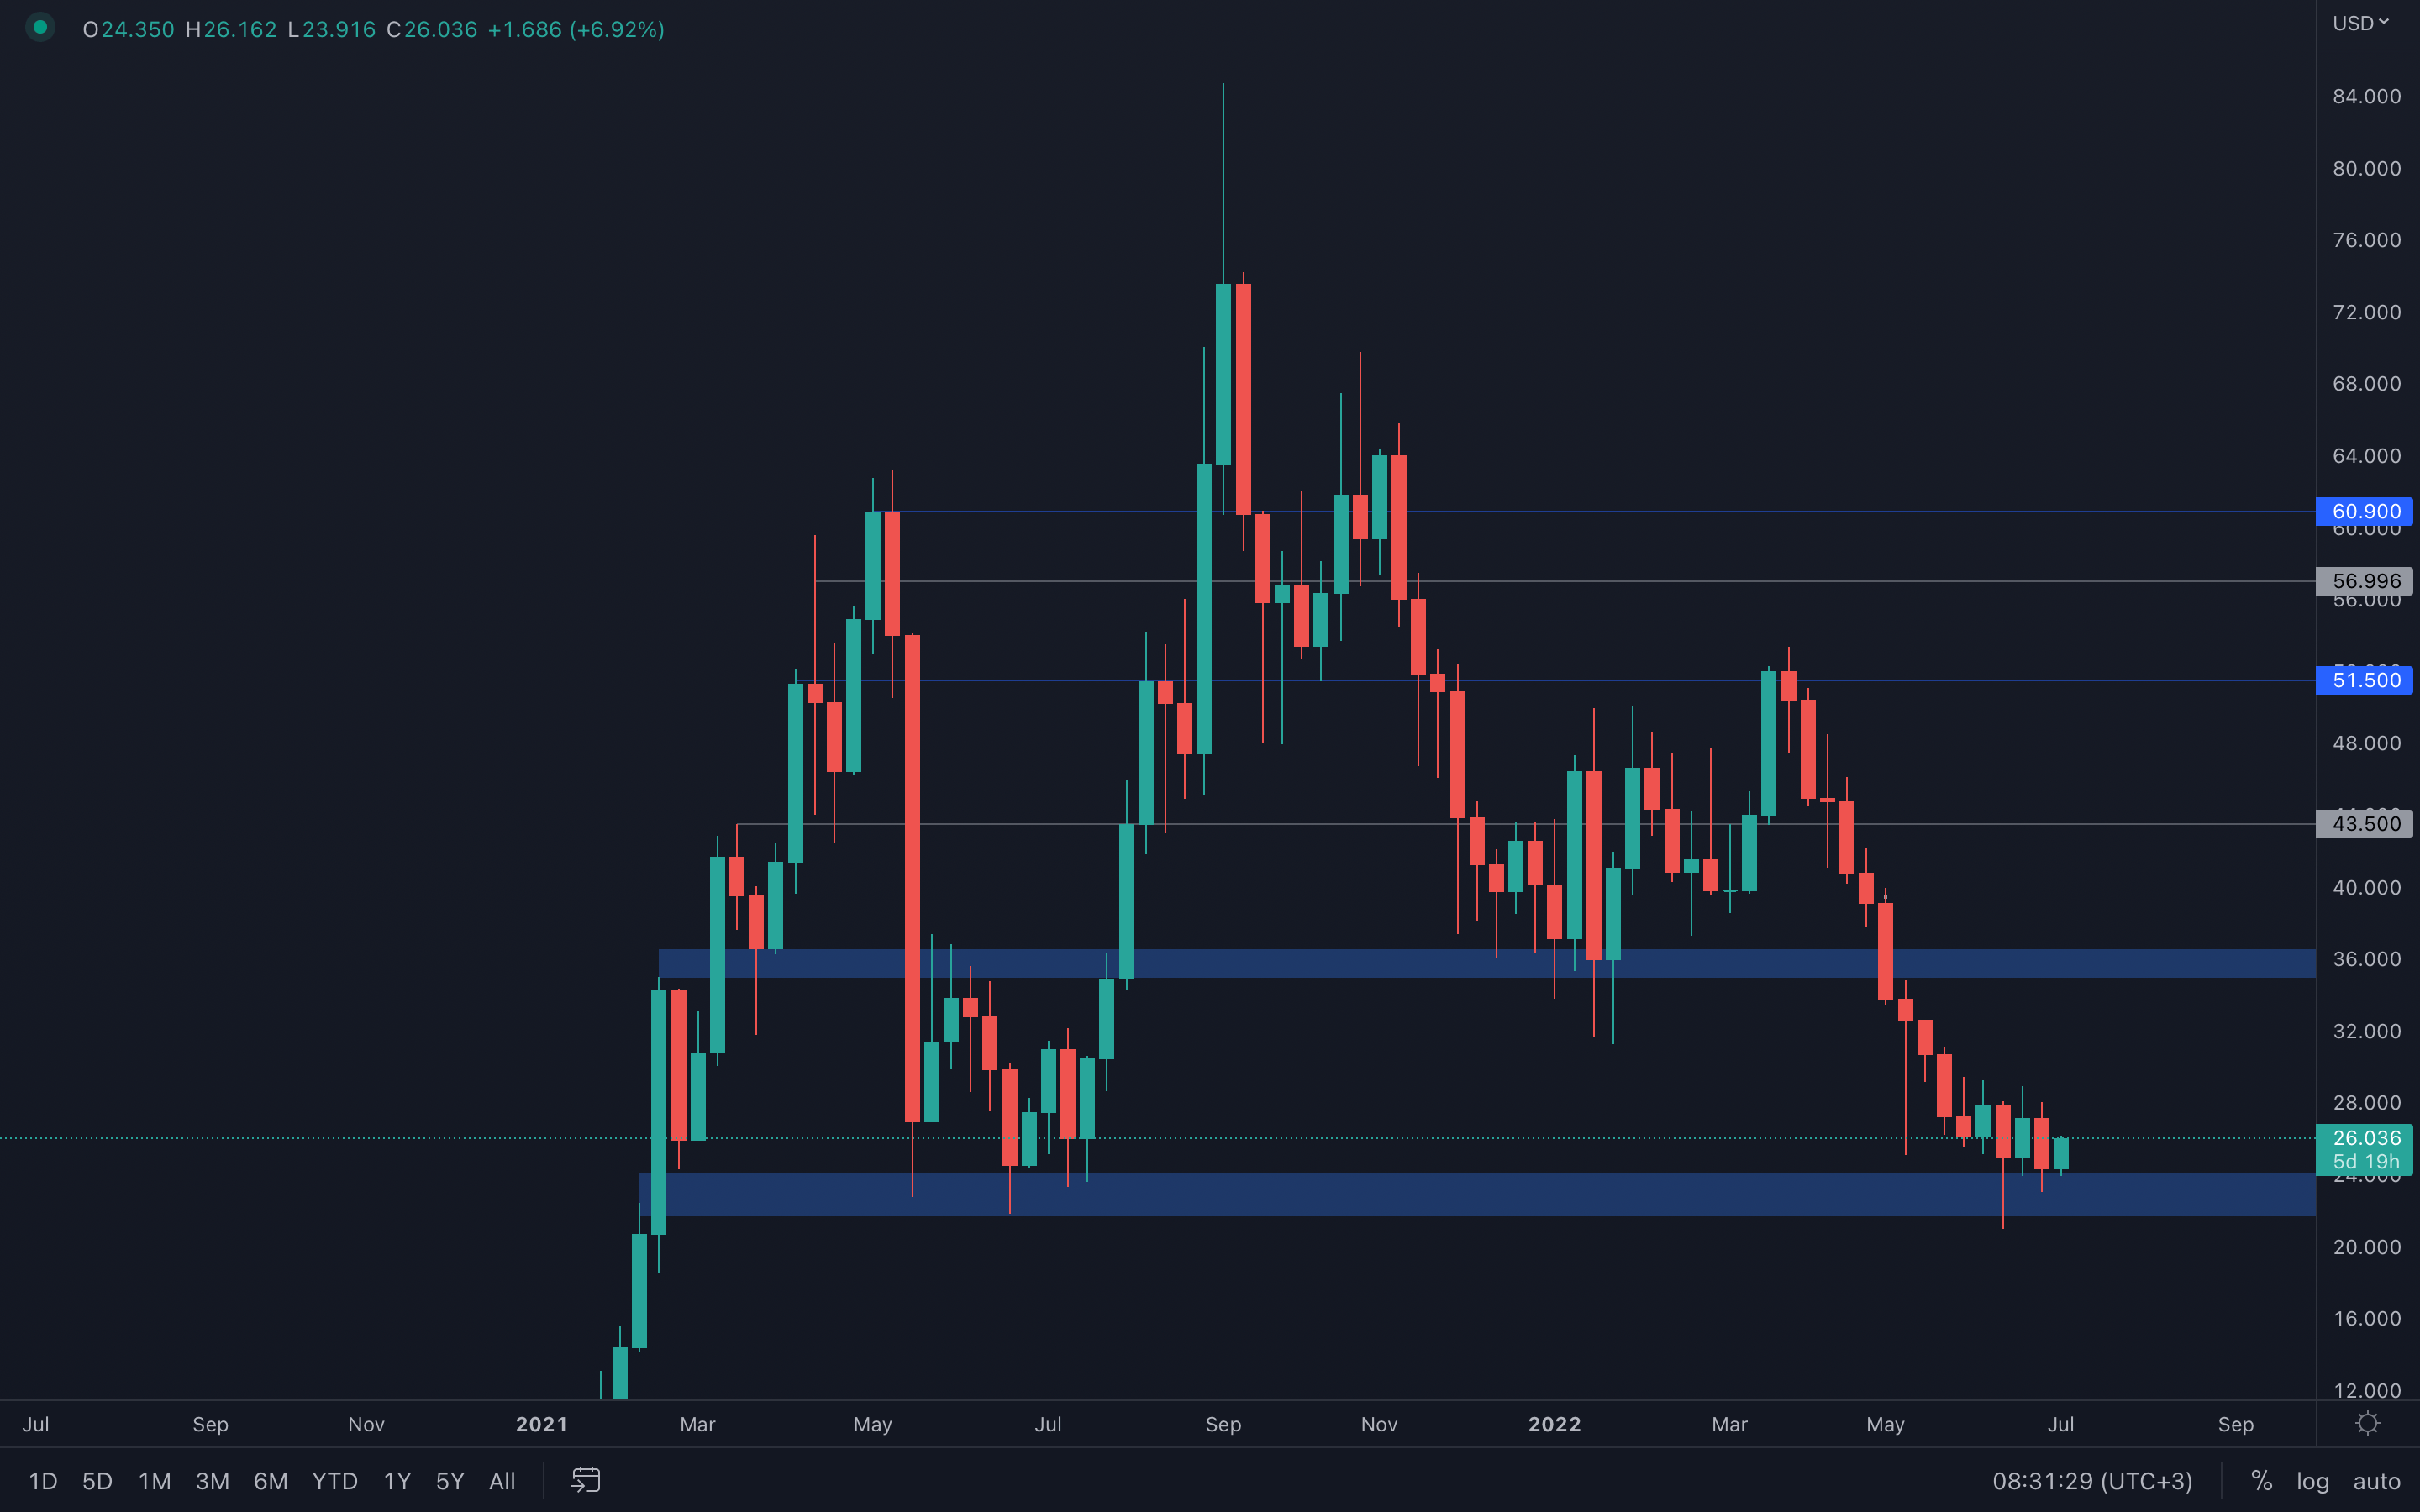 FTT is experiencing yet another bounce from its $24 support level, which indicates buyers are able to keep the price from falling further, losing this major support area in the process. Until this level is lost via a weekly closure under, then we can only expect further ranging.
MINA
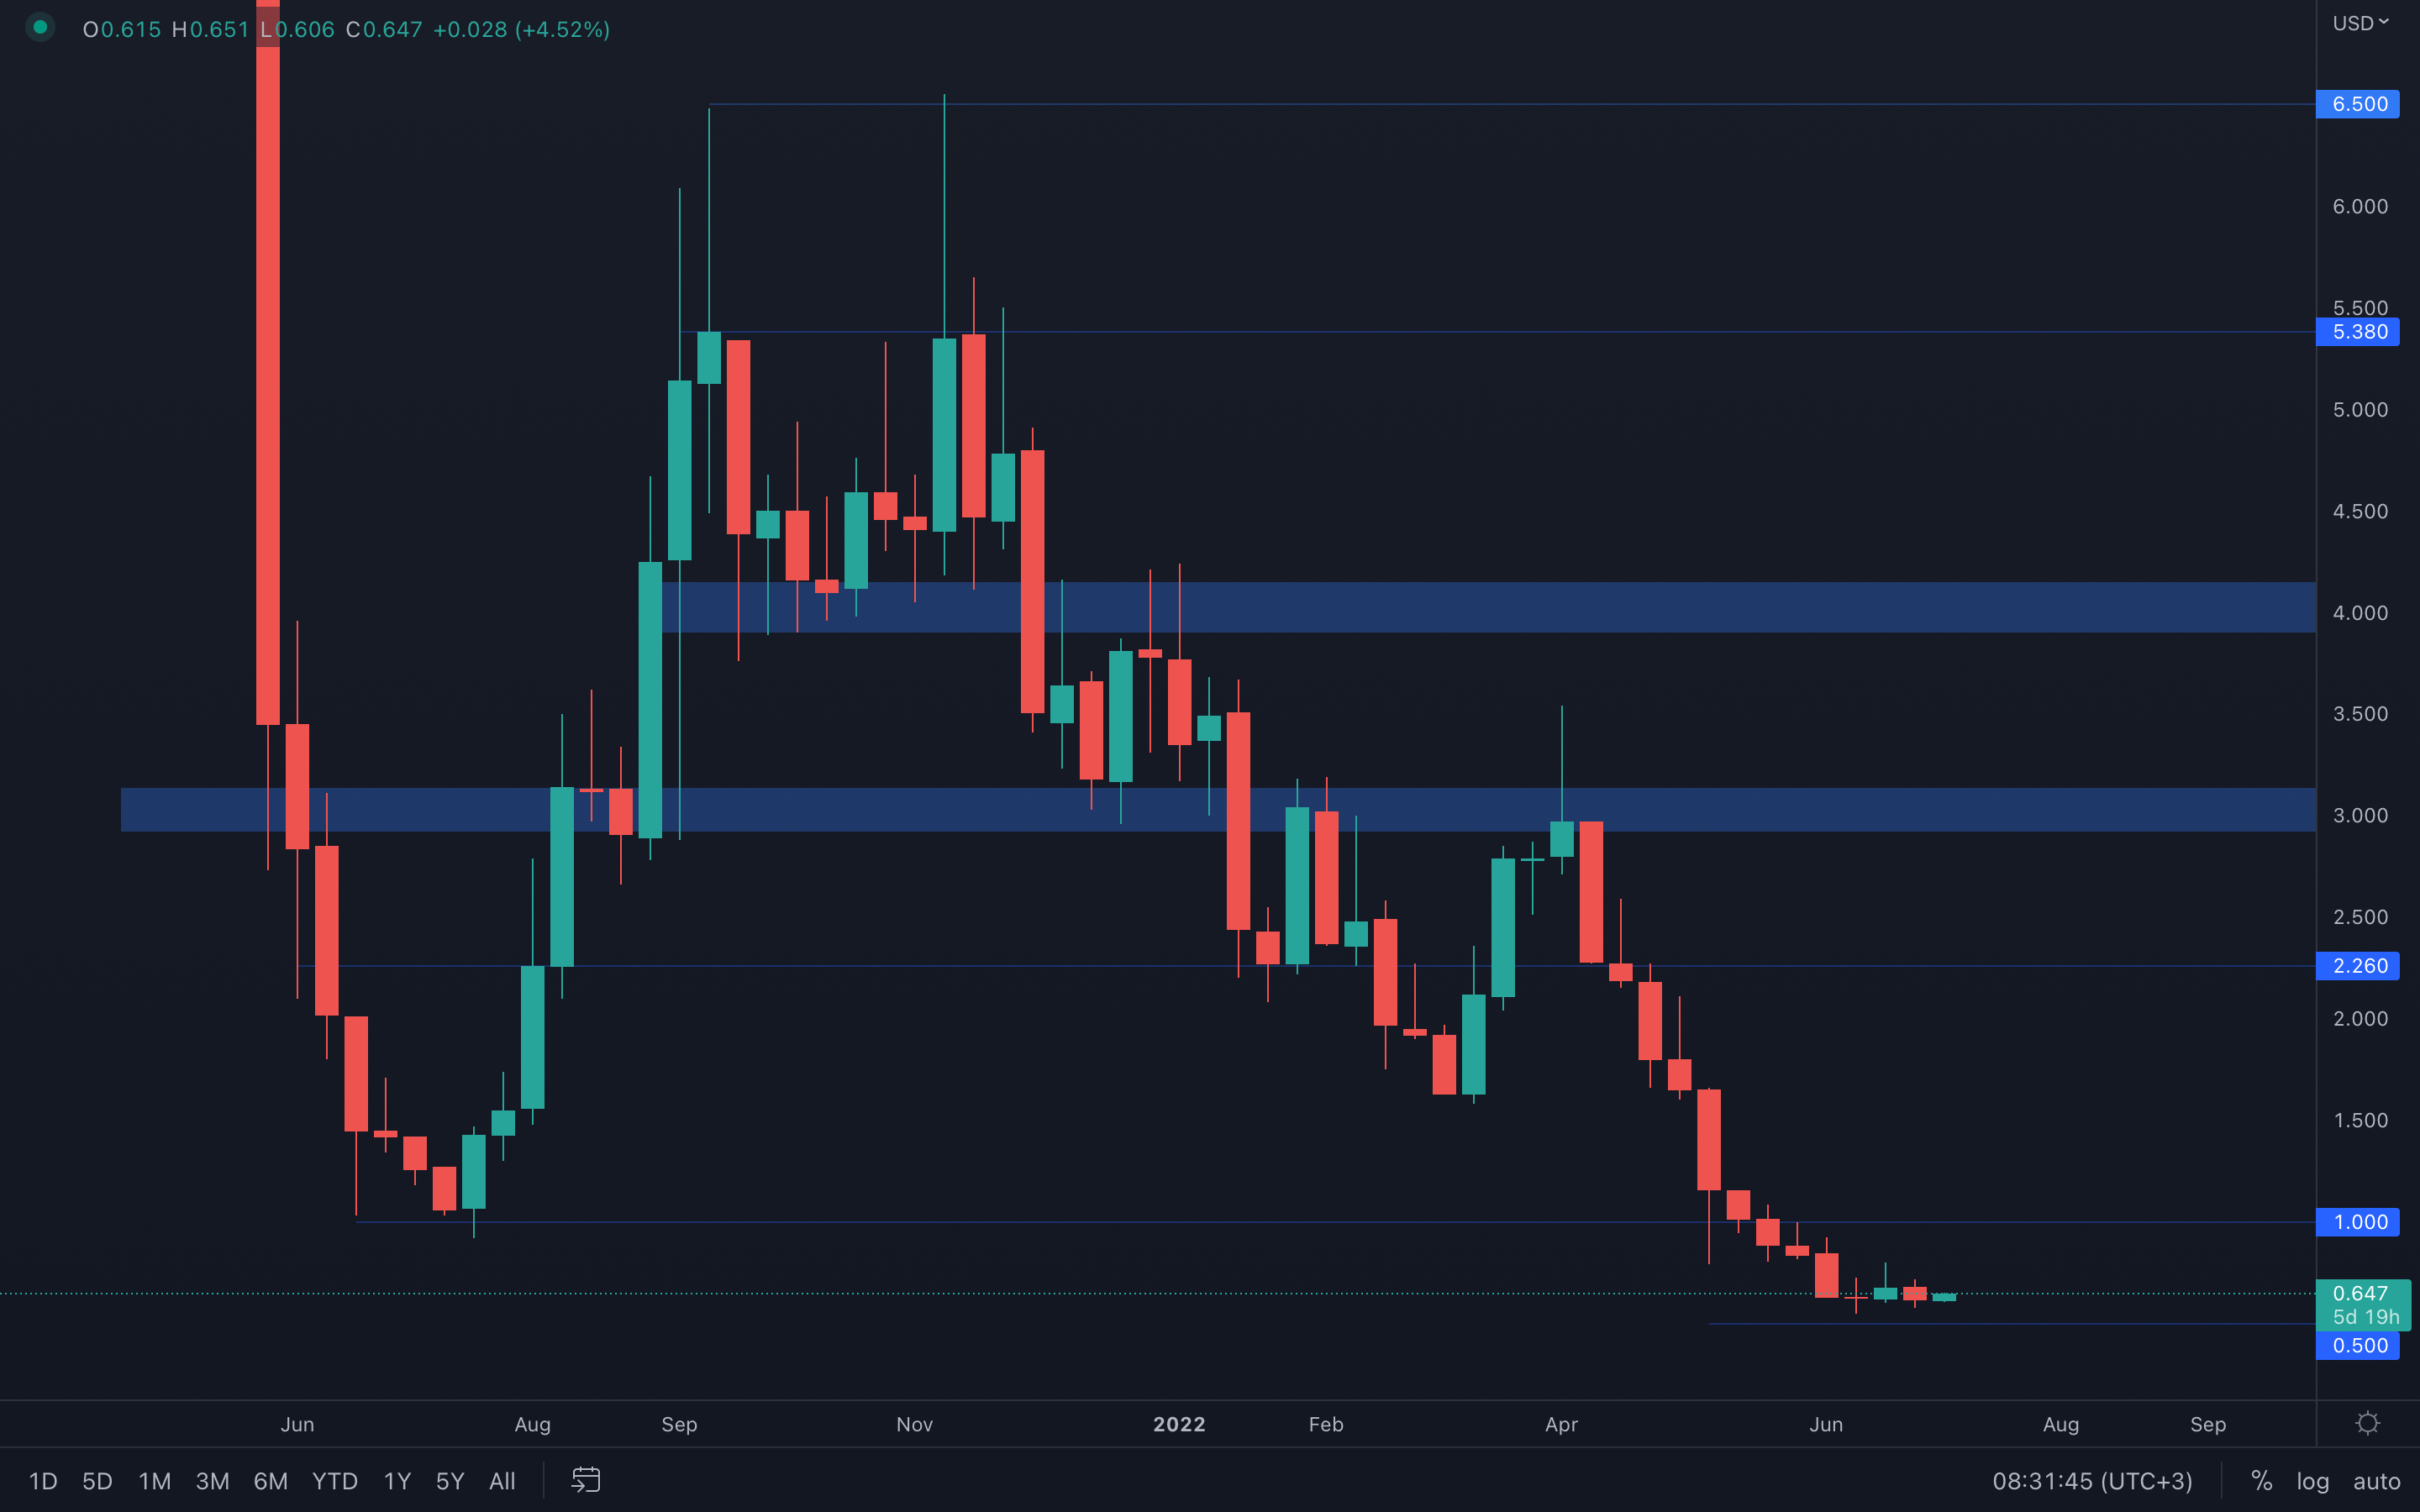 May not look like it from this perspective, but MINA did register a bearish engulfing candle last week, which implies that a test of its $0.50 psychological level might be coming soon. Only a weekly closure above $0.68 will invalidate this scenario and confirm further downside to its $1 resistance level.
dYdX
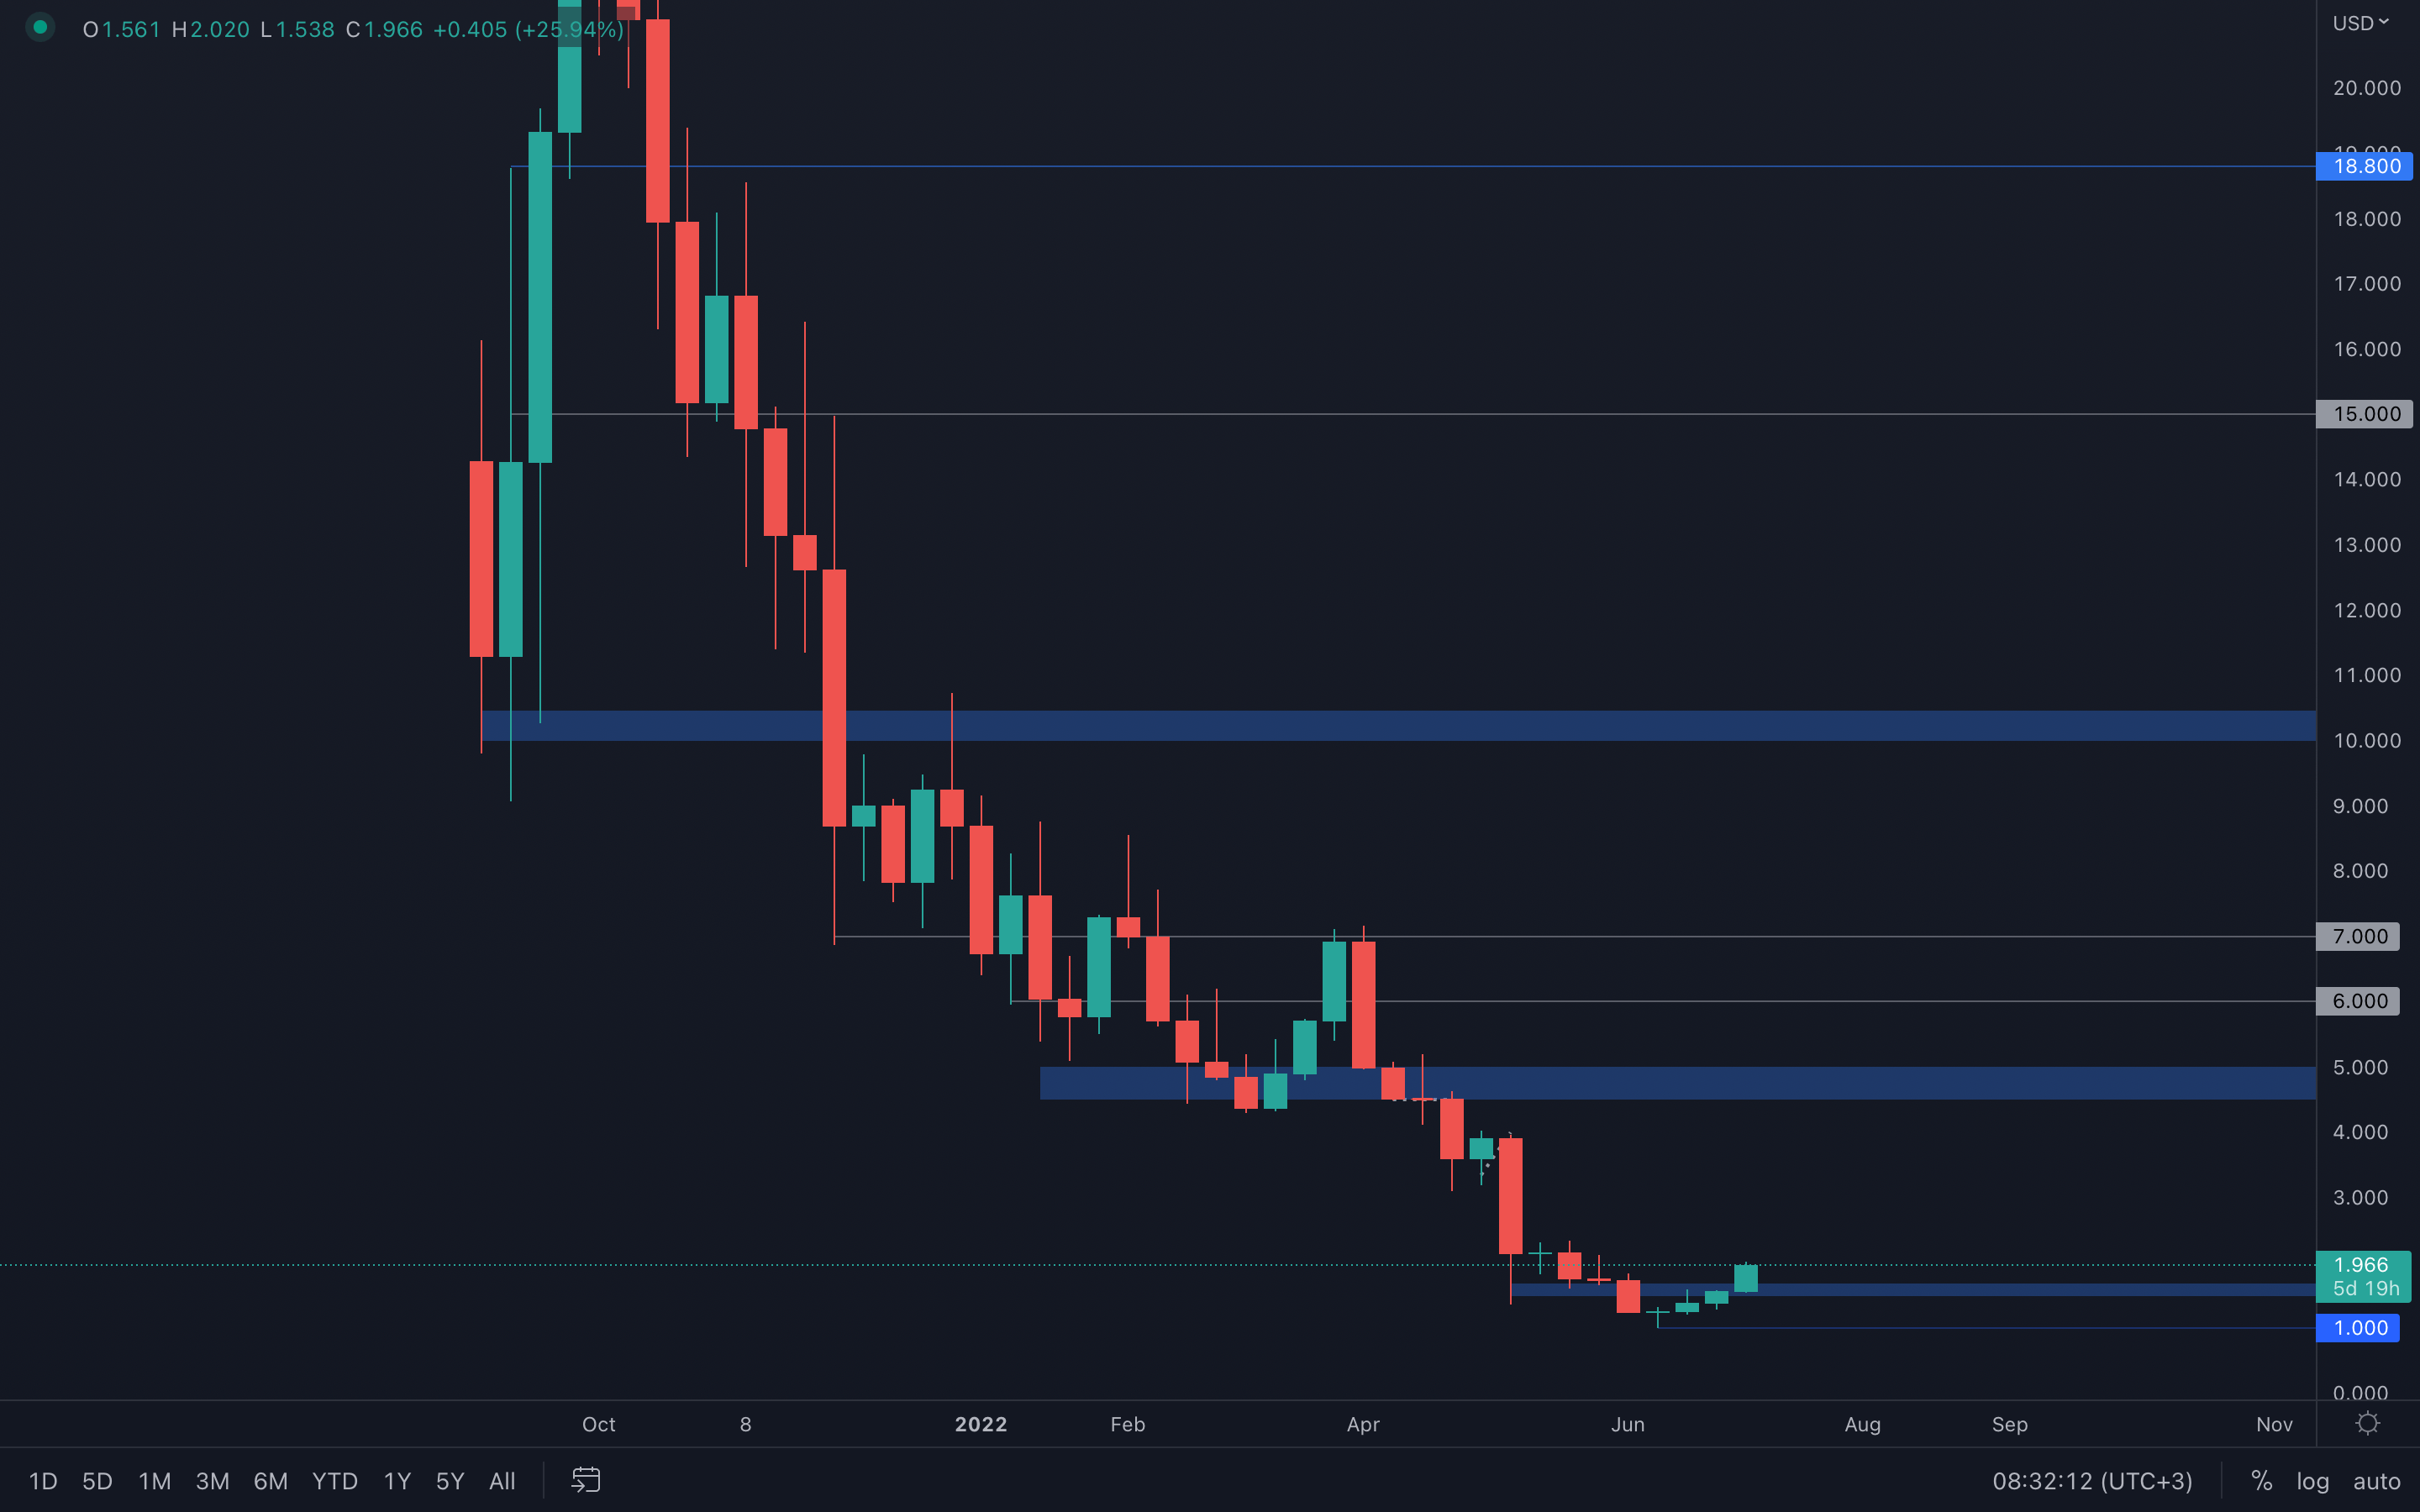 Probably the best performing asset in the last few weeks. After perfectly testing its $1 level, dYdX, backed by decent volume, has managed to double in value over the course of 16 days. However, even if its volume has increased compared to previous weeks, it has been decreasing for four weeks straight, implying that buying pressure might soon come to an end. Because dYdX managed to reclaim its $1.5 level, this has become our closest area of interest which will most likely be tested in the near future, as buying pressure is slowly starting to exhaust.
Summary
At this moment in time, many of the key on-chain indicators are signalling that Bitcoin and Ether are very close to a bear market bottom (assuming they haven’t already bottomed). However, the macro still provides some uncertainty, but perhaps the picture is becoming clearer as long as inflation can begin to come down in the coming months. This will allow the FED to ease off on their aggressive tightening cycle, and risk assets may begin to catch a bid.With most of the above finding themselves at major support levels, the possibilities of our local bottom already being set are certainly there. That, however, does not imply prices are going to sky-rocket, but actually the opposite. Even if somehow prices manage to rise, the rise will be short-lived due to the uncertain macro conditions we're dealing with. Always trade with caution and invest wisely, otherwise you'll end up right back where you started.


