Save 23% ($351) & Get a Free 1-1 Call with our Team ⏰ : 0d 2h 59m 44s

Disclaimer: Not financial nor investment advice. You are responsible for any capital-related decisions you make, and only you are accountable for the results.
Macro
Over the last few weeks, there has been a pivot in the market from inflation fears to now recession fears. Inflationary fears have seen rates be raised considerably in order to destroy demand and in turn, hopefully, bring down inflation. A raising of rates sees investors move out of risk assets (investors sell crypto) and move into “safer” assets such as Bonds, although Bonds have also performed poorly in recent months (bar the last few weeks). In the last few weeks, Bonds have managed to move up slightly as expectations of a recession have increased whilst 1-year inflation expectations have decreased, meaning Bonds have become more attractive. However, with Wednesday's (13/07/2022) inflation print looming, a high print is expected and this will likely reinforce the market’s view that inflation is still the main issue. This may then see asset prices fall slightly, retesting the lows or possibly creating new lows.TLDR
- On Wednesday (13/07/2022), there is a new inflation print. This may spark some volatility in the markets, particularly to the downside if the number is higher than expected.
- There have been large outflows of coins from Exchanges over the past few weeks, however, this is more likely due to users opting to move old coins they simply left on Exchanges to cold storage, rather than a signal that levels of accumulation have drastically increased.
- The most profitable wallet cohort is still decreasing in terms of overall wallet numbers, yet the smallest wallets are increasing in number. The most profitable are still not comfortable risking back-on.
- Network activity is down trending and suggesting that most users who flocked in over the past 2 years have left the space.
- Mining hash rate and difficulty have begun to drop. This indicates inefficient miners are capitulating, a typical sign of late-stage bear markets.
Total Market Cap
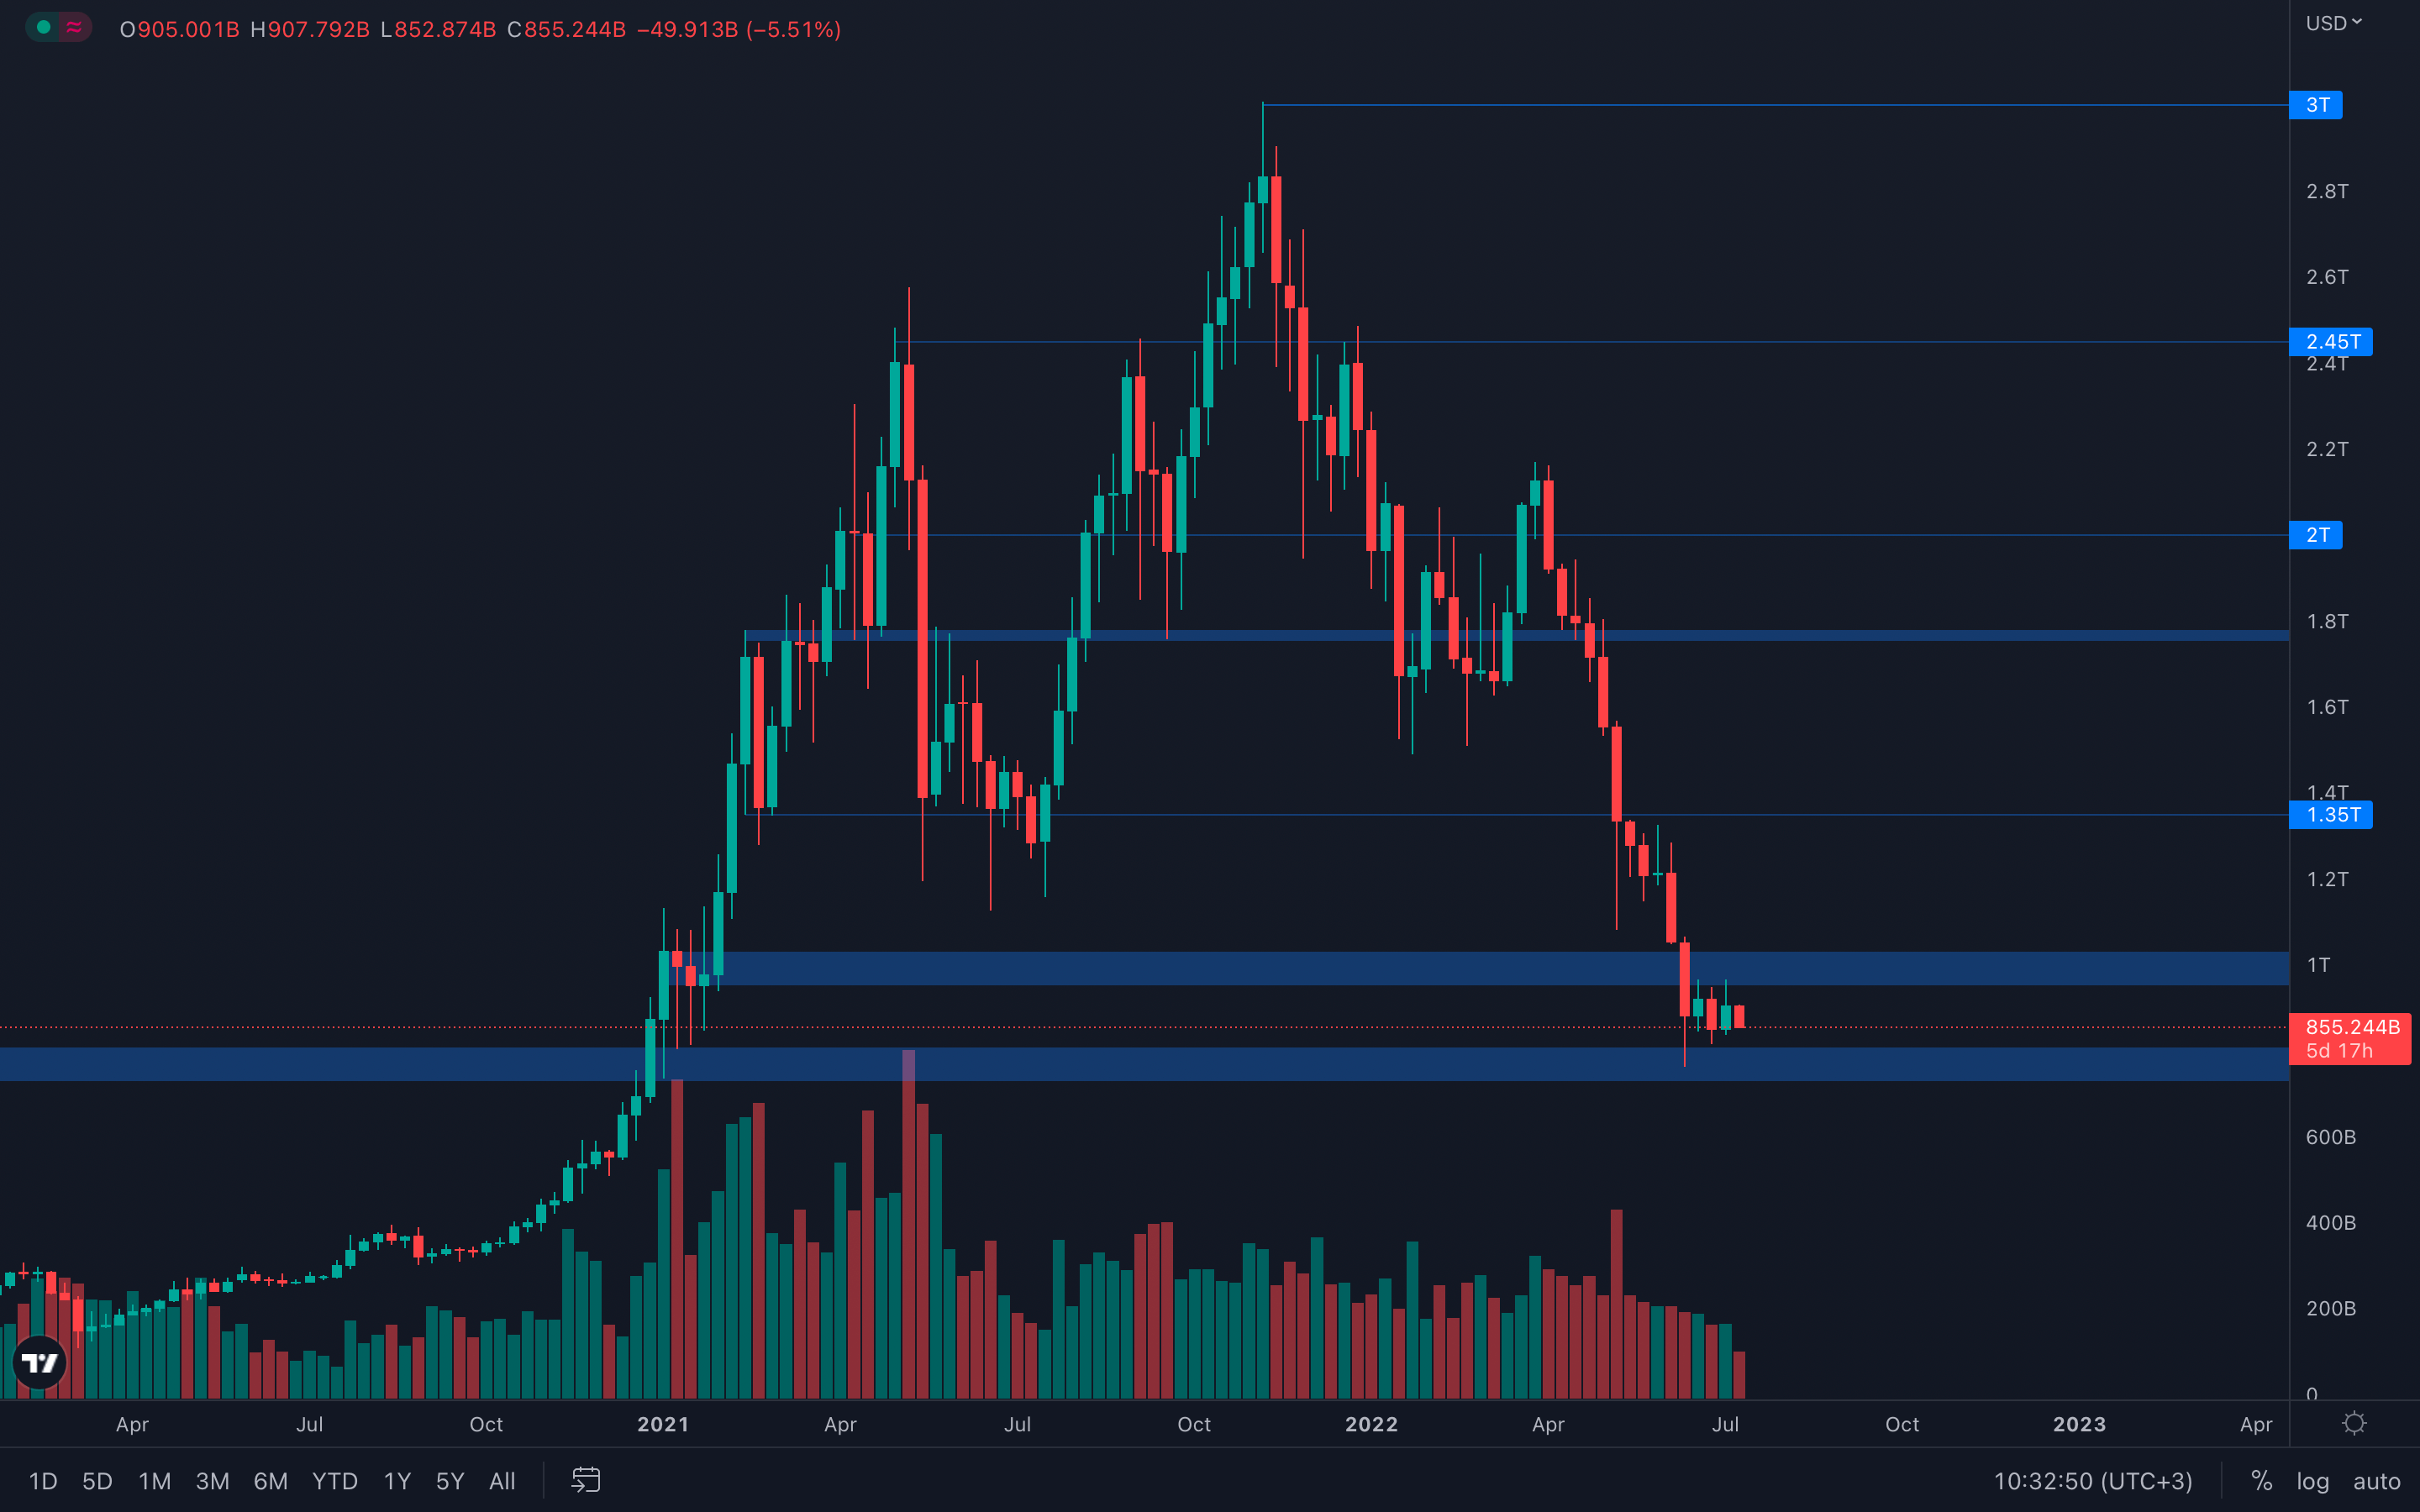 Last week was somewhat surprising - we saw buyers actually stepping in after weeks of constant selling pressure, but the buying pressure came to an end just before the weekly closure. If we were to close above $21.5k, then we would've had a bullish engulfing candle on the weekly timeframe. Unfortunately, that didn't happen, and sellers have taken control once again. As bulls haven't been able to take a stand, it's safe to assume the Total Market Cap will test $800B this week, the top part of the $700B - $800B range. Until the $1T psychological level is reclaimed on the weekly timeframe, no upside movement can be expected.
Altcoins Market Cap
 Not surprising at all, the Altcoins Market Cap also could've closed a bullish engulfing candle last week, but was unable to. Price already came back to test the top part of the $475B - $450B range, and it's likely we'll be seeing a $450B test this week if the Total Market Cap also behaves as expected. An important thing to mention here is that even if either the Total Market Cap or the Altcoins Market Cap do test their expected levels, the indexes still remain above key support levels. Whether those levels fail to hold or form a local bottom is not something we can predict, but only wait for and react to.
Bitcoin - Technical & On-Chain Analysis
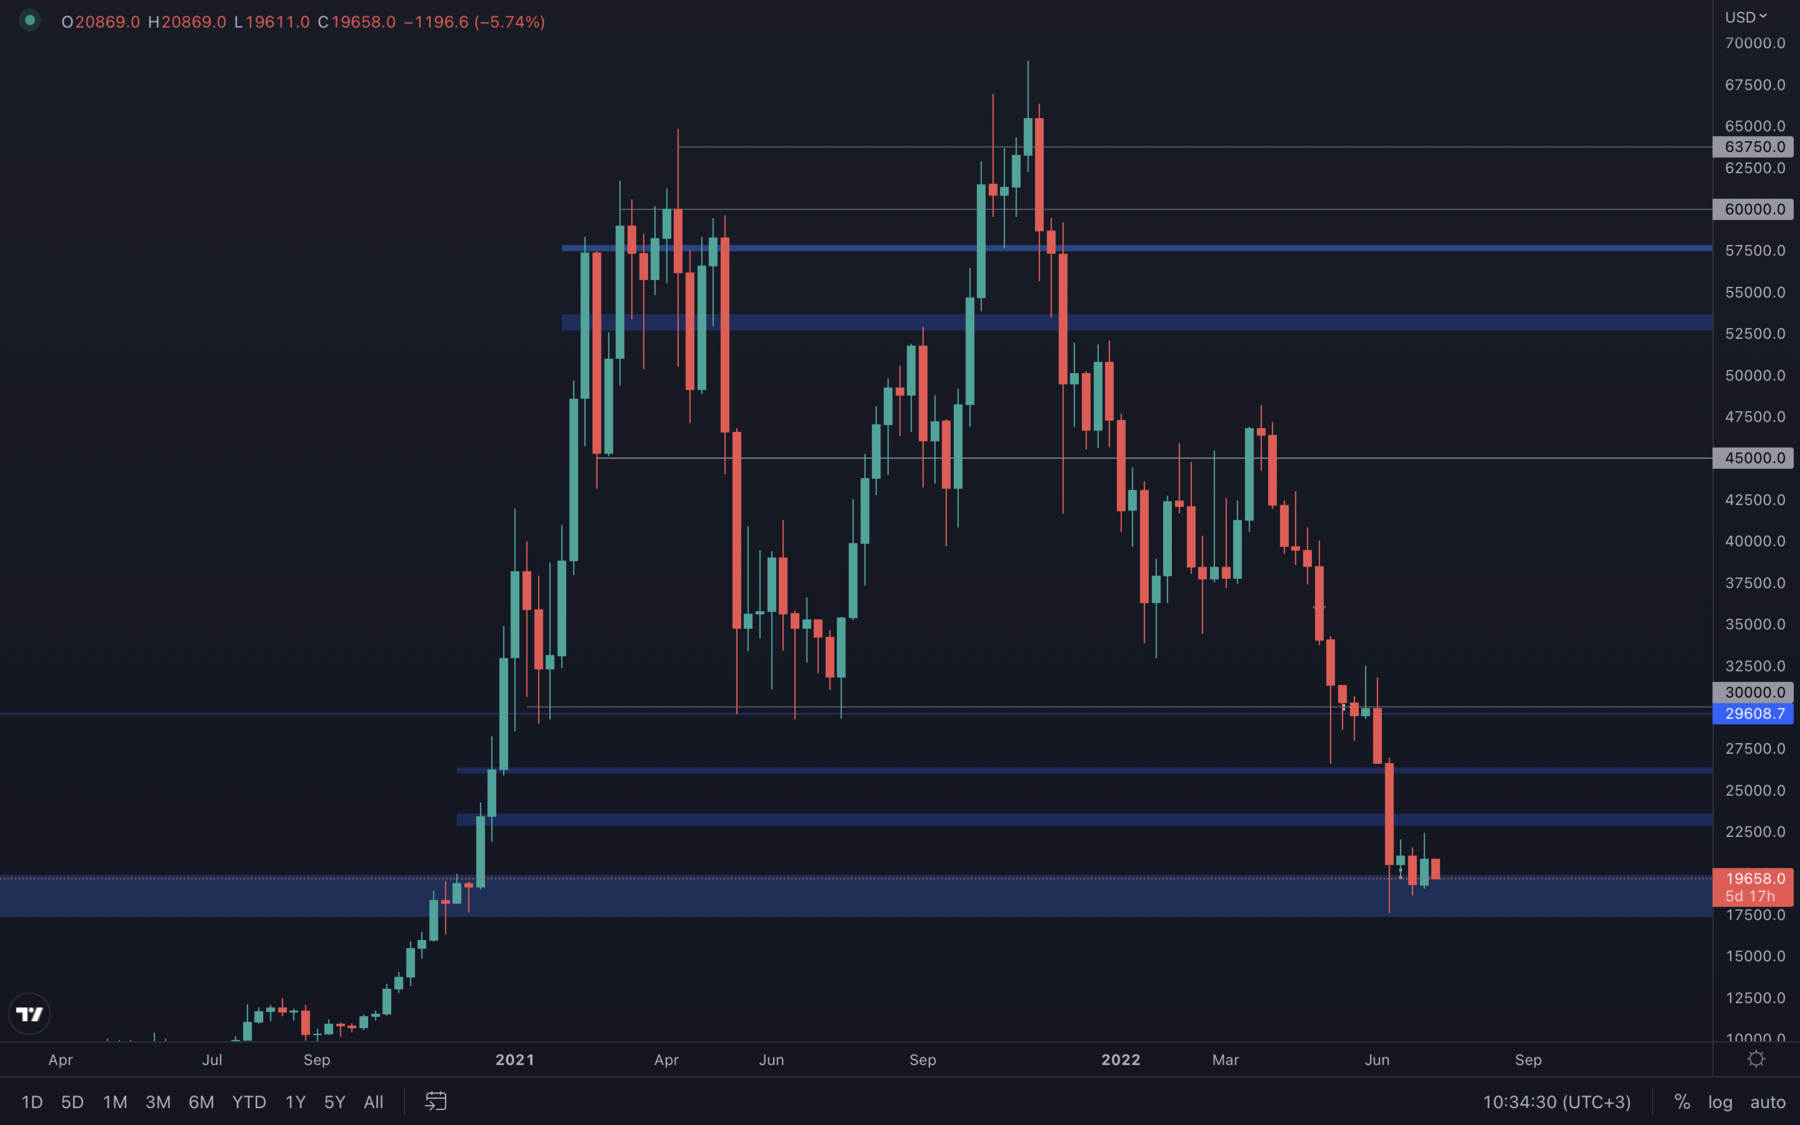
This week, we will place a greater focus on Bitcoin rather than Ether, simply due to the majority of the on-chain coverage of this report being on general network activity and mining. Miner capitulation is a key component of late-stage bear markets, so hence we will investigate this today in more detail.
Firstly, let's dive into the technicals - last week, Bitcoin experienced a significant increase in value, an ~18% increase in a matter of five days. Bulls managed to slightly regain control, but the selling pressure leveled up just before the weekly closure, resulting in an indecisive situation. Is the buying pressure we've experienced last week already gone? Will the sellers continue to move prices down? These are questions that require answers, answers we'll learn this week, most likely after the new inflation print tomorrow. We recommend staying off the markets until that happens, as volatility can increase by a significant amount, especially to the downside if the number is higher than expected.
Based on the above alone, it is likely we will continue to descend back to $17.5k, the bottom part of the $20k - $17.5k range. This is the most crucial level for Bitcoin, as it also acts as the 2017 all-time high.
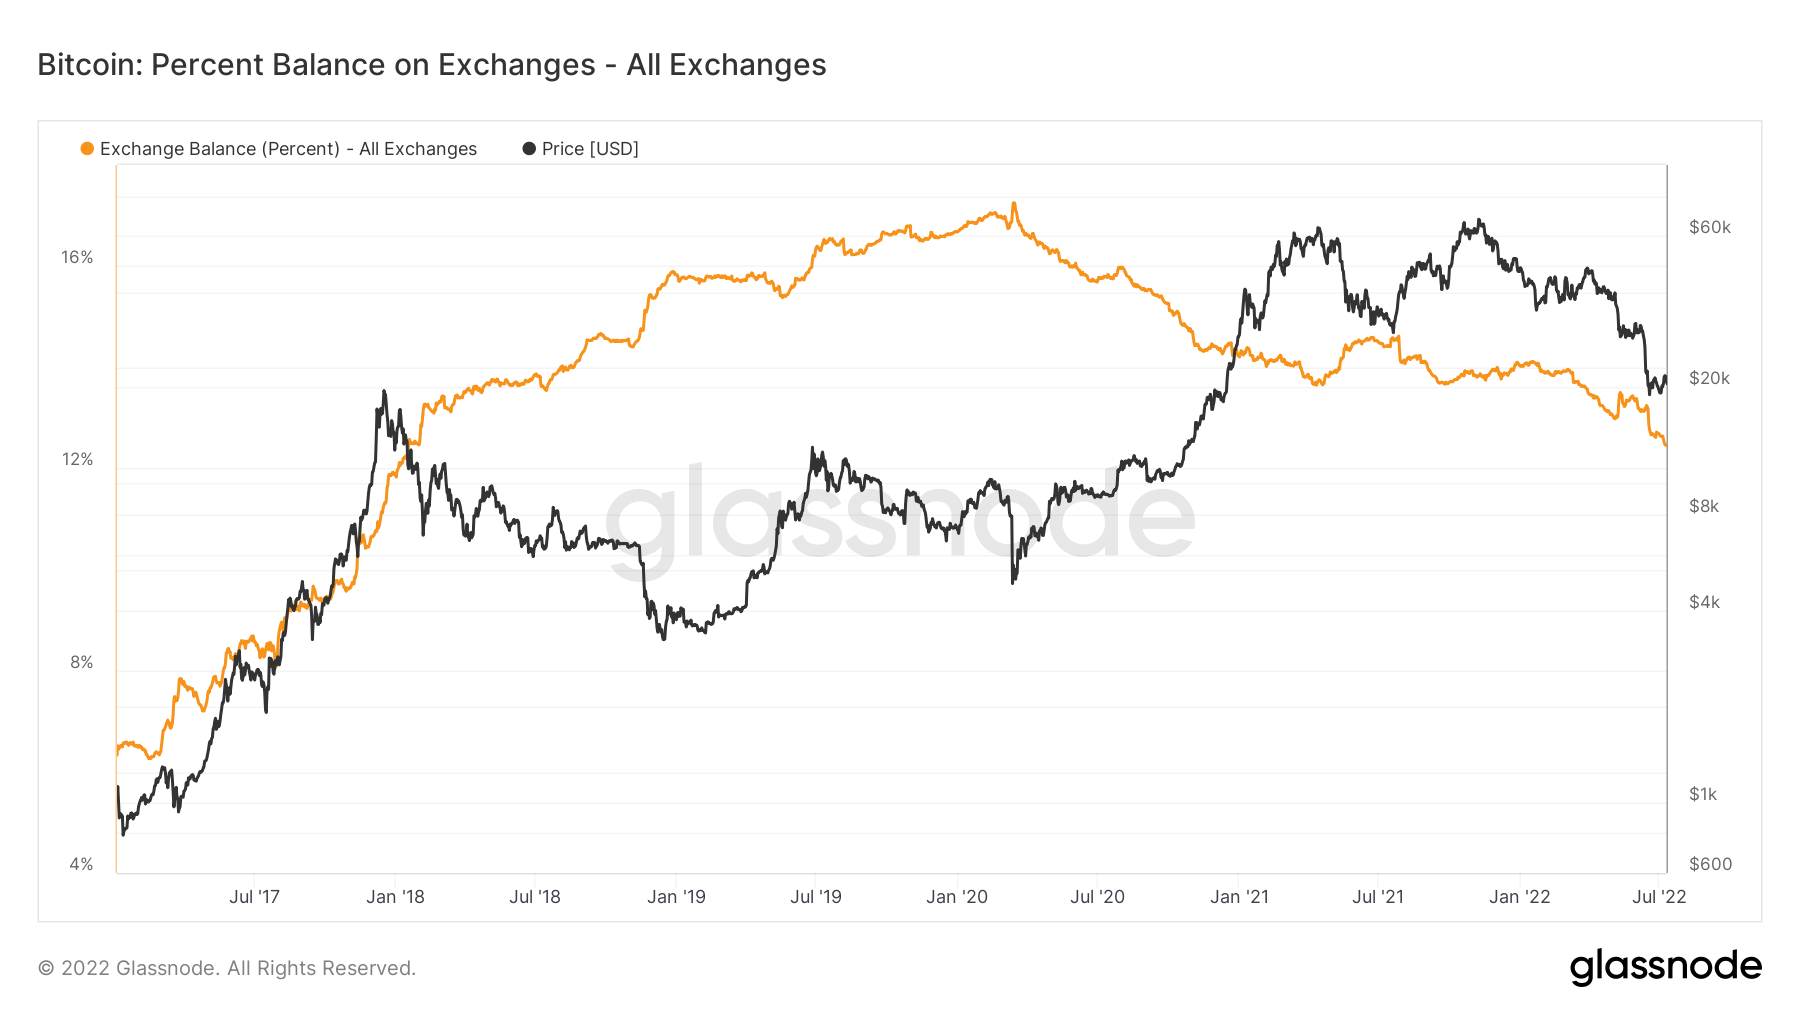
Metric 1 – Exchange Balances
We can see in the below graph that the percent of all coins held on Exchanges has been in the majority, decreasing since March 2020 (the Covid low). All in all, this is considered bullish, however, it’s important to understand more deeply what the flows of coins are. We will dive into this further below.
Bitcoin – Exchange Balance (Percent)
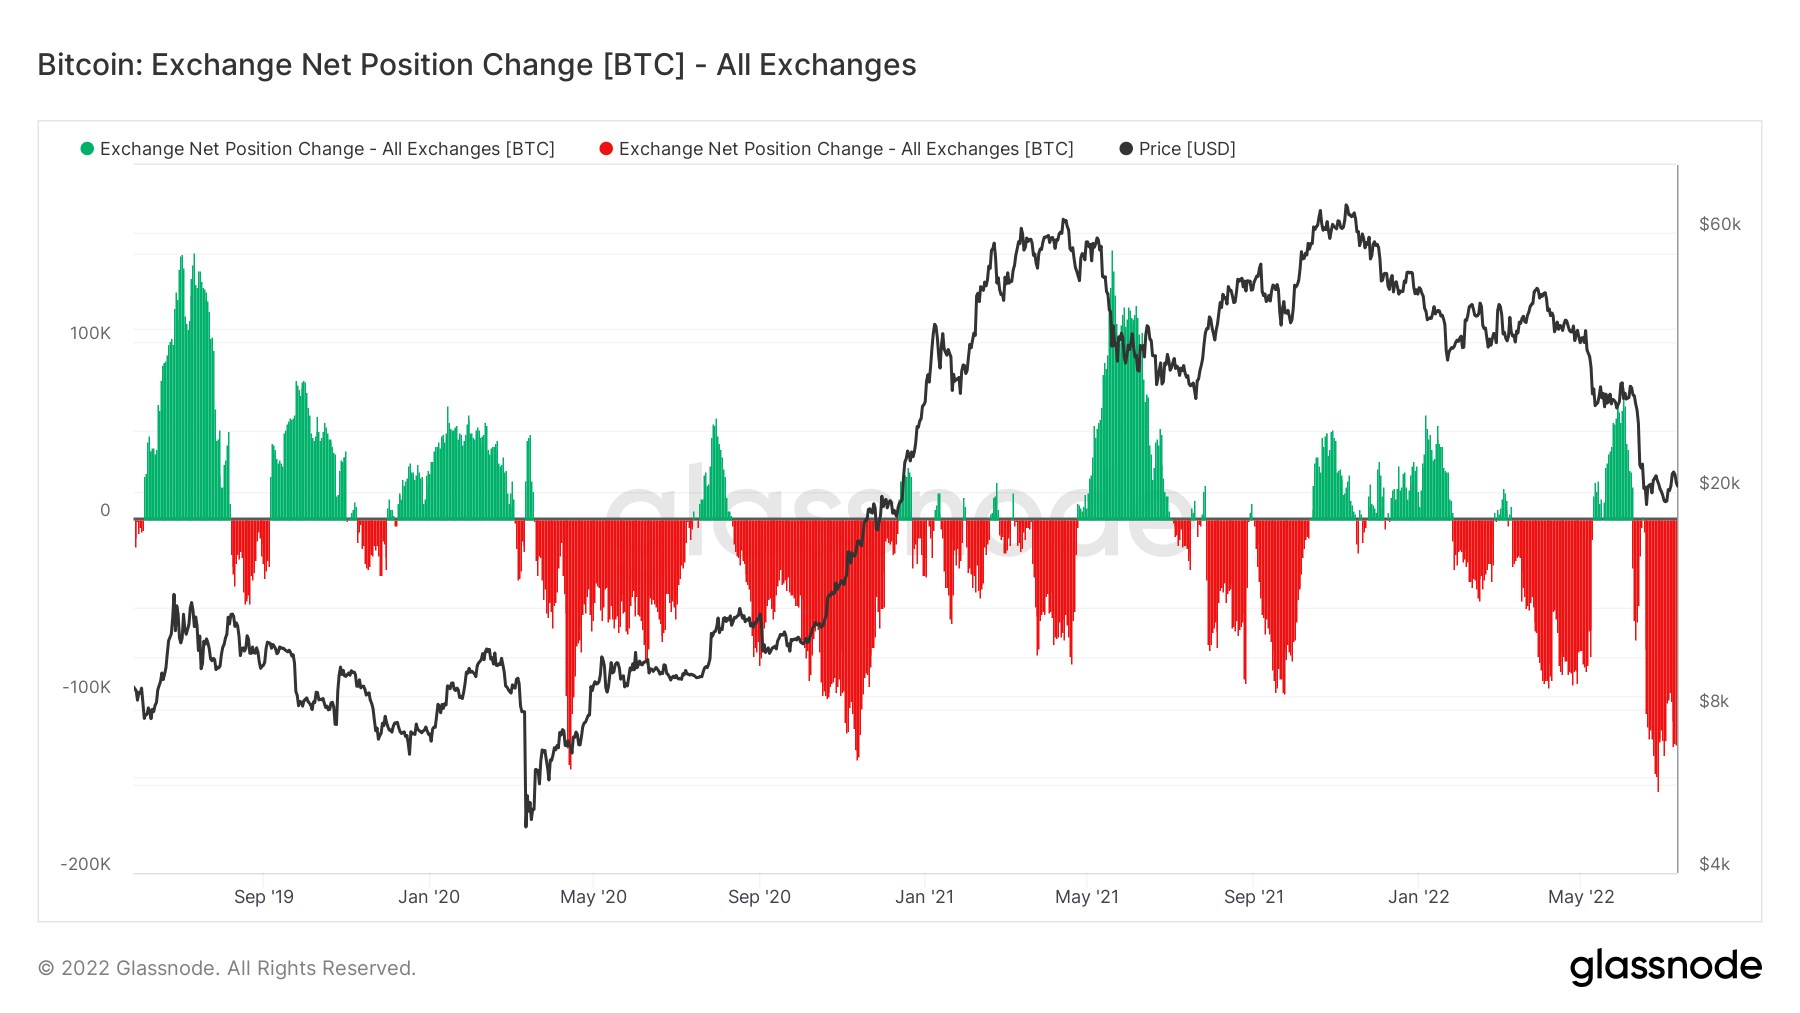
If we now look at the Exchange Net Position Change, we can see huge outflows of coins from Exchanges. Again, this is considered extremely bullish as in previous periods of seeing this kind of outflows from Exchanges, we assume the buying on Exchanges is strong. However, this time, we’re seeing really weak volumes and we’re seeing a self-custody increase. What this suggests is that rather than investors buying coins and withdrawing them to cold storage wallets, investors have bought coins in the months and years prior to now, and they’re deciding to take custody of these coins themselves. Sam Bankman-Fried came out in the past week and suggested some Exchanges are actually insolvent since then we have seen investors flocked towards self-custody.
Bitcoin – Exchange Net Position Change
Metric 2 – Addresses
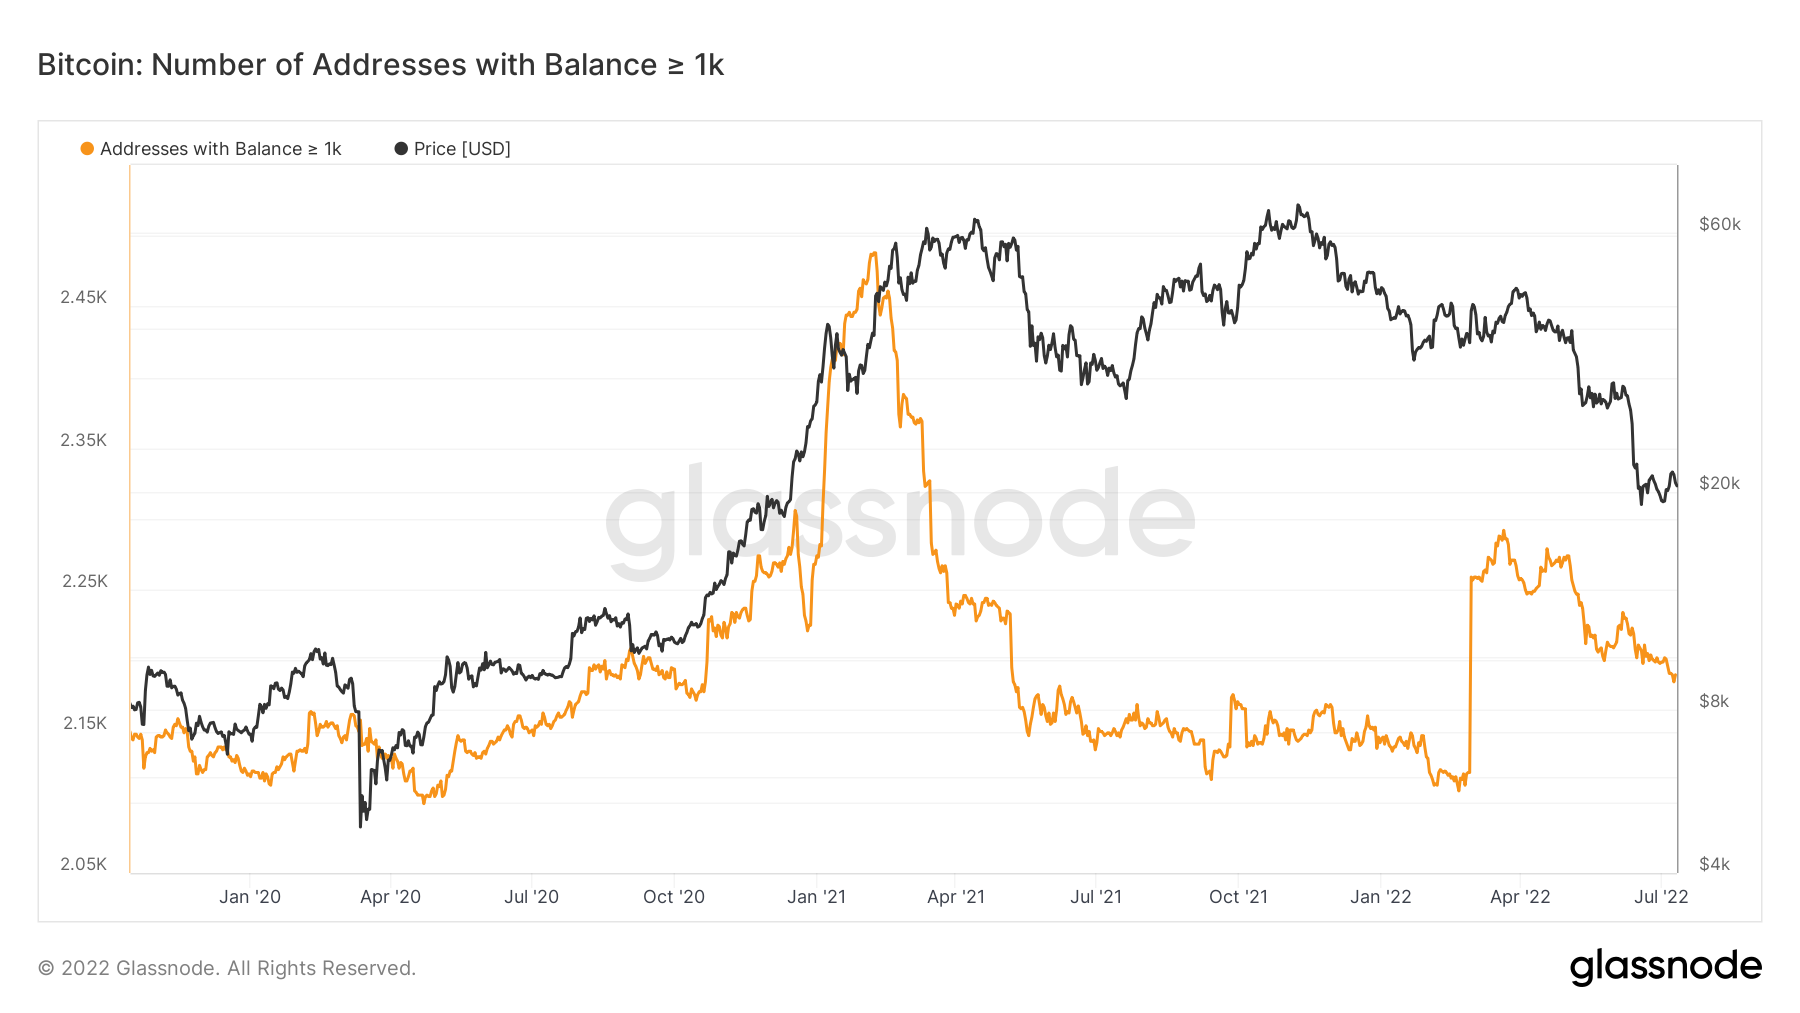
In order to solidify our above theory, we can look to the addresses to see if the Addresses with a Balance > 1,000 Bitcoin are beginning to add exposure. Historically, this is the best performing cohort so hence we try to emulate what they’re doing. We can see from the below that this cohort is continuing to decrease, meaning they are still a seller of coins rather than a buyer.
Bitcoin – Addresses with Balance > 1,000 Bitcoin
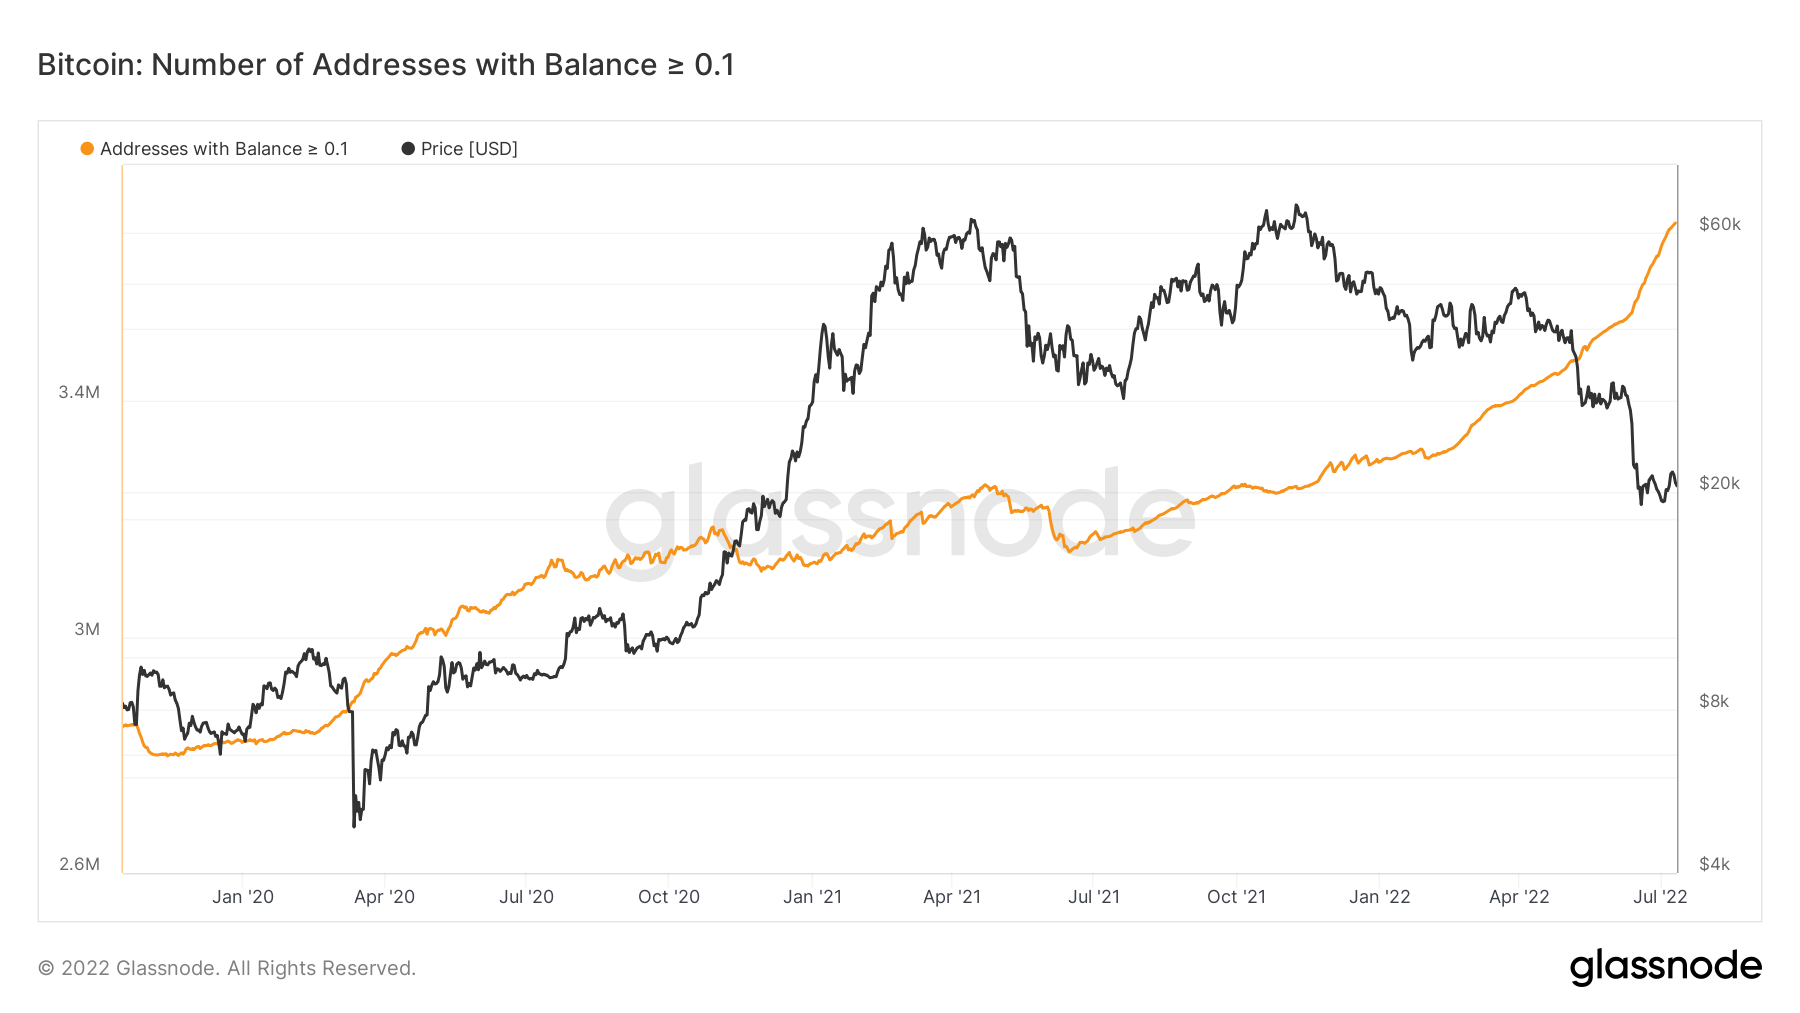
Bitcoin – Addresses with Balance > 0.1 Bitcoin
Metric 3 – Network Activity
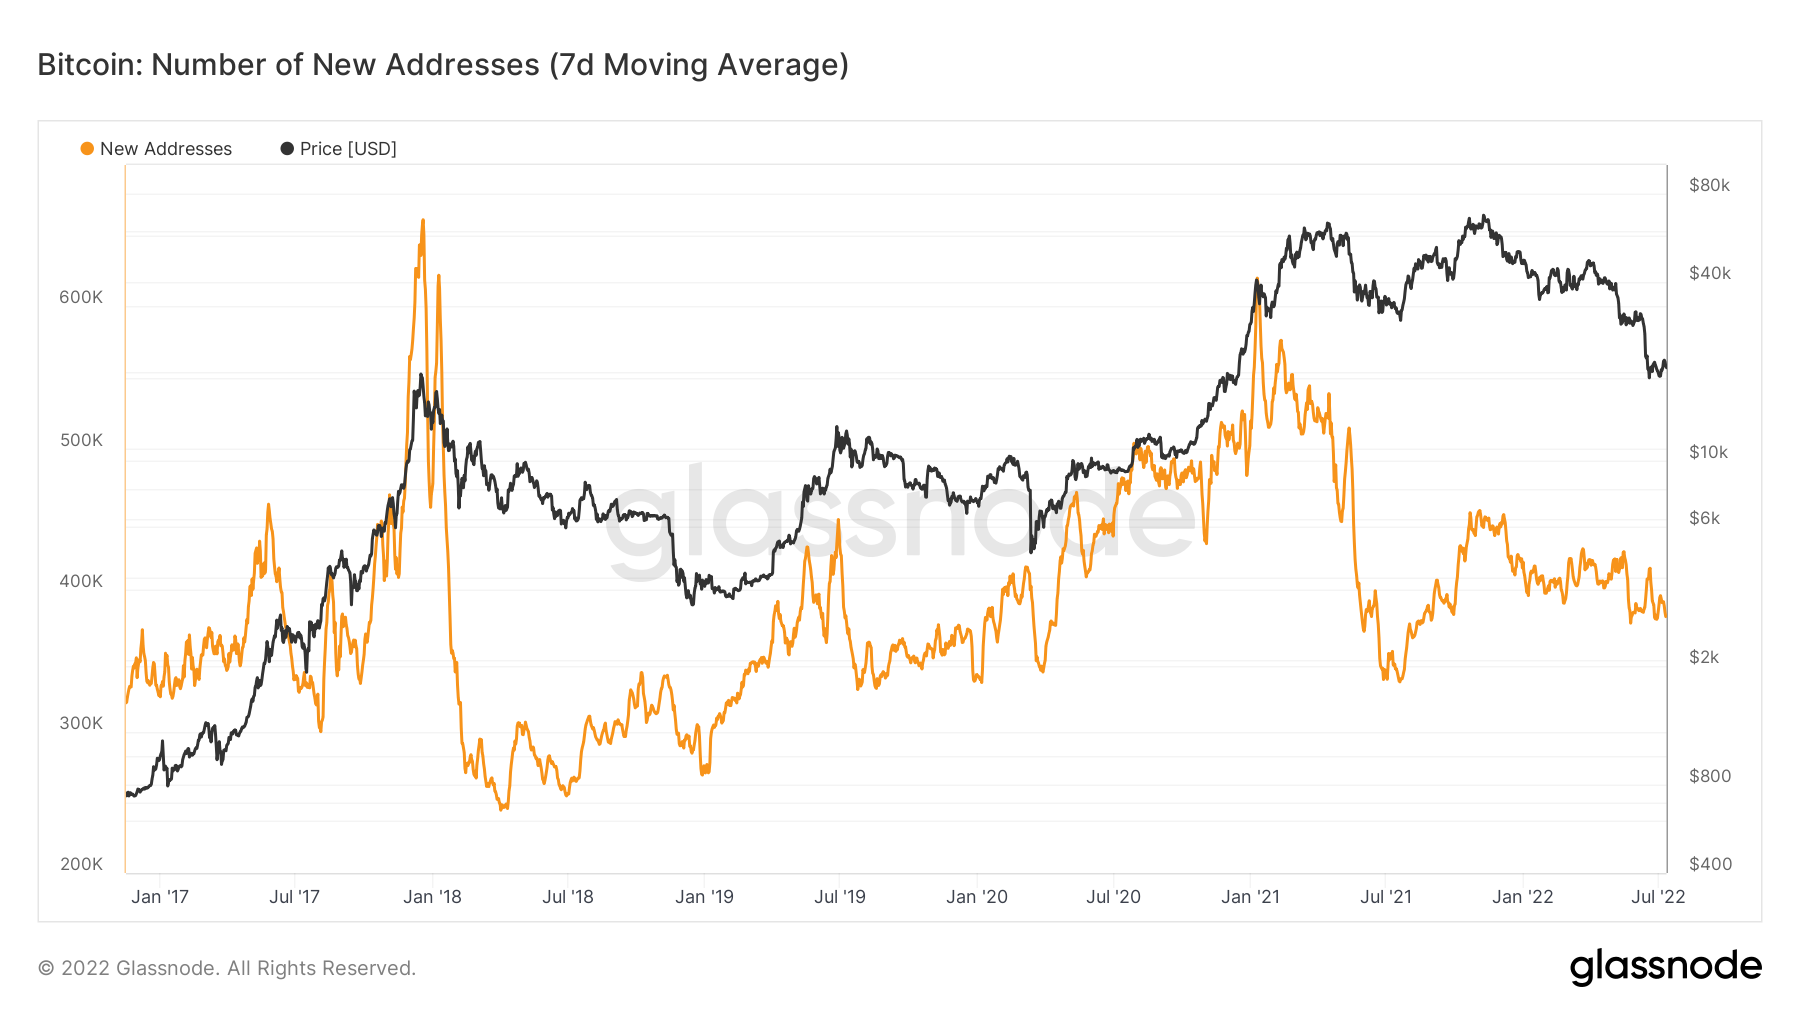
When we try to assess end-stage bear markets, we want to see many of the participants that flooded in during the bull run have now left due to decreasing prices (capitulating). For this we can look at two metrics; New Addresses and Active Addresses.
New Addresses
Active Addresses
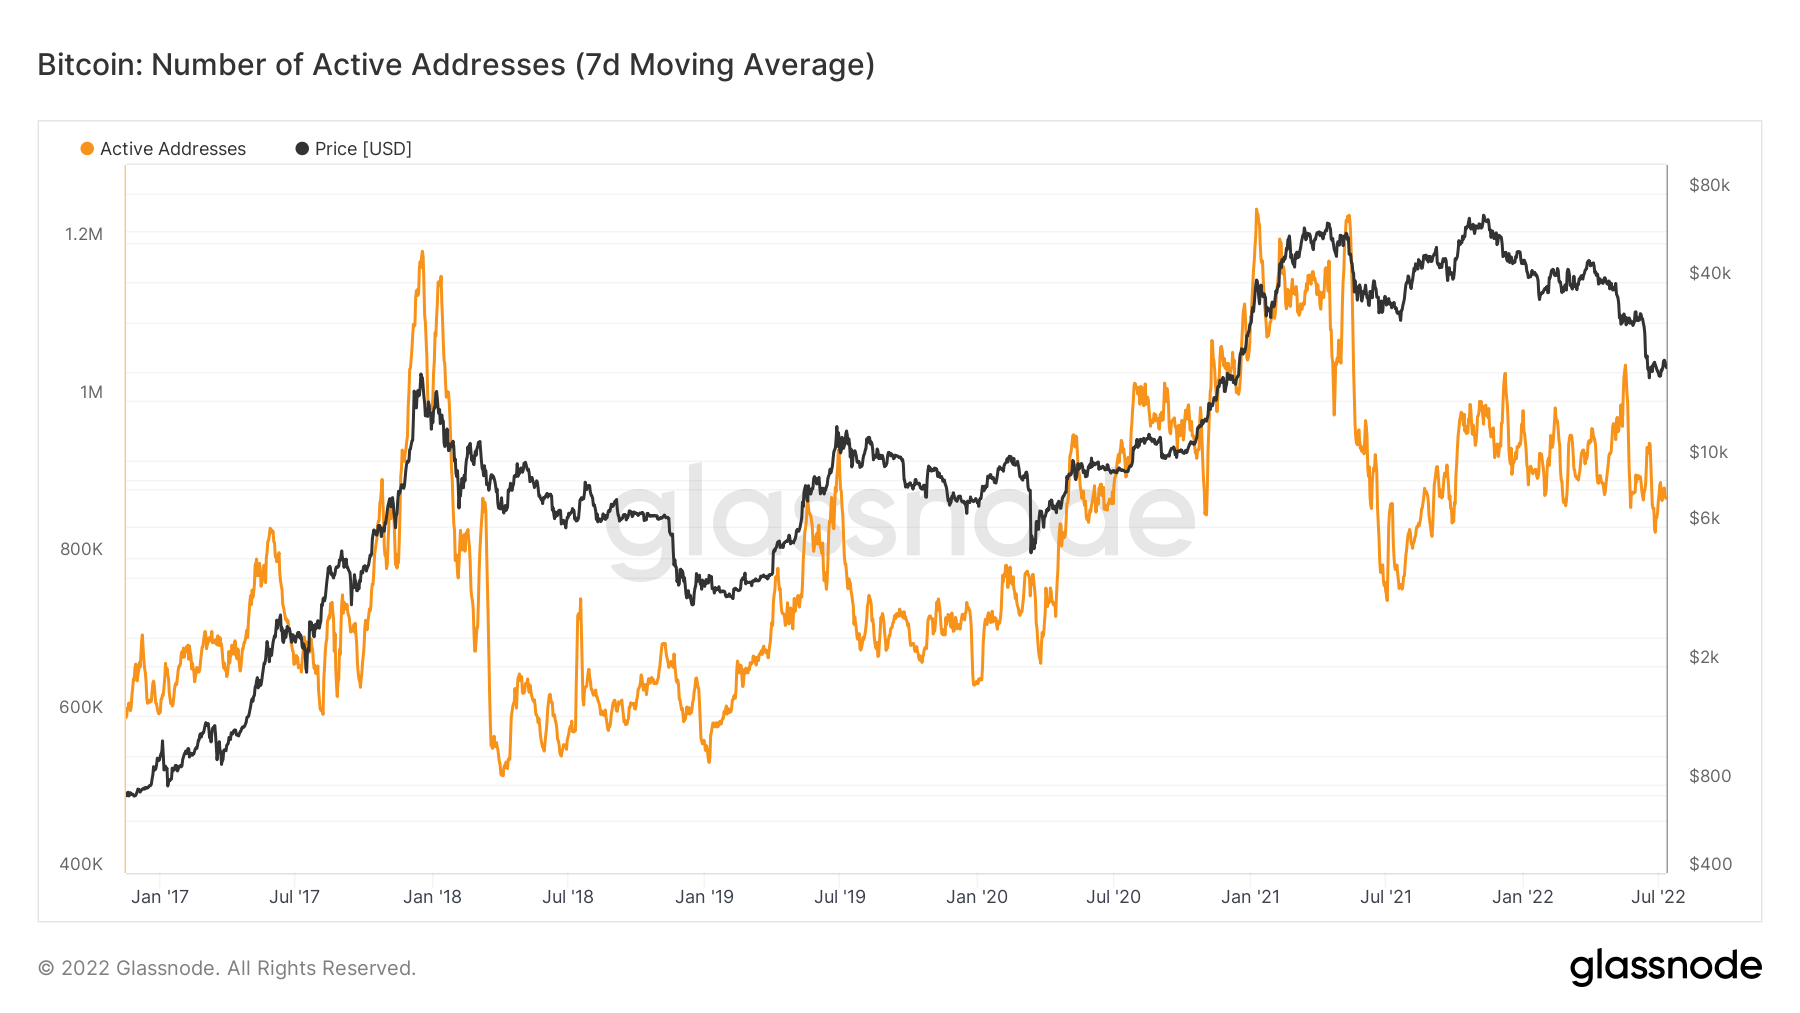
When we look at the above two graphs, we can see that in the long-term, there are higher lows. This indicates that new users join the space and stay in the space, of course, many floods out when prices decline but overall, adoption is growing. We can also see that both the Active Addresses and New Addresses have been trending lower. This is key to see in bear markets and this metric will likely continue to downtrend until a bottom in prices is found.
Metric 4 – Mining
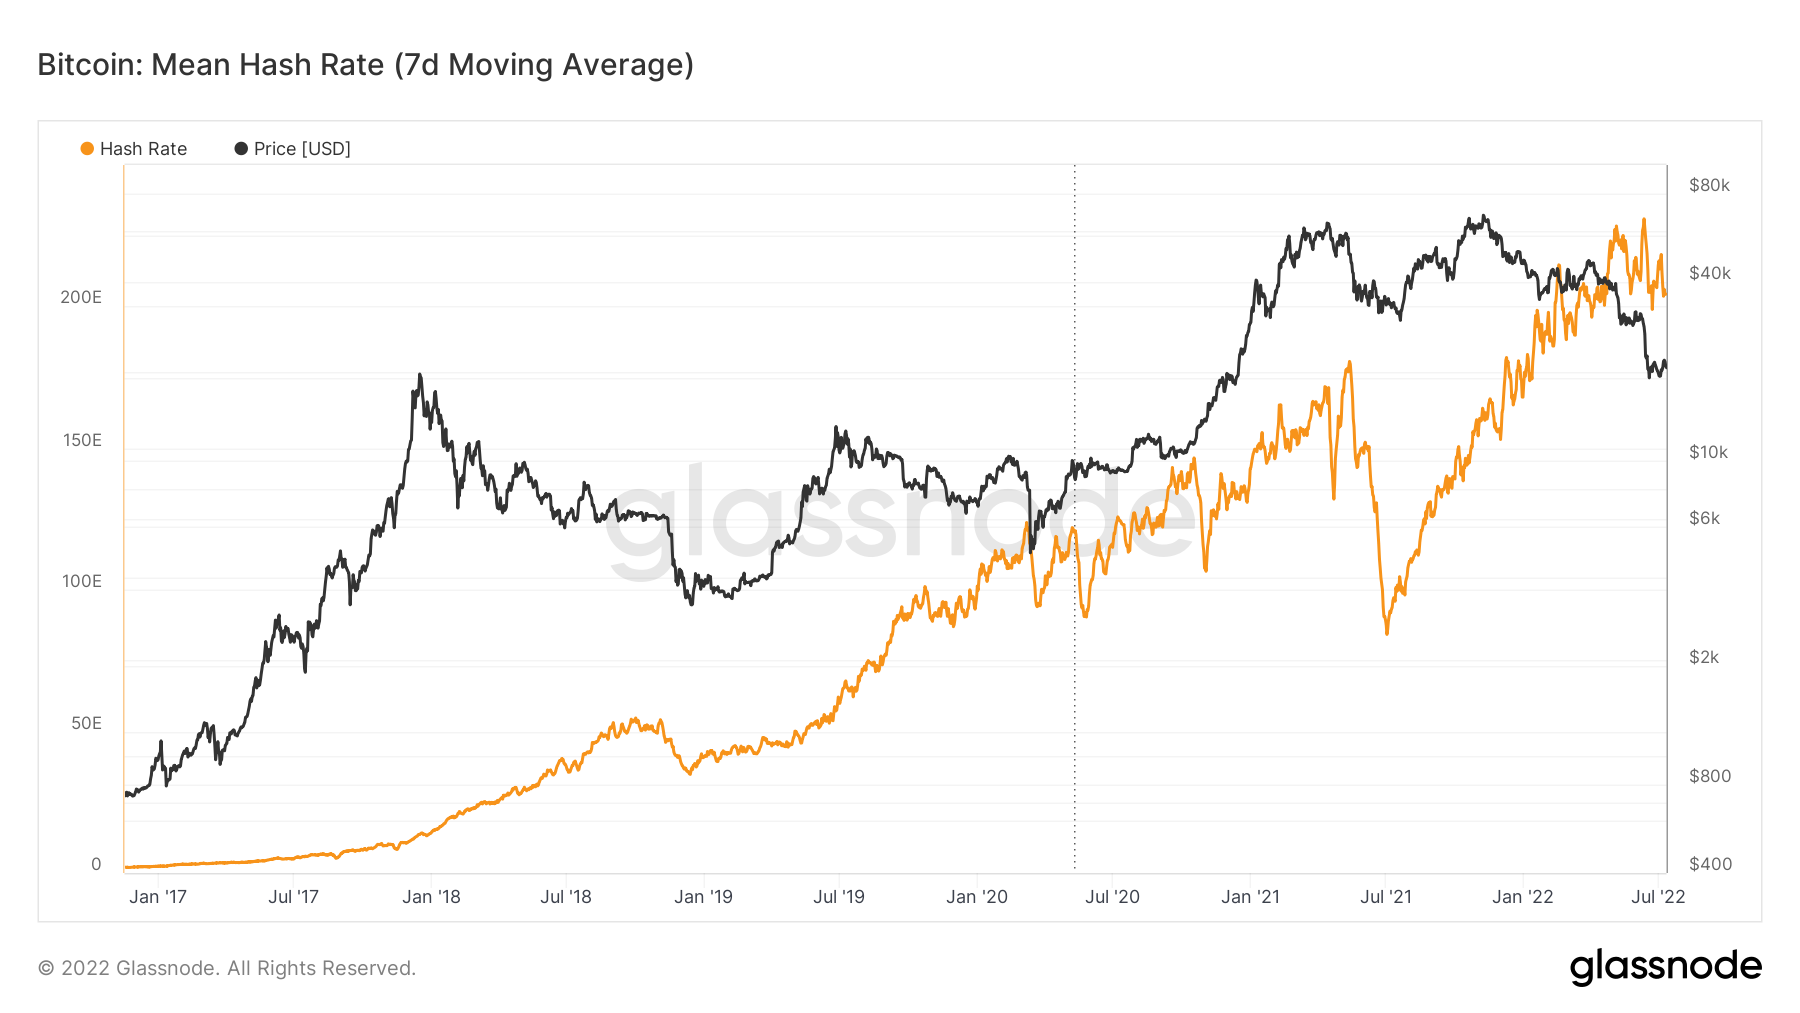
One of the last stages of a bear market is when inefficient miners capitulate. As the price goes down, inefficient miners (too high electricity costs for example) are no longer profitable and therefore switch off their machines. After all, what’s the point in mining Bitcoin if it costs more to produce than what it can be sold for? As inefficient miners switch off their rigs, the hash rate drops followed by mining difficulty. As this happens, efficient miners are rewarded with an increased reward for their work and therefore sell less of these rewards (sell-side pressure is eased). They then likely begin expanding by buying new ASICS (rigs) and once again hash rate increases along with mining difficulty, and the Bitcoin price usually follows (increases in price).
Bitcoin – Mean Hash Rate
Bitcoin – Difficulty
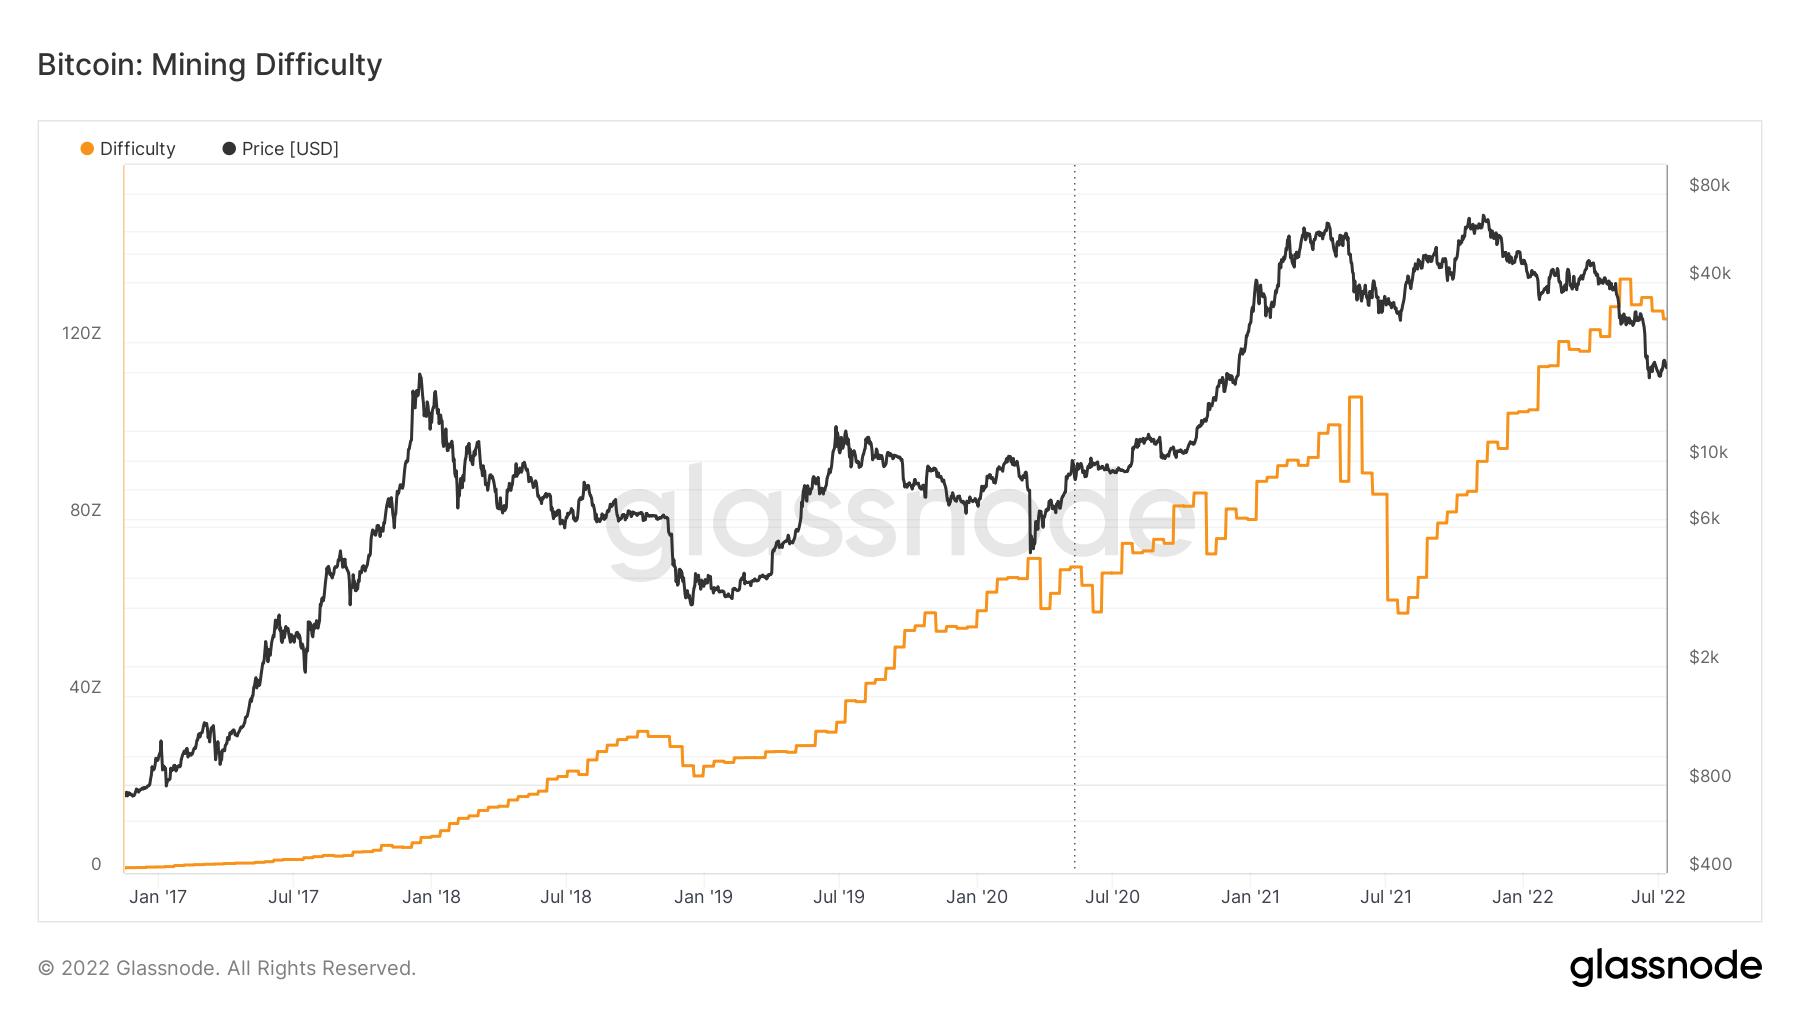
For the first time since the summer of 2021, we’re seeing the Mean Hash Rate and Difficulty decreasing. The summer of 2021 is almost classed as an anomaly as it was the great Miner Migration, where mining was banned in certain jurisdictions, and miners were forced to shut down. Once they relocated, hash rate and difficulty picked up again, hence we see severe declines and increases in this time period. Note; previous declines and increases (late-stage bear markets) have been more subtle, we’re now beginning to see the same subtle declines which would indicate that inefficient miners have been flushed out, and we’re now just waiting for the efficient miners to re-adjust and hash rate and difficulty to increase once again.
Ether
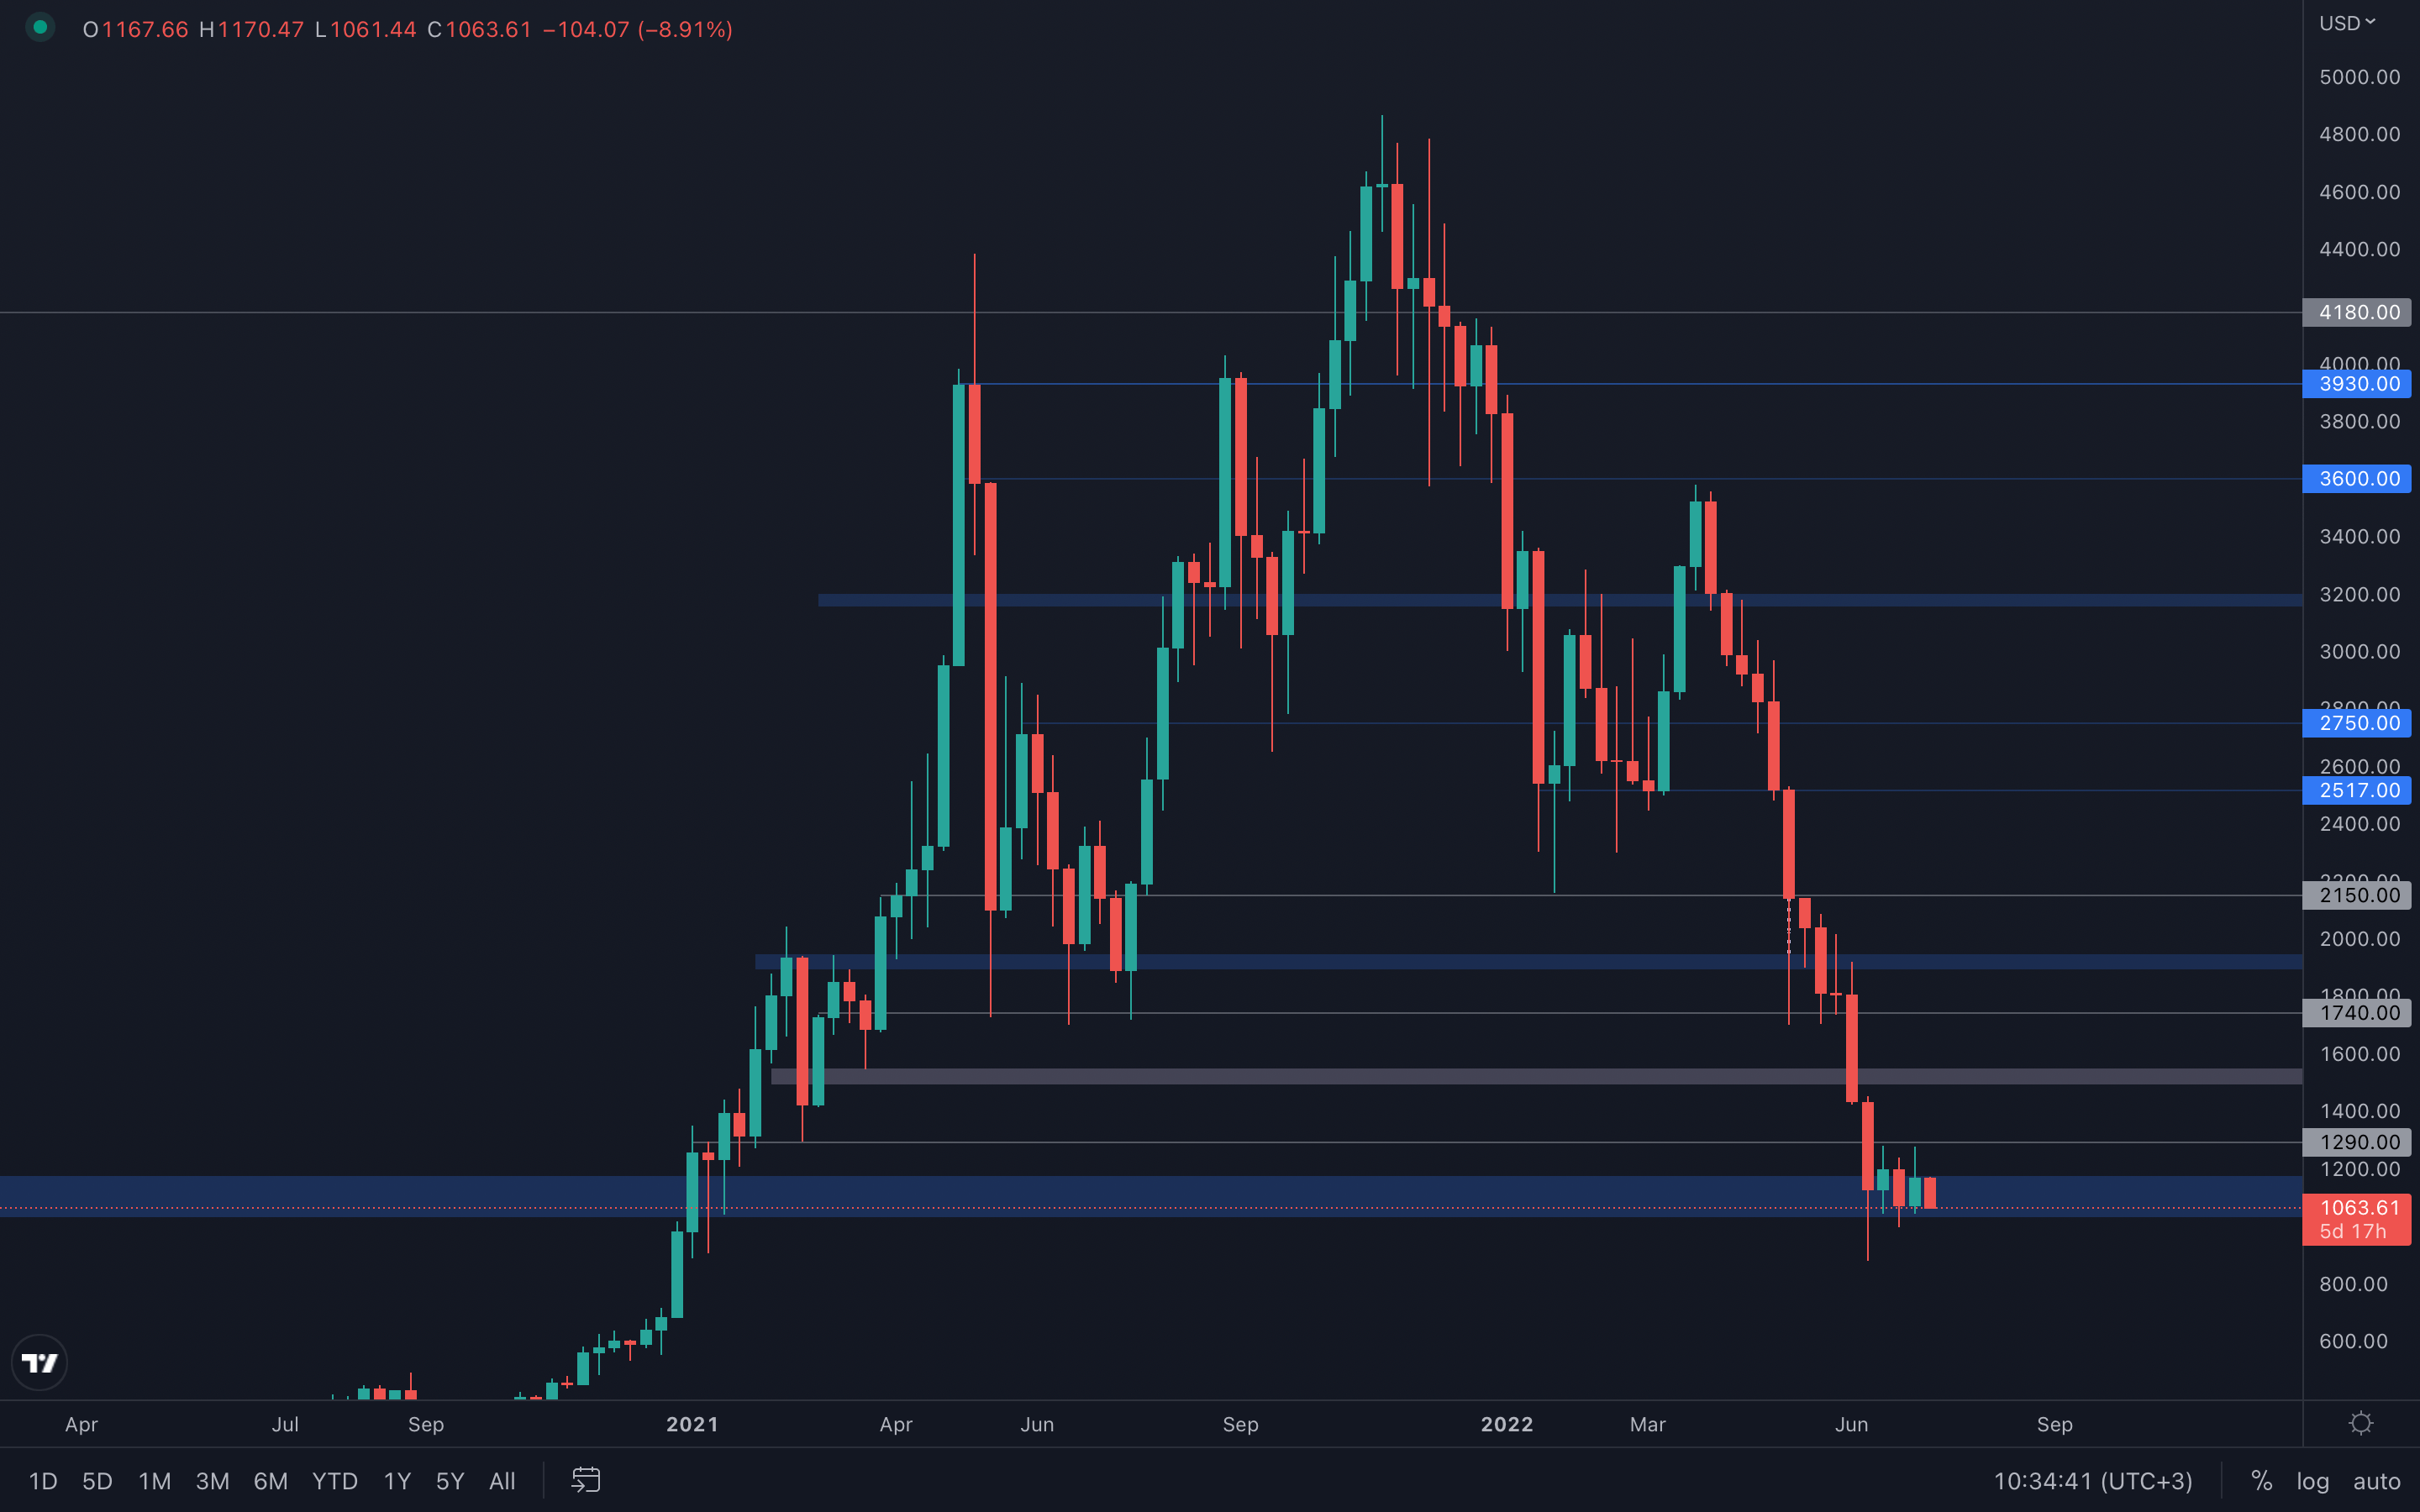
Not many differences between the two majors, as ETH also closed a similar candle last week, and sellers have now regained control once more. However, with Bitcoin at risk of going back to its previous low ($17.5k), it's safe to assume that ETH will be forced to close under its $1000 psychological level, leading to further downside for the altcoins market. The only invalidation here would be for ETH to successfully hold its $1000 level, or even better - to reclaim its $1300 level.
DOT
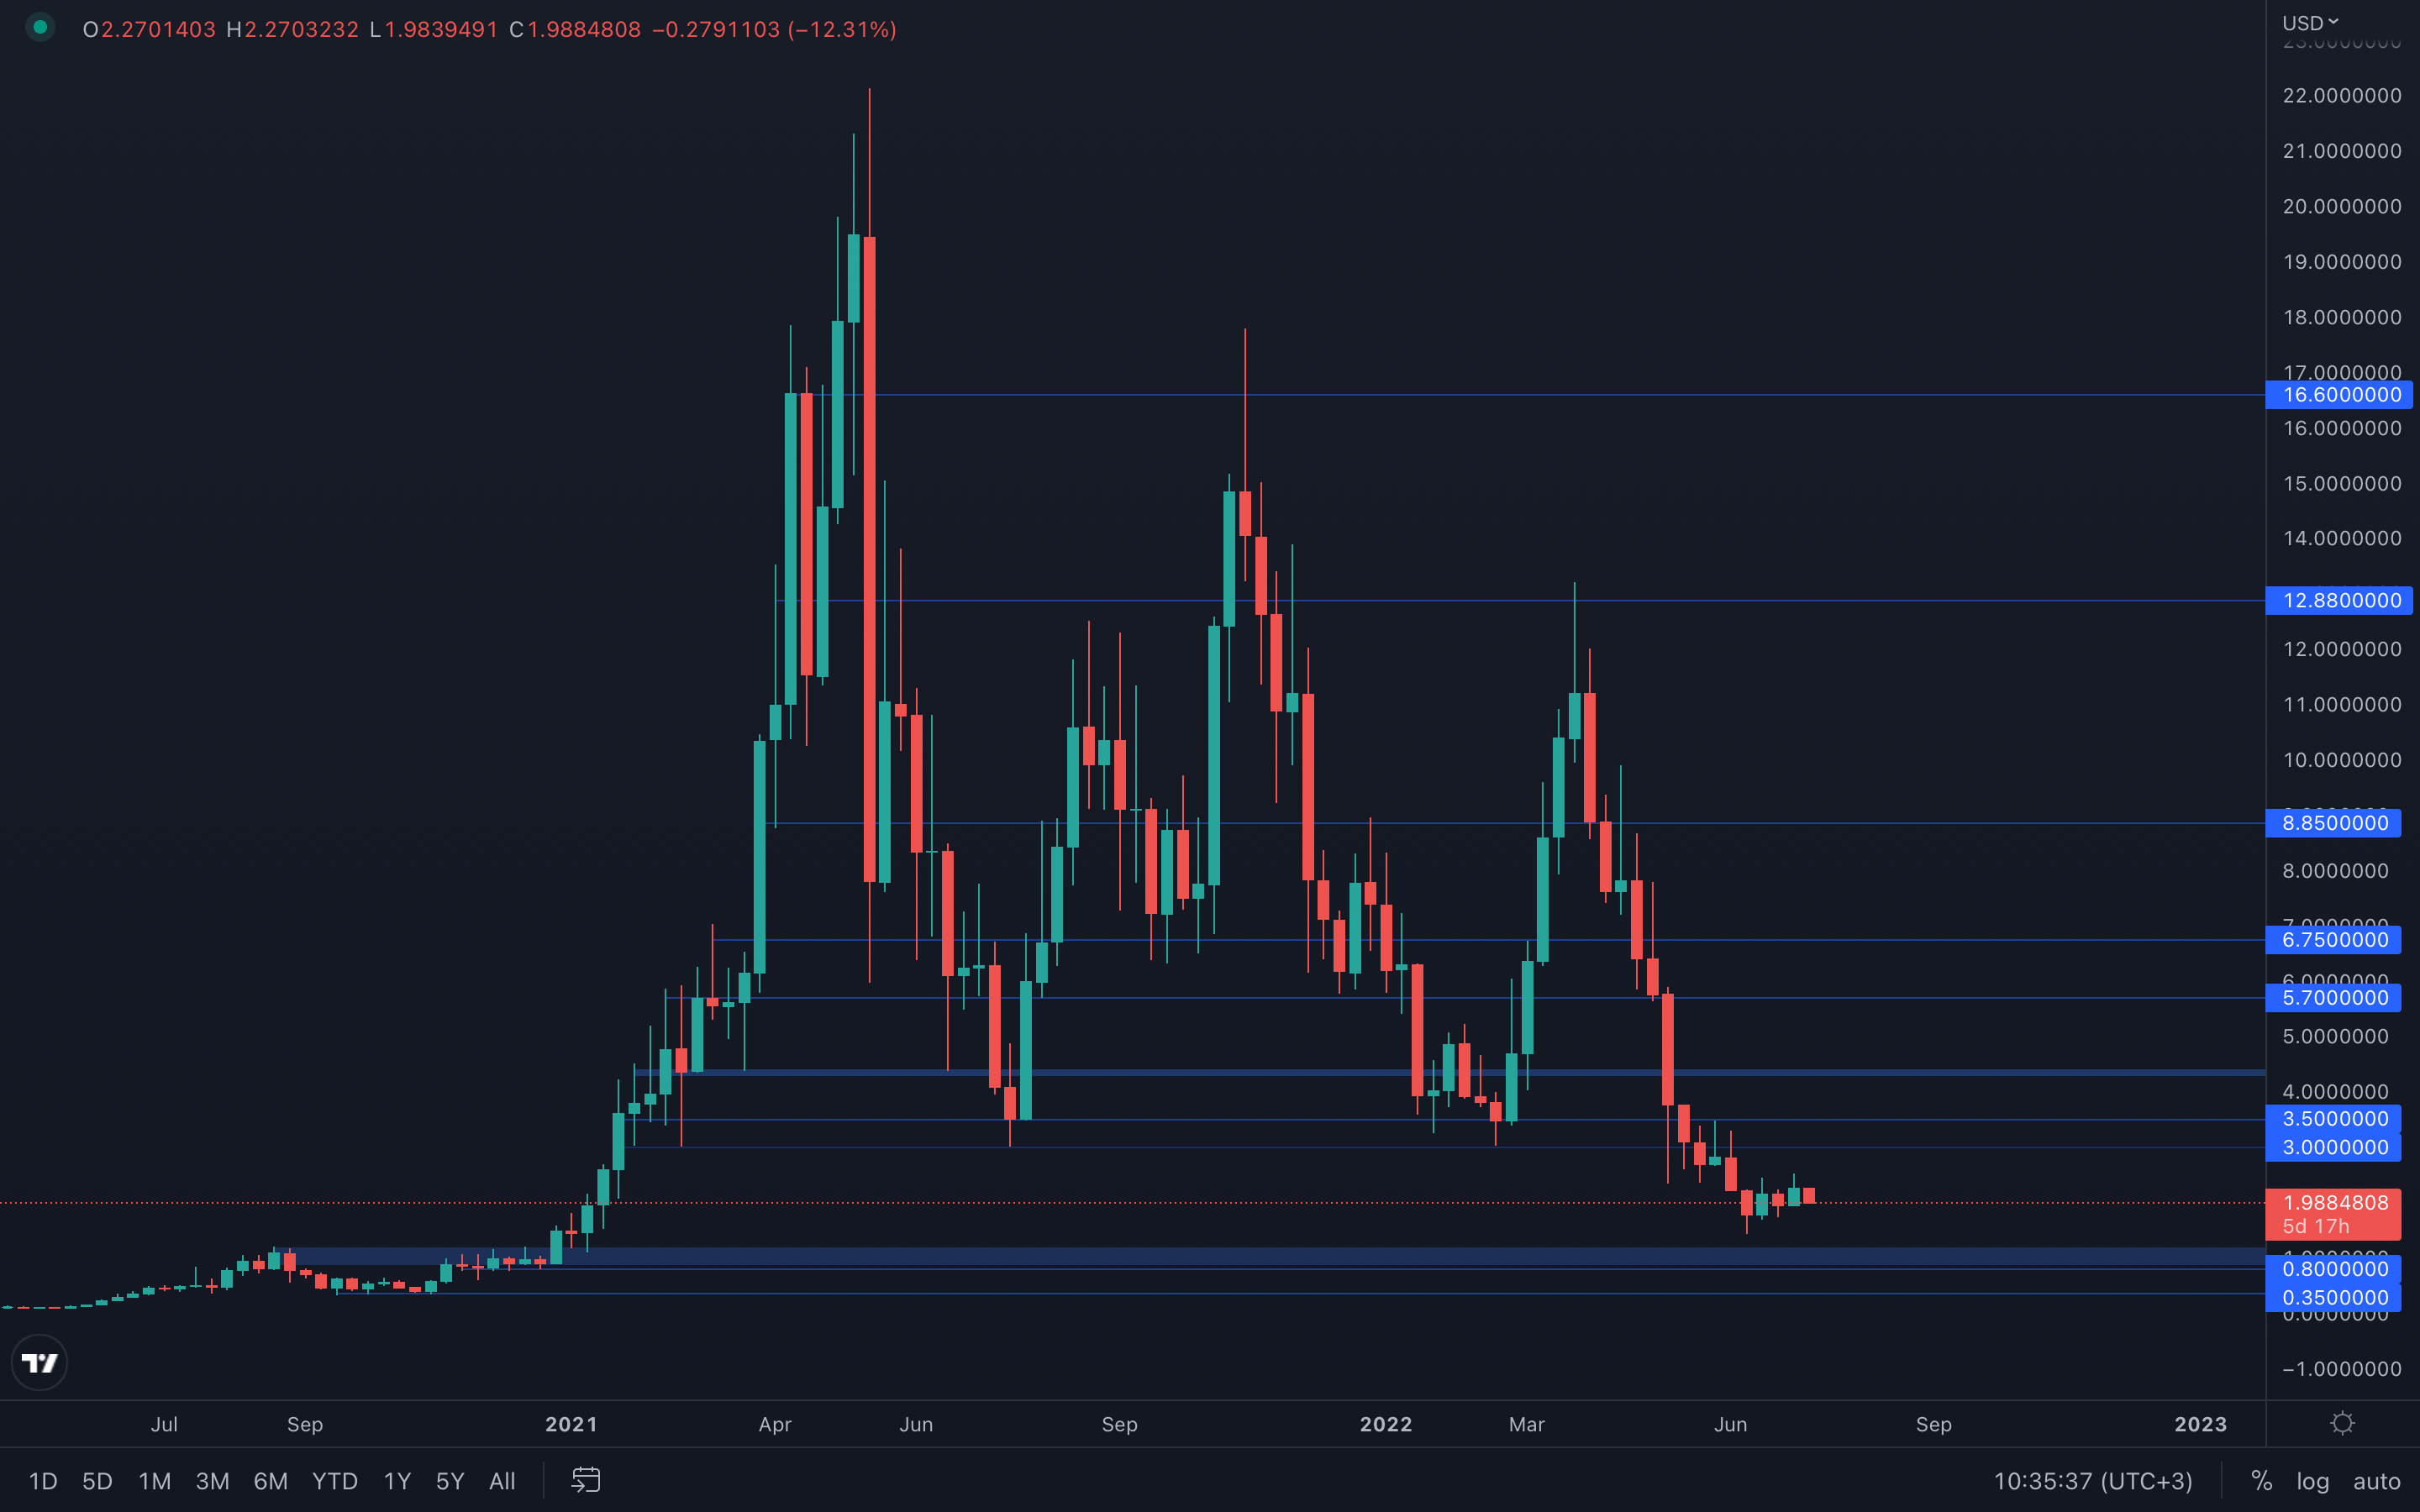
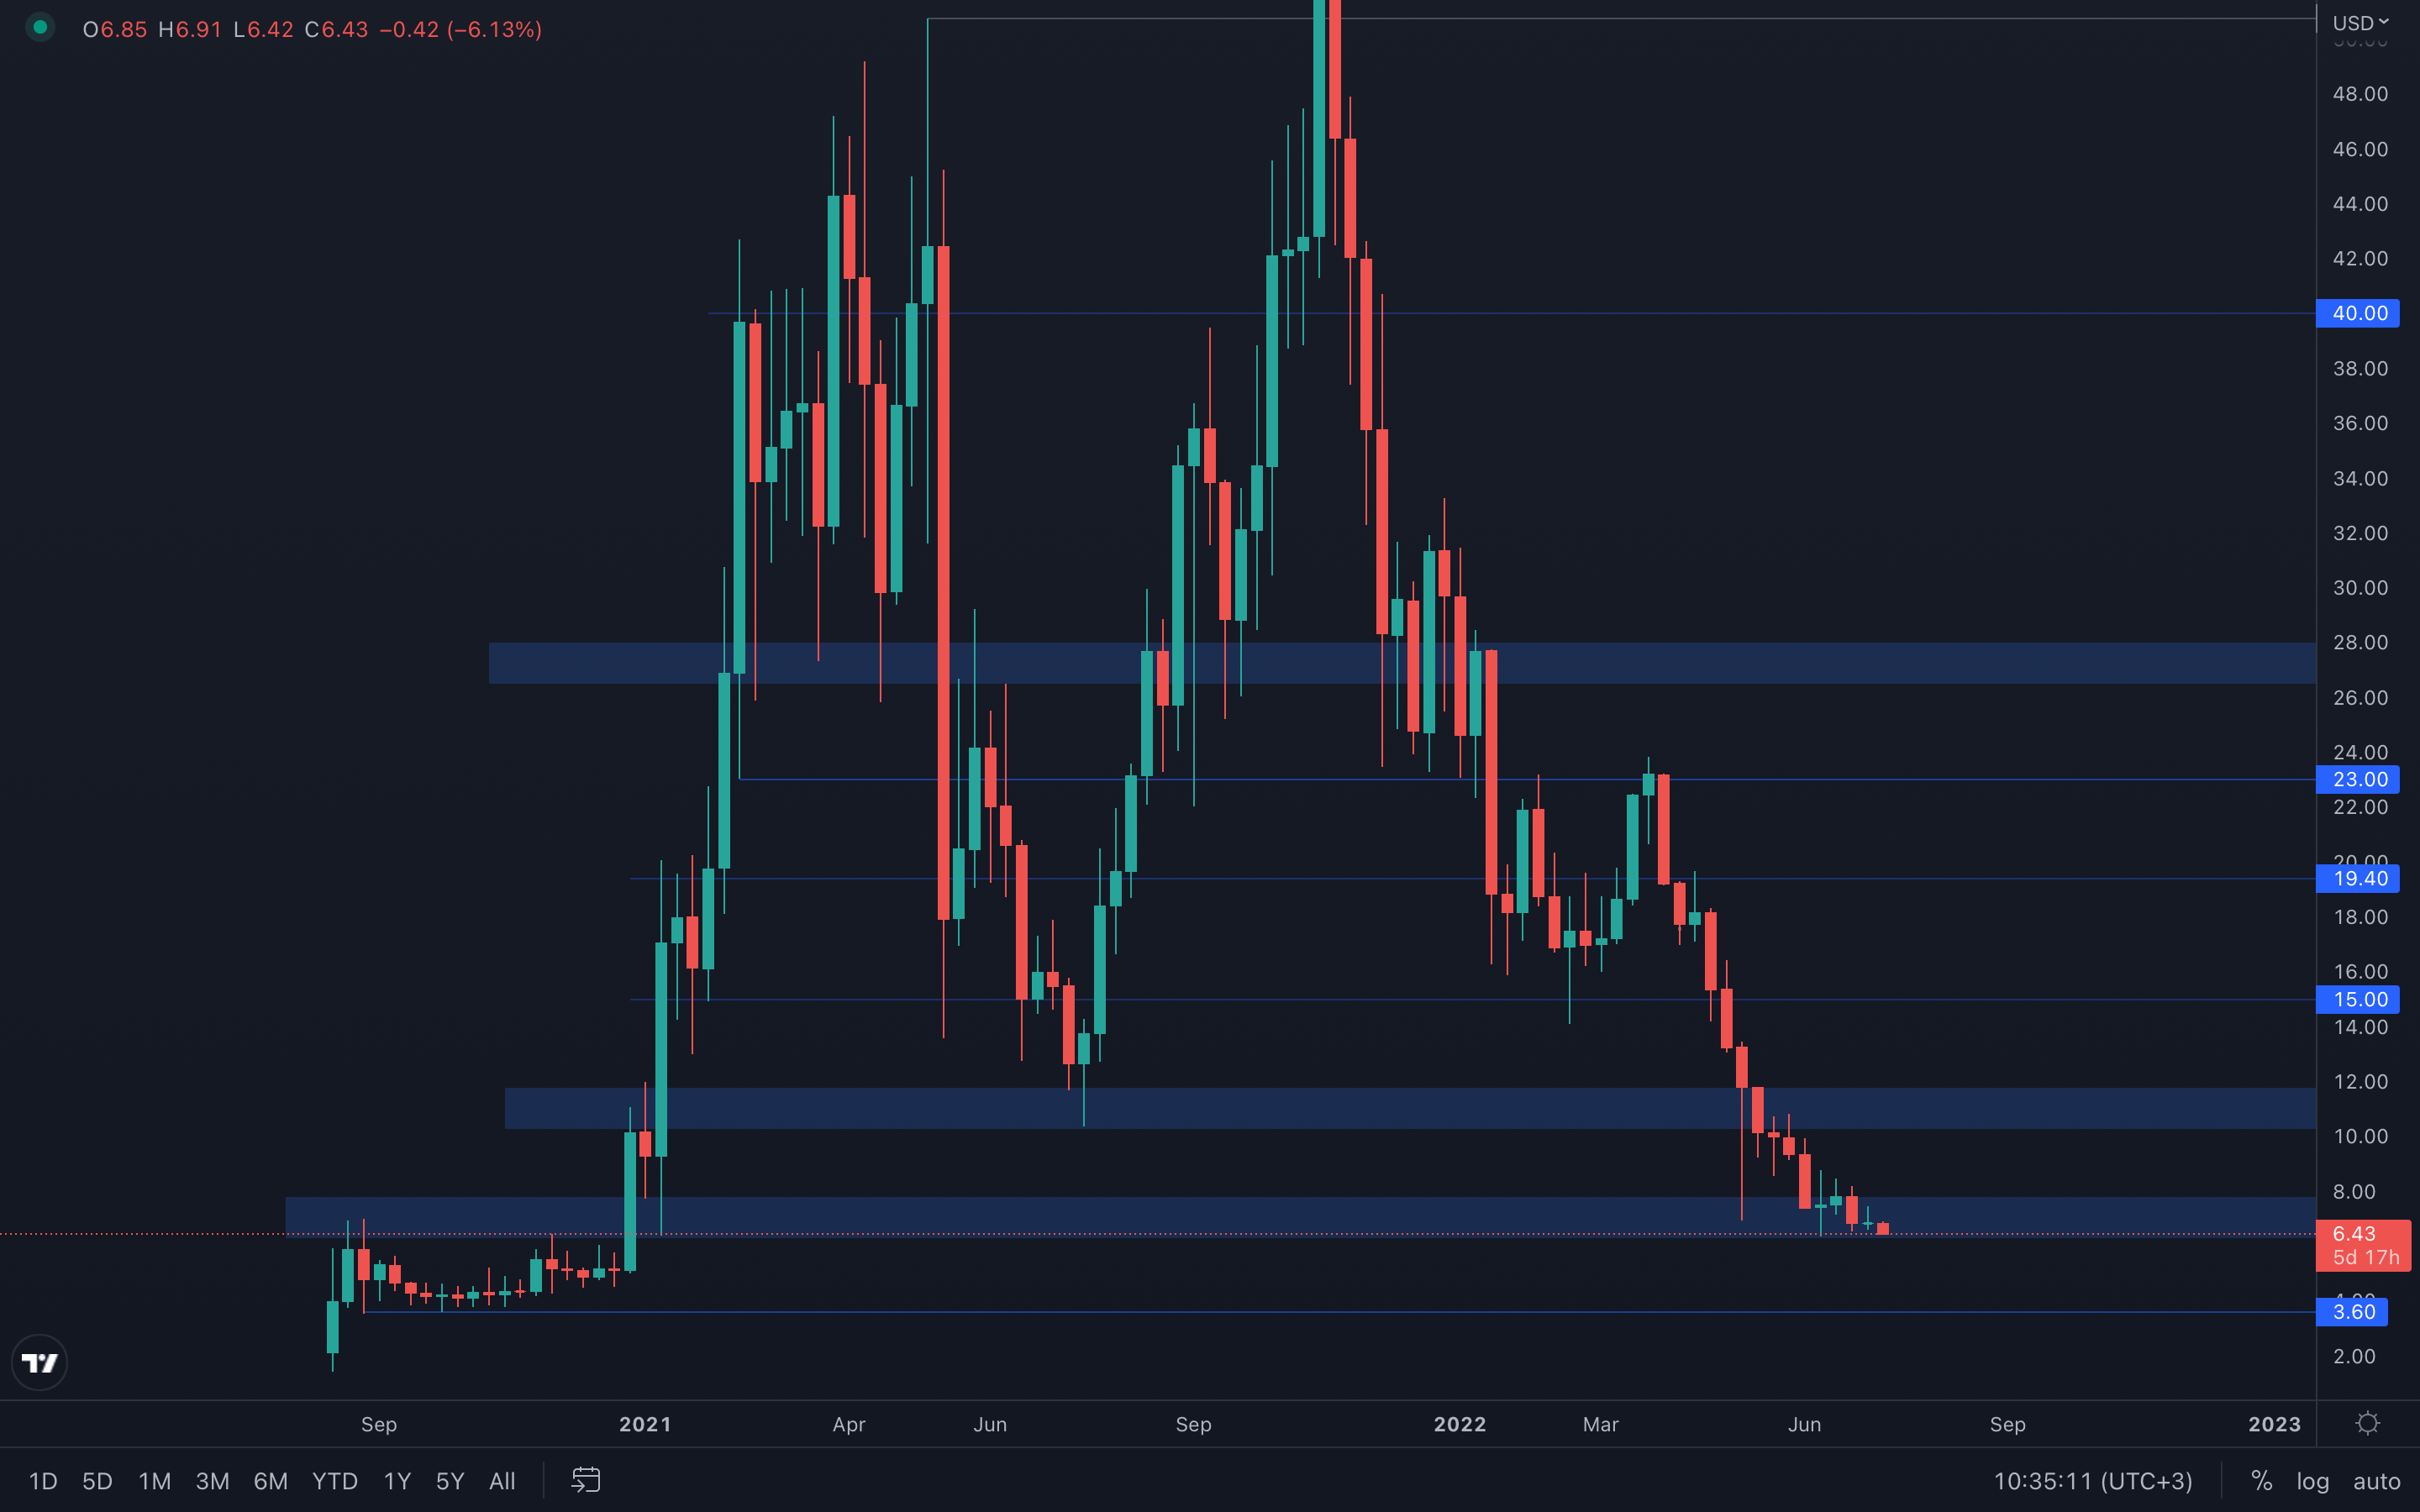 Quite a simple situation for DOT - a weekly closure under $6.30 would suggest DOT will test its next area of interest, $3.60. If DOT manages to hold its $6.30 level this week then further upside can occur.
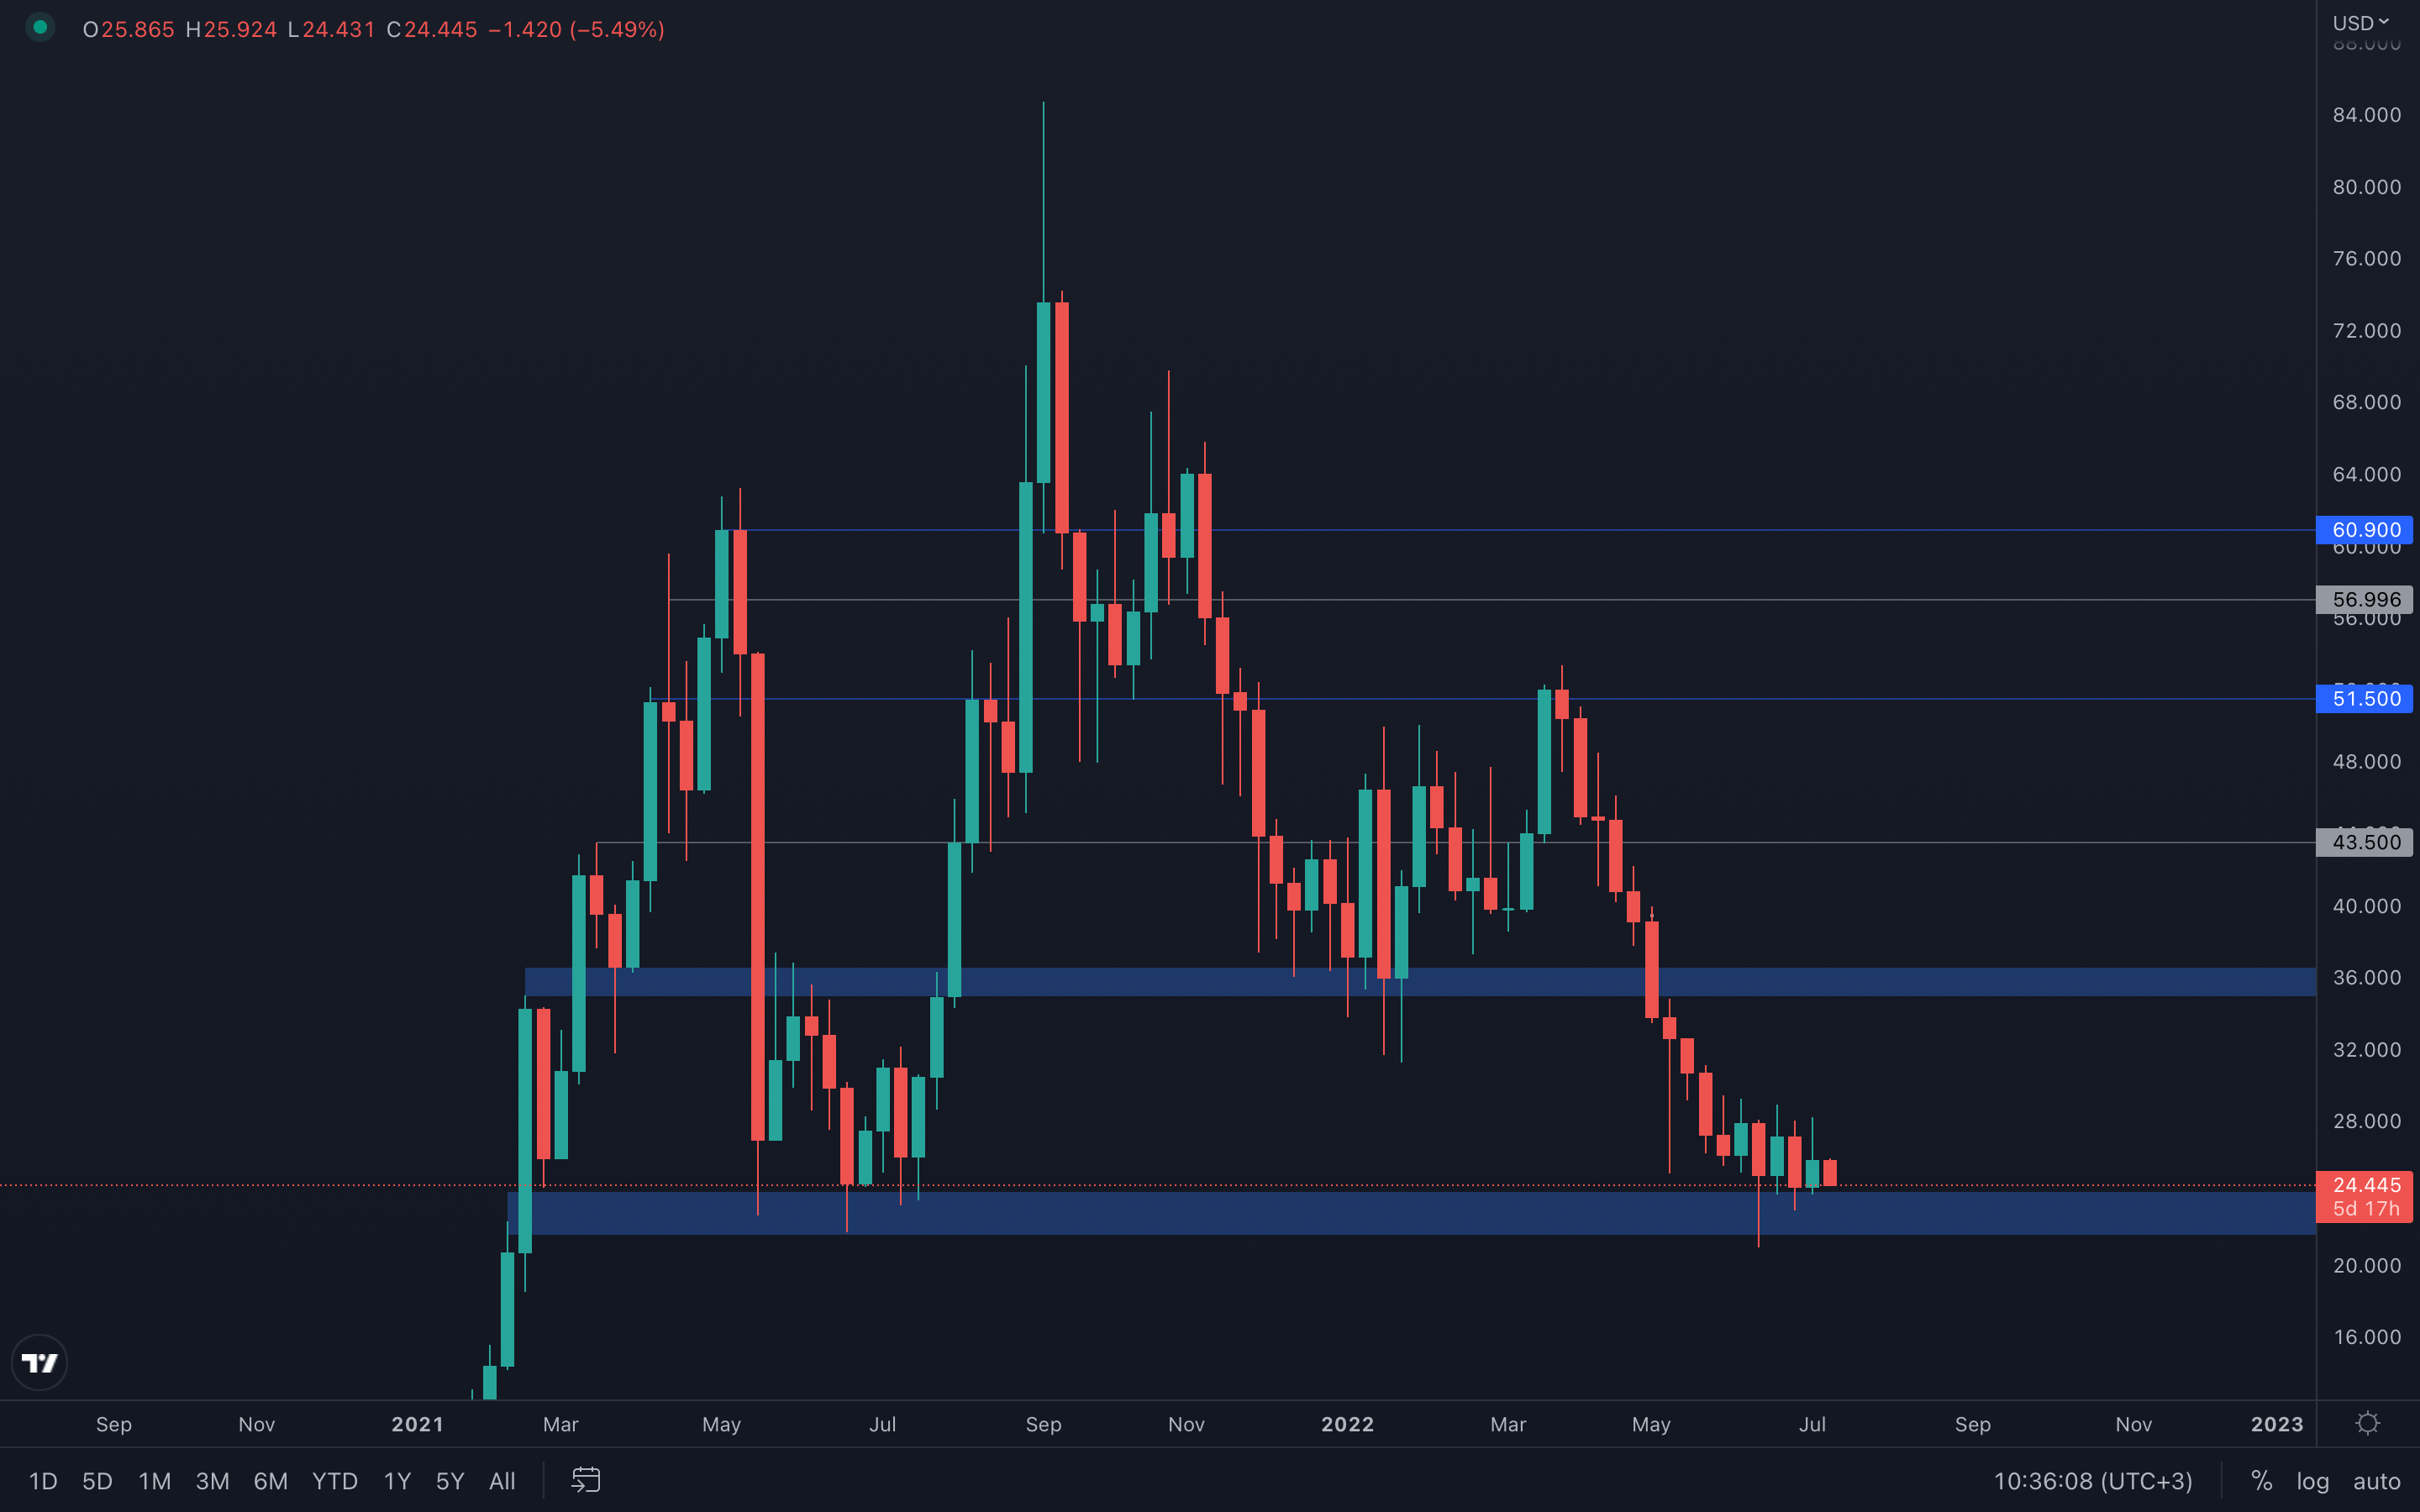
SNX
 SNX experienced strong selling pressure last week, especially around the weekly closure, as the candle almost closed full-bodied. When it comes to candlesticks, it's similar to reading a story - imagine sellers as one character, and buyers as another character. As you read through the story, you'll understand how they think, how they behave, and that can help you deduce what they're likely going to do next. Now, think of these candlesticks as a story - SNX closed not one, but two bearish candles in a row, both indicating either indecisiveness or clarity. Since the candle closed almost full-bodied last week, we now know that sellers have taken over as the main character in SNX's story, but also know what they're going to do based on their previous behavior and experiences, and that's selling further. This week, it's likely SNX will visit its $2 support level, as both the majors are also indicating further downside.
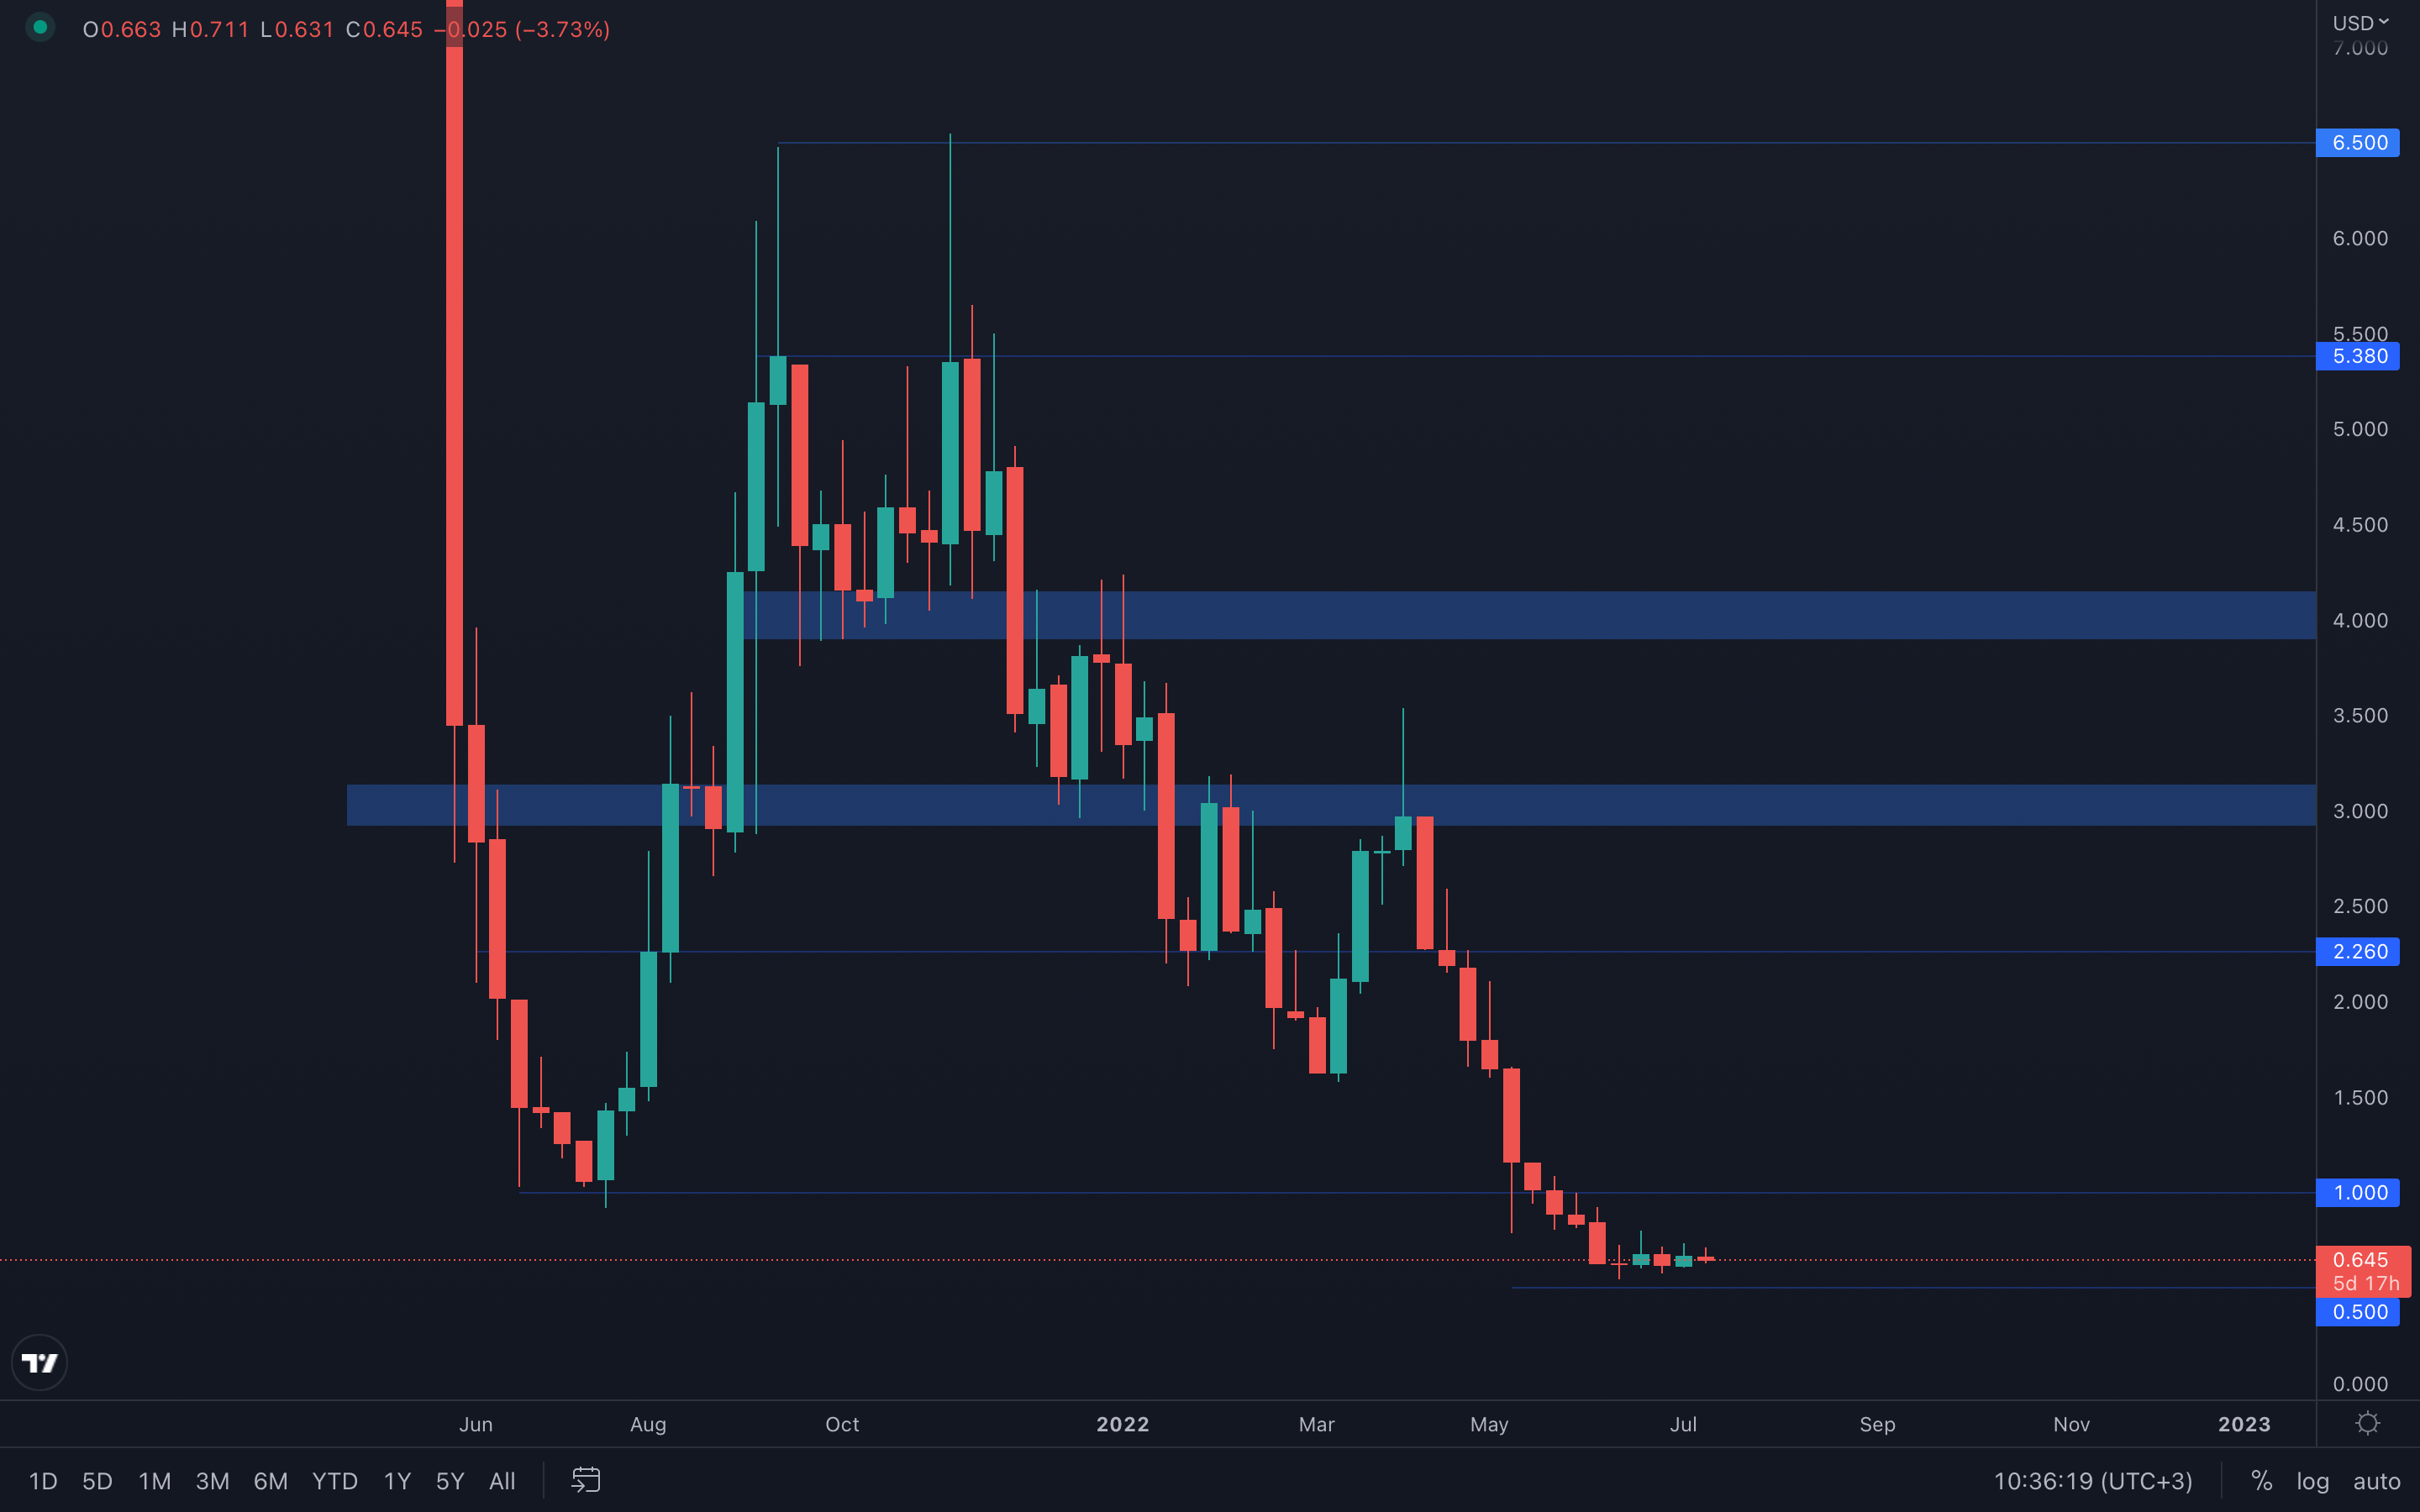
RUNE
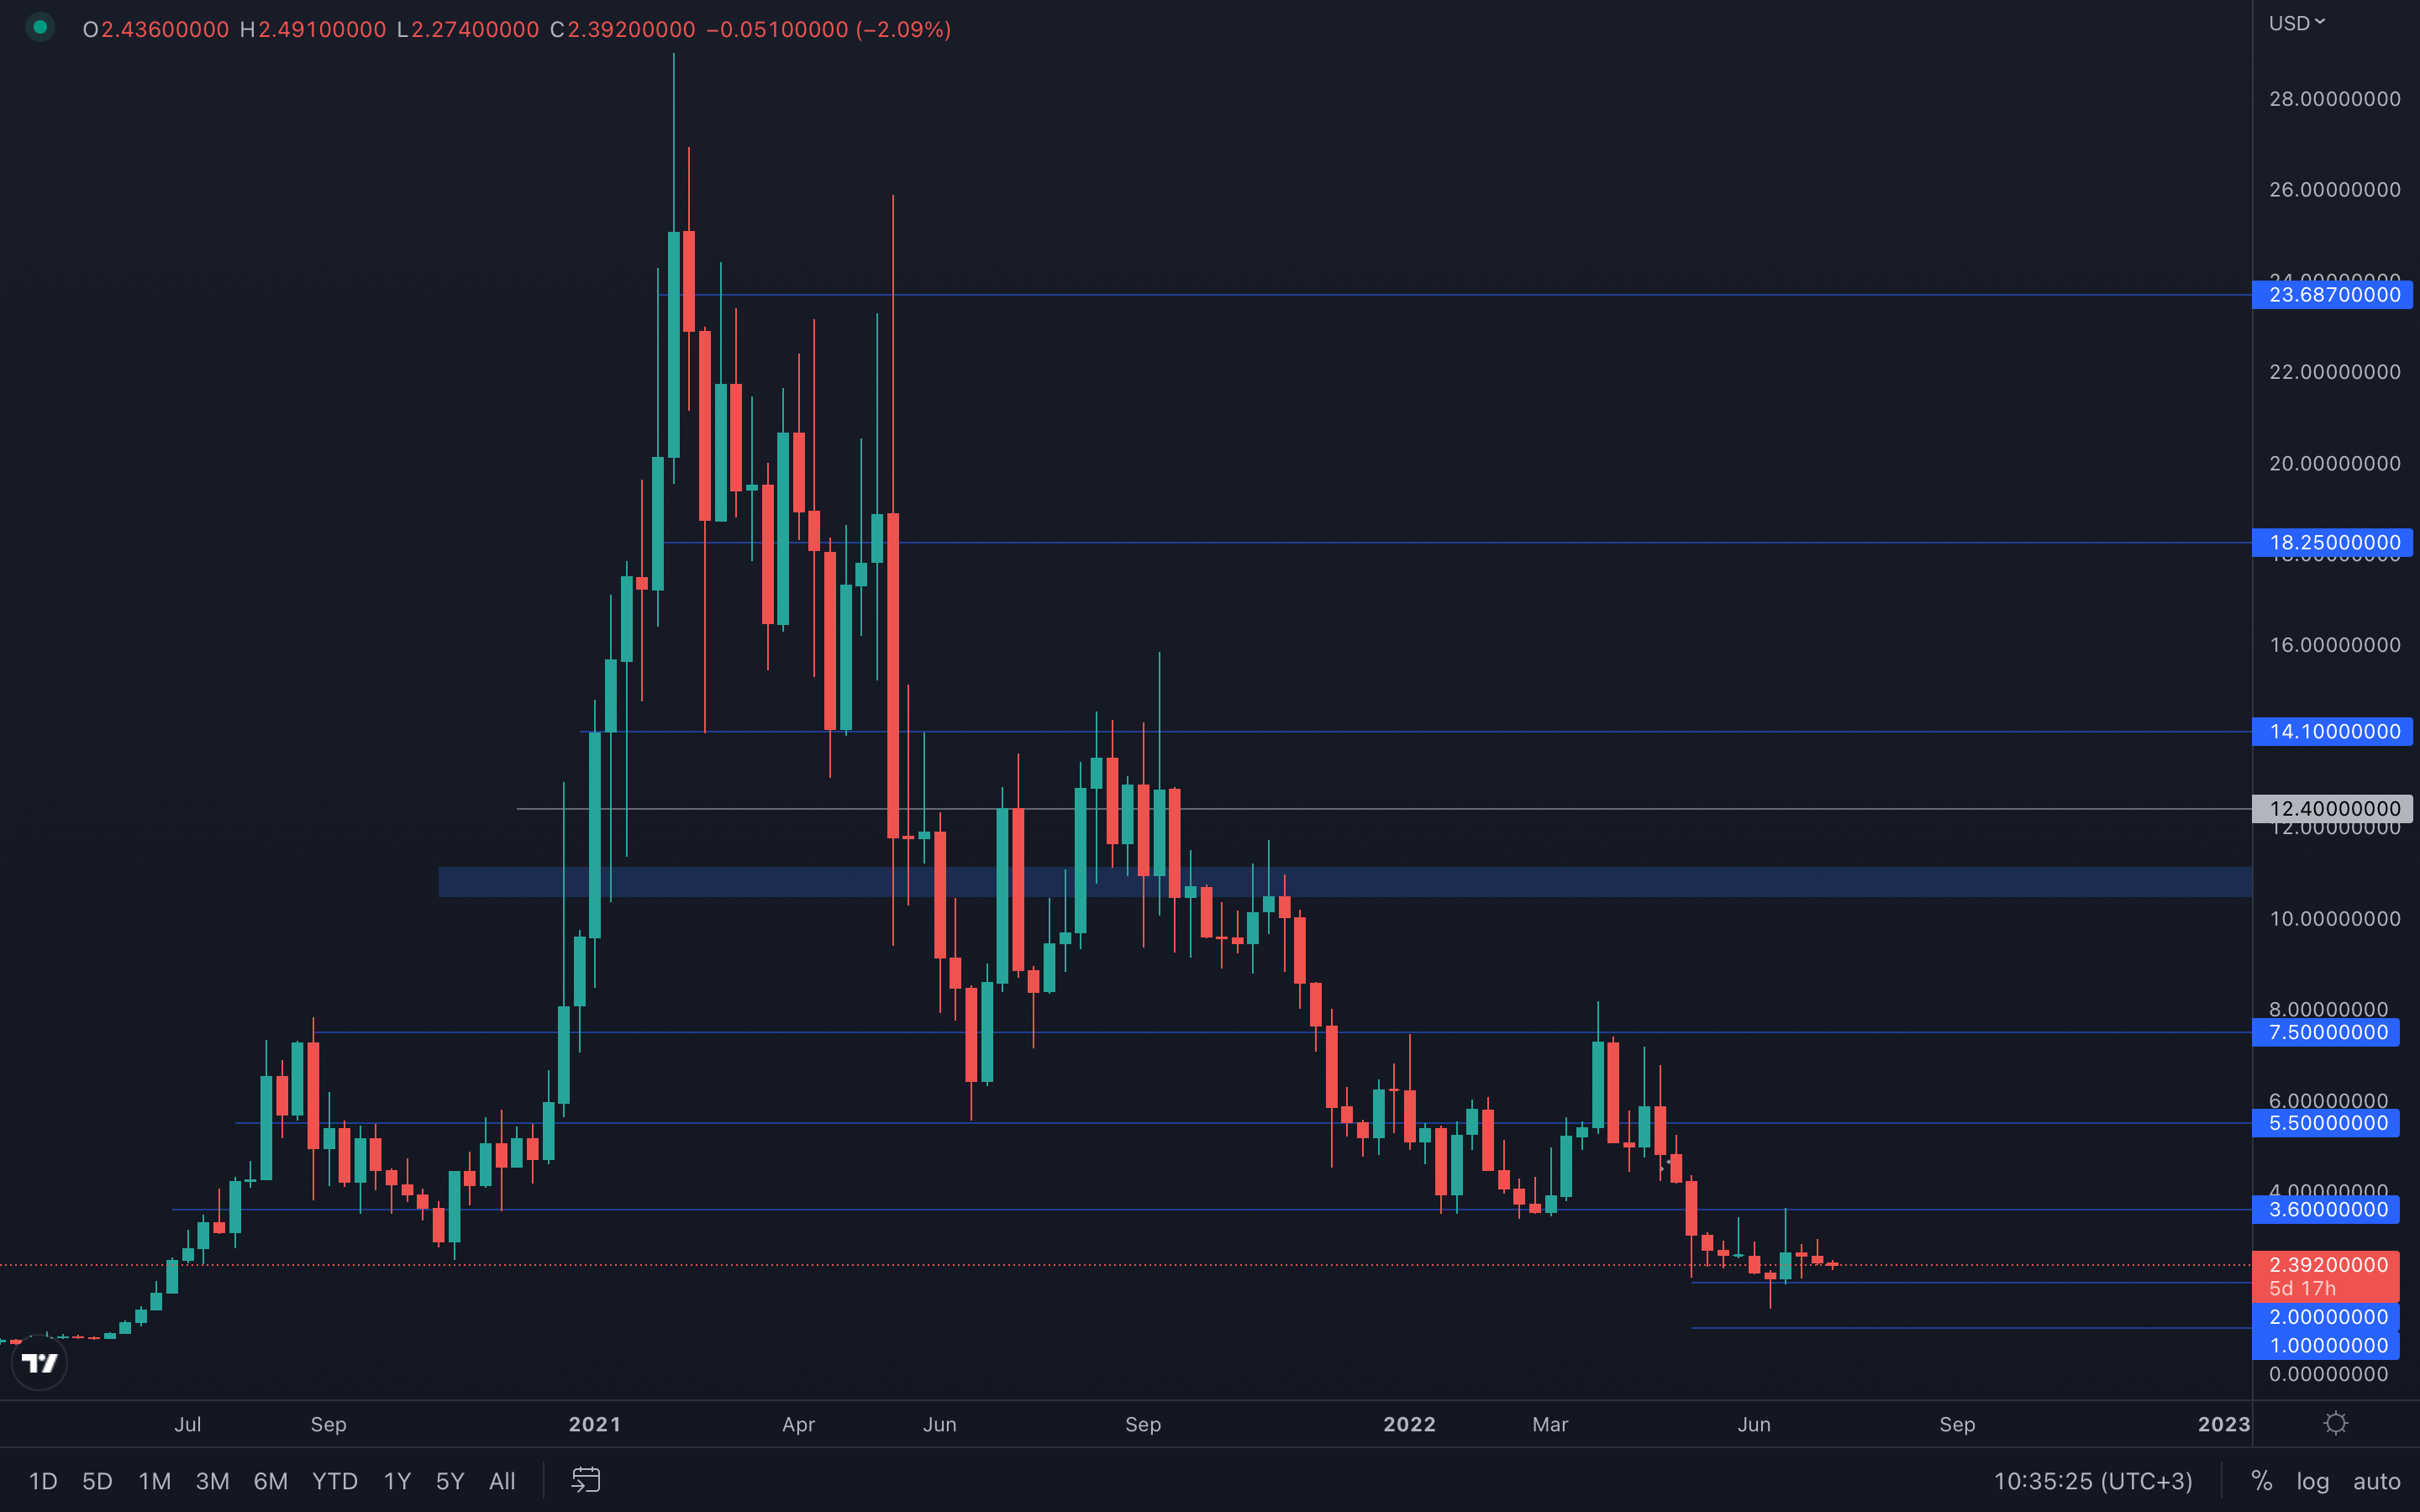
 Bullish open for last week's candle, so chances are the buyers are still going to move prices up. However, with the majors indicating downside movement, this can be brought into question - will the buyers manage to keep the situation in their favor, or will they be outperformed by sellers, leading to further downside? Not something we can deduce for now, so we'll have to wait and see how this progresses. We'll need to wait for only two things to happen this week - either a weekly closure under $1.90 (which will form a bearish engulfing candle) or a weekly closure above $2.30 (which will suggest prices can test the $3 resistance level shortly after).
SOL
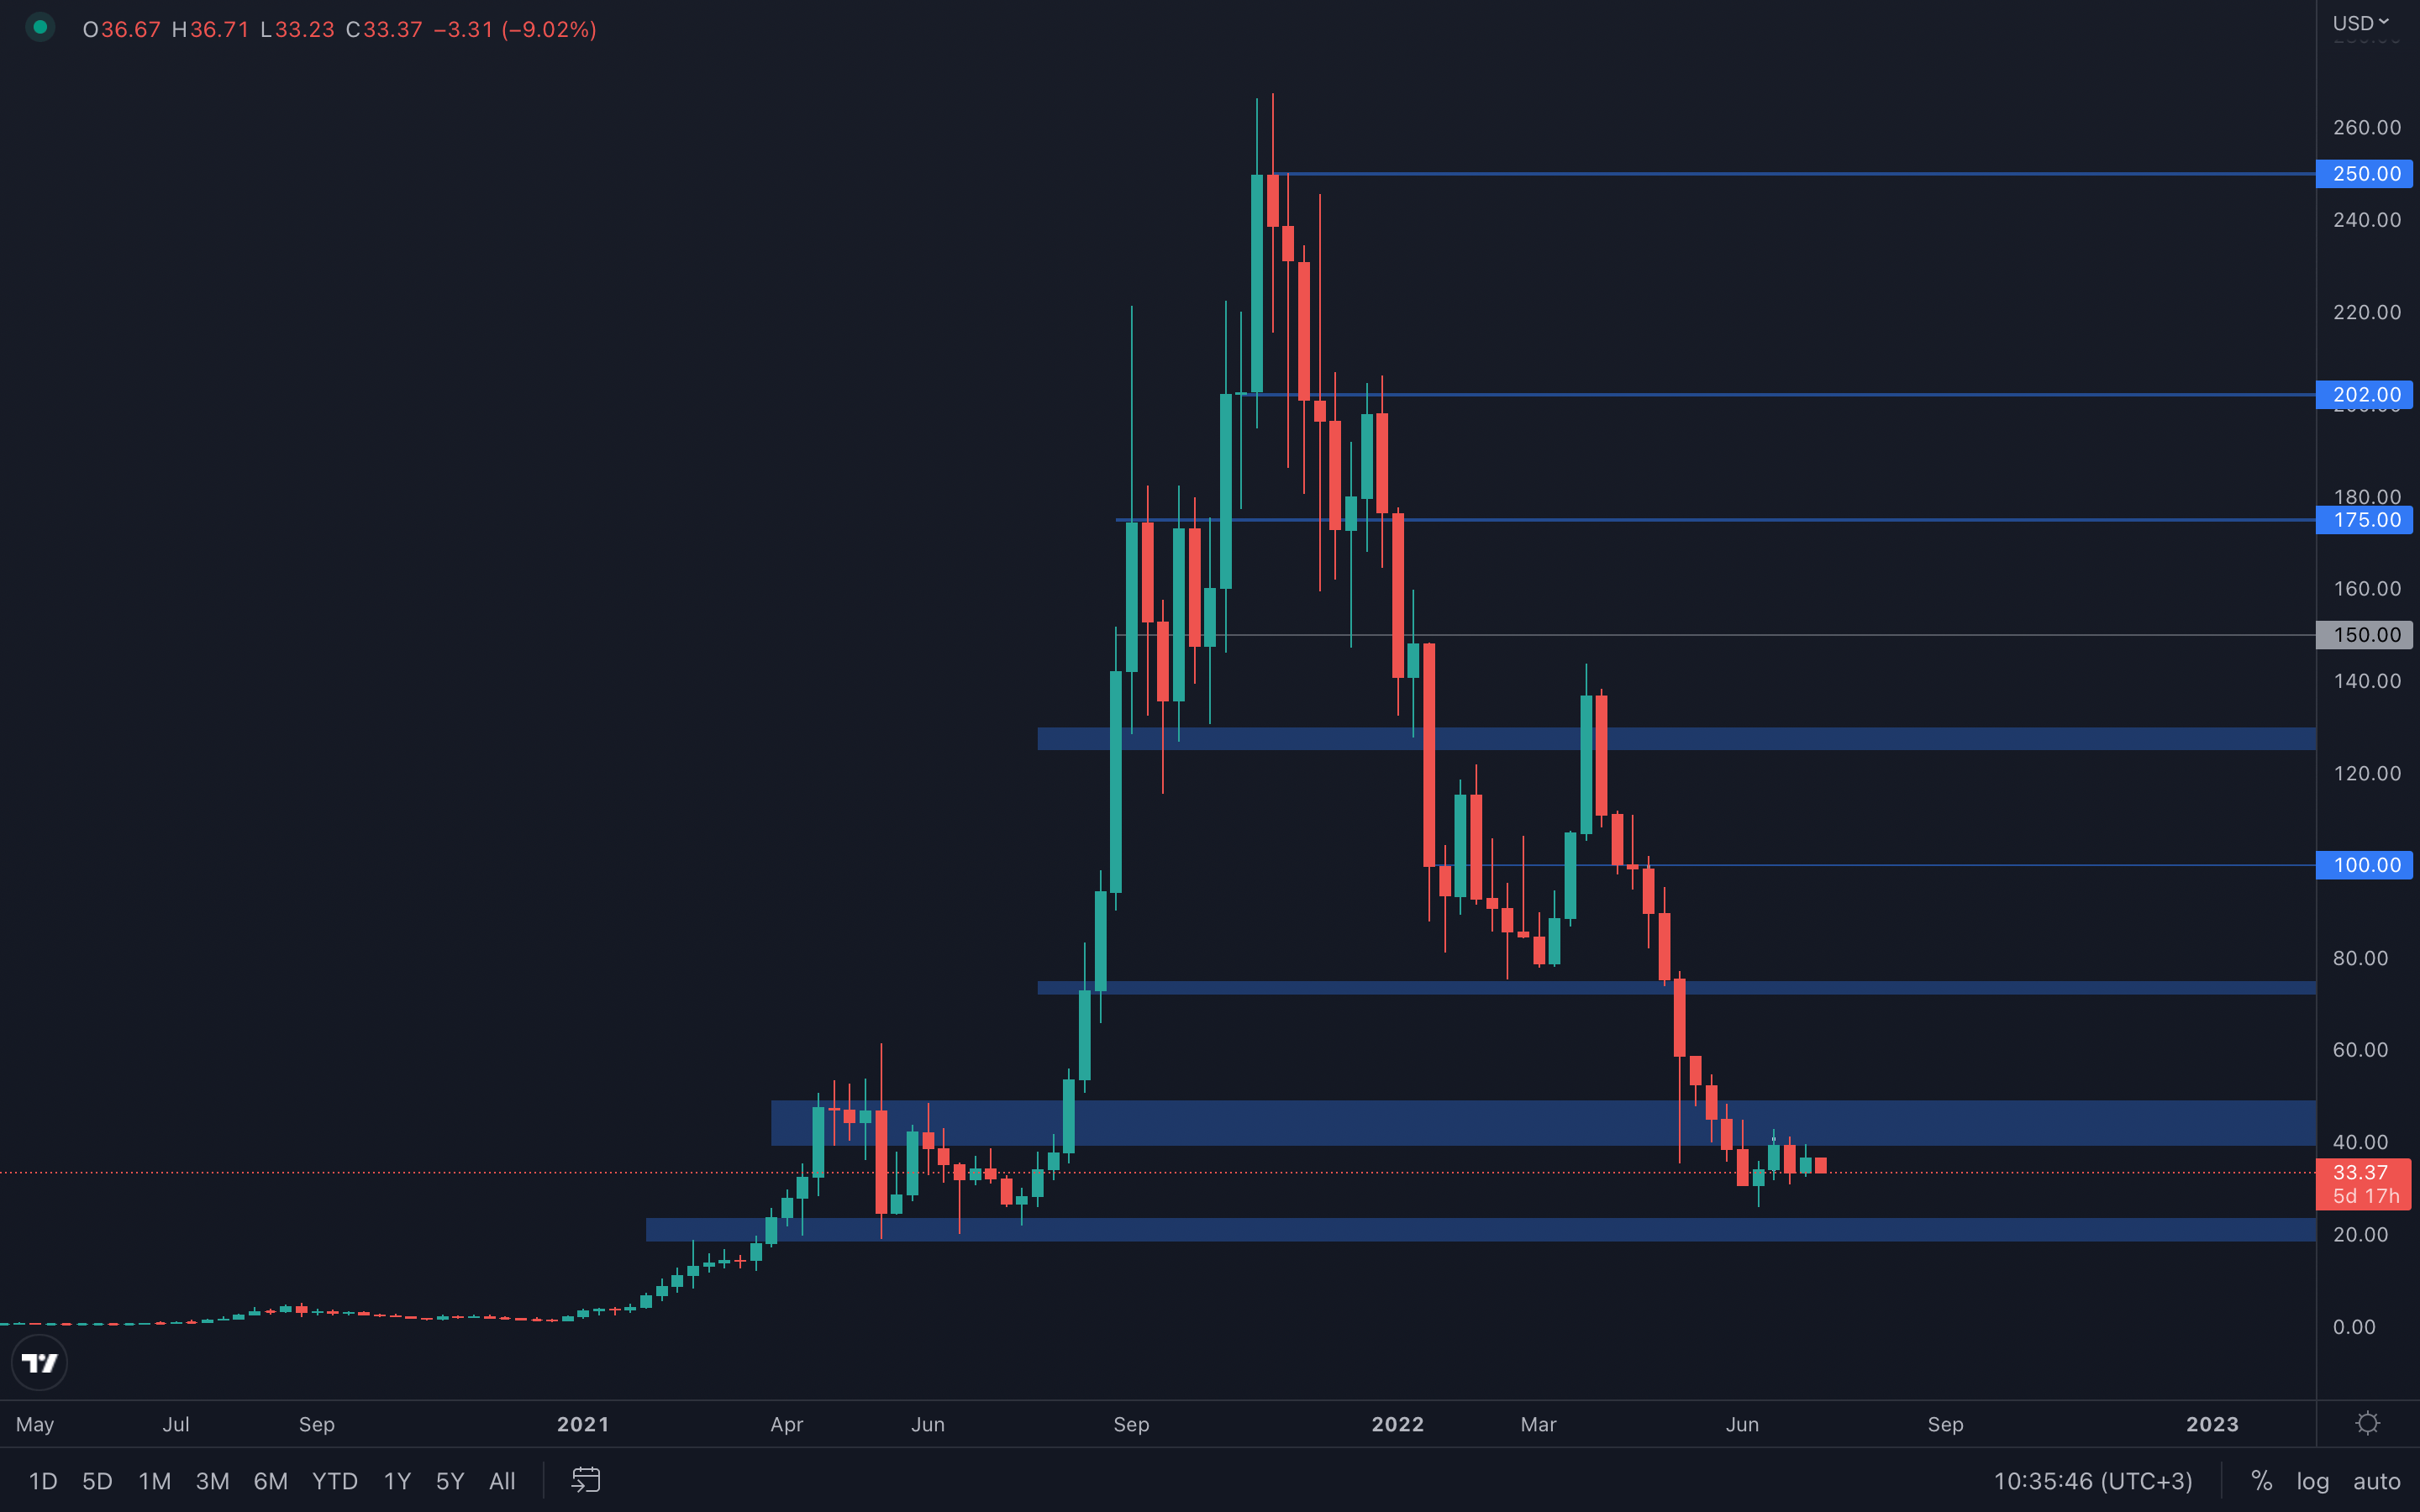 Following the bearish engulfing candle two weeks ago, SOL managed to close a green candle due to the majors also rising last week. Does this change anything for SOL? Absolutely not. Price is still under a key resistance level, and only a $50 weekly reclaim will indicate further upside. Until then, expect downside movement, with $20 as the next major area of interest. A $40 weekly reclaim will also provide bullish momentum, as it will be the highest weekly closure since May 2022.
SRM
 Surprisingly, SRM decided to not fit into the crowd and closed a bullish engulfing candle last week. If you've already read the SNX analysis above, then you already know what we think about candlesticks, and this helps us simplify the situation to the fullest - due to the bullish engulfing candle registered last week, we should expect SRM to test $1.4 next. A daily closure above $1 is ideal for trade entries, however, we still recommend staying off trading until the new inflation print is shown tomorrow.
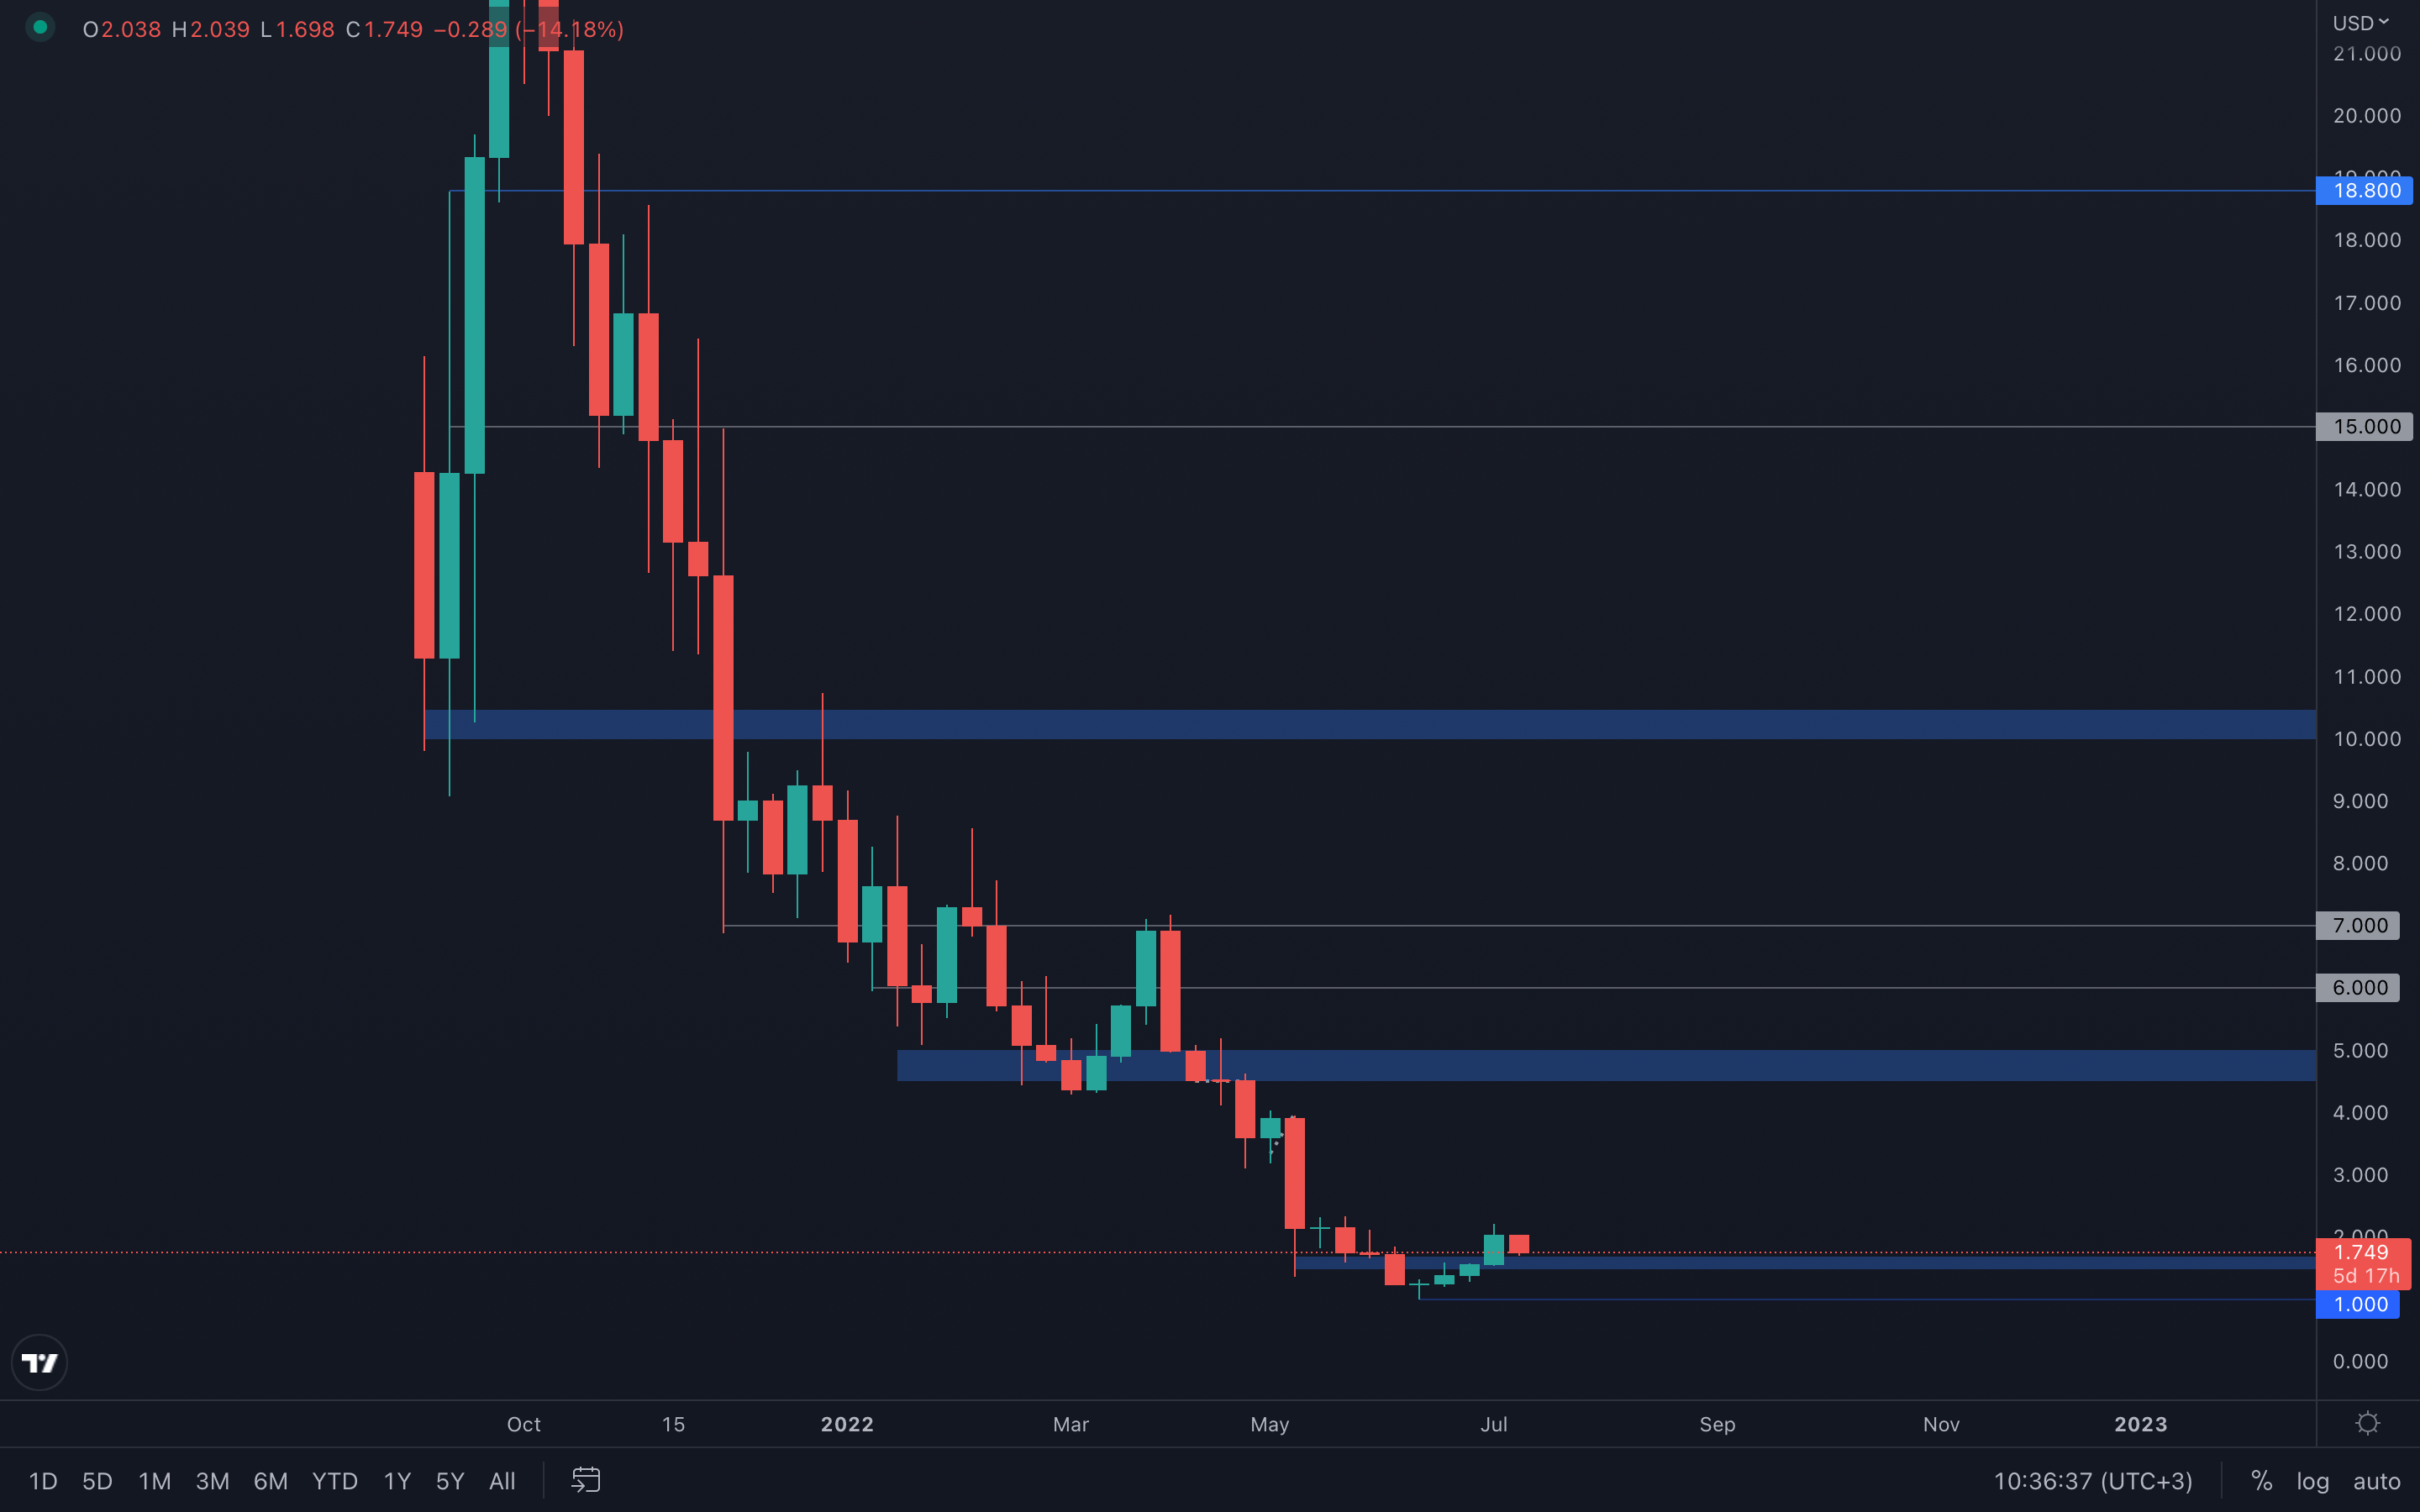
FTT
 Probably the most volatile asset on the list. The price fluctuations on FTT actually provide solid trading opportunities for all the traders out there, of course, if risk management strategies are used properly. But let's leave that to the side for now. For weeks, FTT has been slowly descending, with a lower candle closure once every two weeks and it has now descended just above its $24 - $21.5 support area. Even if buyers have managed to close a few green weeks here and there, the market trend remains intact, and FTT will most likely test the bottom of the range sitting at $21.5 sometime in the near future.
MINA
 The most indecisive asset on the list, MINA has been ranging for five weeks straight, with volume at extremely low levels. For that reason alone, we cannot expect anything other than further ranging until volume starts to increase again. There still remain two psychological areas of interest, $0.5 (which is not far from MINA's current price and can easily be tested in the near future) and $1, the level that needs to be reclaimed in order to confirm further upside.
dYdX
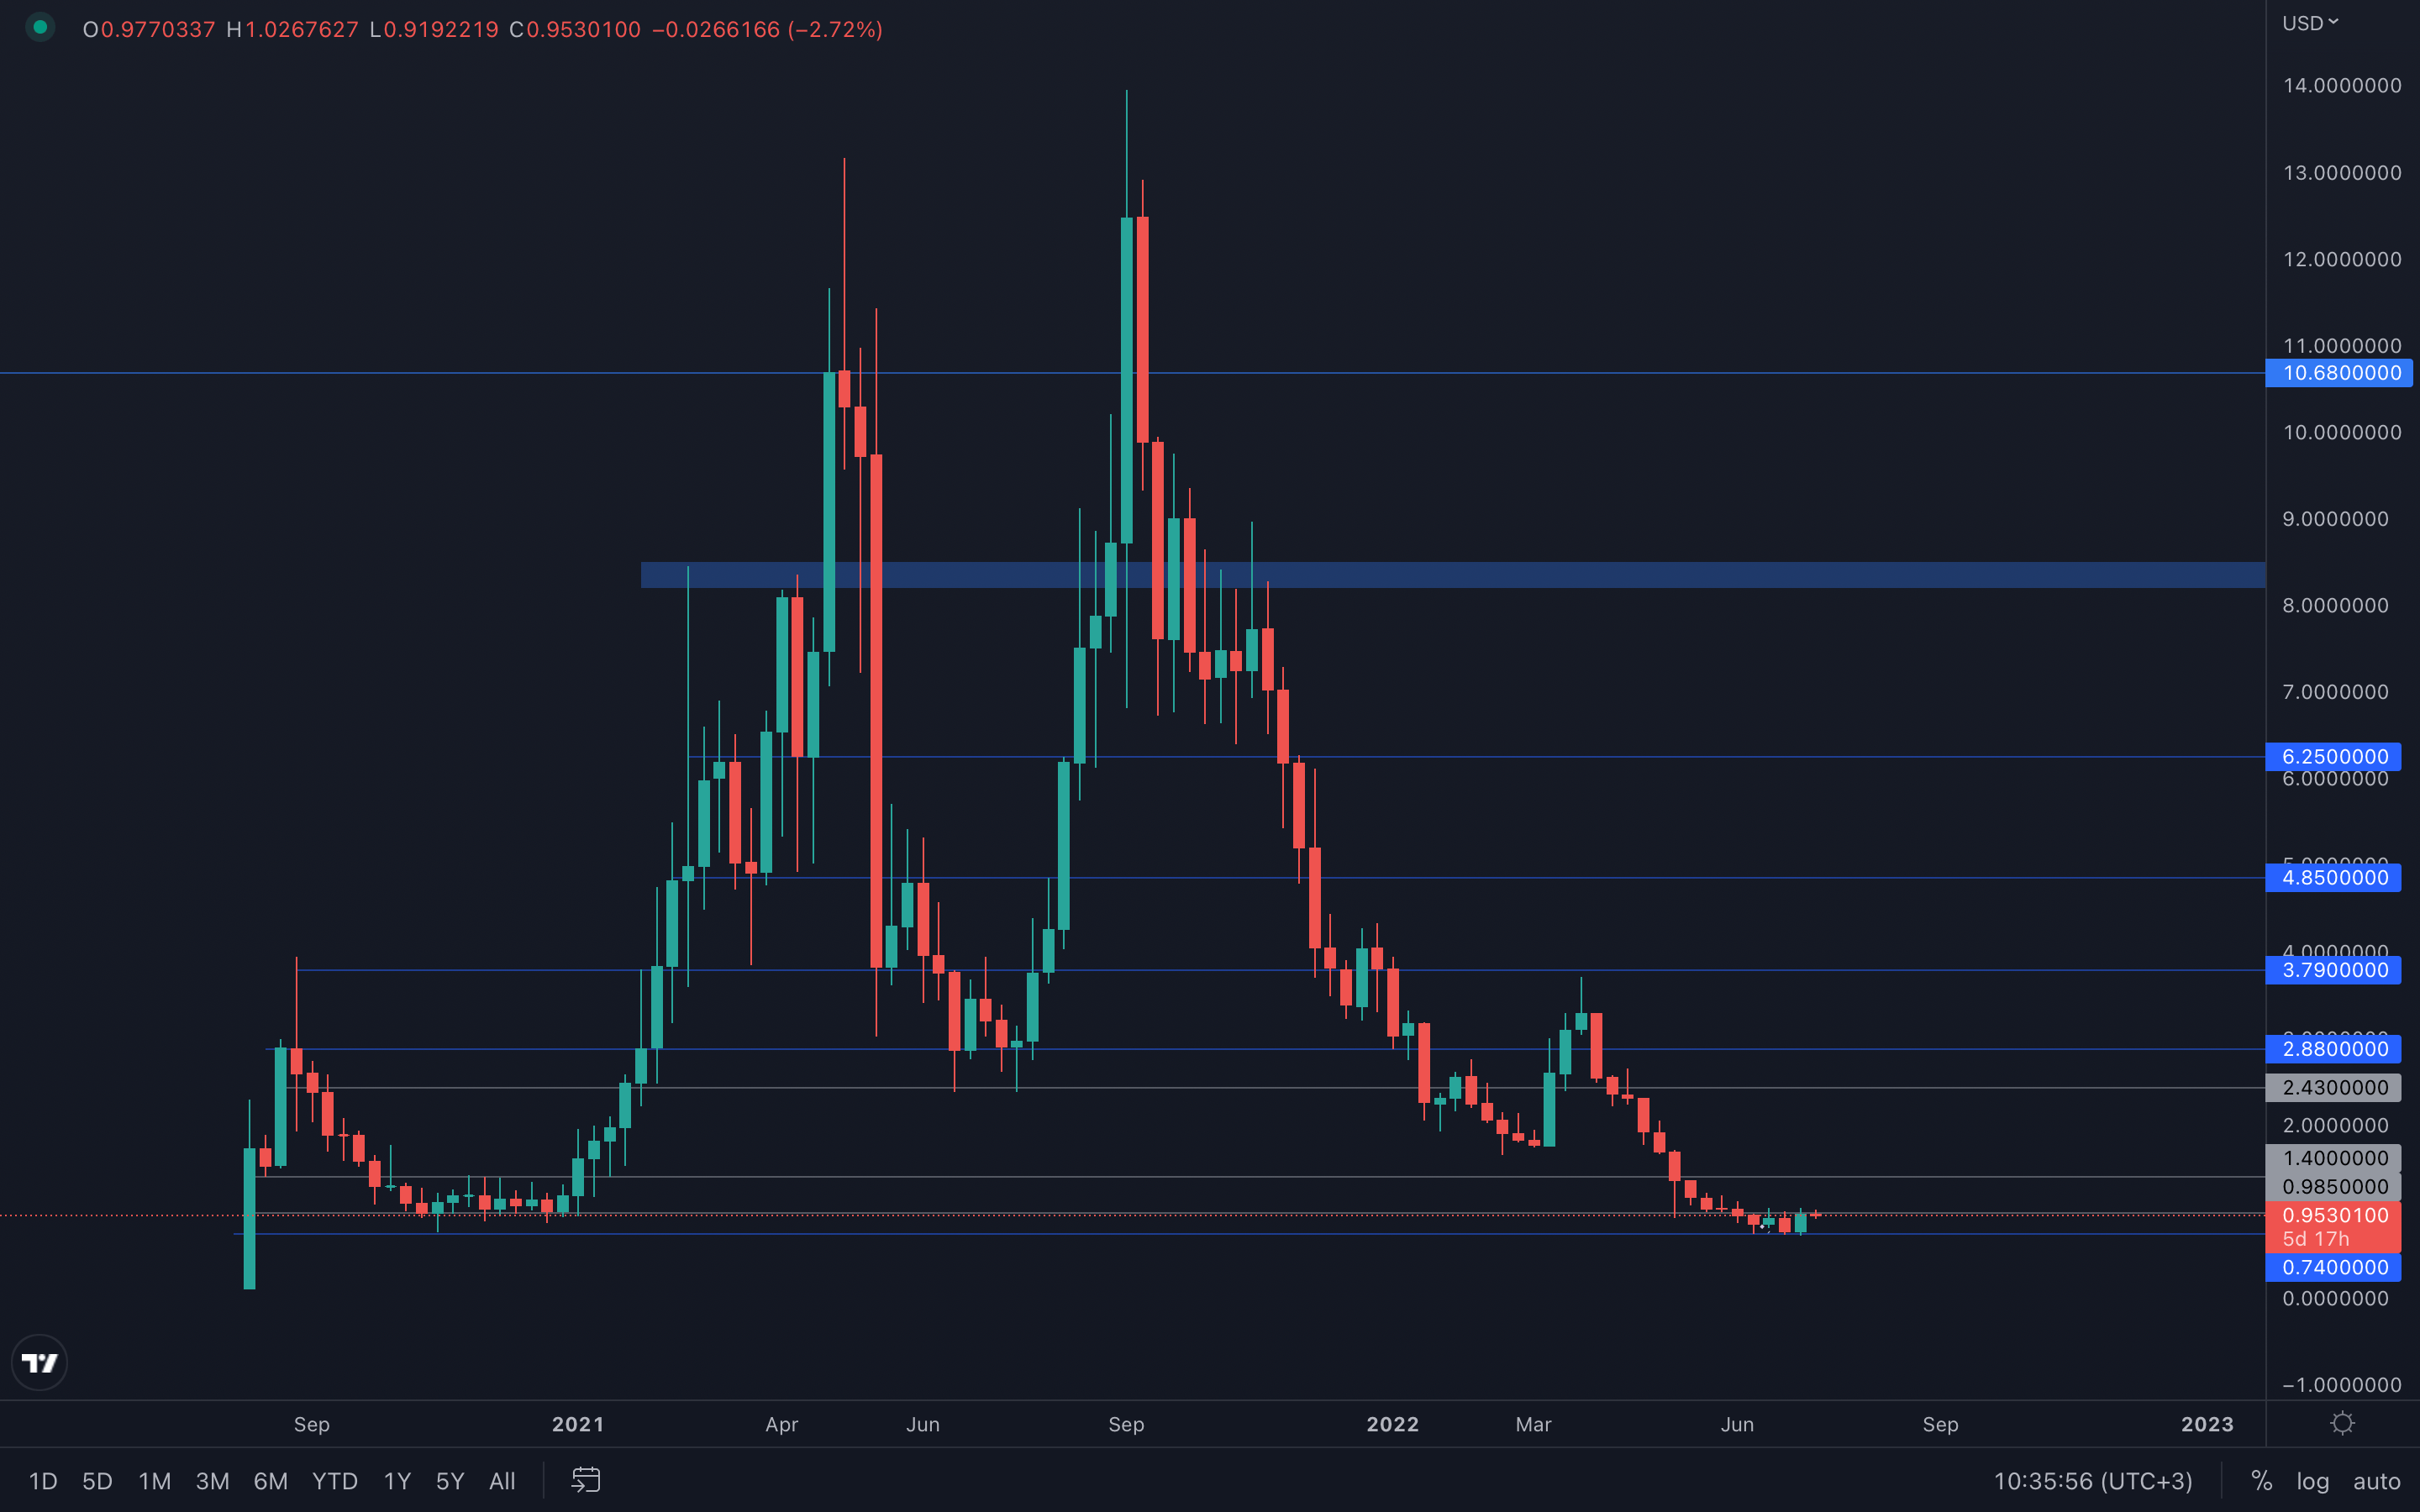
 dYdX registered a 30% increase last week, which somehow speaks for itself. The weekly closure we've seen last week is not only extremely bullish but also extremely risky, as a rapid ascend can lead to quick exhaustion. However, we can see that dYdX is currently aiming for a $1.70 retest (top part of the range), which is the safest approach for further upside. If $1.70 manages to hold, we can easily see dYdX ascend further and only a weekly loss of $1.5 (the bottom part of the range) can suggest more downside.
Summary
By diving into this week’s metrics, we can see that there are a number of signs that we are coming to the end of a possible Bitcoin bear market. However, in previous cases, these metrics have bottomed for a number of months, so there is some suggestion we could stay at similar price levels for some time still. Currently, the historically most profitable cohorts have not risked back on, inefficient miners are leaving the space, and network activity is at new lows. These are all signs of late-stage bear markets. We may have several more months of this (sideways action), especially with more inflation prints on the horizon to continue spooking the markets, but many of the metrics we regularly cover are all showing signs of a possible bottoming.Recommended from Cryptonary


