Save 23% ($351) & Get a Free 1-1 Call with our Team ⏰ : 0d 2h 59m 43s
Weekly Technicals Pro – Vol 100
The Total Market Cap has reclaimed $1.75T once again. We're looking for the lower highs to be broken for a bullish argument, followed by a break above $2T, which should open a path to $2.45. A weekly closure below $1.66T (where the candle closures have formed a base) wouldn't look good and brings $1.35T into play.

Disclaimer: Not financial nor investment advice. Only you are responsible for any capital-related decisions you make, and only you are accountable for the results.
The 100th edition of Weekly Technicals Pro is here!
Total Market Cap

Altcoins' Market Cap
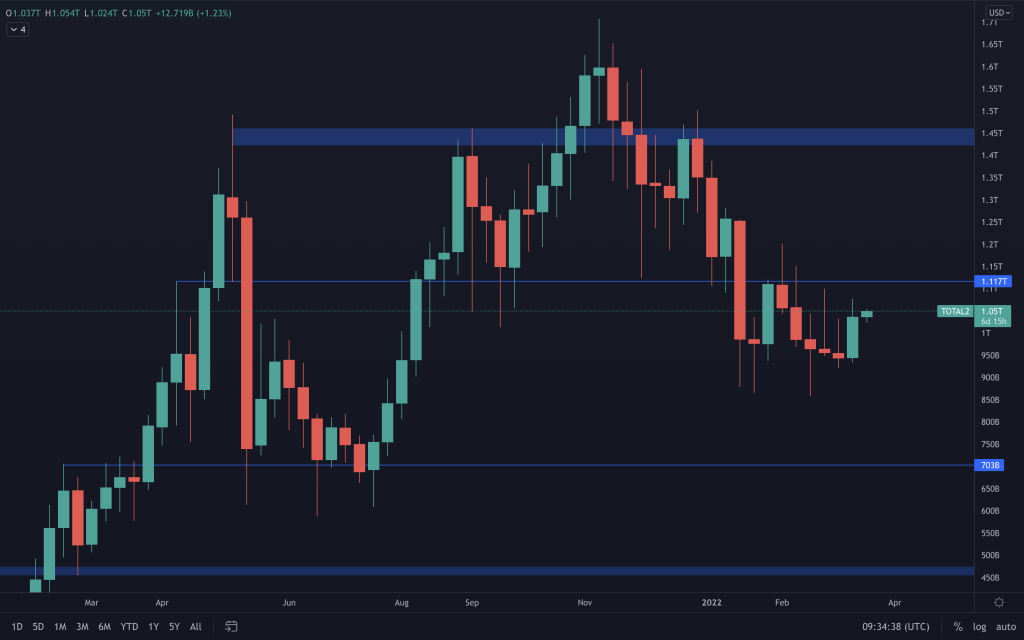
The Altcoins' Market Cap chart is slightly more bearish than the Total Market Cap as altcoins saw more pain inflicted upon them than Bitcoin. Last week's candle closed bullish, which should help the index push up, but it still needs that close above $1.117T to relieve the downward pressure across altcoins.
Bitcoin
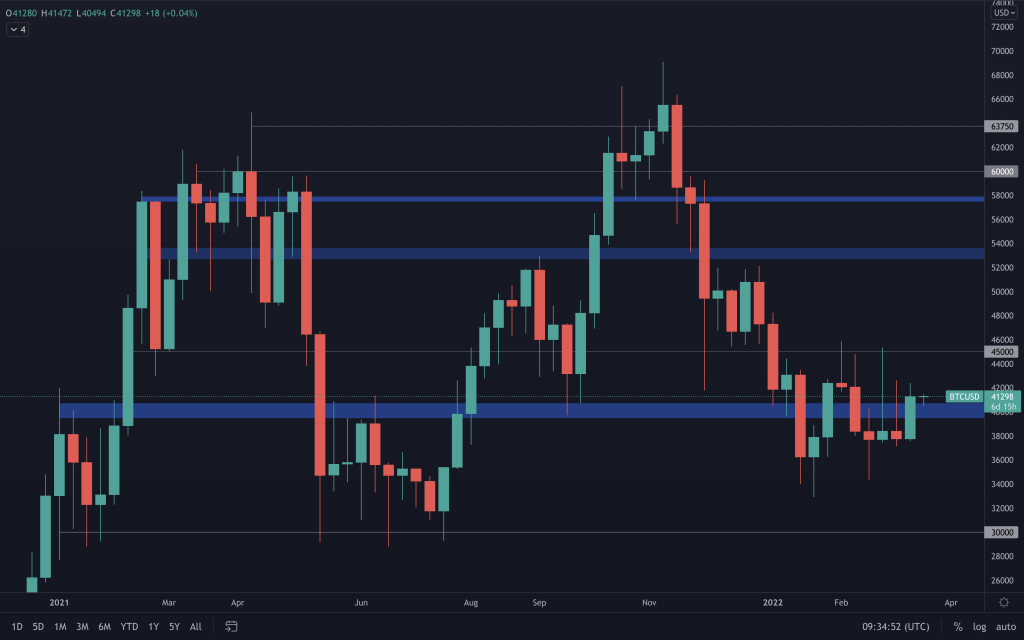
Bitcoin's weekly candle also closed bullish, reclaiming the $40,000 support in the process. The higher lows are still intact, and $45,000 is the line in the sand, where a close above it puts $52,000 and $57,500 on the radar.
Ether
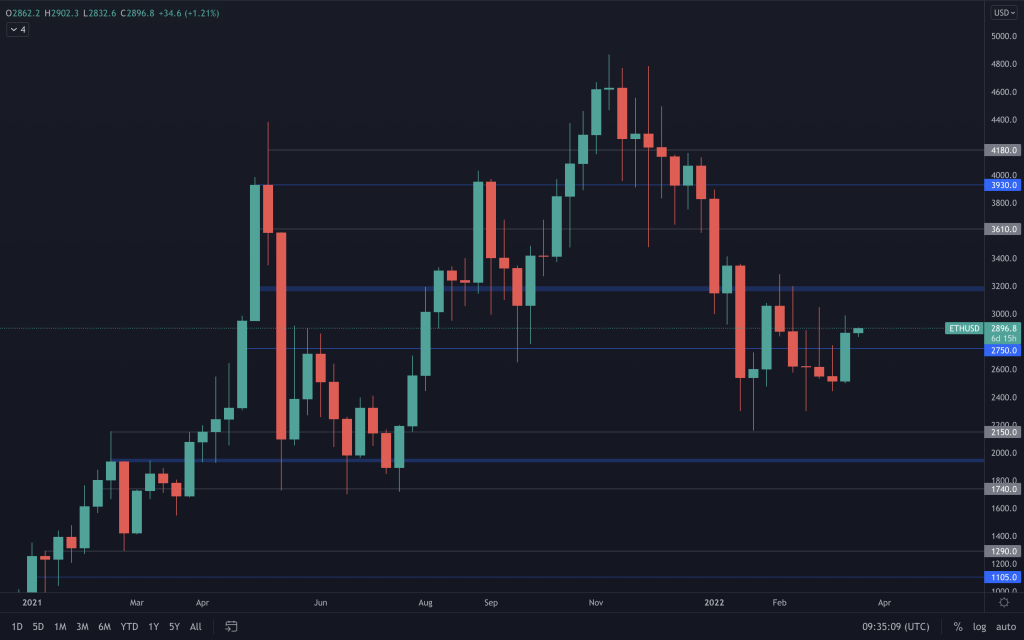
Ether is in a similar position where, as the price hasn't traded below the wick of the previous swing low, it has now confirmed a weekly higher low. This gives way to a possible break to its bearish market structure. The bullish close above $2,750 sets it up for a run at $3,200. Should it close above it, we'd be looking at a higher high, confirming such a break to its structure. Naturally, we have to have invalidation, which would be by creating a new low.
DOT
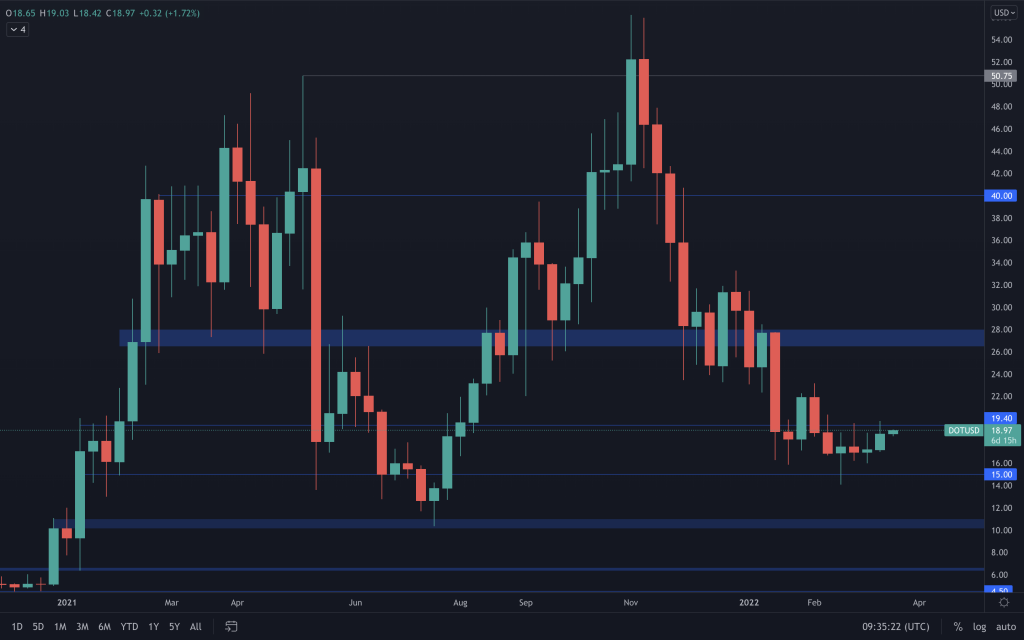
DOT's major resistance at the moment is $19.40. It has been unable to convert it into support, but, as you can see from the chart, it has been tested several times and began to move up with the last candle close. These retests can deplete sell orders that eventually result in price appreciation. Looking out for a daily reclaim of $19.40 should see DOT move further towards $26.50.
SNX
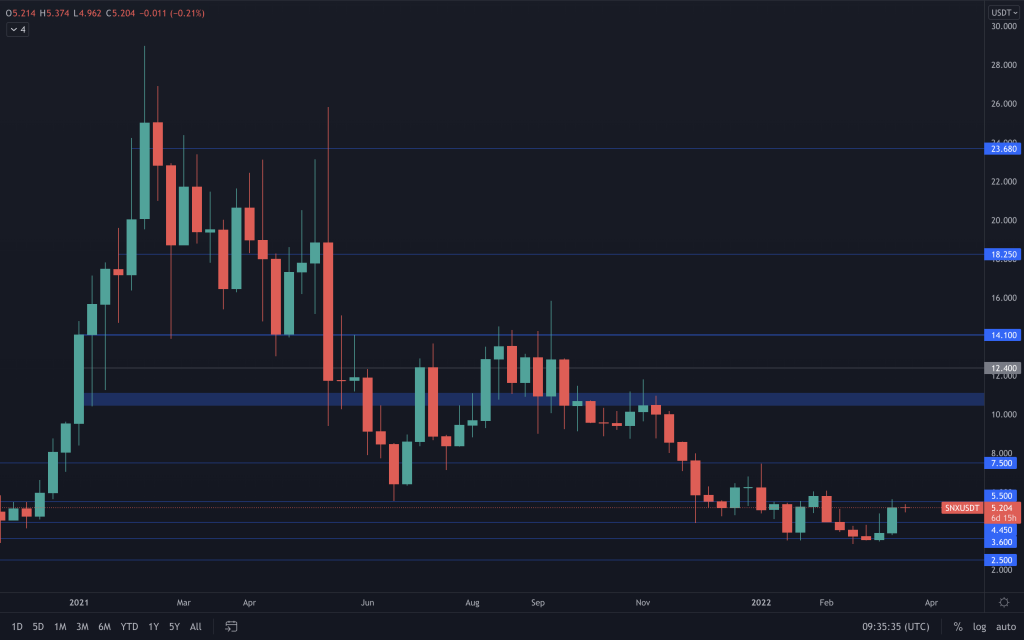
The announcement of Synthetix Perpetual Futures brought about renewed volume and a bullish candle. The next step is for SNX to alter the weekly structure by reclaiming $5.50 and creating a new high above $6. The daily chart shows bullish RSI divergence, a break above the counter trendline and a bullish structure, but there is a little indecision as the price has approached $5.50. When both charts are combined, it's possible for SNX to retest $4.45 (which is also where the broken counter trend line currently lies) and still remain bullish. But it would then need to, at the very least, close next week's candle above this week's close. Otherwise, it would simply have a weekly lower high.
RUNE
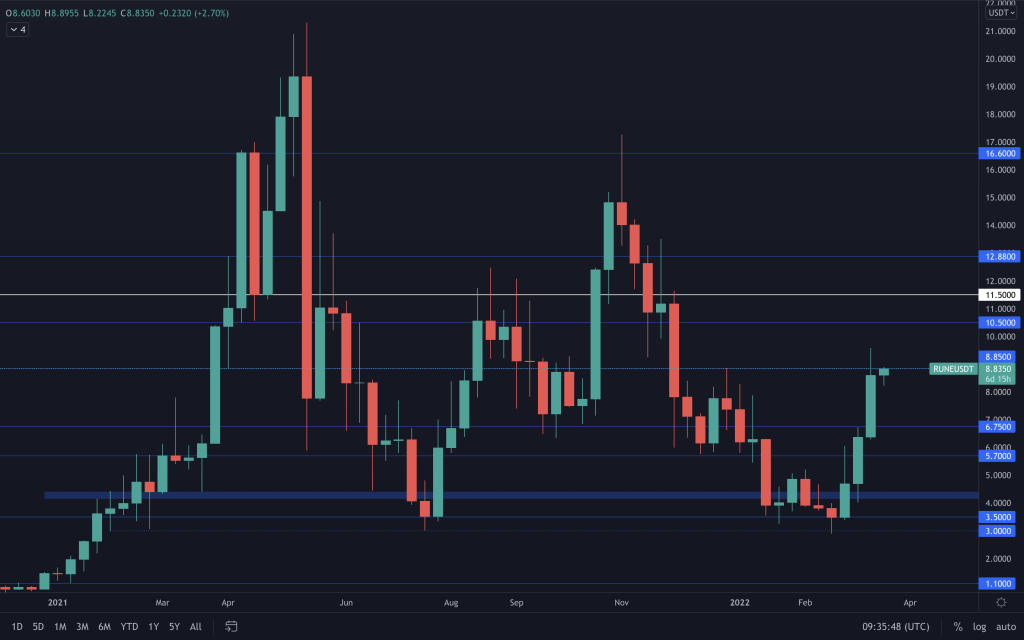
The volume is still there for RUNE as it registers another impressive weekly gain. There has been a slowdown in daily price action as RUNE has approached $8.85. This can be attributed to the fact that RUNE has come up to resistance against both its ETH and BTC pairings. From a weekly perspective, closing above $8.85 means that RUNE should then begin to hone in on $11.50. Failure to do that and support comes in at $6.75. The ETH and BTC paired charts are certainly something to watch!
SOL
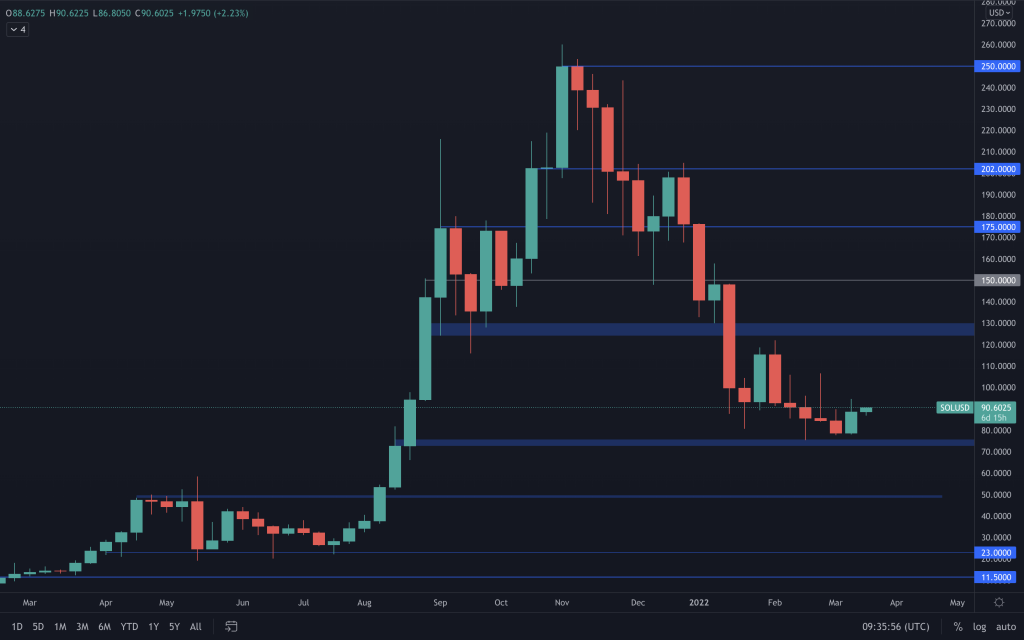
SOL closed the week with a bullish engulfing candle very close to its $75 support. This can often signify that a bottom has been set. SOL has also created a new high on the daily timeframe, suggesting a possible change in market structure there. SOL would only become bullish on the weekly chart, in its current state, by reclaiming $125. One thing to note is the weakness that SOL is still showing against BTC and ETH, meaning that, until it finds/reclaims support, the majors should continue to outperform.
SRM
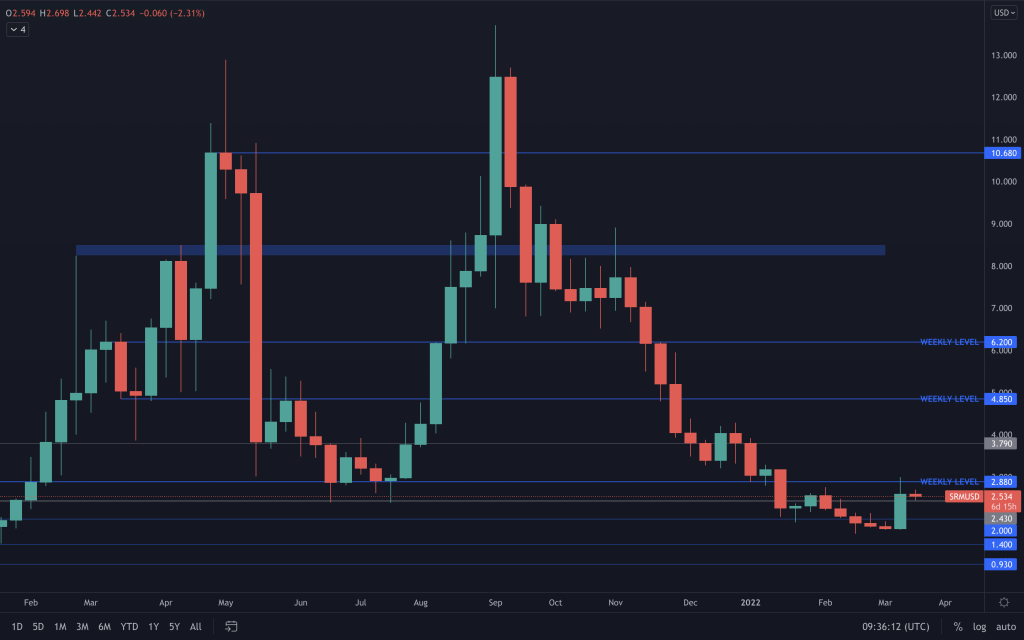
SRM had an impressive three days, pushing through two resistance levels and creating a new high in the process. It has found resistance at $3, where a close above it would open it up to further price appreciation. Unless the majors were to dump excessively, $2,43 should offer it support on the daily timeframe as it has been a key level previously. To add, there is $2 below, and either of these levels acting as support would keep the break to its bearish structure intact.
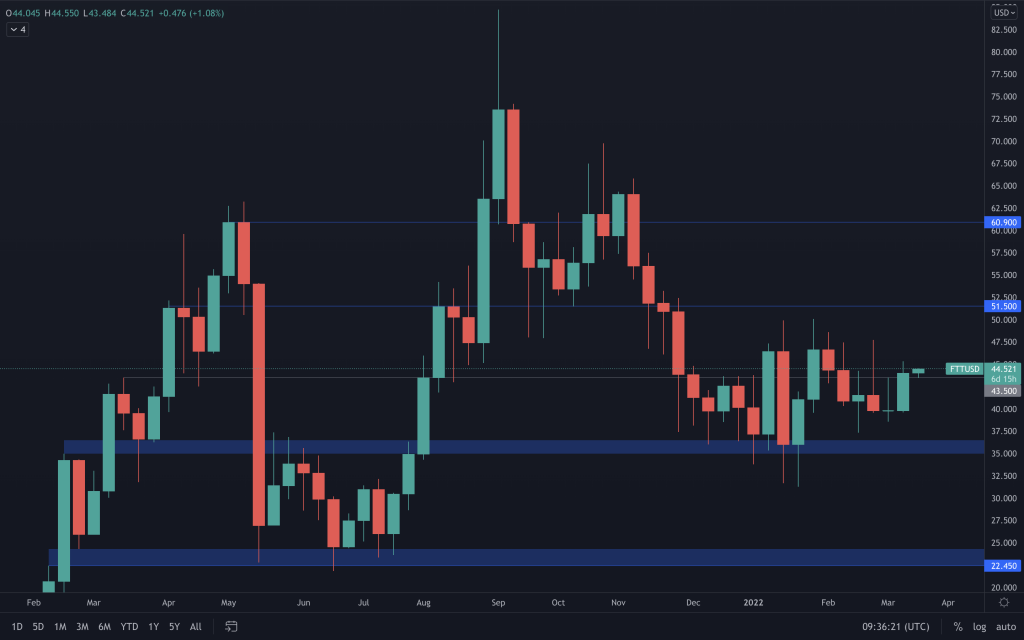
FTT
MINA
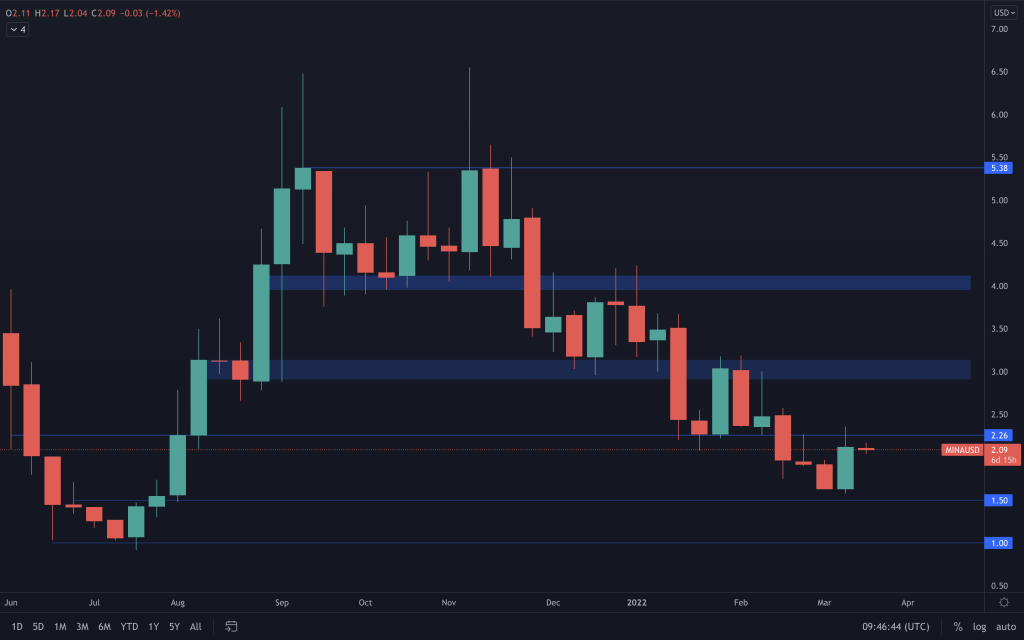
MINA's weekly candle does suggest that it may have set a bottom. It has closed below $2.26, but it is a bullish engulfing candle coupled with increased volume. On the daily timeframe, we shared a counter trendline breakout too. To continue the bullishness, we're looking for a daily reclaim of $2.26 which should then see MINA push up towards $3. As we've mentioned previously, it's a reclaim of the $3 support range that would begin to alter the weekly bearish structure. To make everyone aware, the $2.10 level has been amended to take the latest daily price action into consideration. Adapting the chart to price action with few historical data points may need to be carried out at times to provide the most accurate information to our members.
dYdX
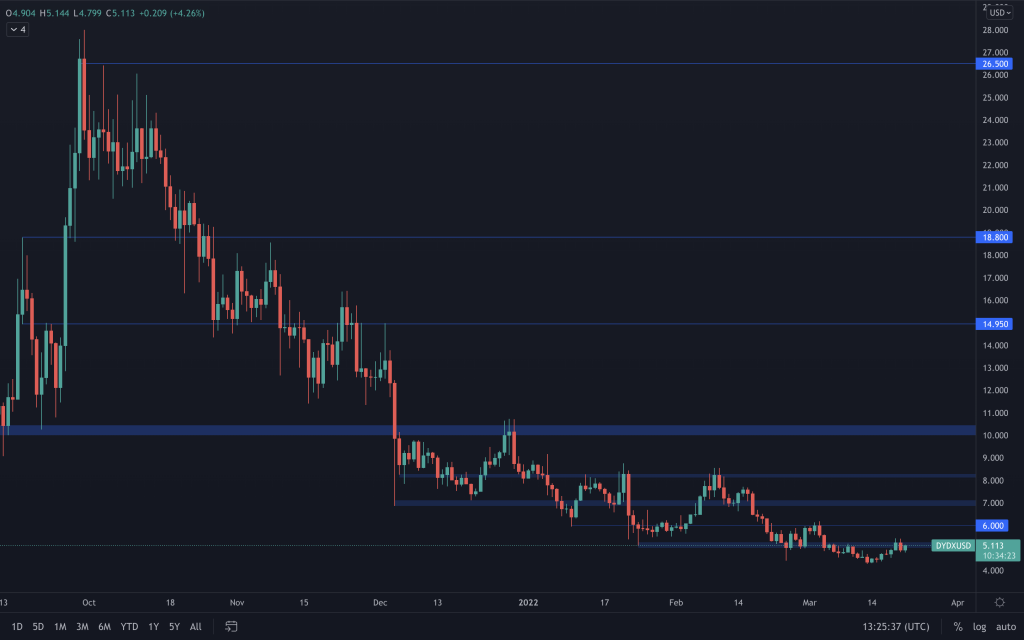
The daily timeframe is used here. dYdX still has a bearish weekly structure and has a long way to go to change that ($8.55). The weekly candle did close bullish and looking at the daily timeframe, we can see that its price depreciation continues to slow, as it is almost moving sideways. Right now, there's no solid indication that the price is about to reverse, but we'll keep an eye out and update you should anything change.
Recommended from Cryptonary


