Save 23% ($351) & Get a Free 1-1 Call with our Team ⏰ : 0d 2h 59m 44s

Disclaimer: Not financial nor investment advice. You are responsible for any capital-related decisions you make, and only you are accountable for the results.
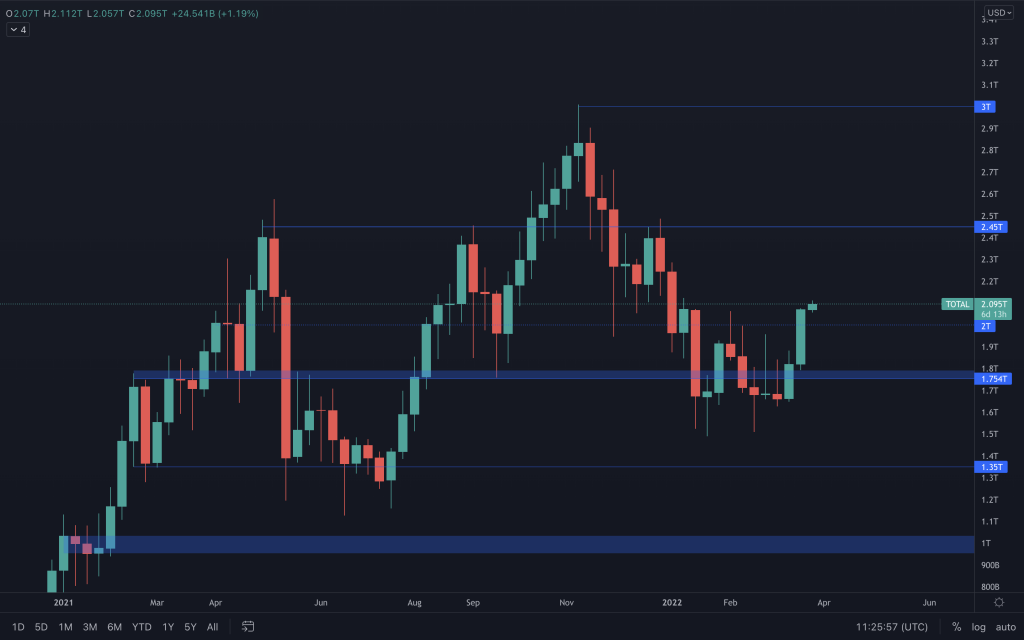
Total Market Cap
Altcoins' Market Cap
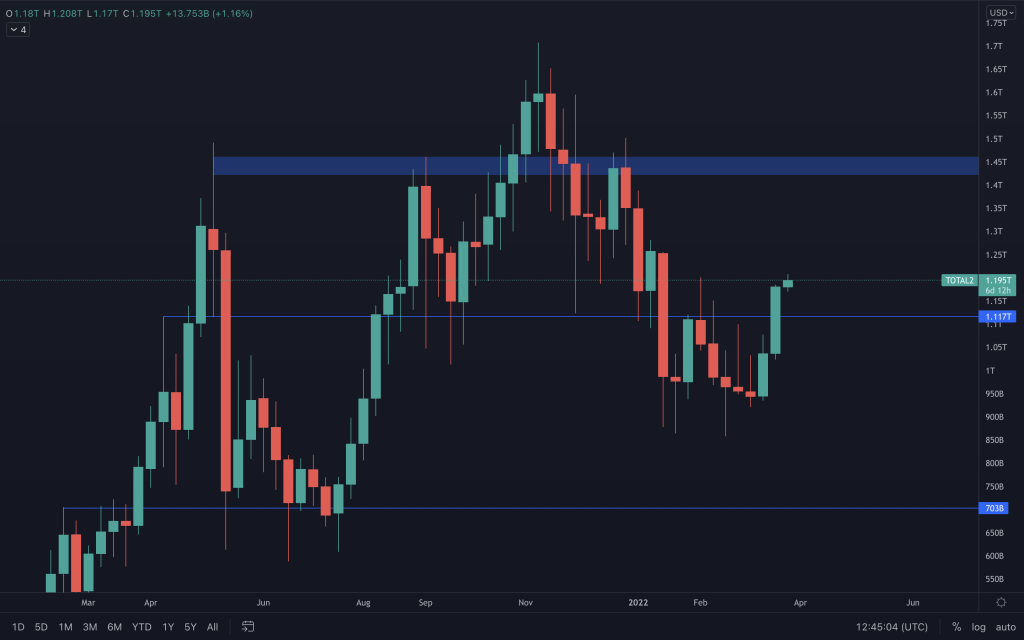
That nice green close above $1.117T that we've been looking out for, flipping it into support, and $1.45T becomes the next overhead resistance. Altcoins have been somewhat suppressed (seeing more pain than Bitcoin) throughout the uncertain range that Bitcoin has been in of late, so we should, at least, begin to see somewhat of a relief rally for alts.
Bitcoin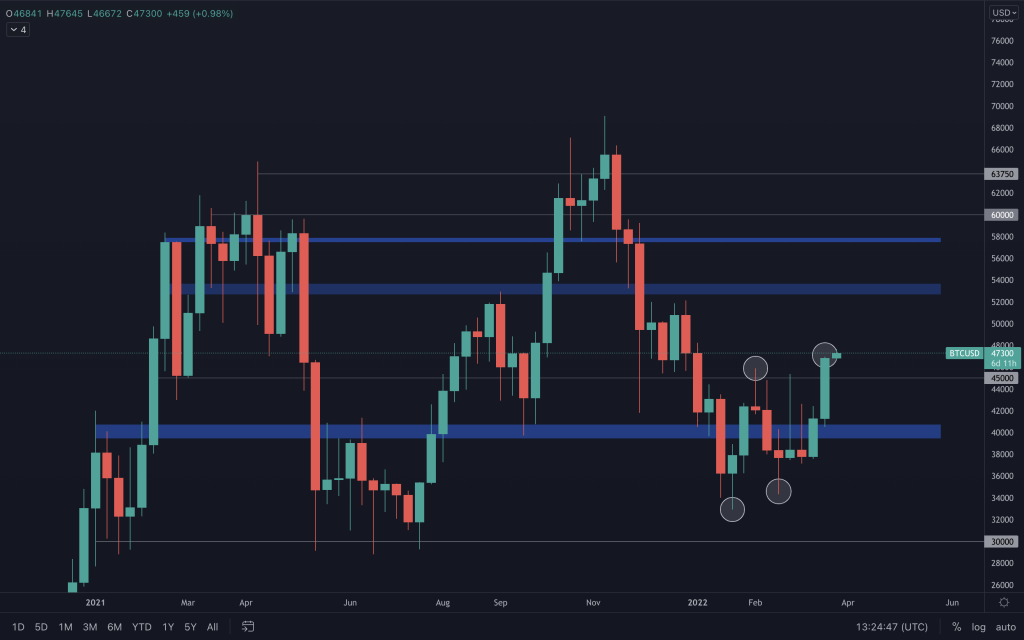
We were looking toward this being the outcome since we noticed Bitcoin's subtle hint of a change in market structure back at the beginning of February. $45,000 is finally turned into support. Leading us into a potentially bullish second quarter.
Ether
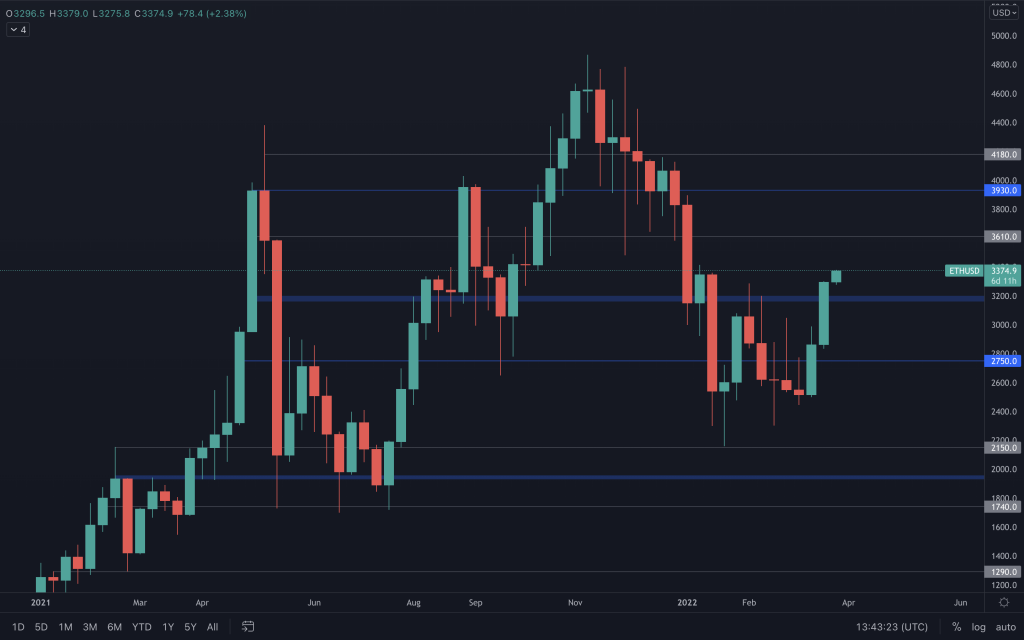
Two strong weeks with a key level turned into support on each of those weekly closes. This next level is in sight, which would be around $4,000.
DOT
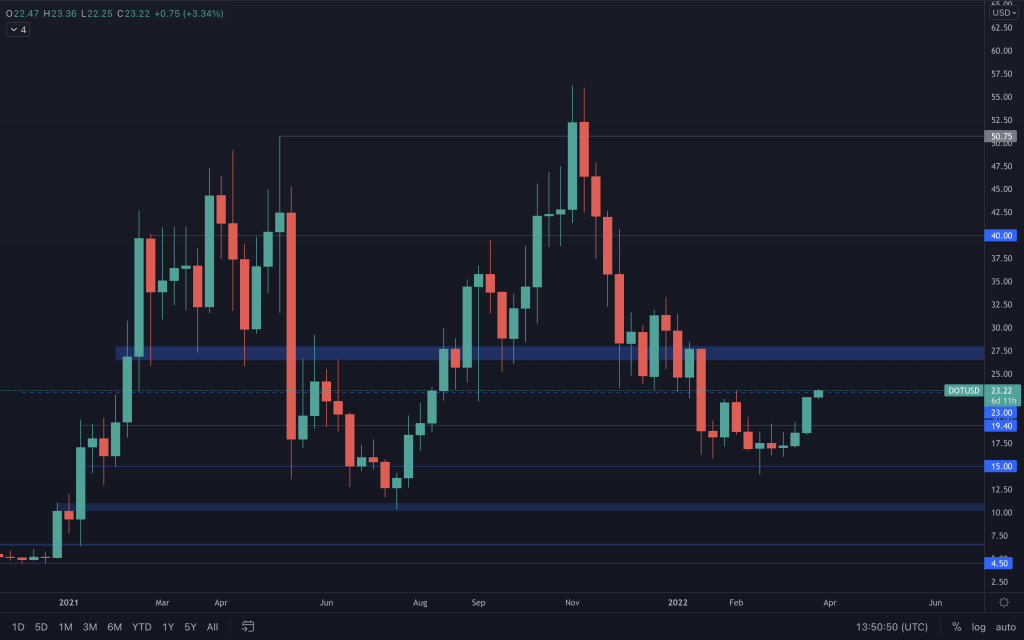
DOT closed the week out strongly, not even leaving room for a wick above. It's about to register a change in its bearish market structure to bullish, and $26.50-$28 isn't too far away. Turning that level into support brings $40 back into play.
SNX
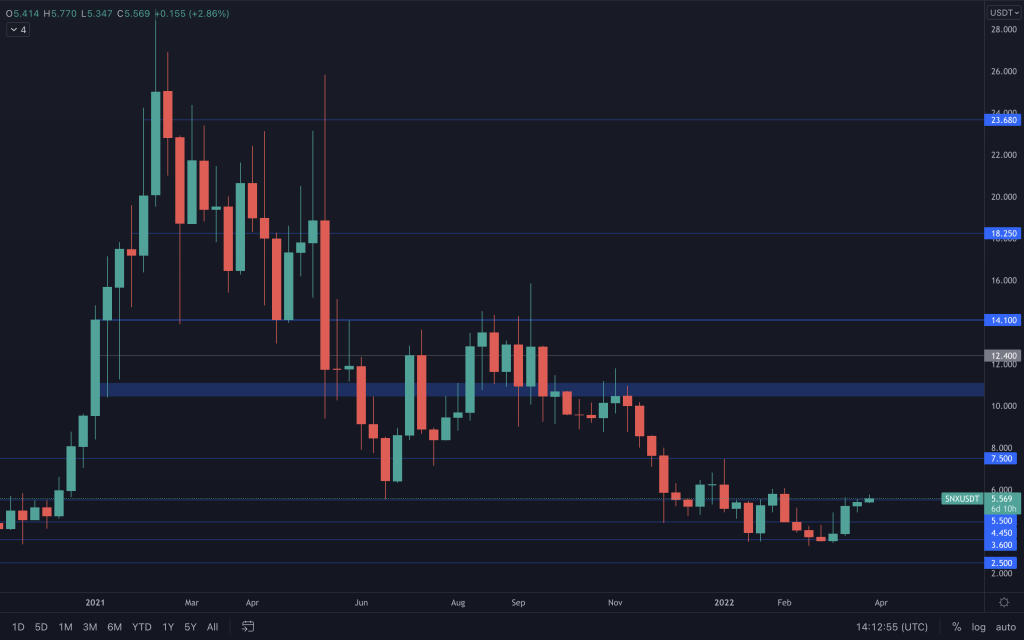
SNX had a relatively slow week as its price hung around $5.50. The daily structure hasn't yet indicated weakness as the price continues to appreciate slowly, testing $5.50 multiple times. Trading above the previous lower high should then see SNX head in the direction of $7.50.
RUNE
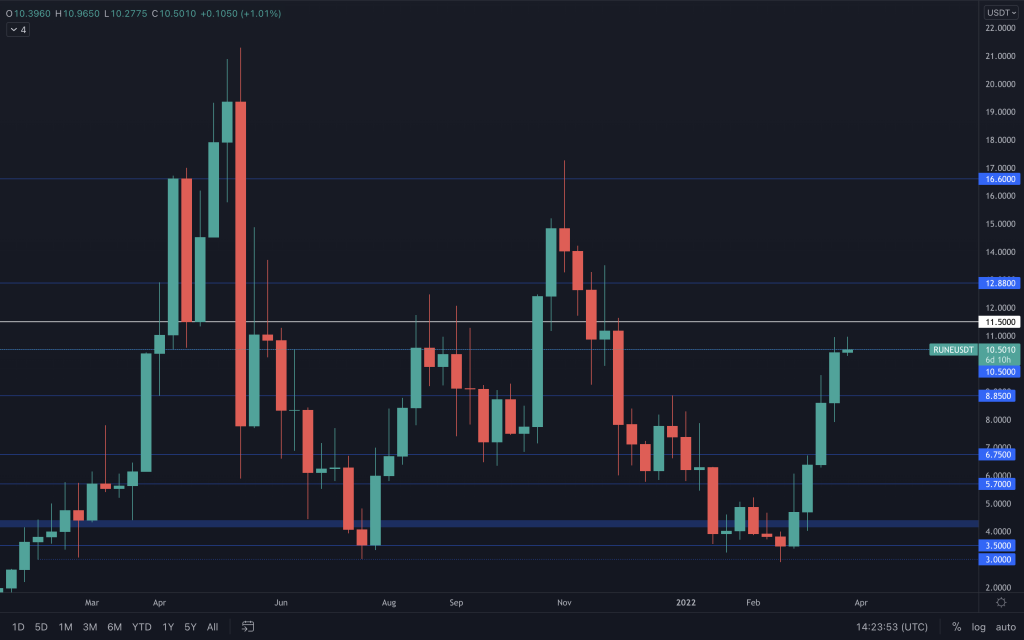
As we've mentioned previously, the pump for RUNE is based purely on fundamentals (which is obviously why we are invested in the first place). The question is, are there any salty bagholders who bought at the highs and rode it to the lows, and if so, where would they likely place their sell orders? The answer is probably close to $11.50. This is not an issue if demand immediately outstrips supply, and, as we can see, RUNE has seen a huge demand all the way up from $3. It's only something for traders to consider and monitor, as they are the ones who have a shorter-term vision when compared to investors. As for the daily timeframe, there's no weakness shown in the RUNE chart.
SOL
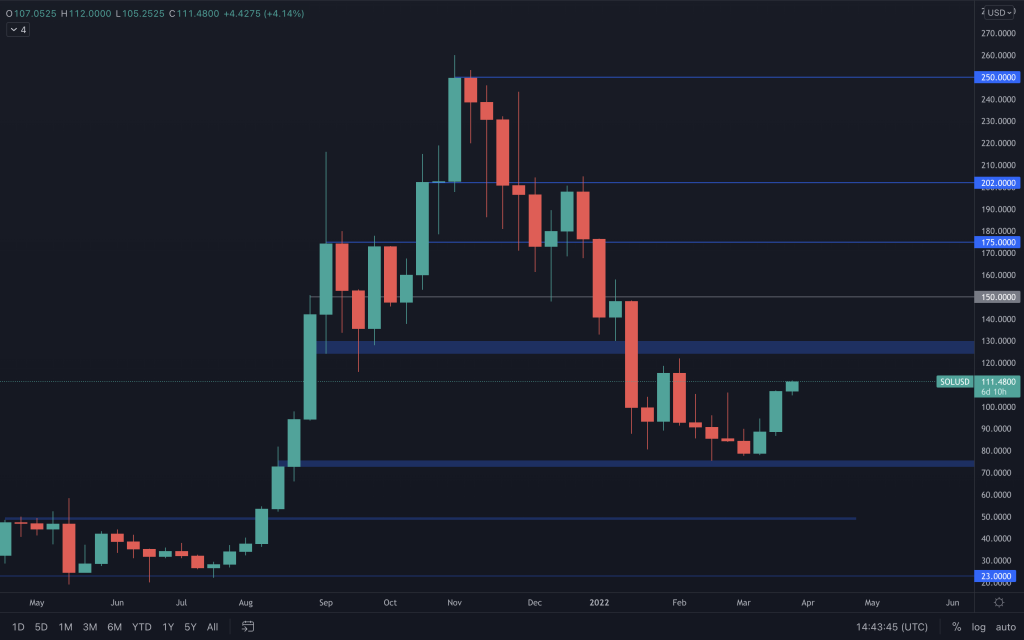
The breakout of the counter-trendline has served us well. $120 remains on the cards where we'll be looking out for a change in SOL's market structure from a weekly perspective.
SRM
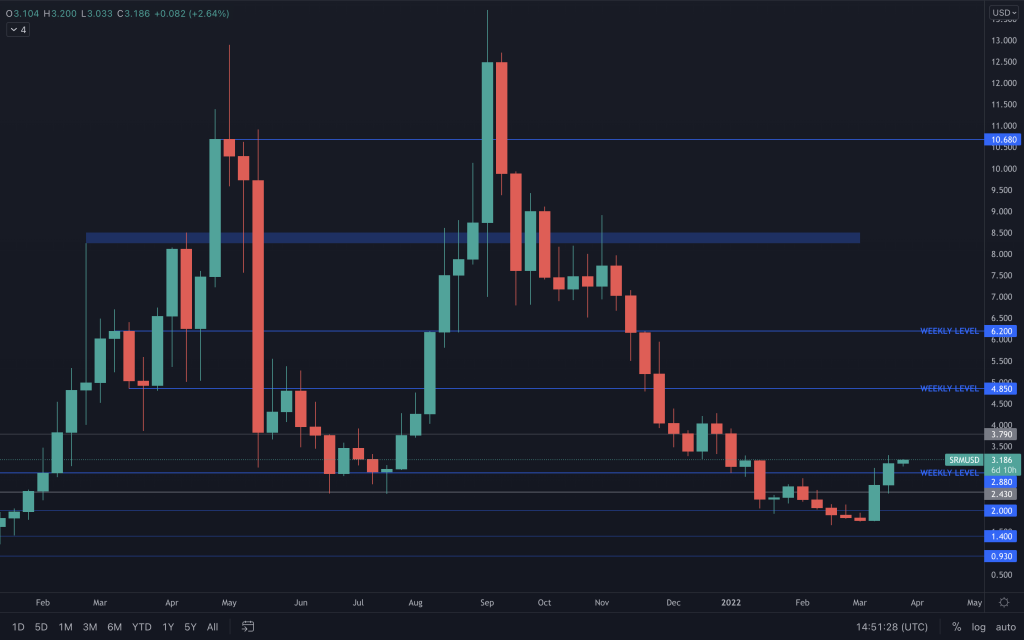
It's fair to say that SRM is looking in a much better position than two weeks ago! It now has the beginning of a weekly change market structure and a close above $3, putting $4.85 as the next stop.
FTT
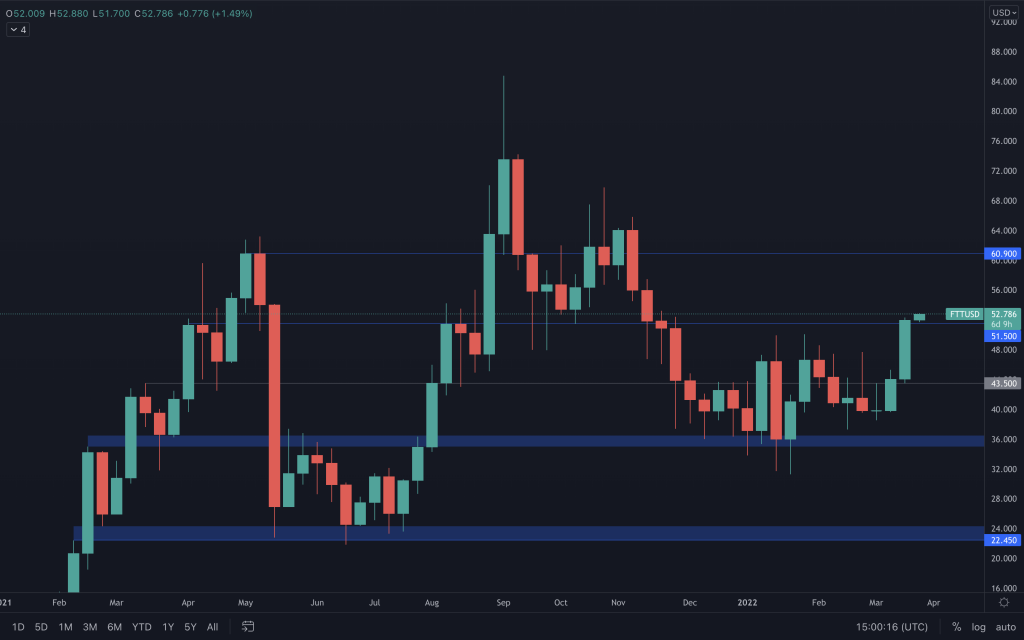
Consolidation since December and now the highest weekly close since the beginning of November. Couple that with a breakout of the $35-$50 range, FTT looks in a strong position to make a move on $60 and beyond. Taking it one key level at a time, $60 is next.
MINA
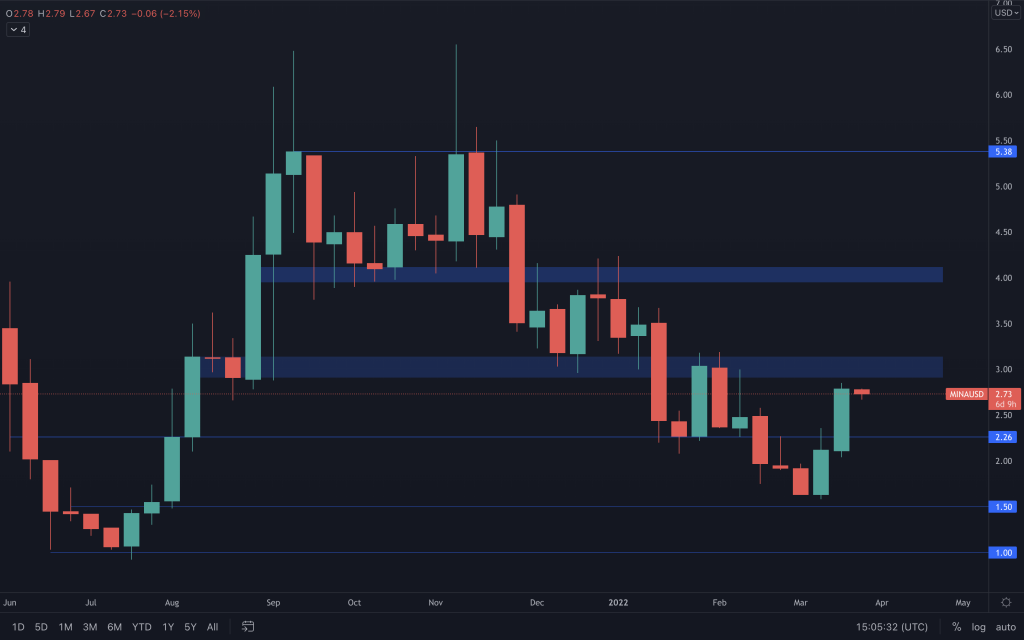
Last week's expectations seem to have played out perfectly. The weekly bullish engulfing candle to couple the counter trendline breakout played out well, with MINA advancing on $3. Now we look to whether it can continue to push up and reclaim the $3 resistance range. There's no indication yet to suggest that it can't.
dYdX
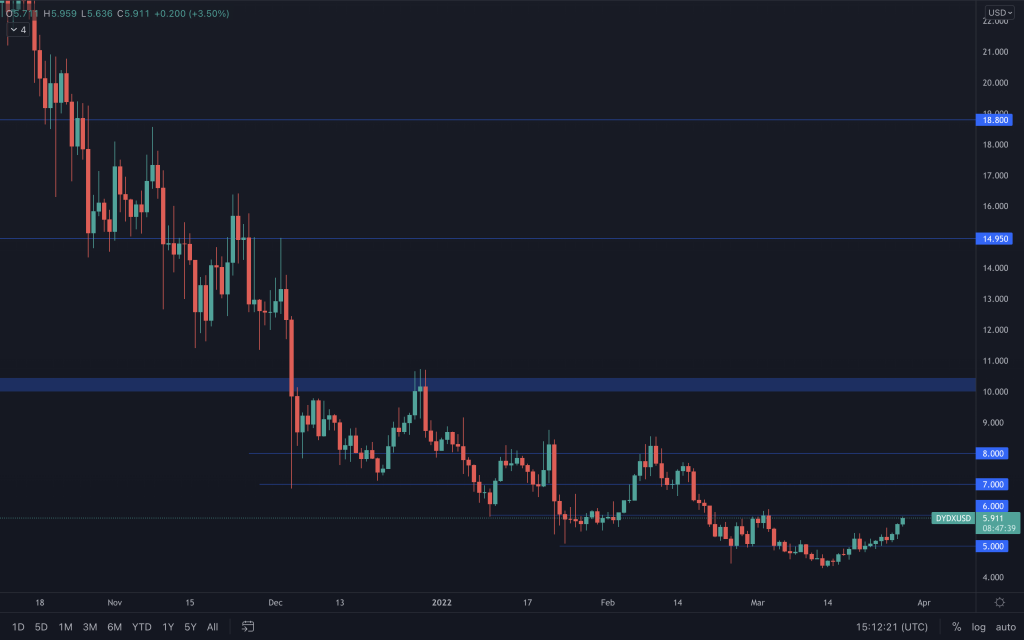
Daily timeframe
We see advances all across the market, and dYdX is no exception. It's continued to move up, and levels are to the nearest dollar. $6 is significant as the market will view it as the last lower high. So if dYdX can manage to trade above there and create a new high, then $8 looks likely.
Recommended from Cryptonary


