Save 23% ($351) & Get a Free 1-1 Call with our Team ⏰ : 0d 2h 59m 44s
Weekly Technicals Pro – Vol 102
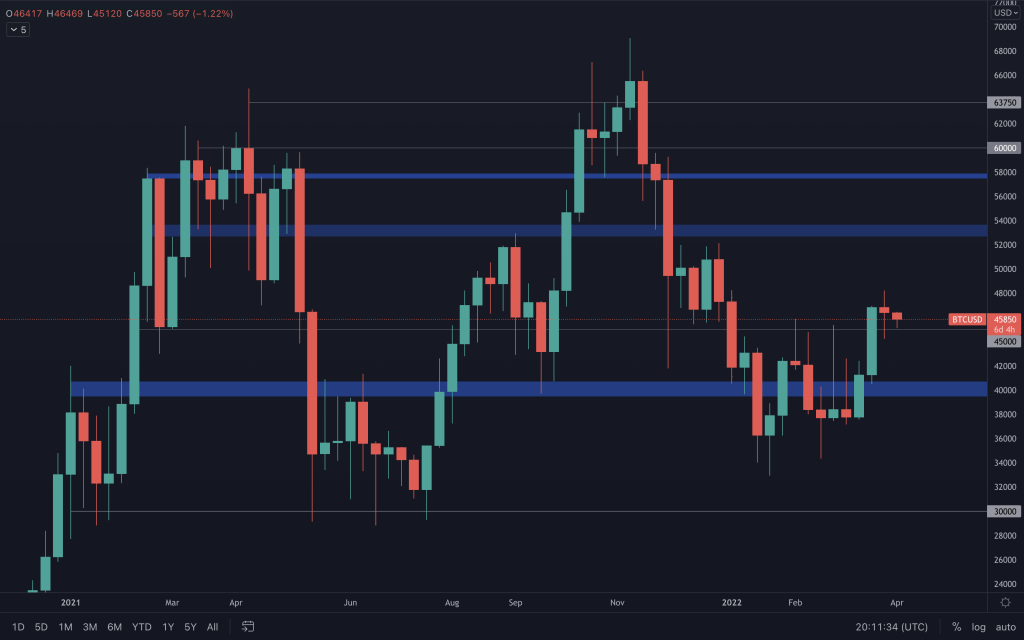
Bitcoin has slowed since regaining $45,000 as support, evident in both the daily and weekly candles. From a daily perspective, it appears to be nearing a decisive point where it can either break up through its counter-trendline or down below $45,000 support. This is what we are looking out for to indicate the next move of Bitcoin.

Disclaimer: Not financial nor investment advice. You are responsible for any capital-related decisions you make, and only you are accountable for the results.
Total Market Cap
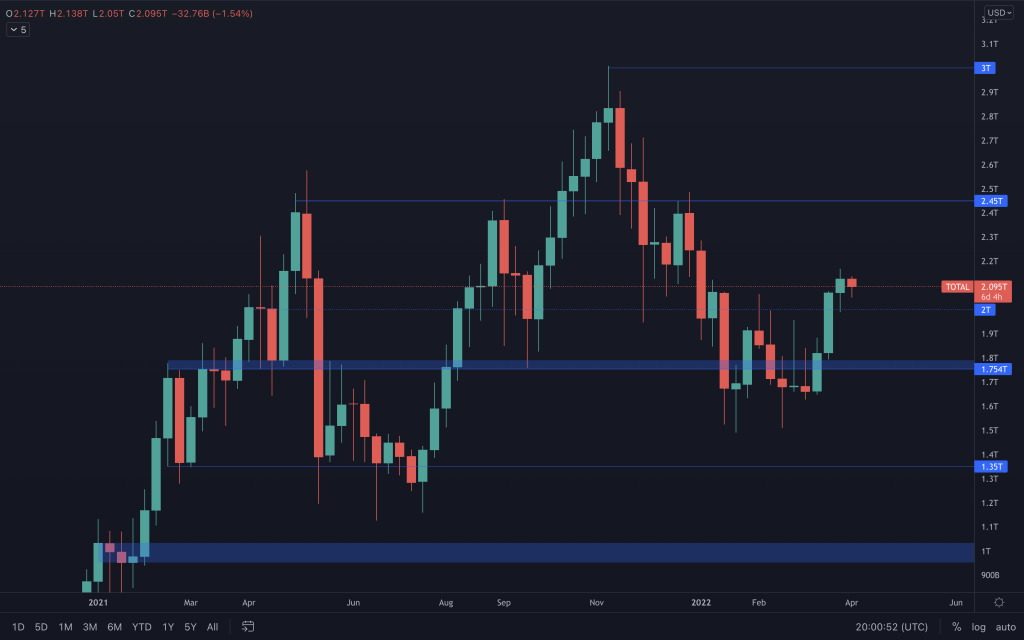 The Total Market Cap closed green once more and remains above $2T. Looking at the daily timeframe, we can see the index is moving sideways, and we can put that down to Bitcoin's lack of action around $45,000 recently.
Bitcoin
Ether
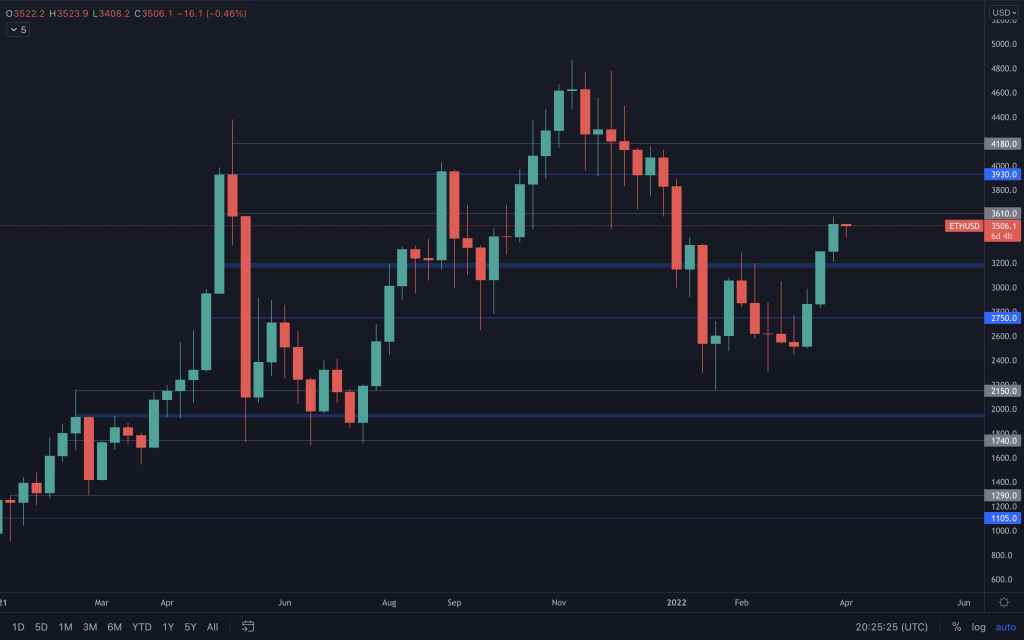
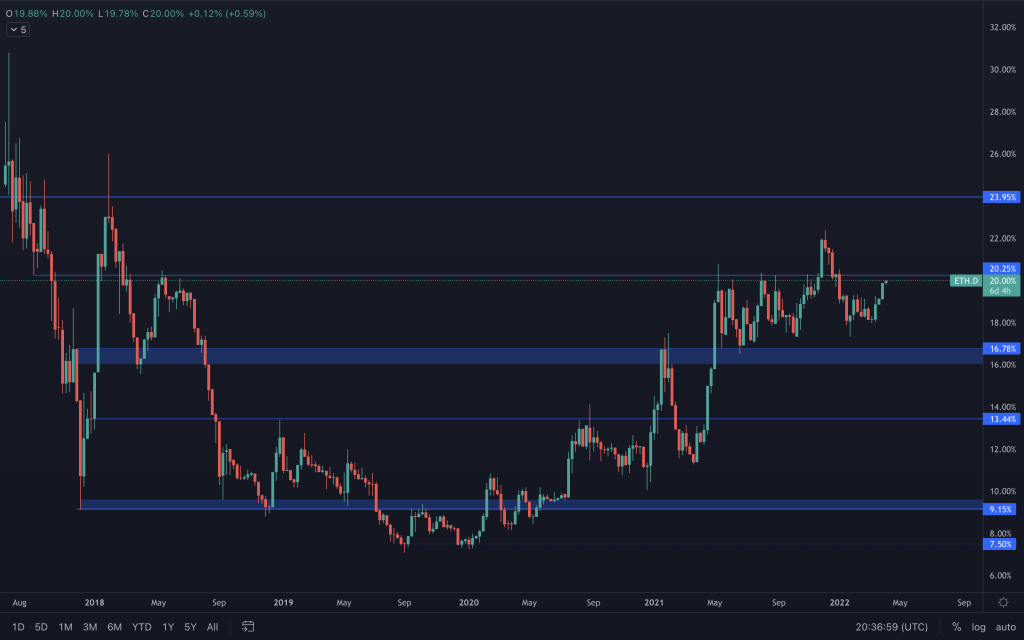
Ether had a better week than Bitcoin, clearly shown in the ETH/BTC chart. The daily ETH chart also looks in a much better shape, with the bullish structure intact and Ether en route to $3,600. One thing to note is that Ether's dominance (see below) is approaching a key level (20.25%), so we'll be closely watching the reaction at this level as it should indicate what to expect next in Ether's price action.
ETH Dominance
DOT
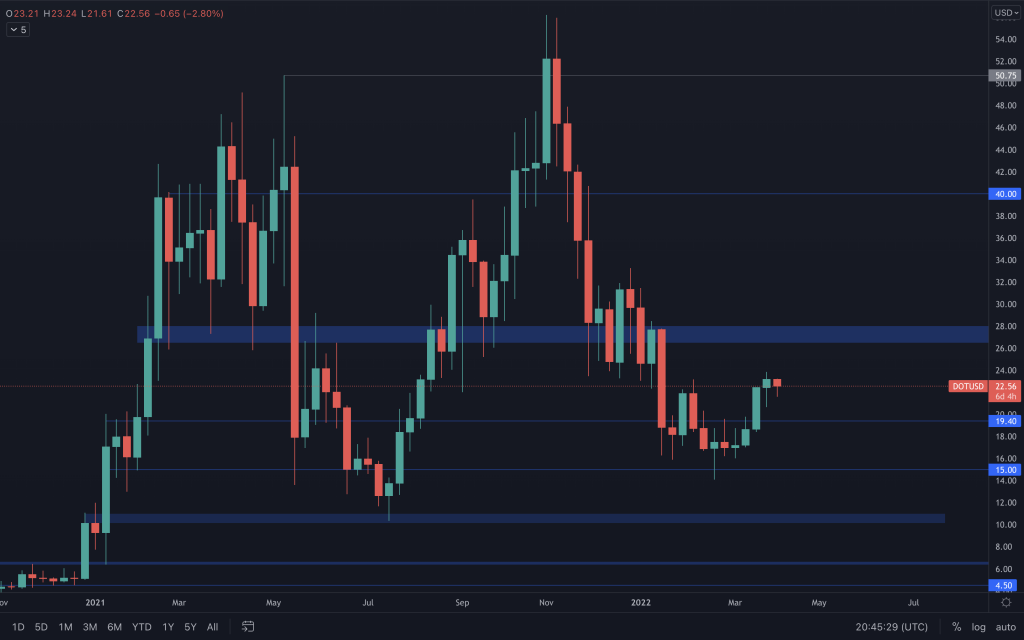
DOT finally got that weekly higher high, and although it has struggled with $23, it managed a weekly close above it. This should begin to lead DOT up towards $26.50.
SNX
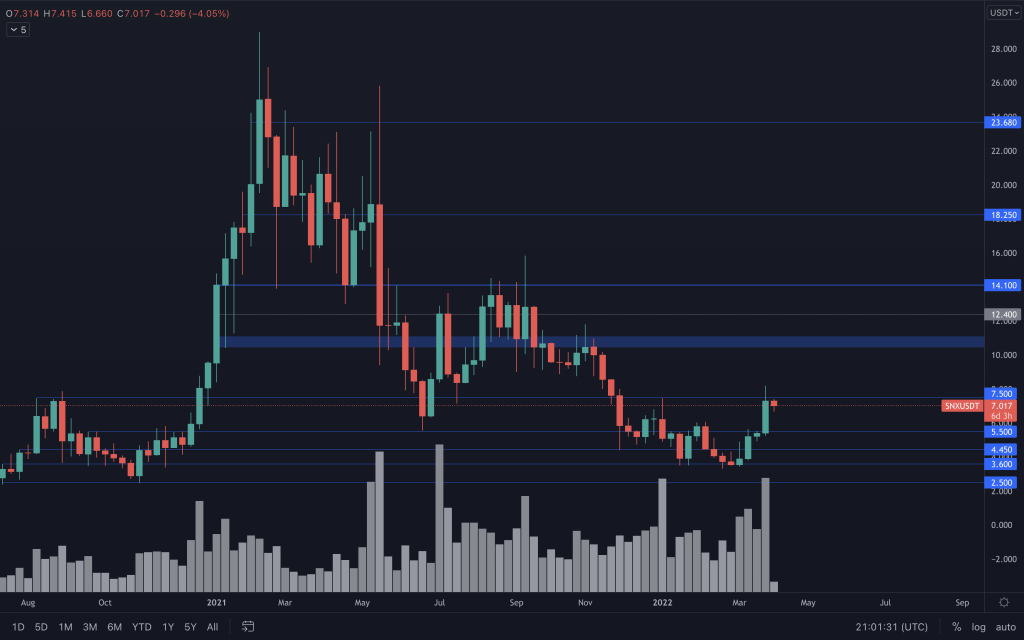
SNX looks in good shape, with every price increase accompanied by increasing volume. It had a daily close above $7.50, but, at the same time, the RSI was within the overbought territory, giving the possibility of a pullback in price, which is what we're seeing now. There is still an obvious bullish daily structure, and the next step for SNX to take is getting a daily closure above $7.50. That should then take it into double figures.
RUNE
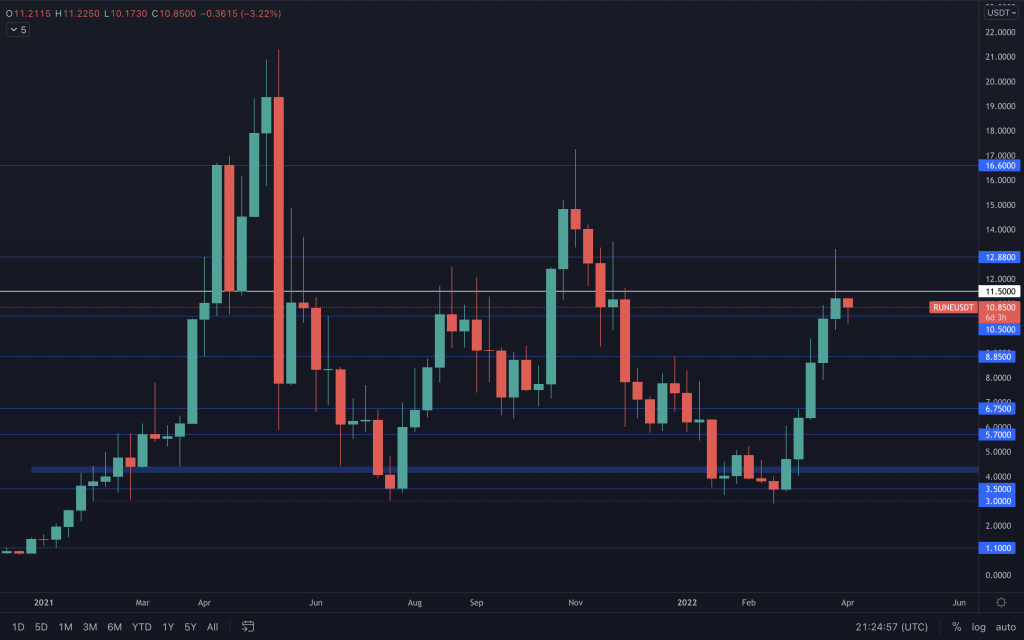
RUNE has had an impressive run all of the way from $3, similar to back in the middle of 2021. Back then, we can see that $11.50 was an important level, which remains the case nowadays. Last week's candle closed bullish but did fail to close above $11.50. The RUNE/BTC and RUNE/ETH charts are both at support. So, as long as these levels hold and the majors play fair, RUNE's run may not be over.
SOL
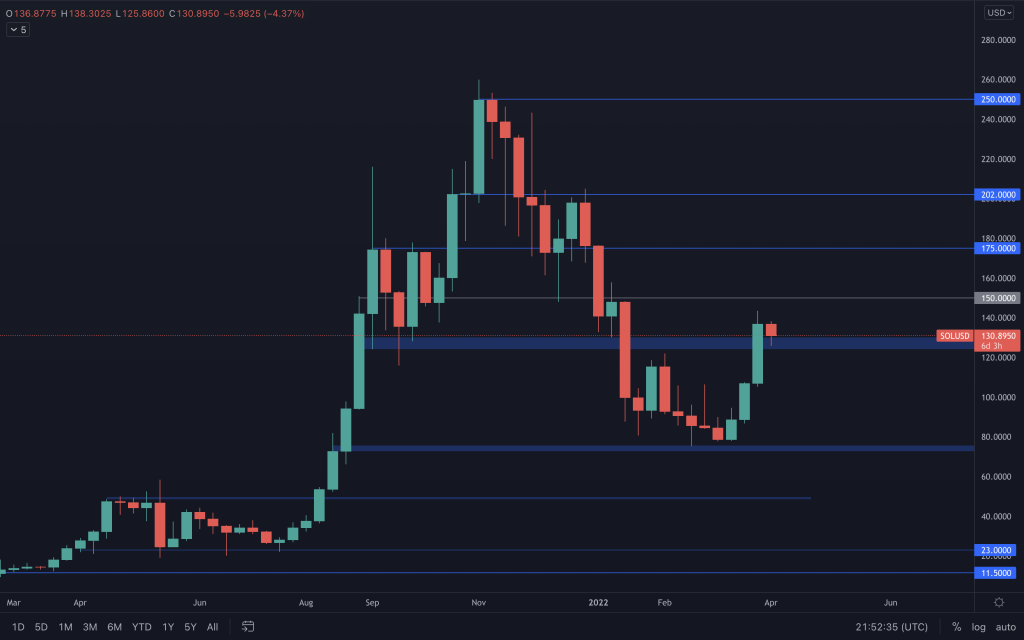
SOL's price has pierced through $125 with a weekly candle close above it. There is still a danger of downside from the SOL/ETH chart, so far, rejecting resistance. The 8H SOLUSD chart has also created a lower low, albeit at support, so this is certainly something to watch in the short term.
SRM
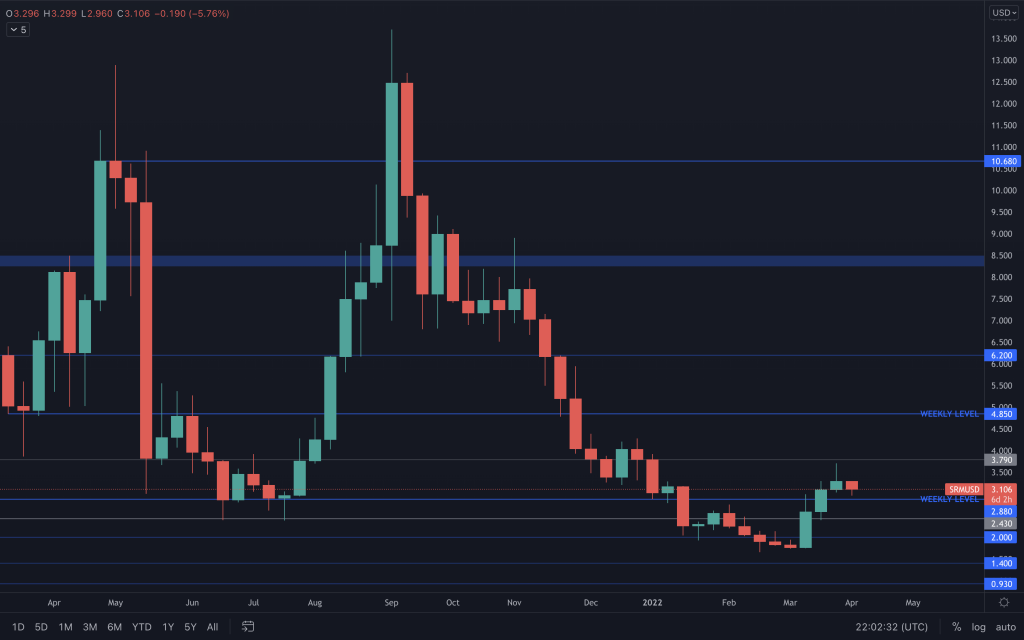
Volume has been creeping in for SRM with each price increase. Once again, it's worth mentioning that SRM is near resistance on both its BTC and ETH pairings, so we may see the majors outperform it for now.
FTT
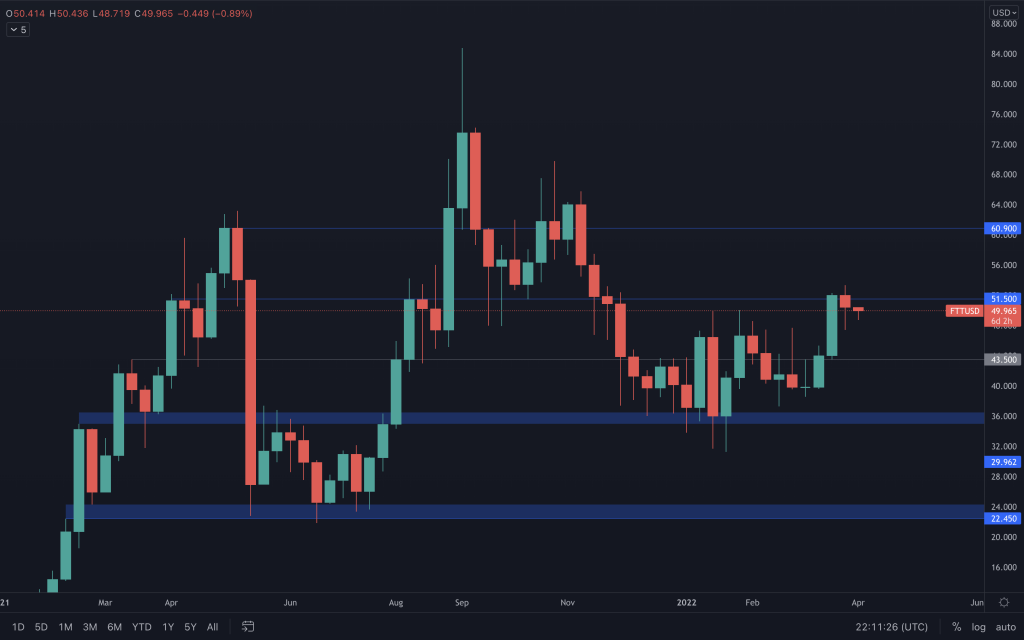
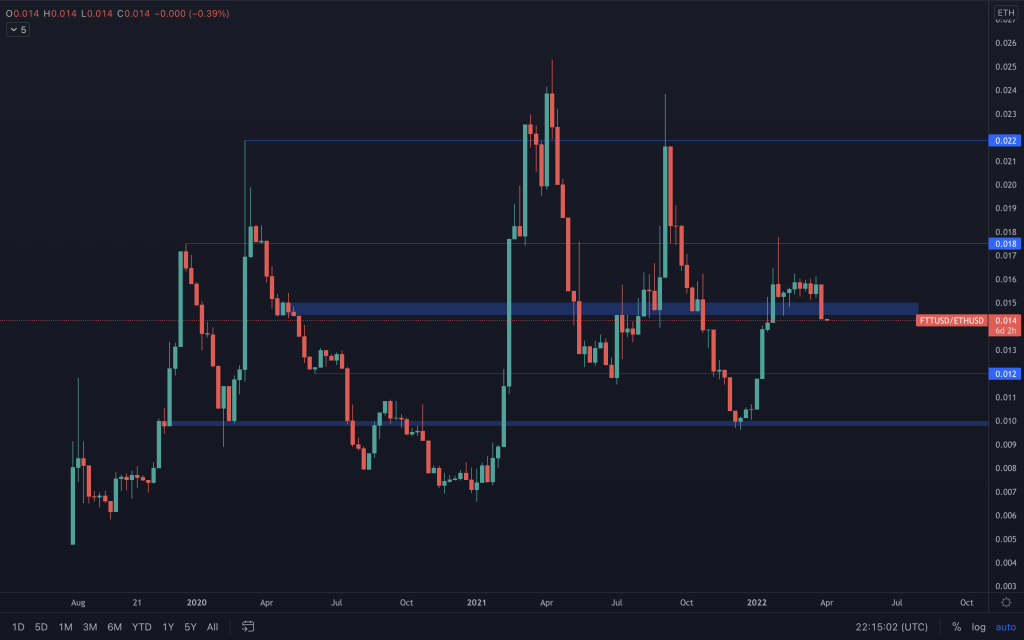
The prior week's candle closed just above the $51.50 level. However, FTT could not sustain the strength it had shown and closed back within the $35-$50 range. We also mentioned yesterday that we would include the FTT/ETH chart within the analysis. Well, here it is. What can we take from it? FTT/ETH has closed a strongly bearish candle below its support level. This, at least, points towards ETH outperforming FTT for the time being. Of course, if ETH were to dip in USD value, we'd then expect to see FTT's USD value perform even worse.
FTT/ETH
MINA
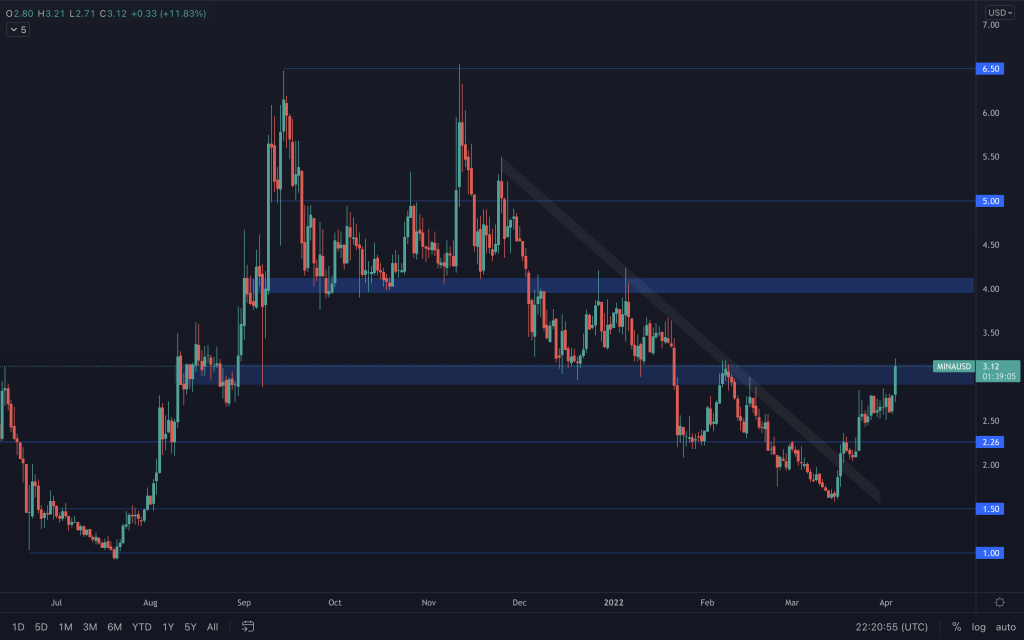
(daily chart used)
MINA is now having a bash at getting above $3.15. If it can get a close at that price, that would certainly look good. It would begin to alter the bearish market structure (it would still need a higher low to confirm it), which should then set it up for a run at $4!
dYdX
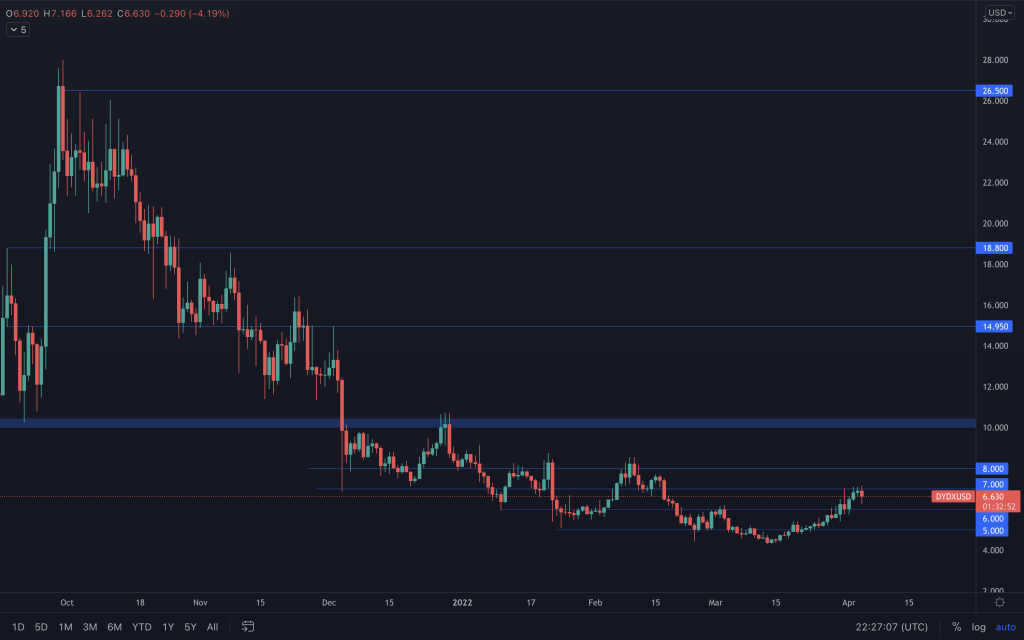
dYdX is still having trouble reclaiming the $7 level as it faces resistance across all charts (shared in pro yesterday). So what we're looking out for is dYdX to turn these levels into support by a daily closure, which would then see it head close to $10. Of course, like many of the charts facing resistance, unless it can cross these resistance levels, we look towards supports below to act as support, keeping the newly formed/potentially bullish structures intact.
Recommended from Cryptonary


