Save 23% ($351) & Get a Free 1-1 Call with our Team ⏰ : 0d 2h 59m 44s
Market Analysis

Disclaimer: Not financial nor investment advice. You are responsible for any capital-related decisions you make, and only you are accountable for the results.
Total Market Cap
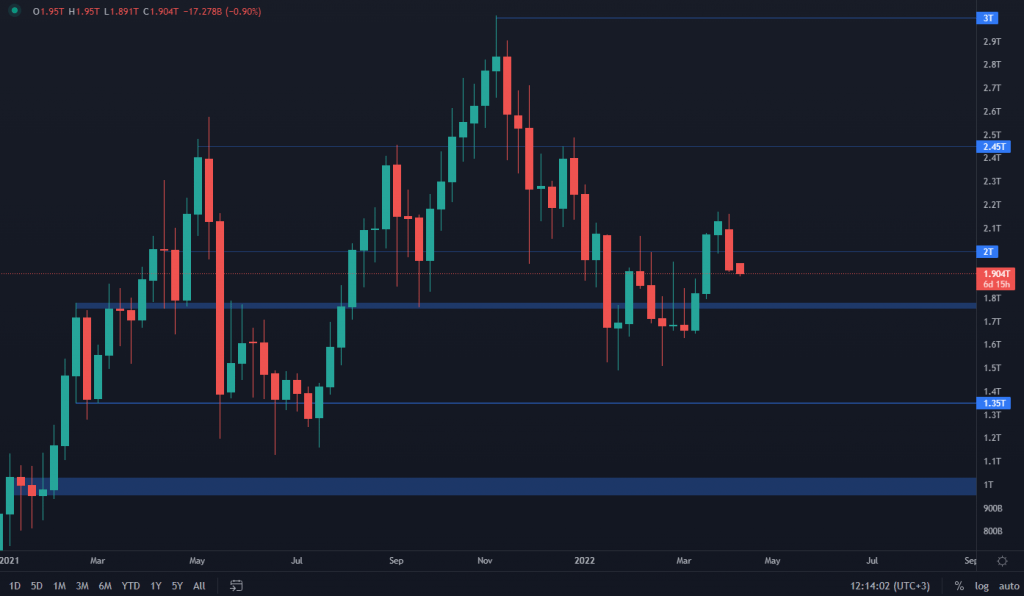
The Total Market Cap's situation changed as it formed a bearish engulfing candle upon weekly candle closure. This puts us on a path back to $1.8T, which is also in confluence with BTC's current price action, as it is on its way to test $40k. An invalidation of a $1.8T test here would be a $2T daily reclaim, for which we have no sign of happening. That can change as we head closer to the end of this week.
Bitcoin
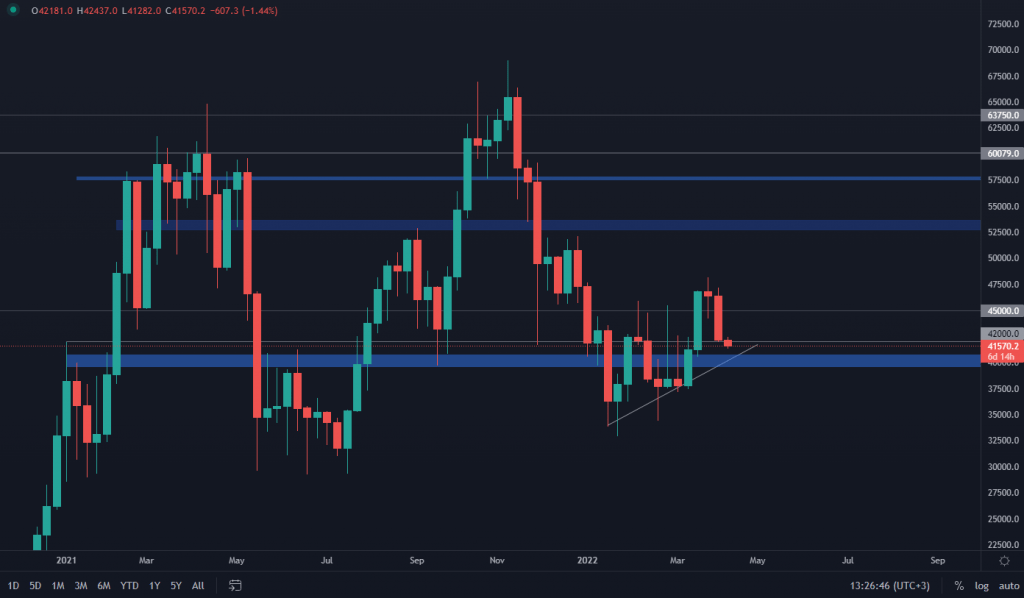 Bitcoin also formed a weekly bearish engulfing candle, which puts us on track for $40k, as we were already expected since the loss of $45k on the daily timeframe, something we included in our Daily Analysis. A reaction is almost certain once price reaches $40k, as it remains the decisive point between further downside or further upside/sideways movement. $42k is also a really important higher timeframe price level - a weekly closure above $42k would now form a higher low, which would put us on track for a higher high above $47k. Because we closed the week just barely above 42k, then this still applies. The bearish engulfing candle can't be ignored however, so overall, we are still on track for $40k.
Ether
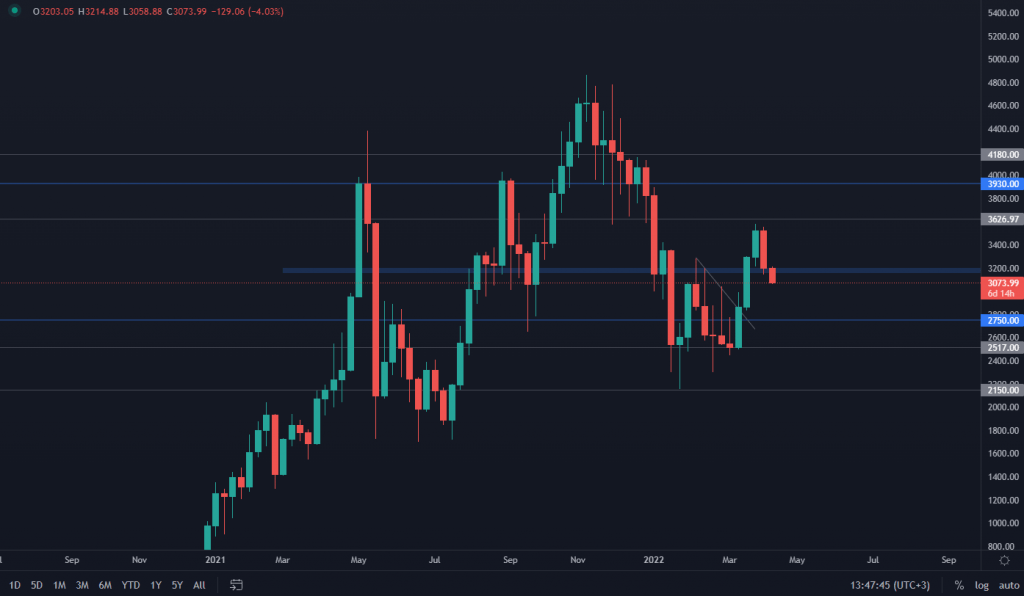 Ether closed the week above $3200, which means it is still looking bullish. Only reason price has dropped back to $3070 is due to BTC's price action. ETH still remains significantly stronger than BTC, as can also be seen on the ETH/BTC chart and the ETH Dominance Chart. Unless price isn't able to close the week above $3200, then $2750 might be on the cards. We will continue to monitor the price as the week progresses.
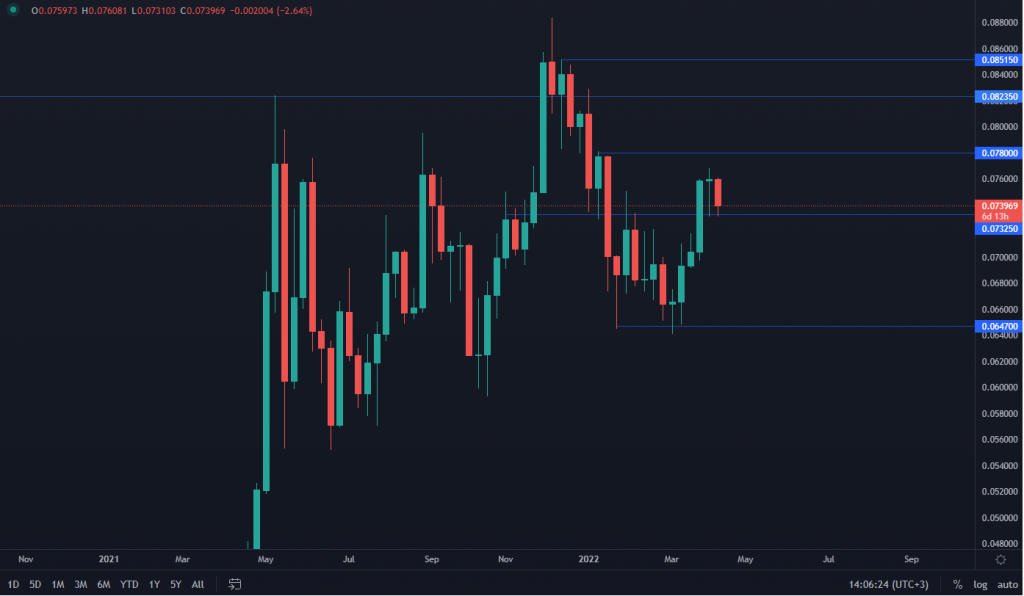
ETH/BTC Chart
 DOT
DOT
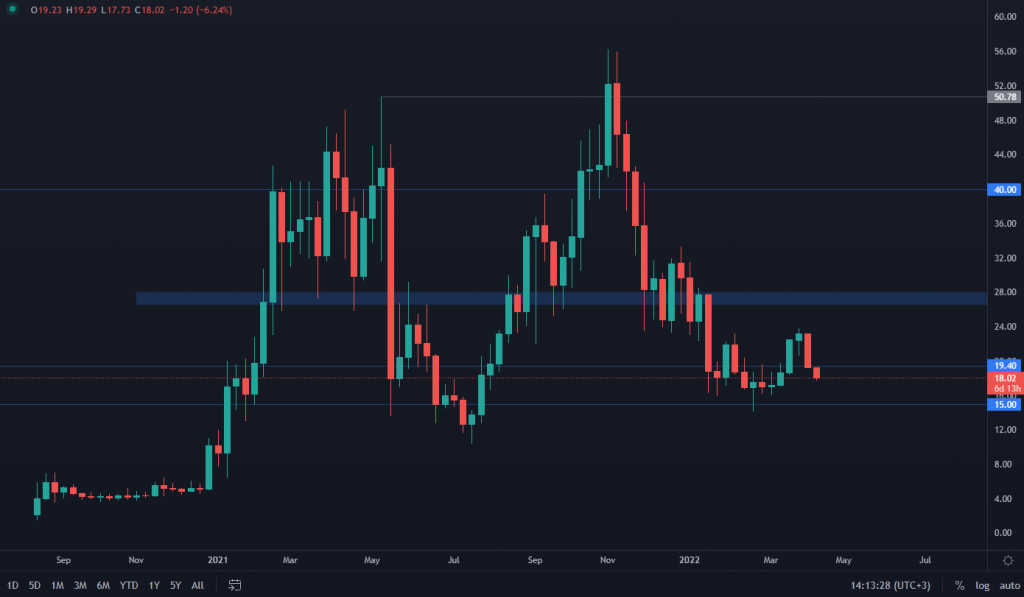
SNX
From a weekly point of view, SNX also formed a huge bearish engulfing candle, which puts it on a path to $4.45. A loss of the $4.45 support would bring SNX back to $3.6, while only a $5.5 weekly reclaim would invalidate further downside movement.
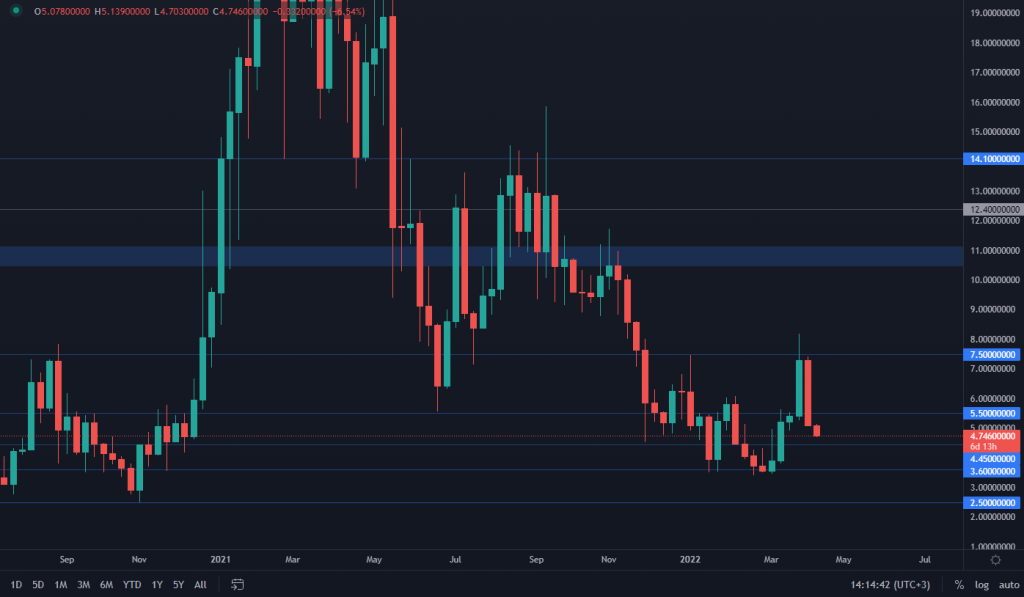
RUNE
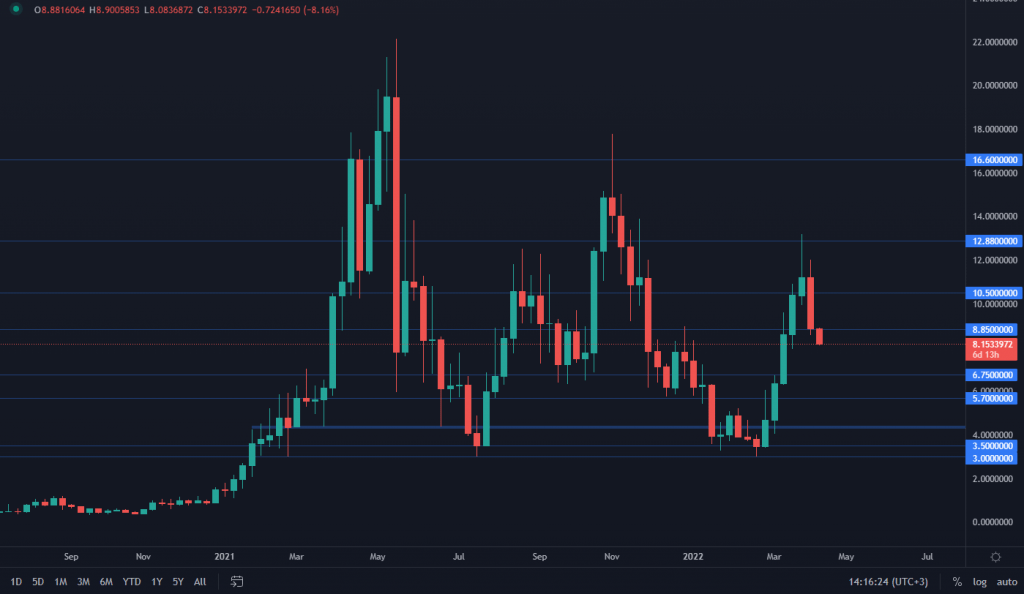 RUNE also formed a bearish engulfing candle, which puts it on track to $6.75, unless $8.85 is reclaimed by both daily & weekly candle closures. There's some lower timeframe support around $8, so we might see a small reaction once price tests that support level.
SOL
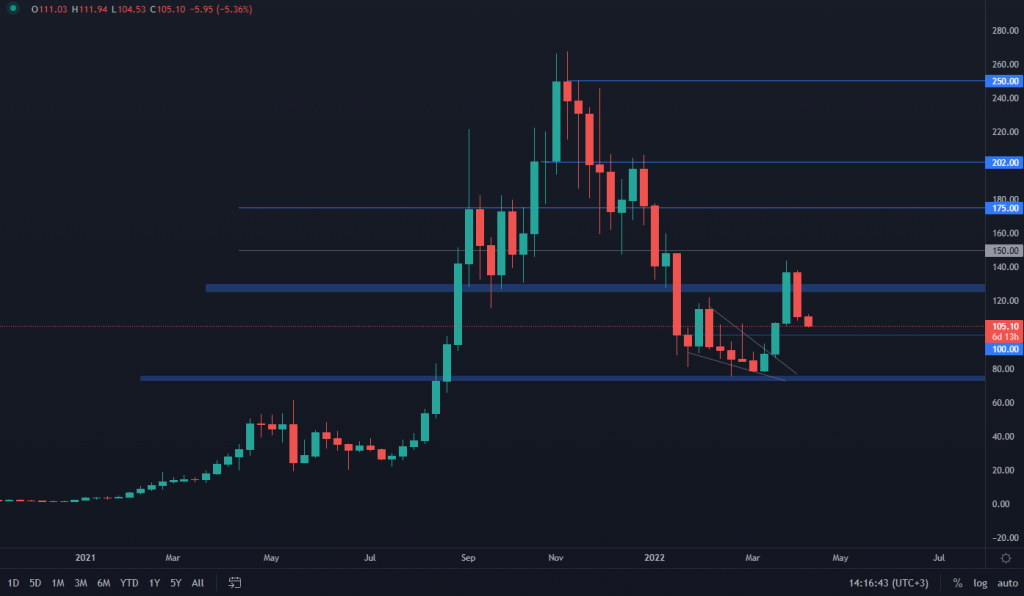 As mentioned in our Daily Analysis, SOL is still aiming for a $100 test, which is not only a technical support level, but also a psychological one, where we can expect a reaction as it is an important level. As for the upside potential, we need to see SOL holding $100 and then closing a weekly candle above $130.
SRM
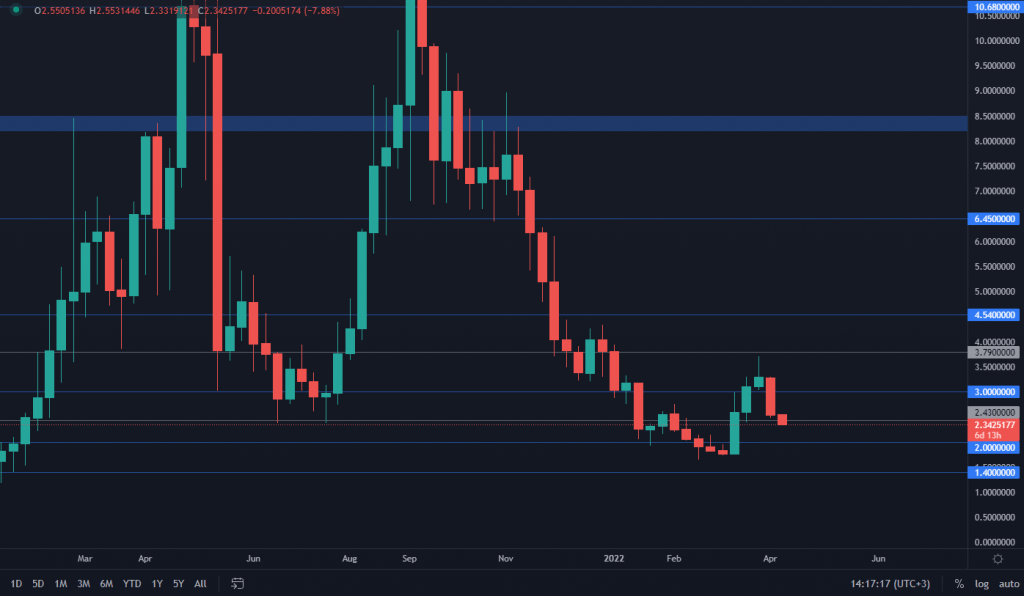 $2.43 support is currently being tested. Unless SRM doesn't close the week above $2.43, then further downside is possible, putting $2 as the next support area to look out for. Still need to wait for today's daily candle closure to confirm, but it's close to forming a lower low, which puts the odds in favor of a $2 test.
FTT
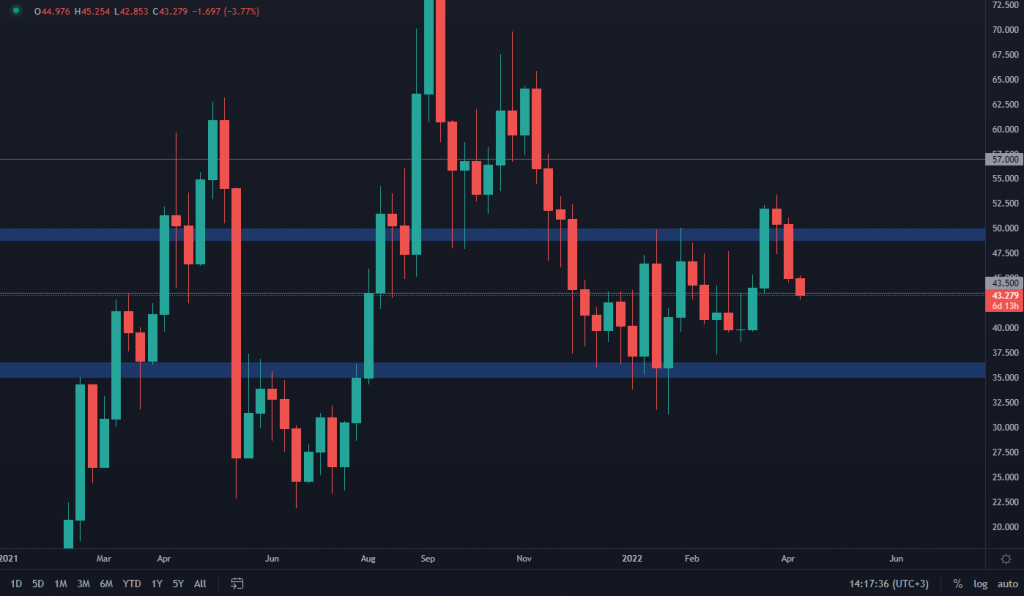 After failing to close above $50, FTT dropped back to the $43.5 support level.. Unless we close this week above $43.5, then price is most likely going to test $40.
MINA
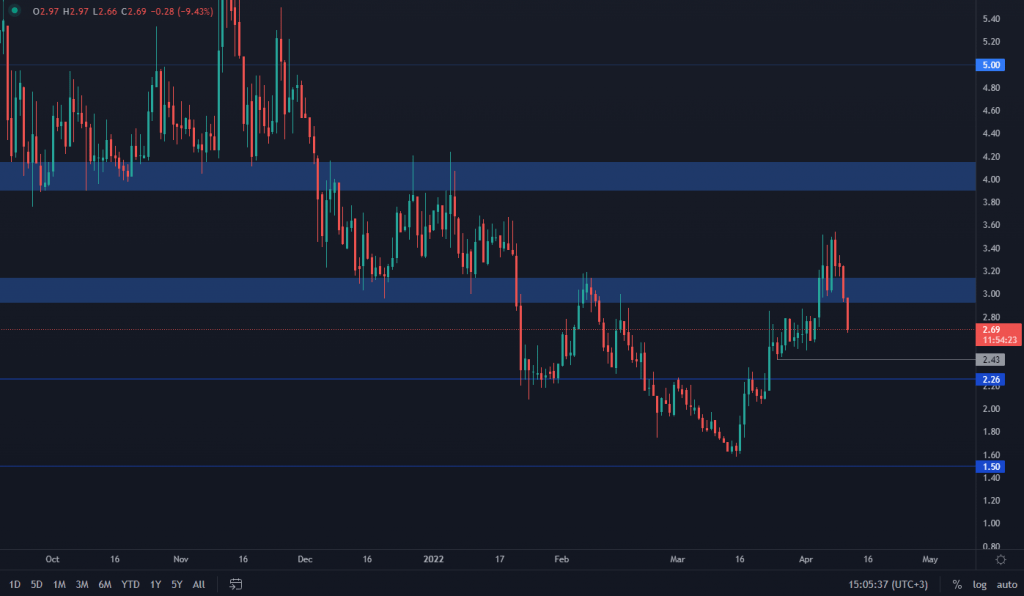 (daily chart used)
MINA was unable to hold $3, which invalidates a move to $4 for now. Fueled by BTC's price action, MINA already dropped to $2.70 and is close to an important support level. If $2.43 is lost, then $2.26 is next. This will invalidate MINA's bullish market structure by forming a lower low.
(daily chart used)
MINA was unable to hold $3, which invalidates a move to $4 for now. Fueled by BTC's price action, MINA already dropped to $2.70 and is close to an important support level. If $2.43 is lost, then $2.26 is next. This will invalidate MINA's bullish market structure by forming a lower low.
dYdX
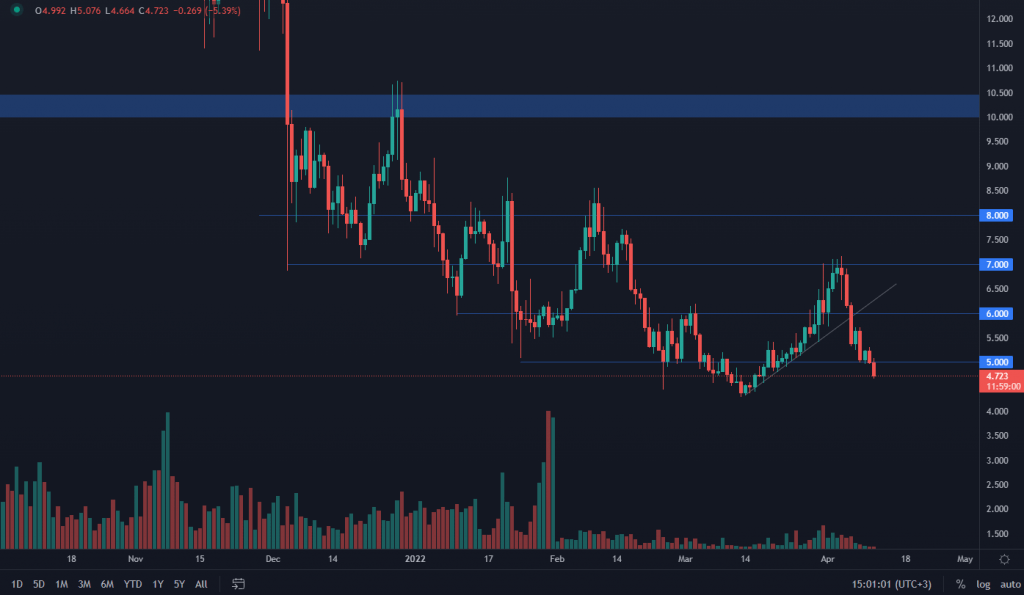 (daily chart used)
dYdX lost the $5 support level, which puts it on track to test $4.30, which is the all time low. Volume is really low and has been in a visible decrease, which increases the odds of testing $4.30. This will remain valid until a reclaim of $5 by both daily & weekly candle closures occurs.
(daily chart used)
dYdX lost the $5 support level, which puts it on track to test $4.30, which is the all time low. Volume is really low and has been in a visible decrease, which increases the odds of testing $4.30. This will remain valid until a reclaim of $5 by both daily & weekly candle closures occurs.
Recommended from Cryptonary


PRO
Market Direction
11 min read
Mar 24, 2026

PRO
Market Updates
8 min read
Mar 23, 2026
PRO
Market Direction
13 min read
Mar 20, 2026
