Save 23% ($351) & Get a Free 1-1 Call with our Team ⏰ : 0d 2h 59m 44s
Weekly Technicals Pro - Vol 104
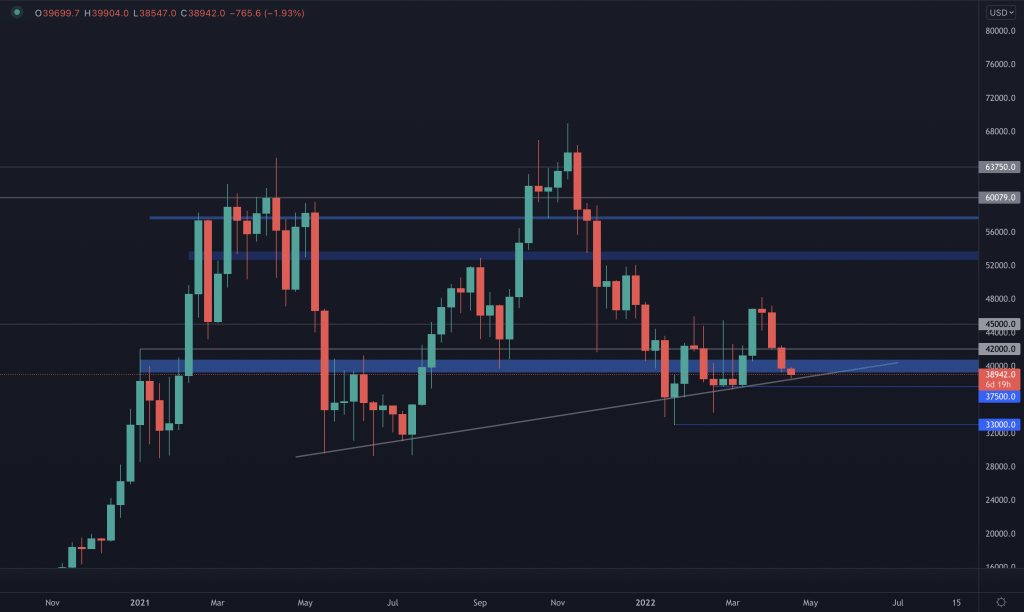
Bearish pressure continues, as BTC closed its previous week under $40k. For now, $37.5k remains the next target, but what we still want to see for further upside is a close above the support trend line which has been precise for multiple months. A reclaim of $42k will invalidate any further downside potential.

Disclaimer: Not financial nor investment advice. You are responsible for any capital-related decisions you make, and only you are accountable for the results.
Total Market Cap
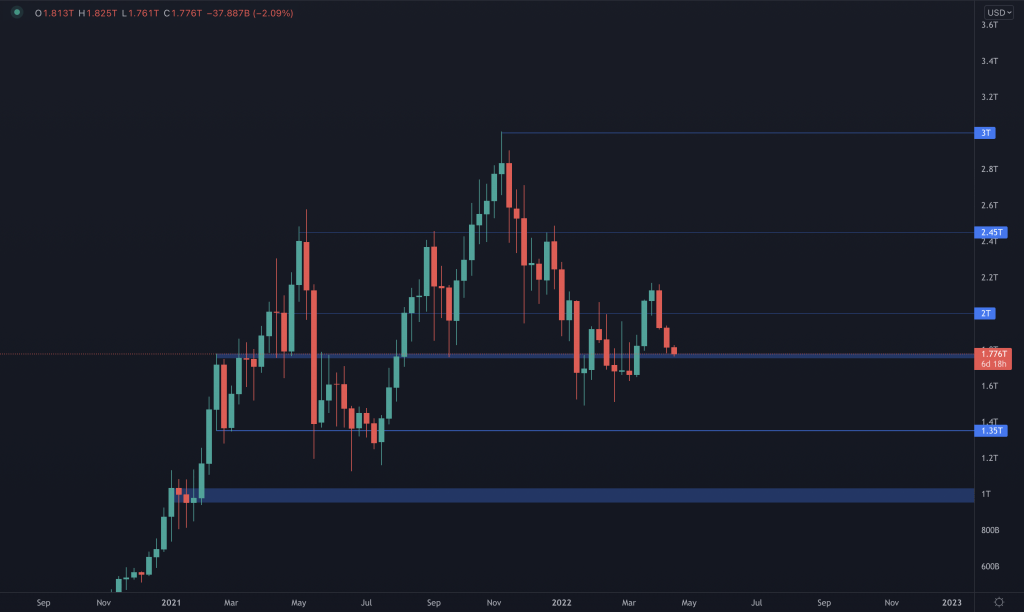 We closed the week with yet another bearish candle, just above the $1.8T-$1.75T support level. As long as $1.75T holds, then we can try and reclaim $2T. If that doesn't happen and the $1.75T support level is lost, then we are looking at a 20% total market cap drop back to $1.35T.
Bitcoin
Ether
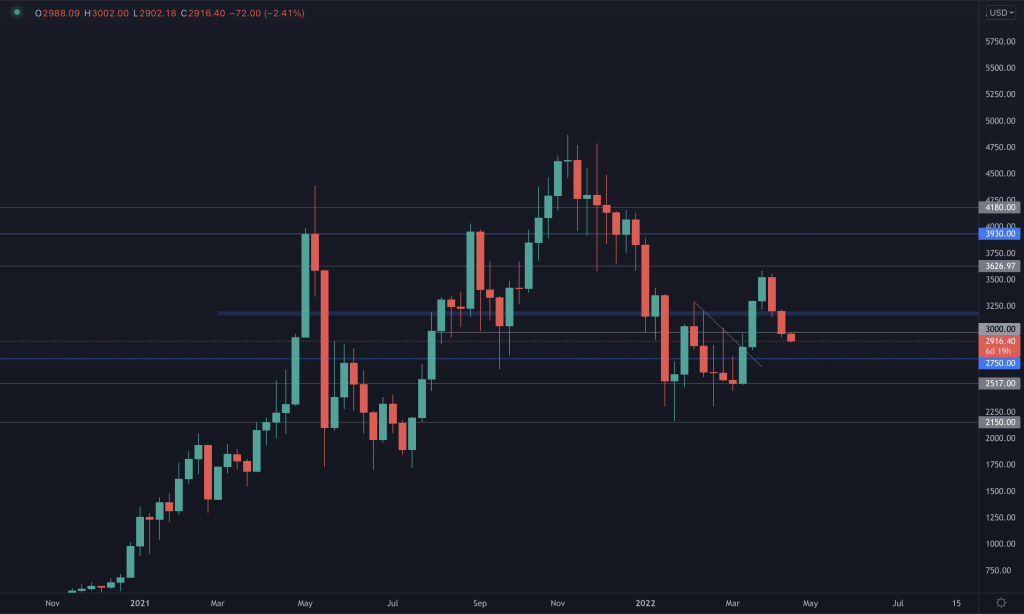
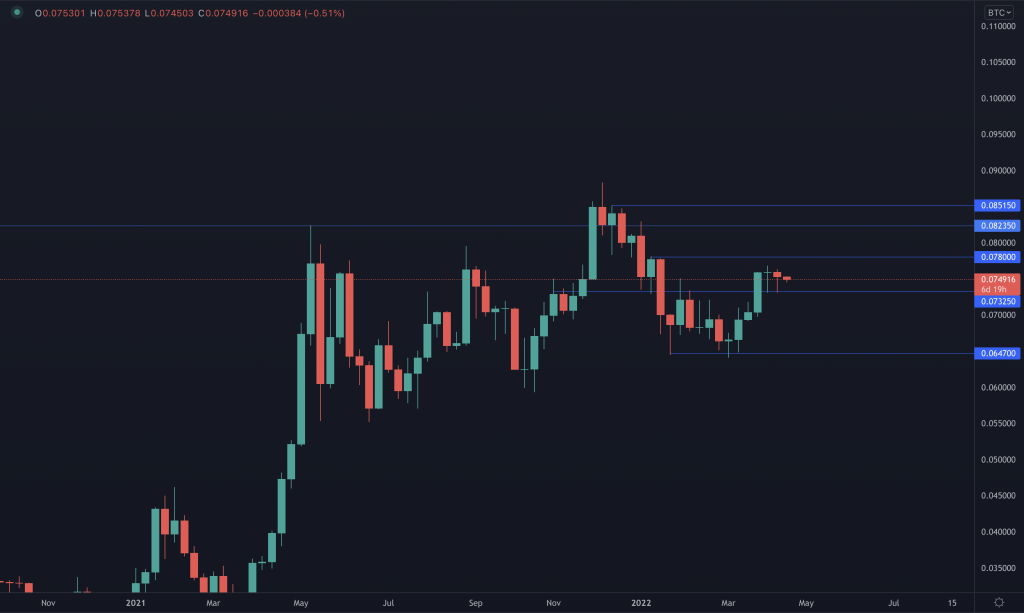
Price wasn't able to hold the $3200 last week due to BTC's influence upon the market. As a result, ETH dropped to $3000, where surprisingly price couldn't handle the selling pressure on the entire market. Because of that, $2750 is now the next target for ETH unless price reclaims $3000 by a weekly closure above it. The ETH/BTC pair also seems to be testing a key support level soon, which is in confluence with our $2750 ETH target (check the chart below).
ETH/BTC Chart
DOT
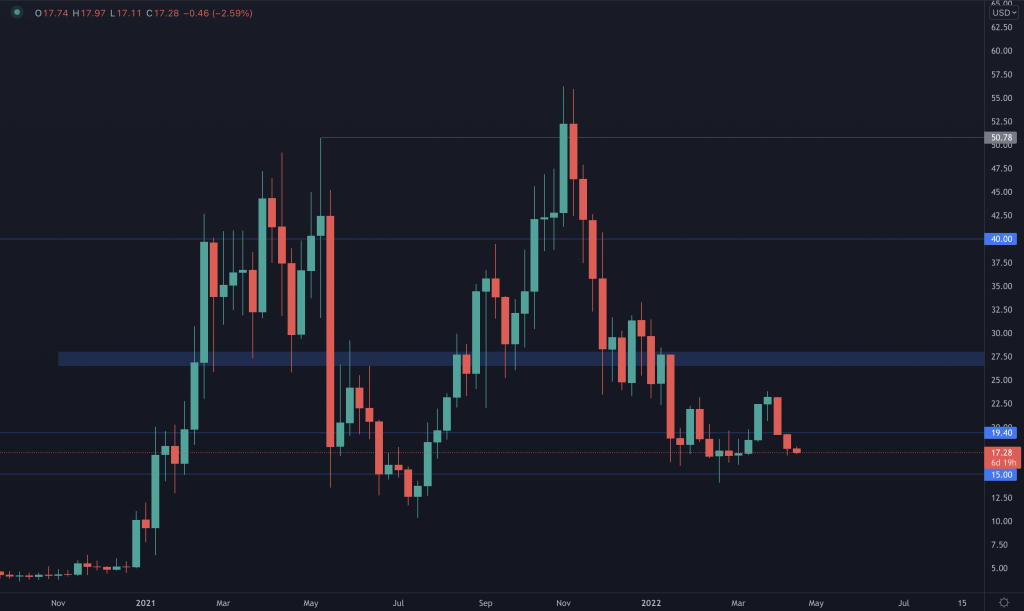
No reclaim of $19.40, so DOT remains on a clear path back to $15. Only invalidation here is still a reclaim of $19.40 by a weekly closure above it, which as of now, we have no signs of happening due to BTC's sudden drop last night.
SNX
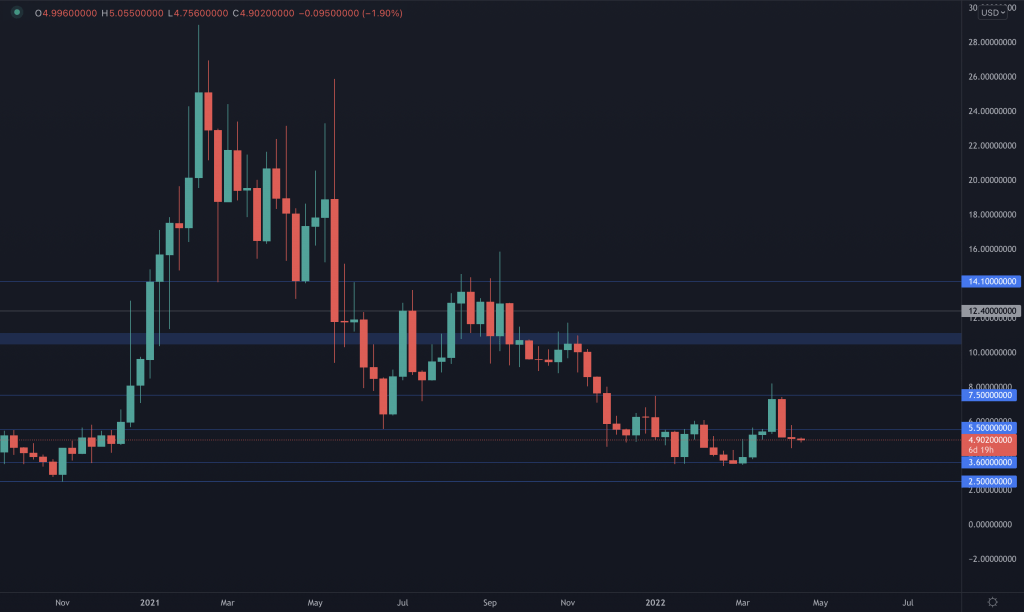
Although SNX wasn't able to reclaim the $5.5 level, there's a huge difference between others and SNX in this week's analysis - and that's the previous candle. We can see both selling & buying volume were present, but SNX actually closed an indecisive candle, which is in contradiction with the others as most closed extremely bearish candles. Demand is present, so that leaves us to the point - a reclaim of $5.5 is necessary for further upside. Until then, price can come back down and test its $3.6 support level.
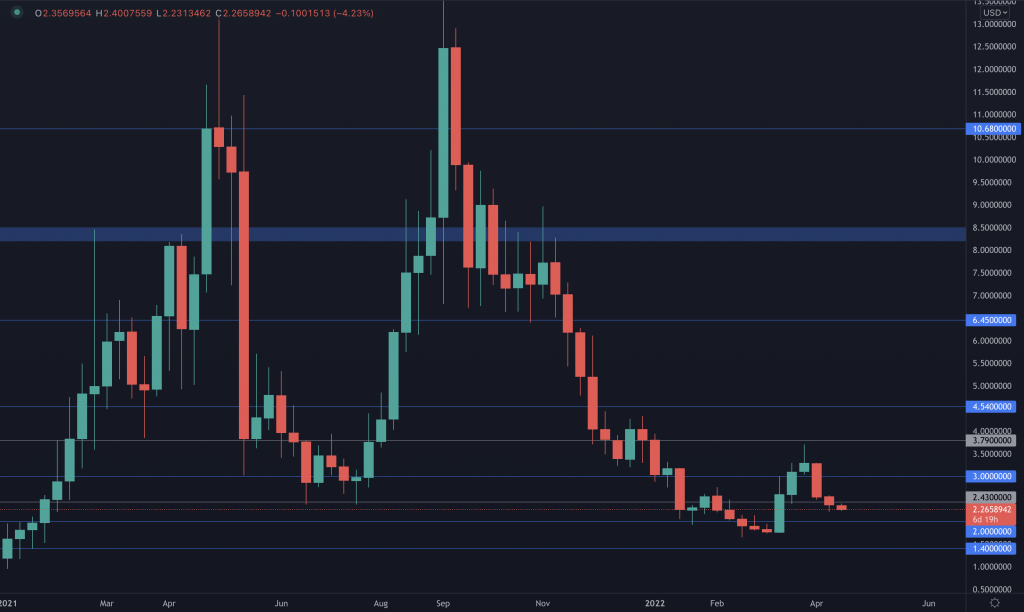
RUNE
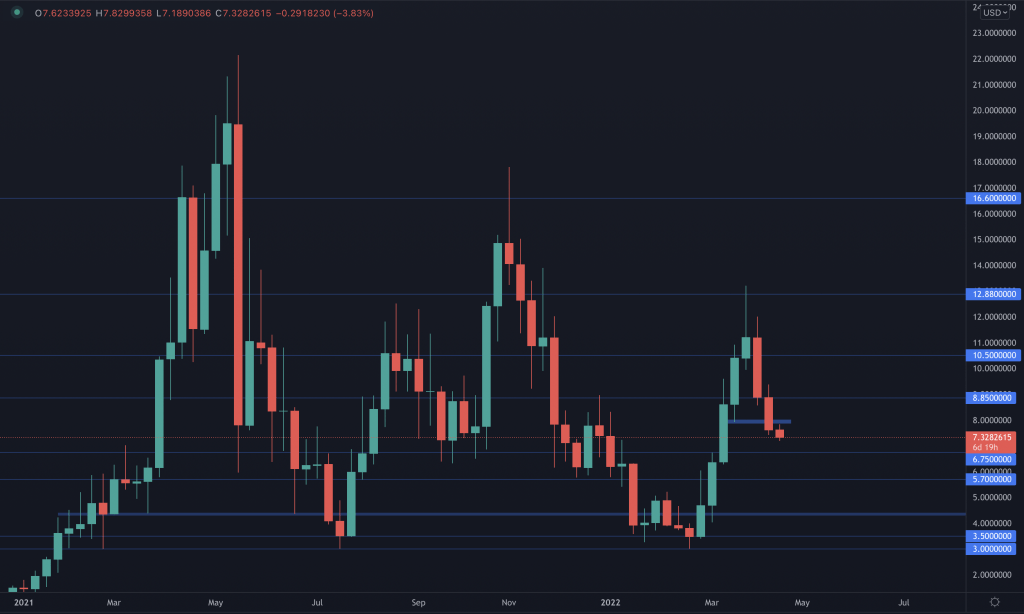
Because RUNE lost its $8 support level, it is now on a path to $6.75 or even lower.
RUNE/BTC Chart
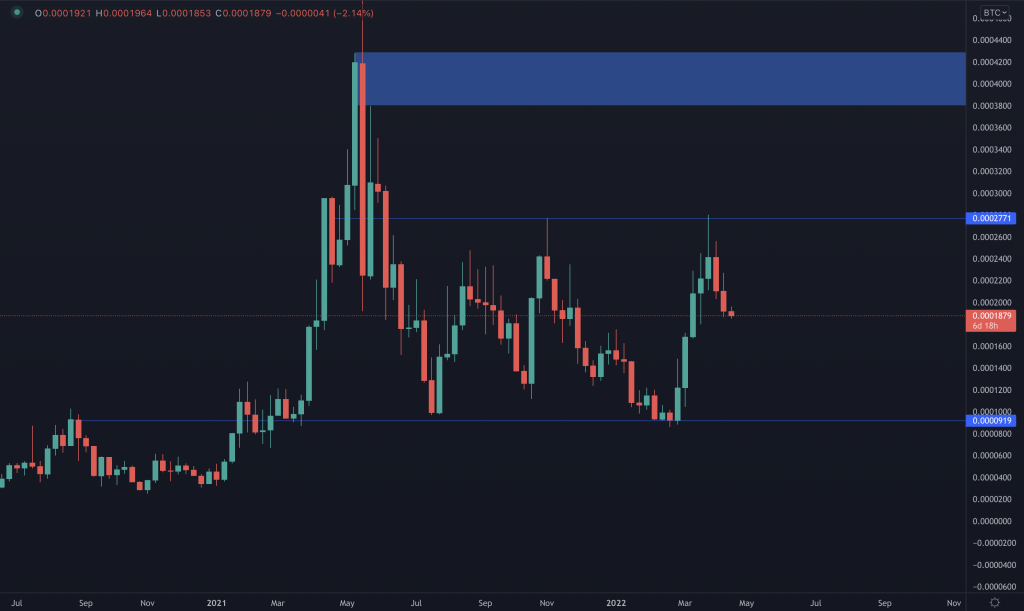
As bulls & bears have been fighting to hold the $8 support level on RUNE, the RUNE/BTC pair seems to have formed a local top, rejected from the top part of this ranging period RUNE has been trading in on the BTC pair. While this could've indicated the drop, RUNE already lost its $8 just last night due to BTC also dropping, so the odds of testing $6.75 are definitely there now.
SOL
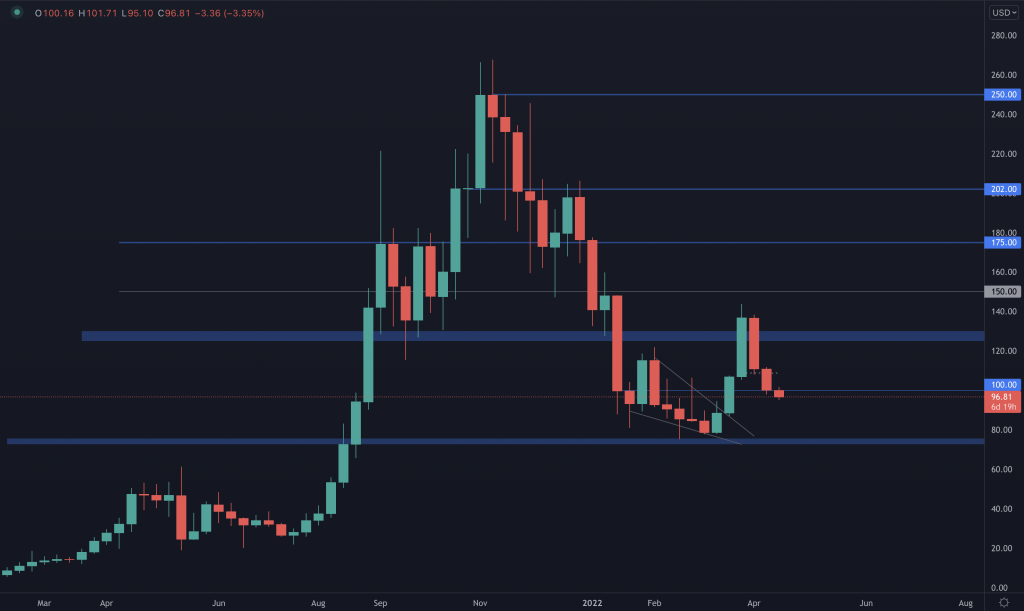
Price barely closed above $100, which means we now need another weekly closure to confirm where price is going next. If SOL isn't able to close this week's candle above $100, then $80 is most likely coming at some point.
SRM
Short & simple - SRM wasn't able to close the week above $2.43 and is now on a path to the $2 support level.
FTT
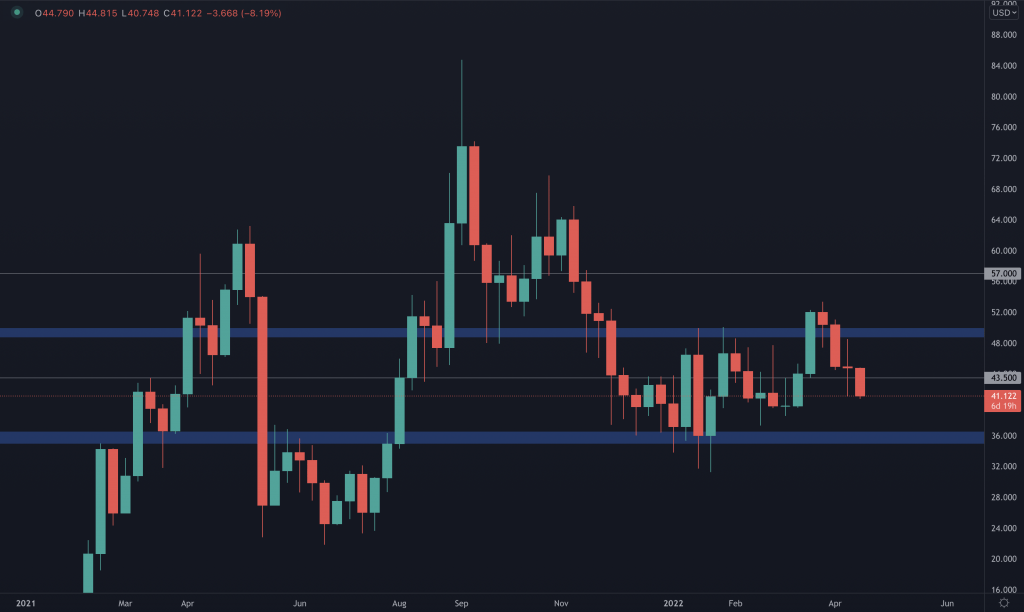
FTT is experiencing the most aggressive drop out of all charts in this edition of Weekly Technicals Pro. Although price did close an indecisive candle above $43.5, where both bulls & bears were in control of the price at some point, it is now giving us mixed signals, as we barely started the week and FTT already lost its $43.5 support level. Because of that, we need to wait for another weekly candle closure to confirm FTT's direction.
MINA
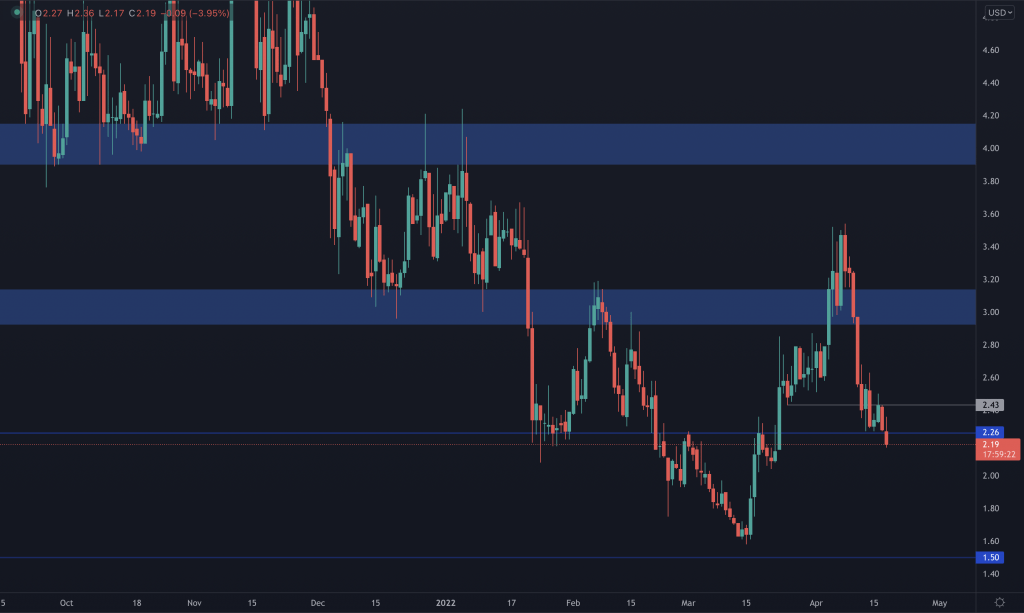
(daily chart used) MINA closed a bearish engulfing candle just above its $2.26 support, which indicates a potential drop to $2. Why $2? Because it is a psychological key level where most market participants will be eager to enter, causing MINA to have a reaction. Overall, the main area of interest after the loss of $2.26 still remains $1.5. The $2 support level might only be a temporary one, which can be easily invalidated by a drop on BTC.
dYdX
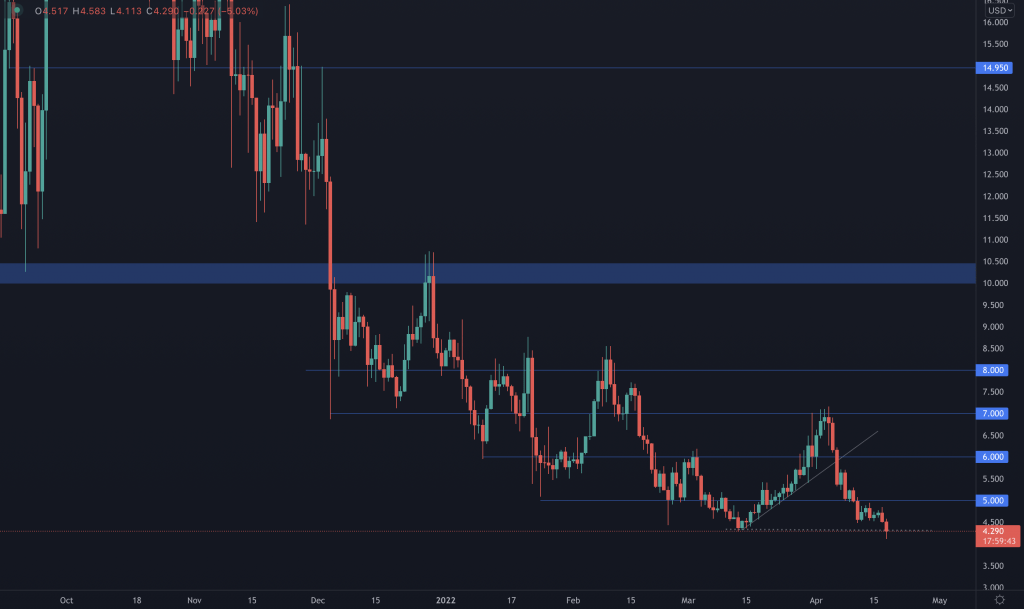
(daily chart used) As mentioned multiple times in the daily analysis, dYdX was bound to test its all time low, which it did. A weekly closure under $4.30 would bring dYdX in a downside price discovery.
Recommended from Cryptonary


