Save 23% ($351) & Get a Free 1-1 Call with our Team ⏰ : 0d 2h 59m 43s
Weekly Technicals Pro – Vol 105
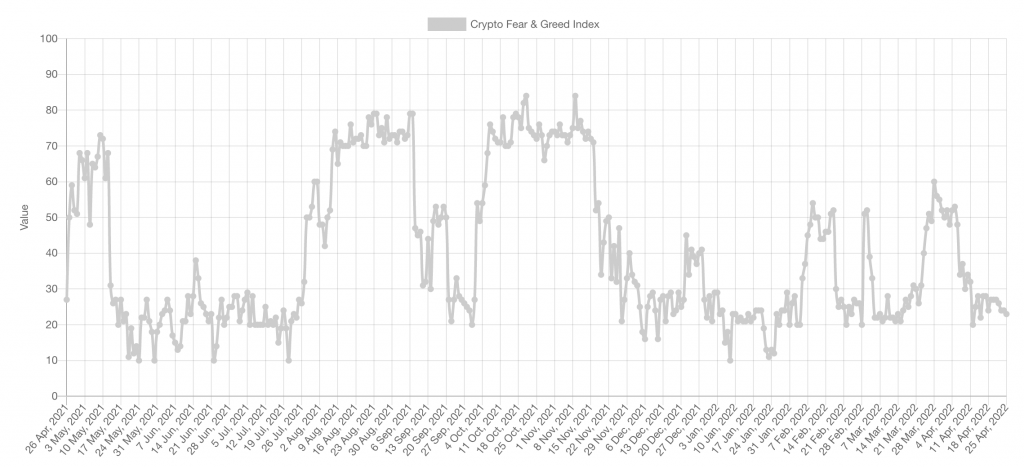
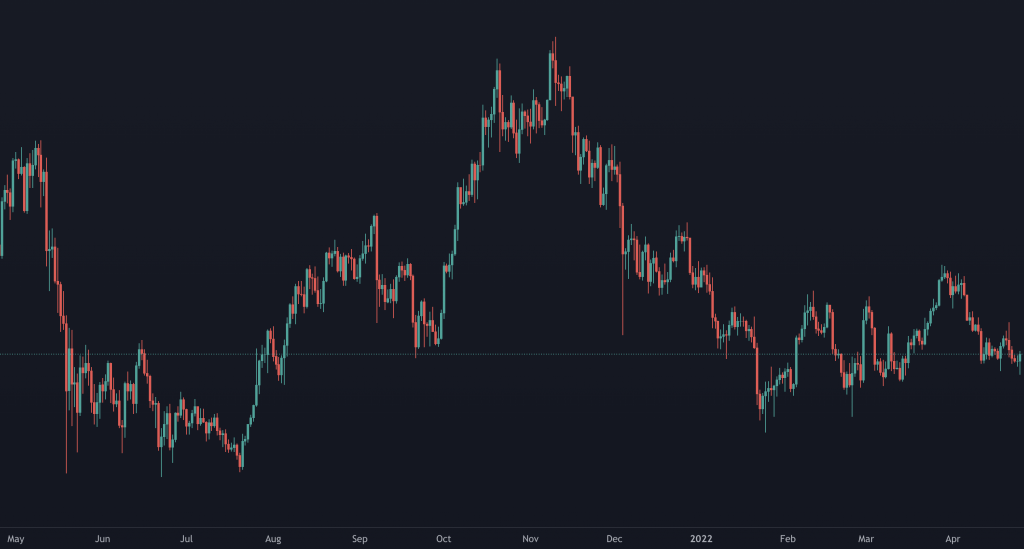
It is worth including the above charts in this week's Weekly Technicals as the Fear and Greed index could head into the extremes as it currently hangs around the low 20s. So, we'll mention it here should you decide to monitor this index as a part of your analysis if Bitcoin heads lower. We consider the most reliable extremes as being close to 10 or around 90. But, as you can see, it's worth watching this when it moves down to 20 or up towards 80. The further it moves into each extreme, the higher the potential of a bottom/top being set around that time. So, should the above occur, we'd be looking for it to be reflected in Bitcoin's price action, as right now, the daily timeframe pattern is choppy. However, for this index to move into the lower extremes, sudden/further downside in Bitcoin's price action would likely occur. Naturally, trades should not be based on this index alone, although it has historically aided the identification of an incoming momentum shift when it has moved into the extremes. We've aligned the above charts as best as possible here so you can cross-refer, and we've also narrowed it down to the past 12 months, so it's not too congested.

Disclaimer: Not financial nor investment advice. You are responsible for any capital-related decisions you make, and only you are accountable for the results.
Market Sentiment
Total Market Cap
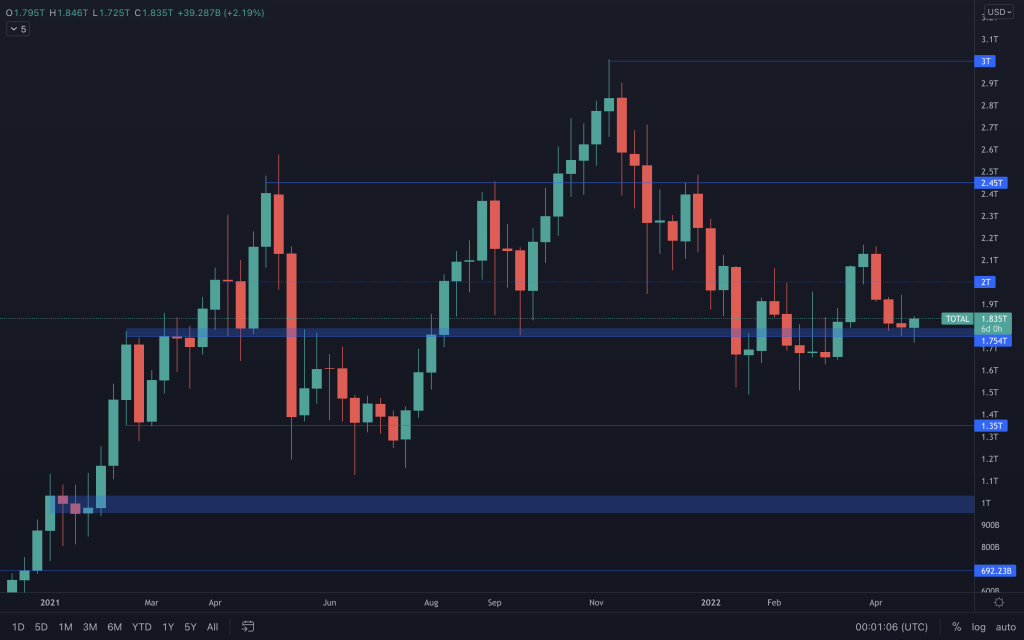
The Total Market Cap closed red, but it has managed to close above the $1.75T-$1.8T region once again. With it being near a significant support level, we'll see if it can form a weekly higher low from here. Although the market structure has a buffer to remain bullish should this level be lost, a weekly loss does bring about a possibility of $1.35T once again. On the daily timeframe, we see a positive reaction from this level after touching its daily trendline support (use the line chart to help you plot it). As long as the daily chart closes like this, we should see further upside tomorrow.
Bitcoin
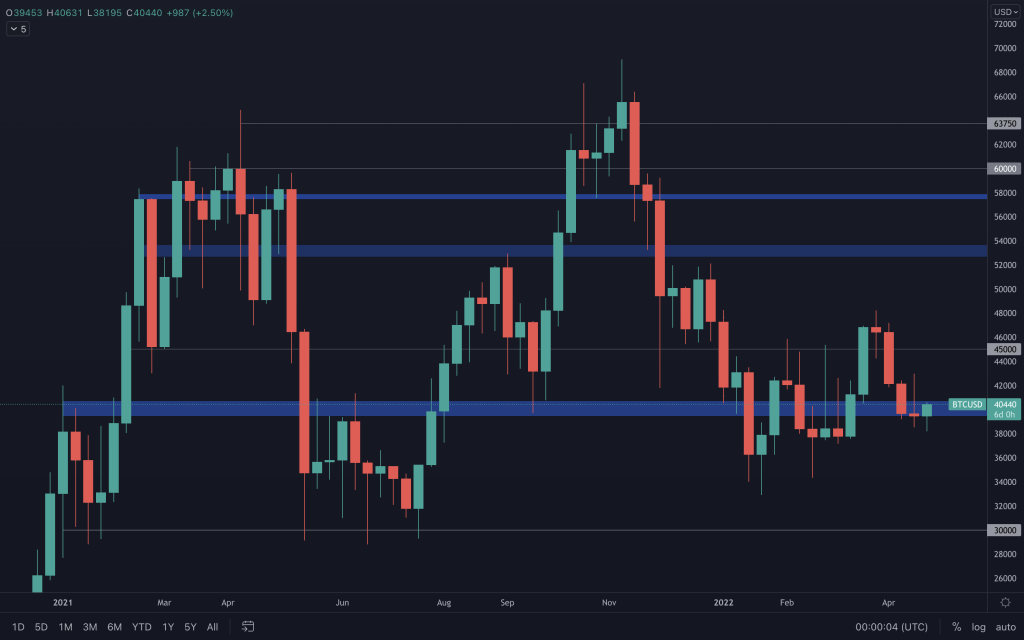
Bitcoin's weekly candle closed bearish, but it has shown a slowdown in the bearish momentum seen over the previous two weeks. At this time, the weekly chart still maintains its bullish structure, and only Bitcoin's price moving below $34,350 would begin to alter that. We did identify the daily lower high at the beginning of April, and the move down towards $40,000 has been the result. The current daily price action is choppy as Bitcoin's price action gives mixed signals, catching out both long and short positions. There is an increase in today's trading volume (which can be expected after a low volume weekend), so it's not yet something that we can use in our analysis, especially as today's candle has not closed yet. Although Bitcoin is at its higher timeframe support, with the price close to its old broken supporting trend line, waiting for further maturity in the chart by the daily closure or a structure change may provide more clarity to traders.
Ether
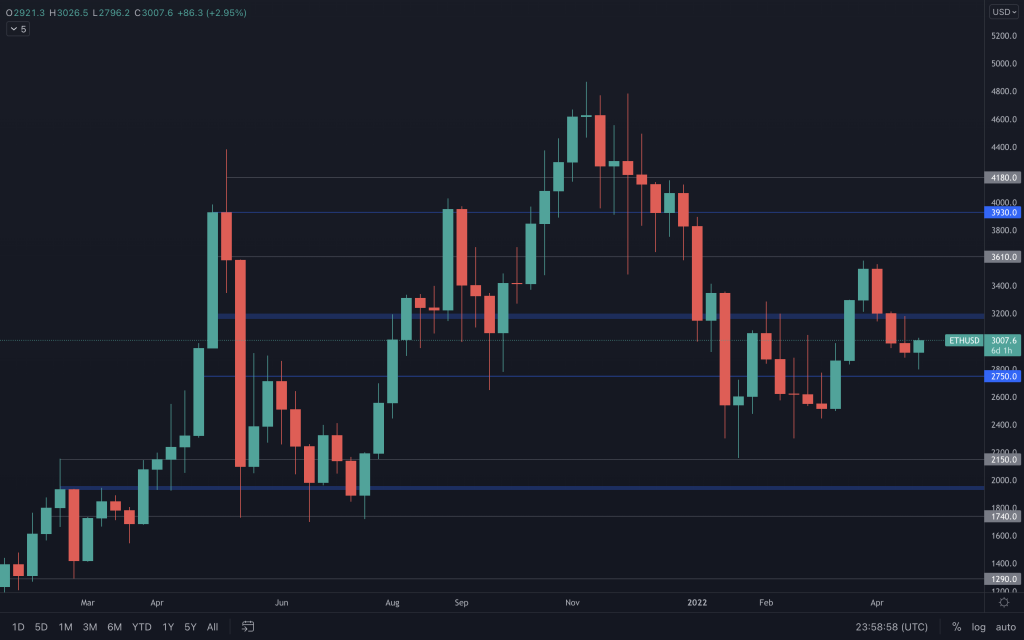
Last week's candle retested $3,200 as resistance and eventually closed bearish, below $3,000. But, similar to Bitcoin, the overall weekly market structure remains bullish. We have already seen a reaction to the bearish closing, with Ether moving below $2,800 on the first day of the new week, creating a new daily low. From a daily perspective, it is creating lower lows with resistance at $3,200. Closing today's candle above $3,000 should offer it another chance to run towards $3,200, especially with ETHBTC looking like it will close bullish from support. From here, the safest bet may be waiting for a change in ETH's daily market structure from bearish to bullish or for a reclaim of $3,200.
DOT
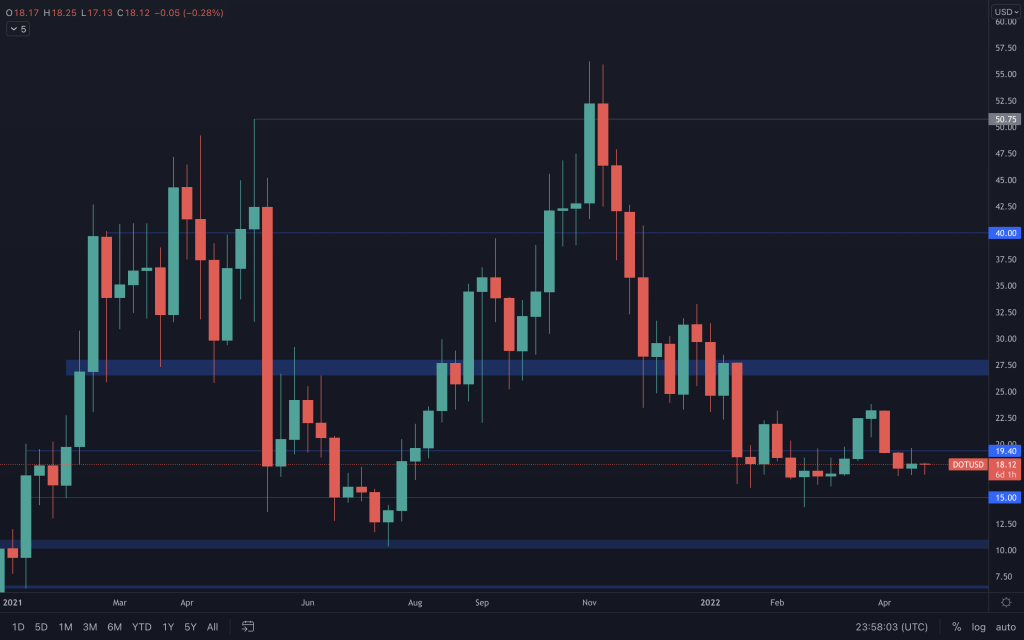
Although DOT's price action over the last week was mostly restricted by its price ranging between $17 and $19.40, DOT eventually closed the week out green. The volume continues to be unimpressive, but this closure has given DOT a weekly higher low. Although not the strongest of candle closures, it technically confirms a change in market structure from bearish to bullish on the weekly timeframe. With the lack of volume still something to consider, and the $19.40 resistance as an established level, DOT needs to pull its finger out with the monthly closure being five days away and the current candle being bearish engulfing. A daily reclaim of $19.40 needs to happen soon, and if it can do that, it should open the gates toward $28.
SNX
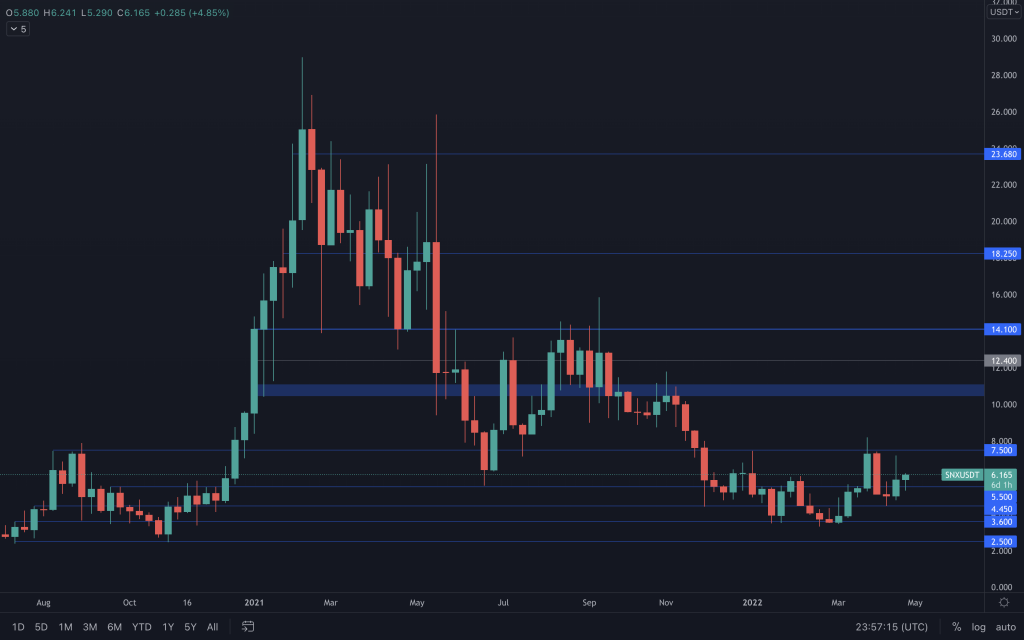
SNX closed the week out strong by reclaiming $5.50, and guess what? SNX also created a weekly higher low. Buyers appear to be stepping up as volume continues to increase. Next up, $7.50 (providing Bitcoin plays fair). We also look towards the monthly closure here as last month's candle for SNX was a bullish engulfing. Closing the month out green would keep that momentum going. Even better if it can close it out above $7.33.
RUNE
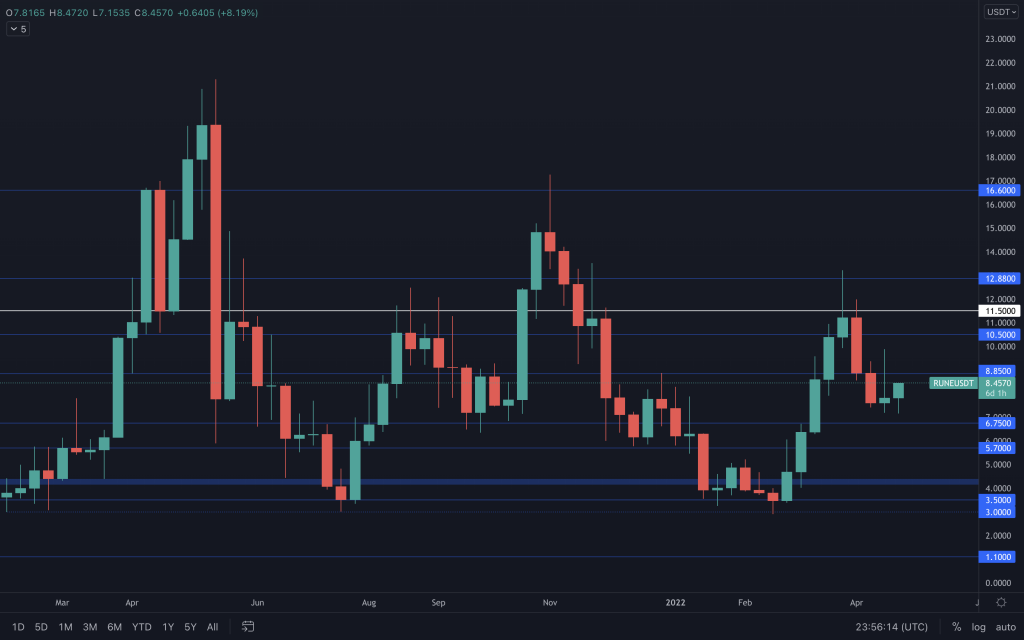
Since the end of February, RUNE saw some impressive gains. The volume remained solid during the green days/weeks, and we can see how it began to decline as RUNE's price did. We can consider this to be overall bullish as sellers are not selling with the same intensity as they were buying (they aren't bearish). Of course, some naturally realised profits as the price came close to $11.50, especially with it being such an important level. But the outcome is yet another asset with the formation of a weekly higher low. Of course, we'll need to see a closure above $11.50 and a higher high to confirm a bullish weekly structure (I can't believe I'm writing that). But, if RUNE manages to do that and Bitcoin behaves itself, price action could get very interesting. Daily timeframe - there's a slight bullish divergence on the RSI on the daily chart, and if today's candle closes like this, we should see RUNE pushing up towards $8.85 once again, where we'll wait to see if it can close above it and put double figures back on the table.
SOL
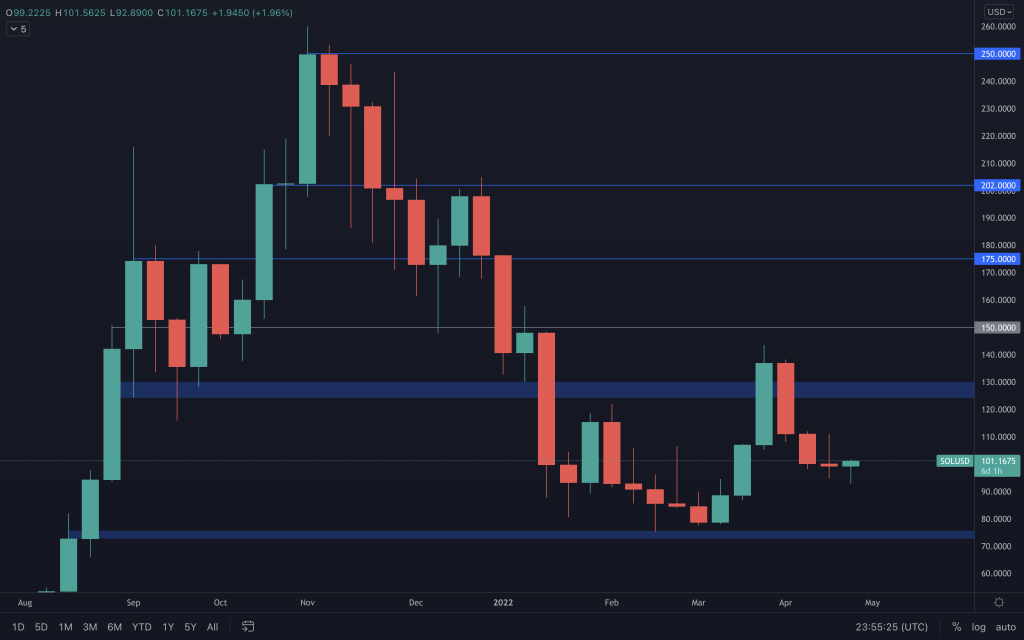
SOL closed last week's candle less than $1 below its opening price but below the golden $100 price. Over the past two weeks, it has continually chopped and tested $100, and you know what we say about multiple retests. So, with price action being indecisive and with no clear indication of direction, the best bet is to sit on the sidelines and observe until one presents itself. With today's candle so far, SOL could go on and bounce from here. But, right now, it's simply mimicking Bitcoin. If Bitcoin fails to break out of its resistance range, SOL would likely take a bigger hit in its price.
SRM
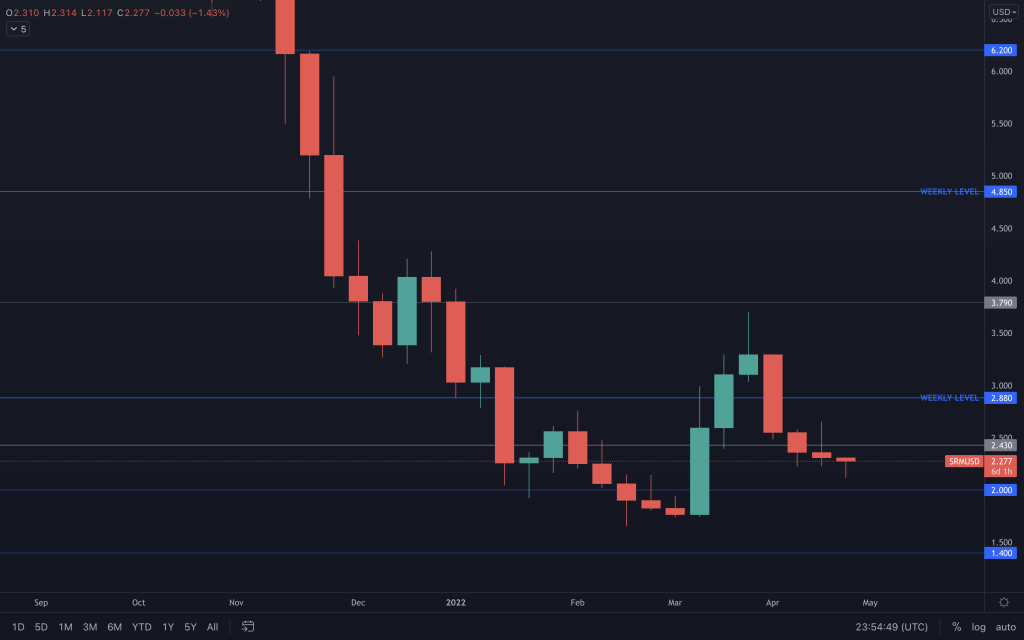
SRM failed to make any headway last week by simply continuing its decline. There's nothing to suggest this will change, and it looks like a retest of $2 is on the cards. The volume has declined along with the price, but it has yet to show any signs of change from its bearish structure.
FTT
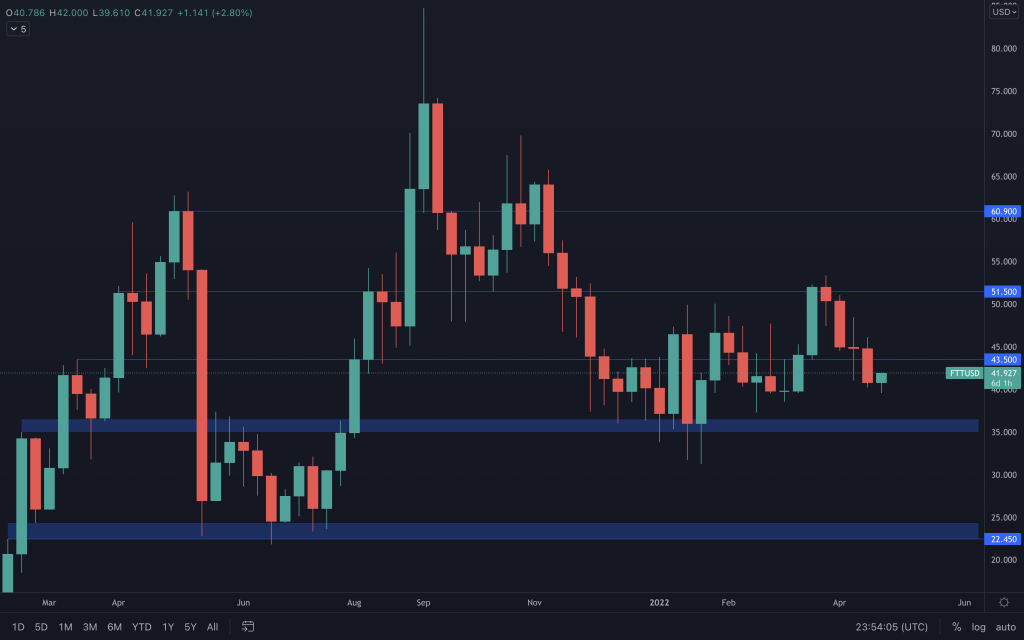
It was not the best of weeks for FTT as it pushed down and closed with a bearish candle below $43.50, so it really has some work to do. Whilst we would obviously like to see it maintain its bullish weekly structure, should it fail to do that, the key level that it does need to hold is $35. Any loss of that level would take it out of the $35-$50 range and bring about the possibility of a visit to $22.50. For now, though, from a daily perspective, $43.50 has been a reliable pivot level, so watching how the price reacts there may offer some trades for the traders in here.
MINA
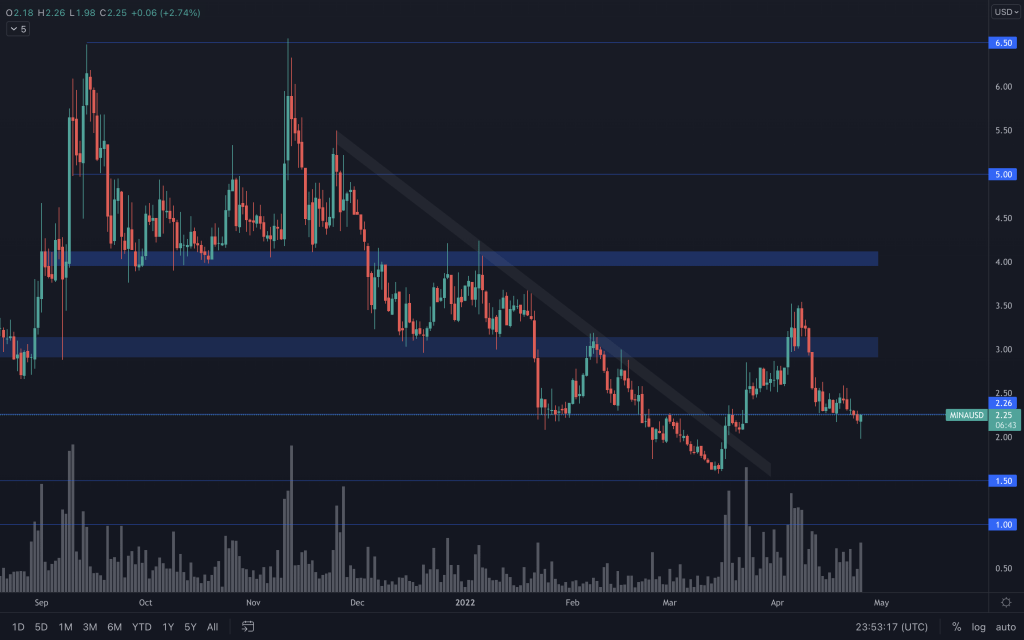
Daily timeframe used MINA retested the psychological $2 level and has seen a nice reaction with a little more volume than it has seen over the previous week. We'll look out for whether it can reclaim the $2.26 level by a daily close to offer it a chance of further upside.
dYdX
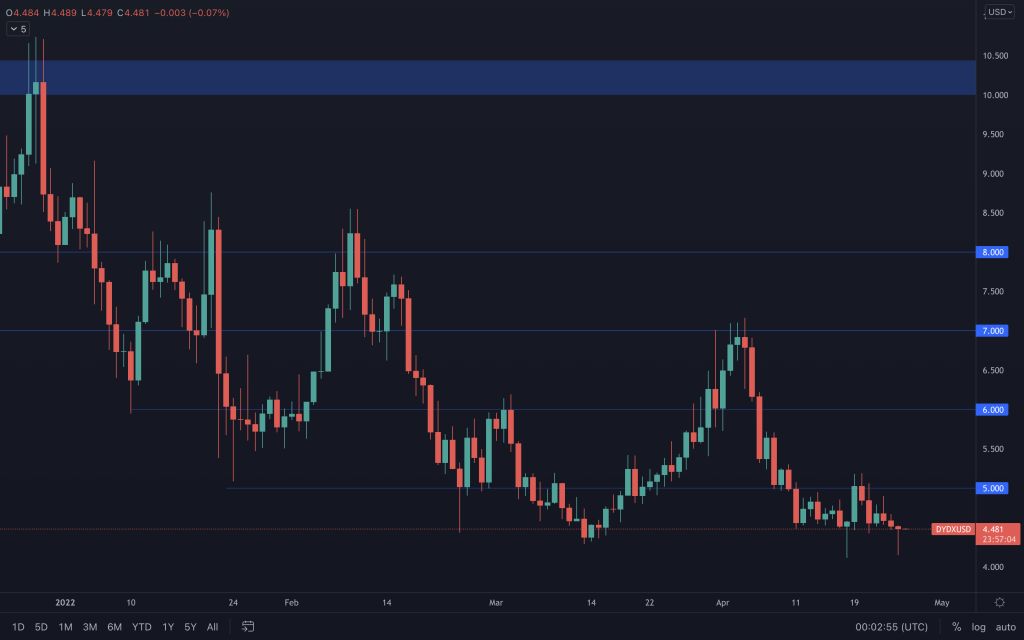
Daily timeframe used The weekly candle held onto $4.50, and we have once again seen a daily wick into the low $4s. Closing yesterday's candle just below $4.50 doesn't look too great, and we may see more downside for dYdX.
Recommended from Cryptonary


