Save 23% ($351) & Get a Free 1-1 Call with our Team ⏰ : 0d 2h 59m 43s

Disclaimer: Not financial nor investment advice. You are responsible for any capital-related decisions you make, and only you are accountable for the results.
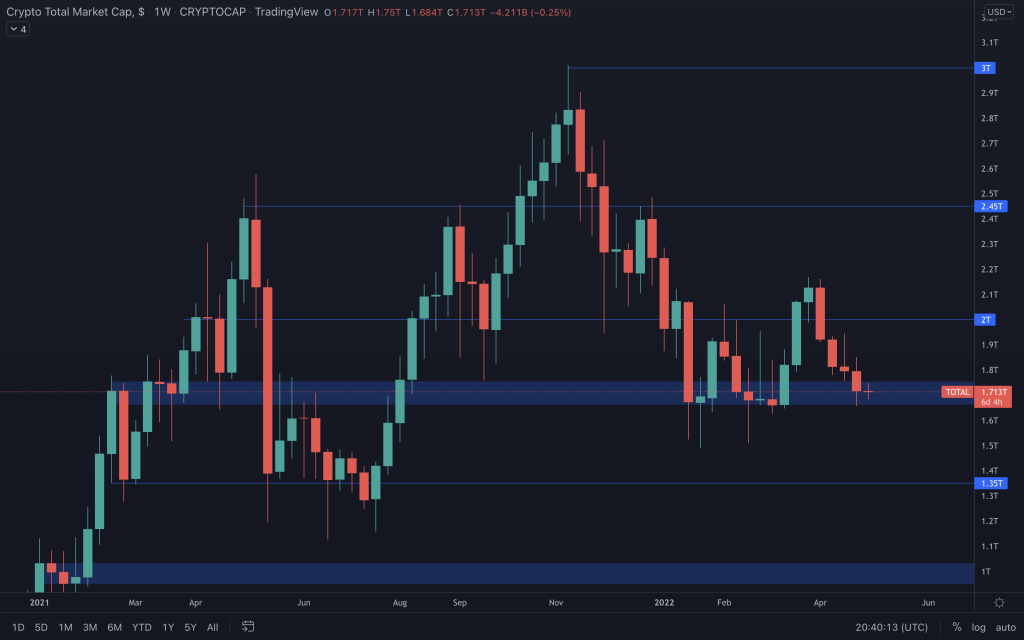
Total Market Cap
Altcoins Market Cap
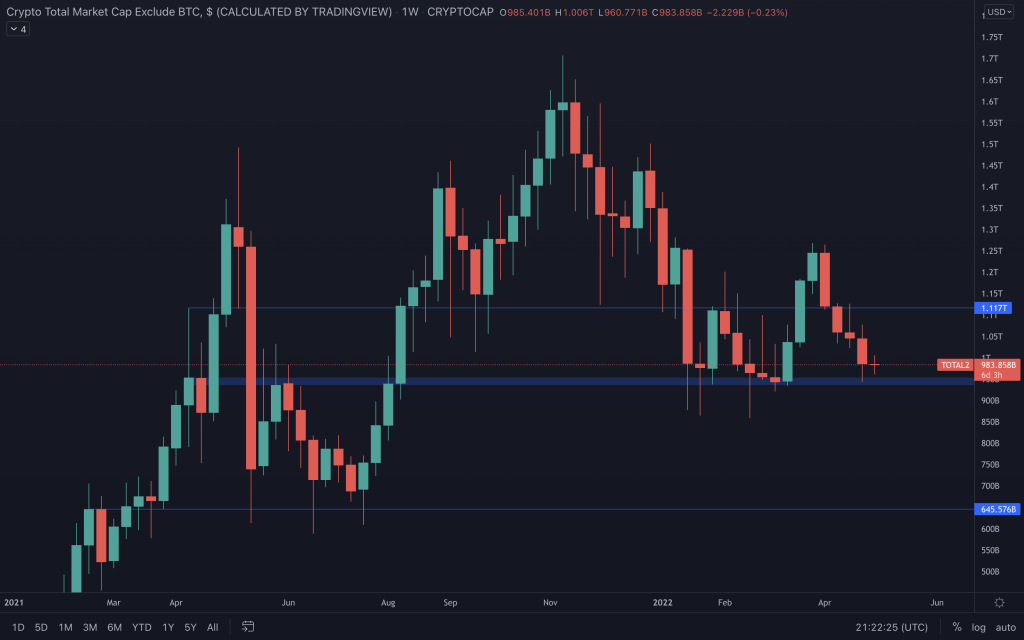
The Altcoins Market Cap projects the same situation. Just to clarify, the lower level for support is $936B.
Bitcoin
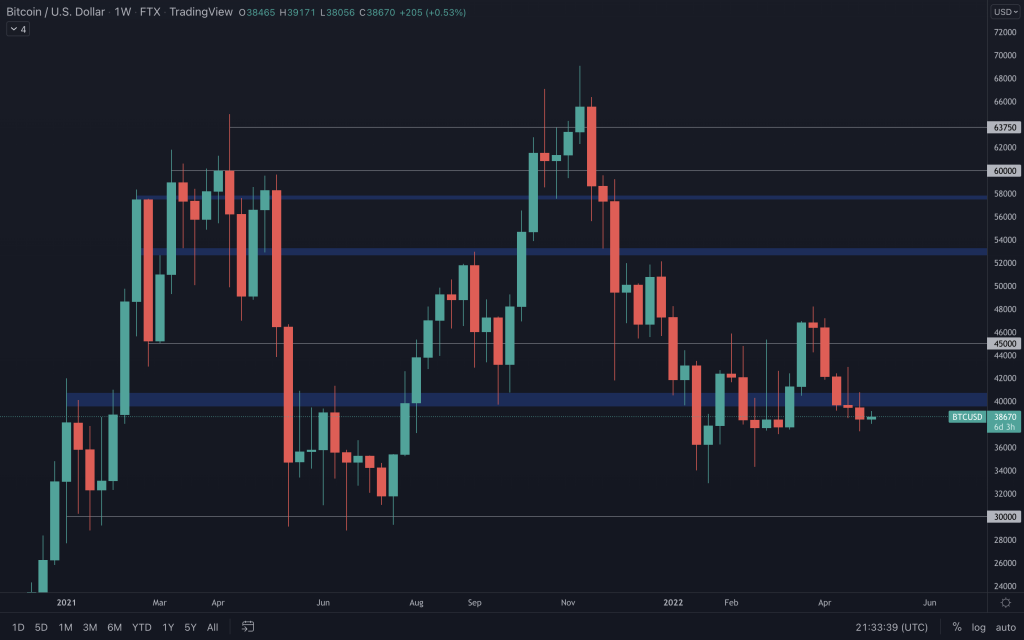
Bitcoin closed below its support level. That's plain to see. It also looks like we have five red weeks for the first time ever. Considering the two charts above this one being above their respective supports, a fight to maintain Bitcoin's structure could occur. It does have a task on its hands now that the monthly candle closed bearish engulfing. Plus, we have yet to see the daily structure signalling strength. But, unless that bullish structure is invalidated, we can't take the bullish possibility off the table quite yet. We expect chop/somewhat sideways movement into the FOMC announcement on May the 4th.
Ether
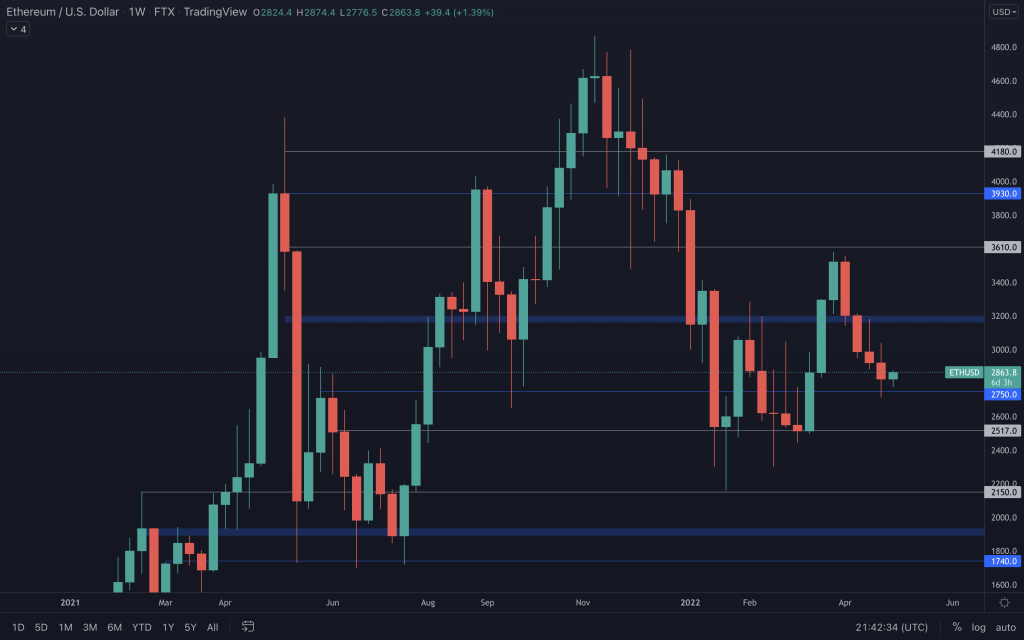
Ether currently looks the stronger of the two majors after finding support at $2,750. The daily structure needs to change for any bullish move, as that has been in 'down only' mode for nearly a month. To add, ETHBTC is still battling with its support level. Should it lose it, BTC would take the reigns and outperform it. Naturally, we'd make sure to highlight any developments in that regard.
DOT
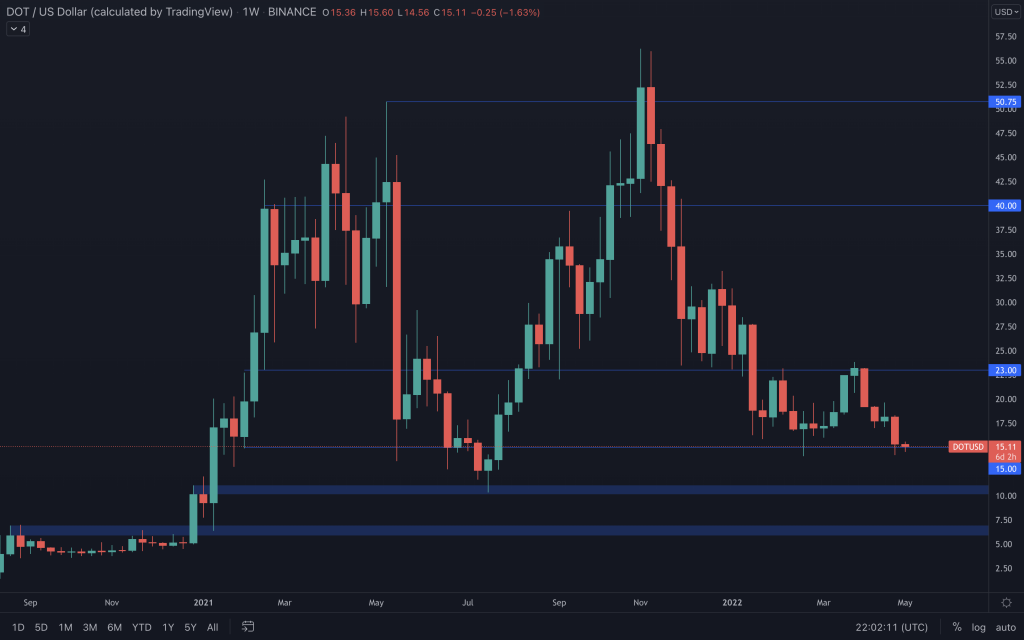
After seeing DOT's monthly candle closure, it's undoubtedly got a challenge to turn things around from here. On the weekly chart, we can see that it's moved sideways between $15 and $23 since the start of the year. Even though we attribute higher odds of seeing it move to $10, a break out of this range would indicate DOT's next direction.
SNX
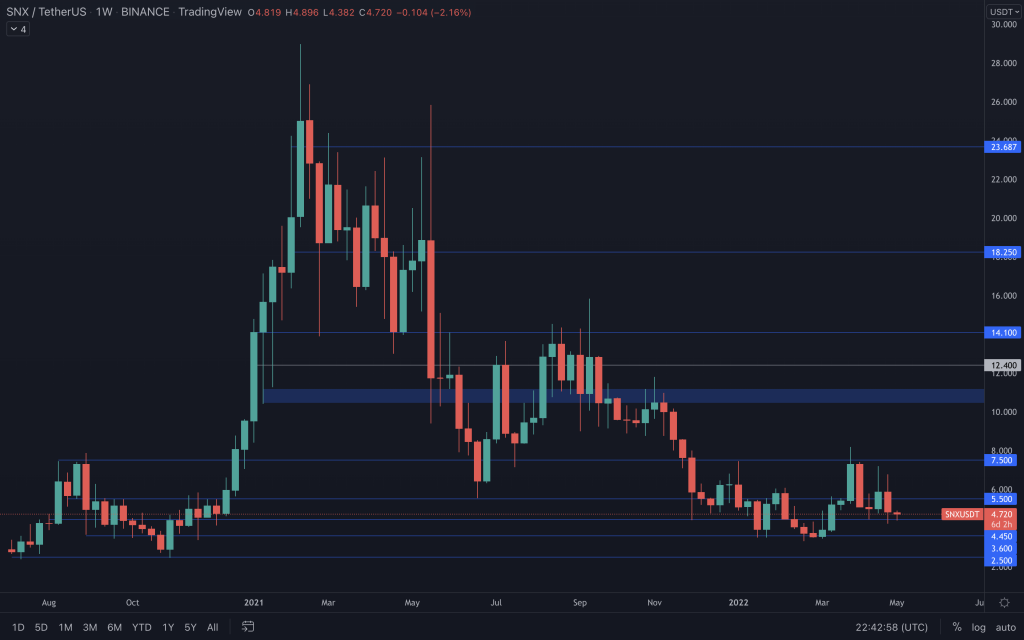
There we have it, a weekly lower high that has already created a lower low, invalidating the change to a bullish structure for now. From a weekly perspective, with the invalidation of the structure delaying things, SNX would need to close above $7.50 to be bullish. It's not to say that the daily chart doesn't highlight opportunities before that, but this is simply looking at charts from a weekly point of view.
RUNE
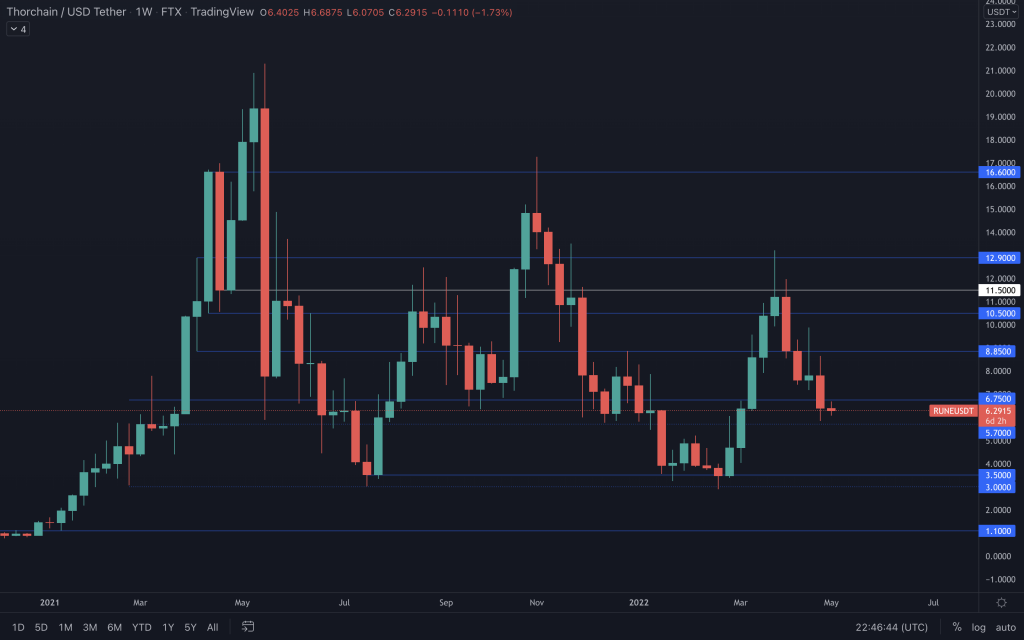
RUNE now finds itself at $5.70 support, the last level supporting it from $3 yet again. RUNE's fundamentals were the reason behind the previous rally, and they will continue to have an impact as a lot is going on with THORChain lately. So, apart from technical analysis, keeping up to date with the ecosystems you invest in is certainly beneficial. Naturally, if BTC was to sh*t the bed, there's not a lot that RUNE could do to avoid dumping with it. Weekly take on RUNE - close below $5.70, and $3 would be next. Above $11.50 screams bull.
SOL
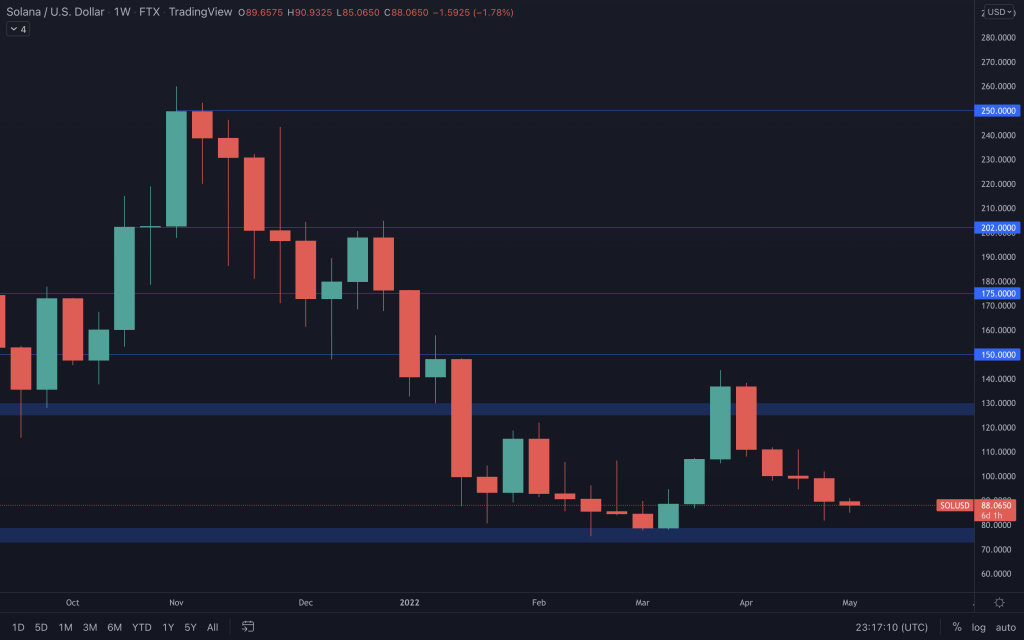
As we've mentioned for the past few days, SOL's inability to hold onto triple digits leads it towards $75, and we see no reason to think otherwise.
SRM
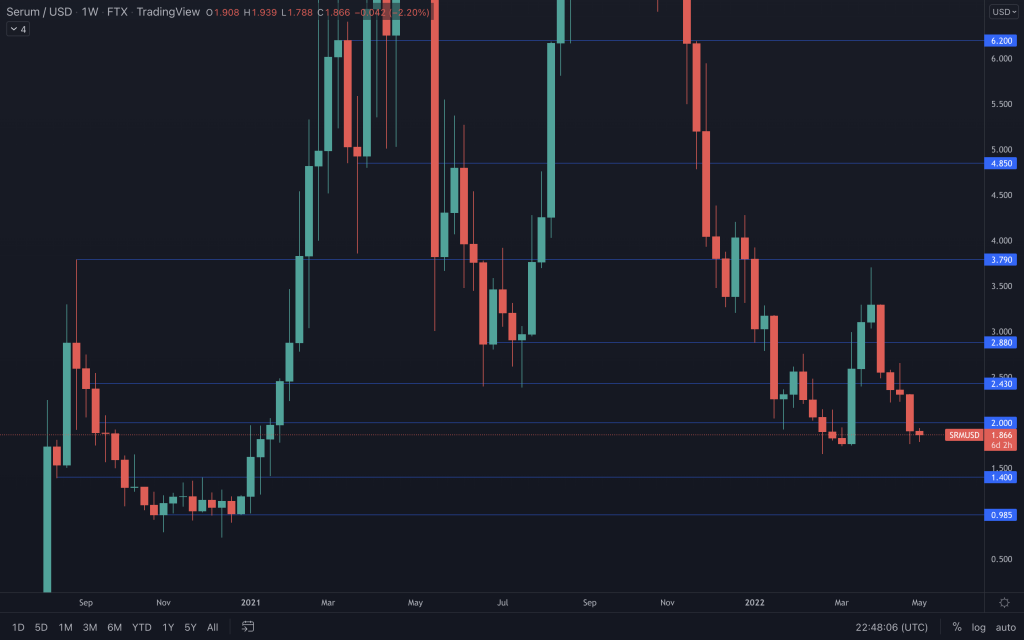
SRM has looked better. After closing below $2, it seems like it's still heading for $1.40.
FTT
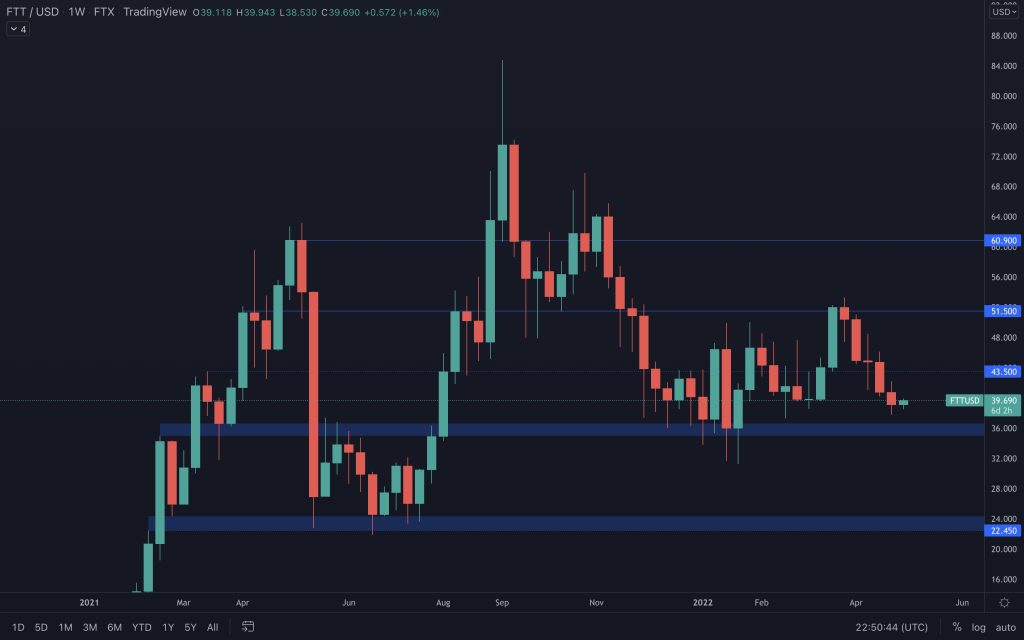
FTT is still ranging. A breakout from the $35-$50 range will indicate the direction that it's likely going to take.
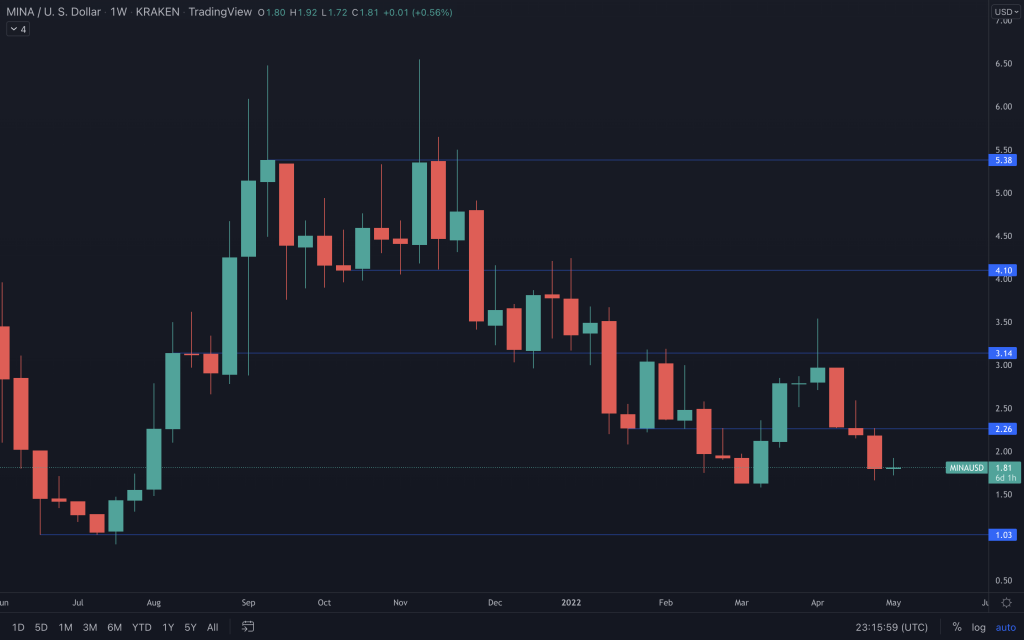
MINA
dYdX
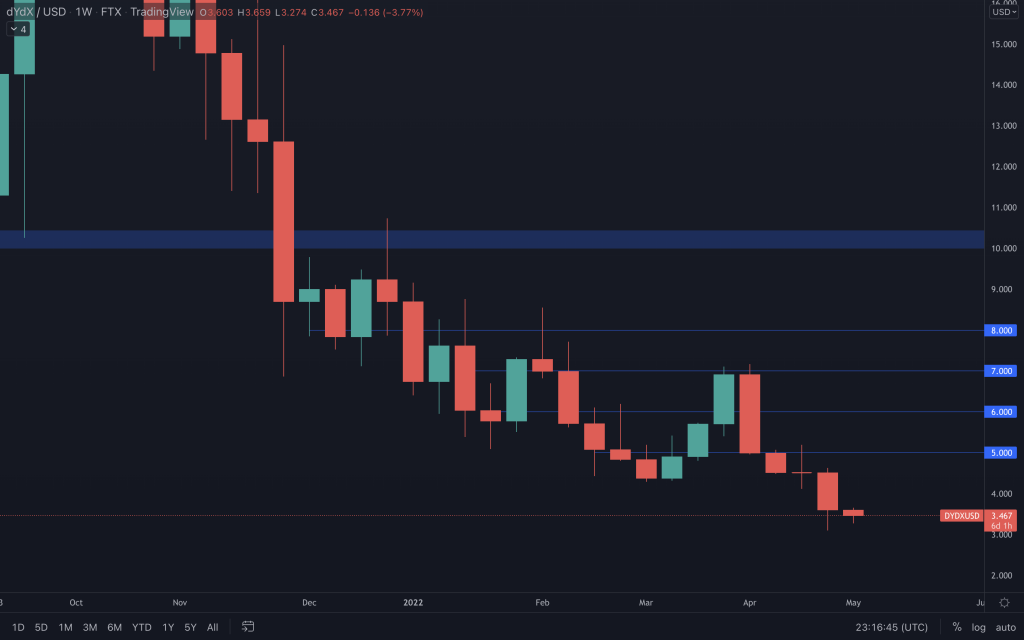
We'll continue to look out for signs of dYdX establishing support, but until then, dYdX continues to be bearish.
Recommended from Cryptonary


