Save 23% ($351) & Get a Free 1-1 Call with our Team ⏰ : 0d 2h 59m 43s

Disclaimer: Not financial nor investment advice. You are responsible for any capital-related decisions you make, and only you are accountable for the results.
It's been a hell of a day with significant downside across the market. The whole of last week's losses (%) have already been exceeded in just one day. Today's downside has already taken each asset to/close to support levels below. Now it has already happened, we'll have to monitor how the week progresses, and this is where our daily analysis comes into play.It is essential to understand what the charts are telling us, and, without indications of strength so far, we continue to look to downside levels. If you have sidelined funds and are looking at assets to buy, there are multiple approaches that you can choose from. One is to DCA at support levels on the way down. Another is to DCA at set timeframes. Maybe even purchasing every X% dip. The more conservative approach is to wait until the market confirms a shift in its momentum. Yes, you may likely miss out on 'catching the bottom'. But not many people do, let alone do it continuously. Anyway, the charts always present a story to their reader, and waiting for indications of a structure change (the higher the timeframe, the more reliable) is an option some may wish to employ.
Either way now is a great time to research or read through educational content. Because when the time comes for you to pull the trigger and make some buys, you're not blindly buying assets but understanding their actual fundamental value. In other words, you know what it is that you're buying next.
Total Market Cap
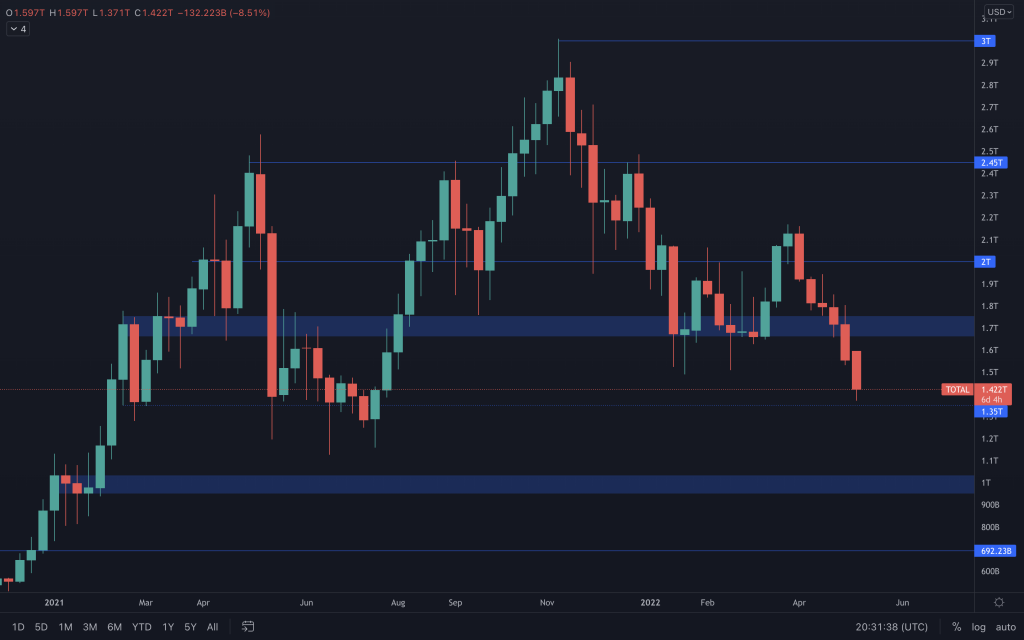
Another tough week across the market now sees the Total Market Cap closing below $1.66T. The following support for this index now comes in at $1,35T.
Altcoins Market Cap
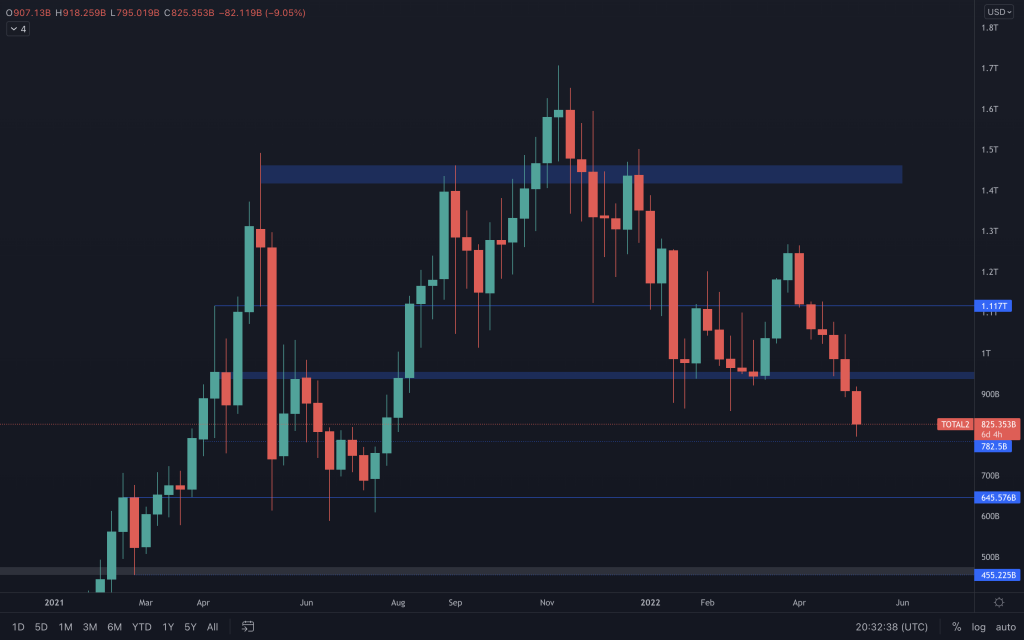
The Altcoins Market Cap has also closed below its old support level, and that level here is $936B. The move into a new range now opens the index up to a potential move down to $645B ($782.5B is an intermediate level).
Bitcoin
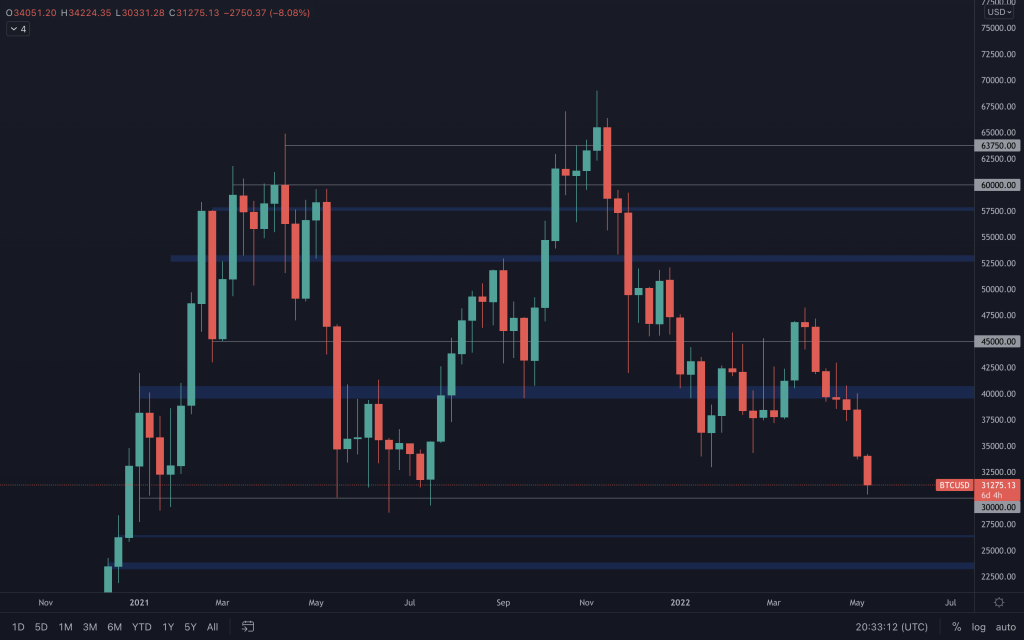
Last week's candle was -11.6%, with today's currently sitting at -8%. Talk about taking the direct route to support! Bitcoin continued to push down over the week to give it a 6th consecutive red weekly candle. It briefly touched the top of the range at $40,000 but failed to make any headway. With momentum still to the downside, support for Bitcoin comes in at $30,000 (both a psychological and technical level), and it's nearly there already. Seeing even a daily closure below $30,000 would threaten a move into the mid $20ks.
Ether
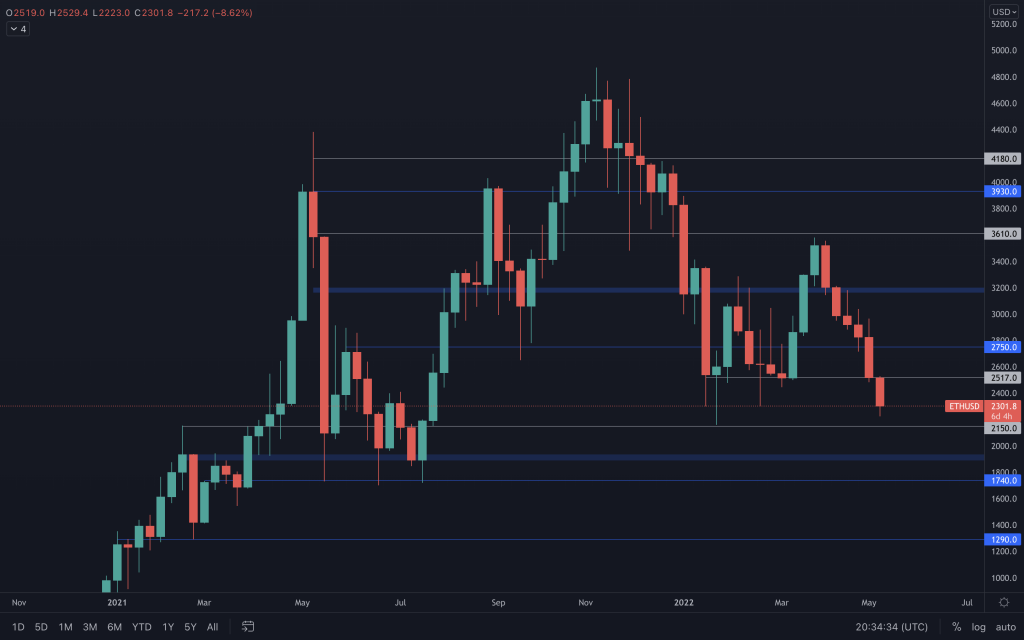
It didn't close below support at $2,517, but it's not going to be immune to this kind of downside pressure either. Support now comes in at $2,150, and below that, $1,740. ETH, like Bitcoin, now has a lower low, so it can form a lower high to confirm the structure change. With only bearishness visible in the lower timeframes, there's nothing to indicate it will happen yet. But, as always, we'll continue to monitor the charts for any indications.
DOT
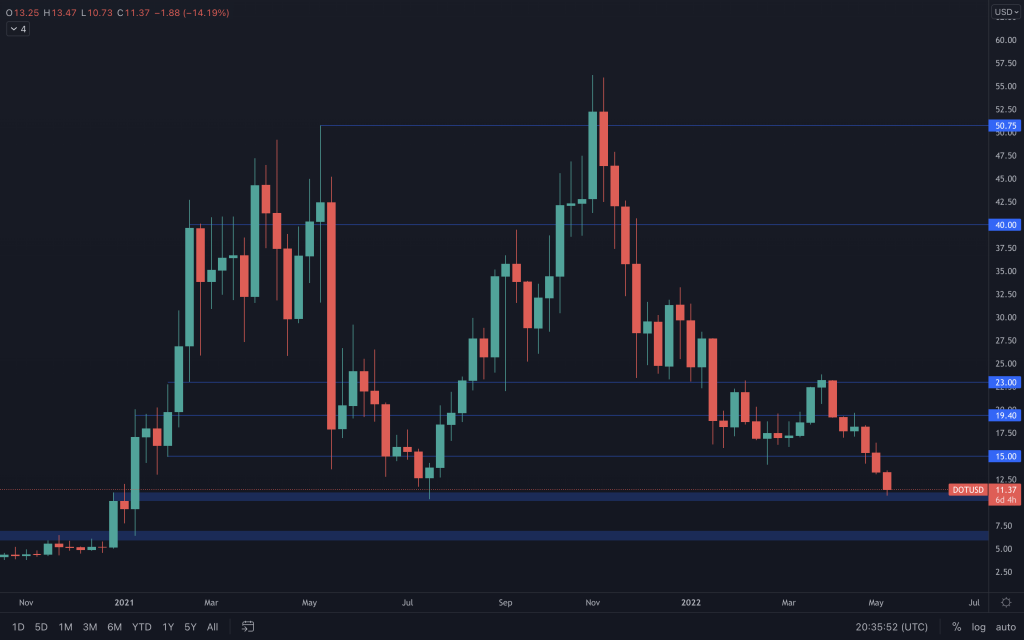
DOT's closed the week out below $15, quickly moving to $10 today. A closure lower than $10 and $6 would come into play.
SNX
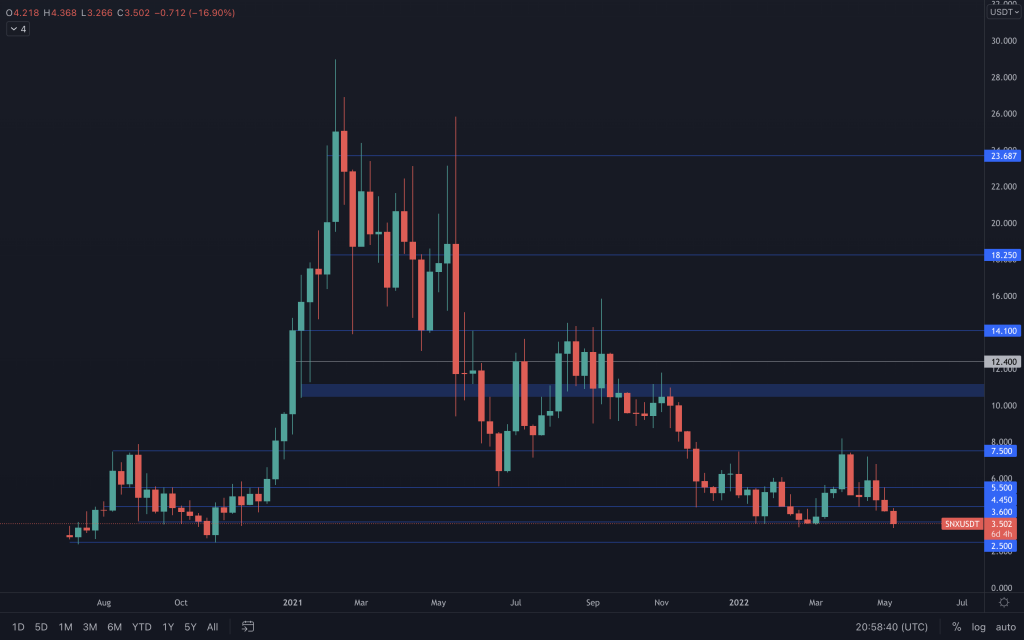
Any failure to hold $3.60 and $2.50 would be next. It doesn't sound much, but that move would be over -30%. $3.60 has been a reliable support level of late, but the price has tested it on multiple occasions. Too many tests eat into the buy orders that prop price up, eventually seeing it fall below.
RUNE
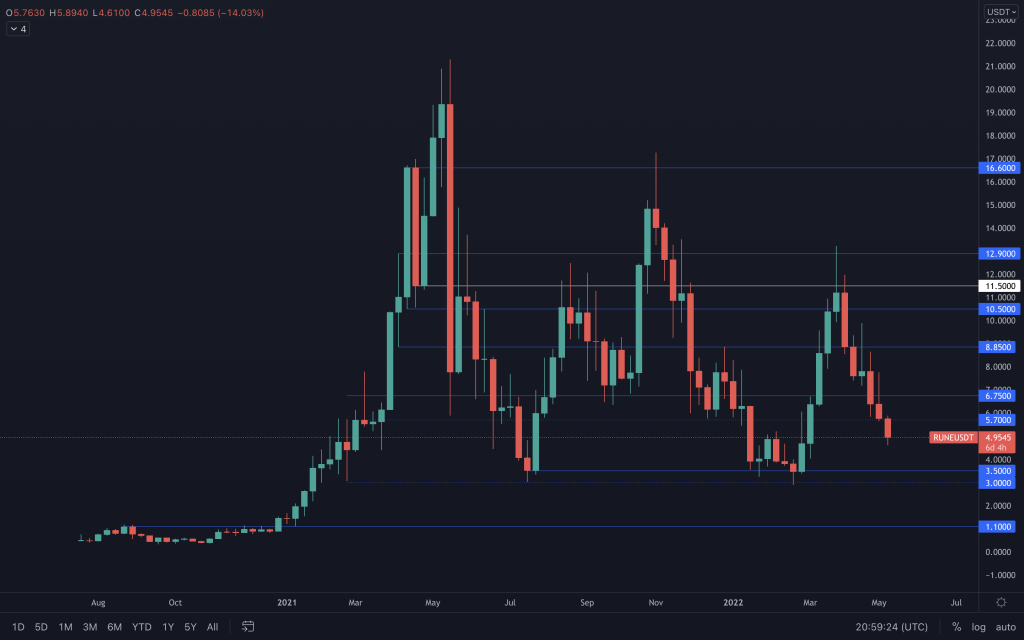
Unless it closes back above $5.70, RUNE's on its way to $3.50. In the past, it has found liquidity as low as $3, which shows why candle closures are important.
SOL
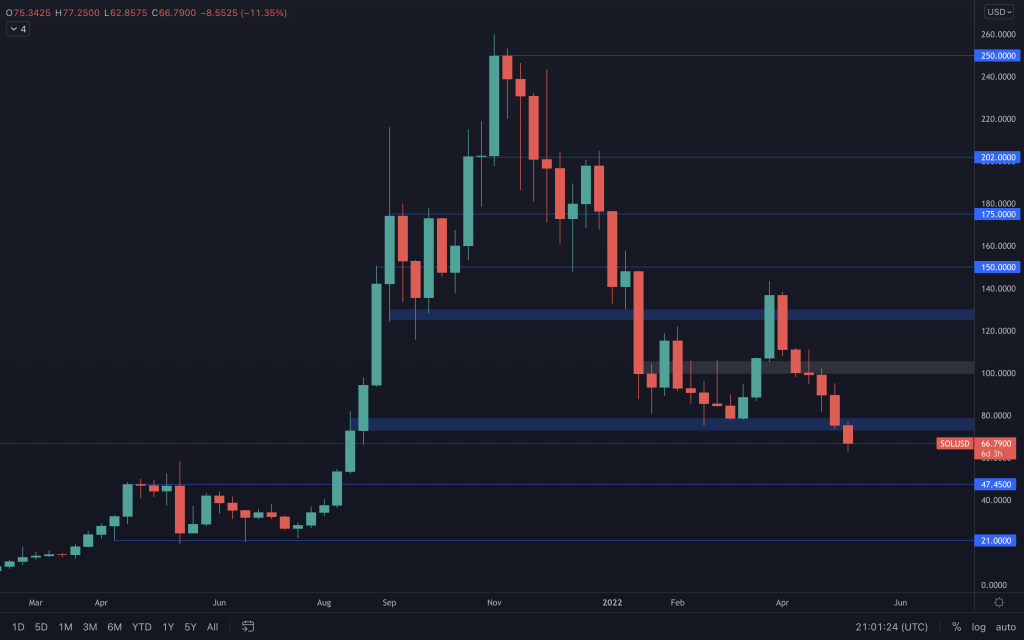
Last week's candle closed above its support ($75). It is at risk of losing $75 tonight, which would mean that a sub $50 SOL becomes possible.
SRM
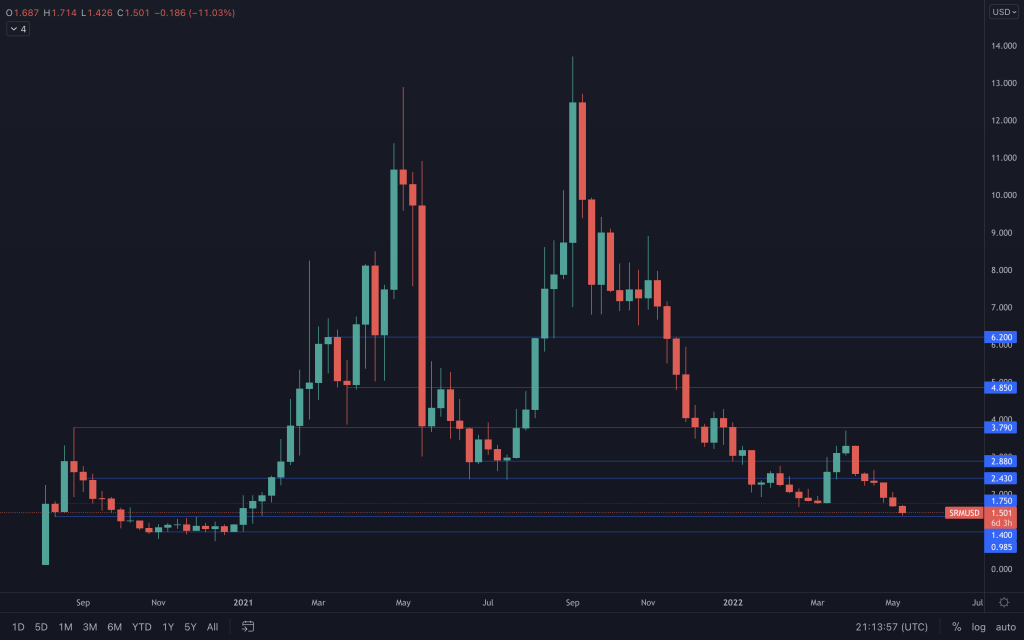
$1.40 has already been tested today, so we'll have to see how the SRM and the market react as the week goes on. A move below $30,000 on BTC will likely see SRM move pretty quickly to the $1 level.
FTT
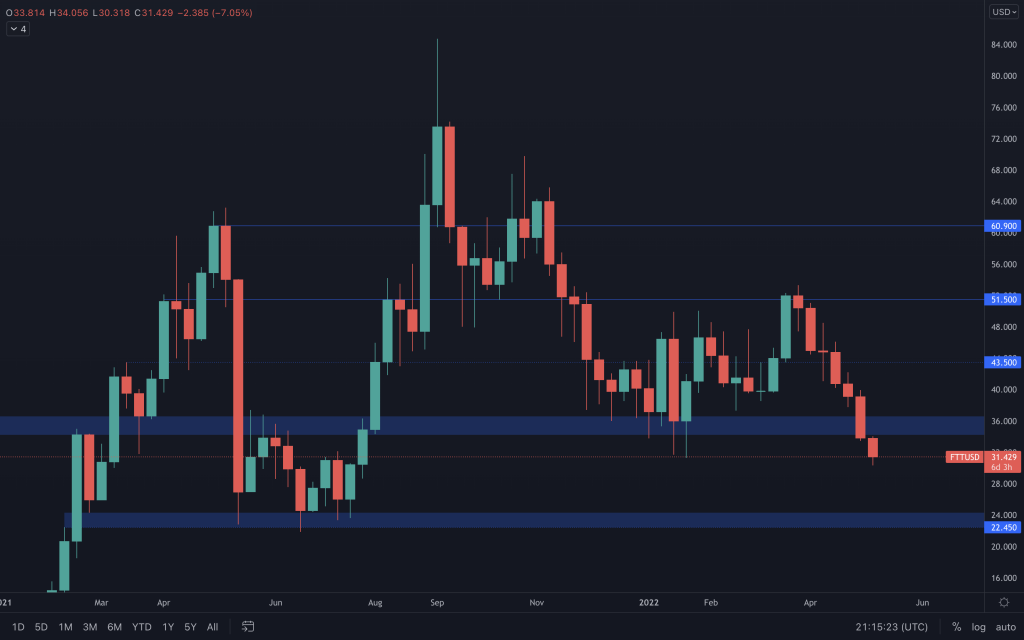
FTT closed yesterday out ever-so-slightly below its trusty ol' range, which now means that $22.50 becomes increasingly likely. That is, unless it can close back within the range ($35-$50).
MINA
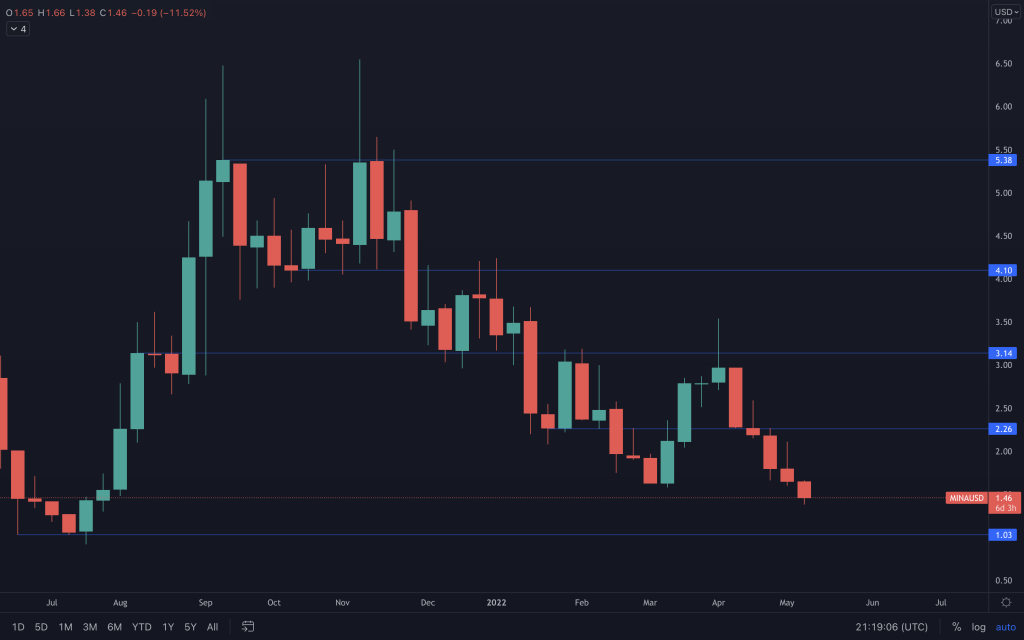
MINA now looks like it is on the road to $1 after making a lower low. A daily closure below $1.50 is all that's needed.
dYdX
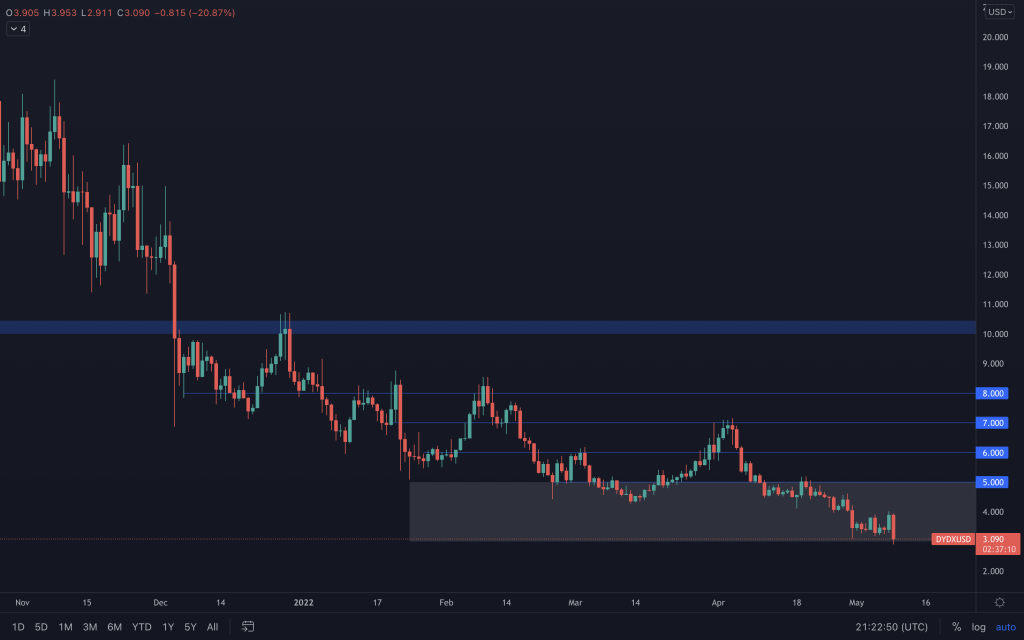
The daily timeframe used here dYdX foundation did a Justin Sun and announced an announcement in their Discord. It simply said '3 days'. Anyway, dYdX began to move to the upside off of that and almost signalled that a further bounce could be on the cards. Unfortunately, the overall market conditions didn't permit it, and today's candle is currently a bearish engulfing, which (if it closes like this) will cancel out yesterday's strength.
Recommended from Cryptonary


