Save 23% ($351) & Get a Free 1-1 Call with our Team ⏰ : 0d 2h 59m 44s
Weekly Technicals Pro - Vol 96
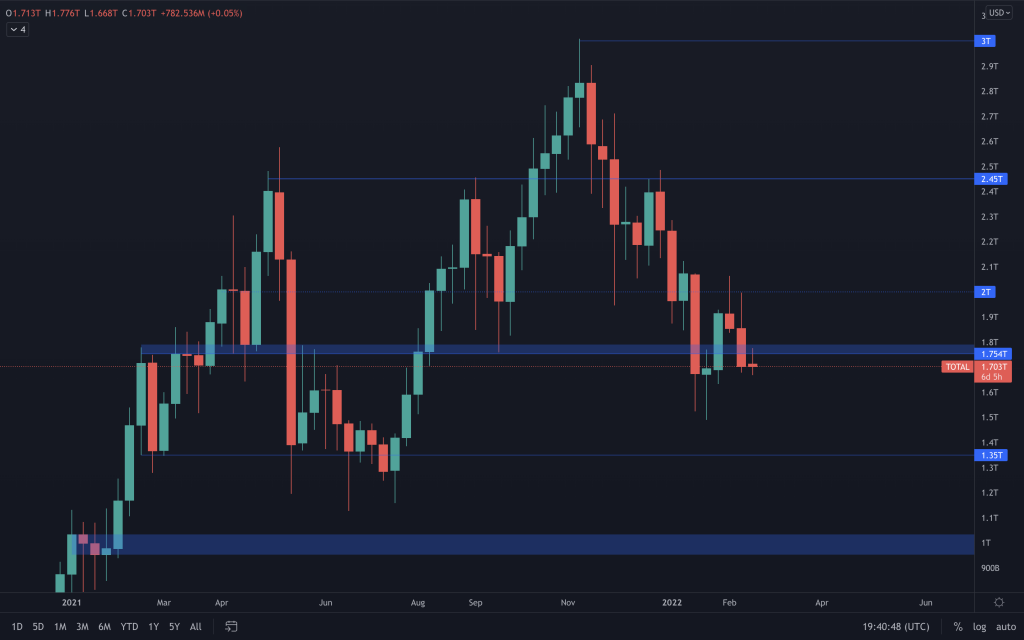
After seeing a rotation of $1.75T from resistance and back into support, it was very much something that we couldn't ignore, even though the market structure hasn't been broken. This level has become an established pivot level over the past year since The Total Market Cap first reached $1.75T in February 2021. At this attempt, the $2T level has proven too big an ask to overcome at the first attempt. We've seen this level rejected, creating another lower-high in the process. The inability to close above $2T has resulted in the continuation of the bearish structure and the Total Market Cap returning into the $1.35T-$1.75T range. We are looking out for a break in the market structure by creating a higher-low, as that would help this index move up towards $2.45. More explained on the Bitcoin write-up...

Disclaimer: Not financial nor investment advice. Only you are responsible for any capital-related decisions you make, and only you are accountable for the results.
Market Indicies
Total Market Cap
Altcoins' Market Cap
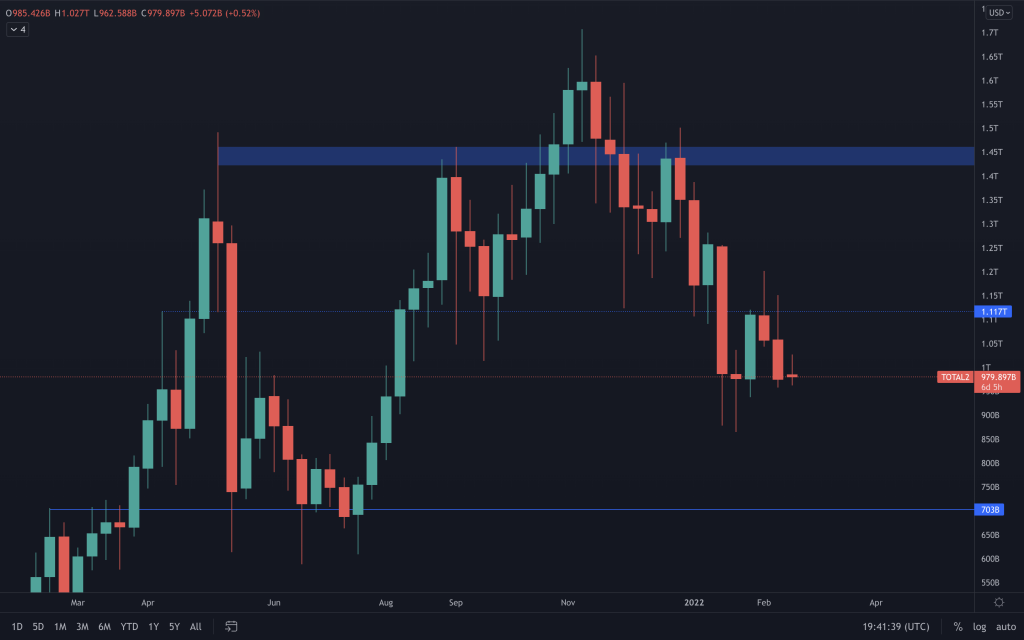
We haven't seen the same sign of strength across altcoins as to what we've seen in the Total Market Cap. This is down to a higher percentage of the invested funds going towards Bitcoin. The Altcoins' Market Cap's structure remains bearish for now, especially when coupled with the inability to overcome resistance at $1.117T.
Bitcoin
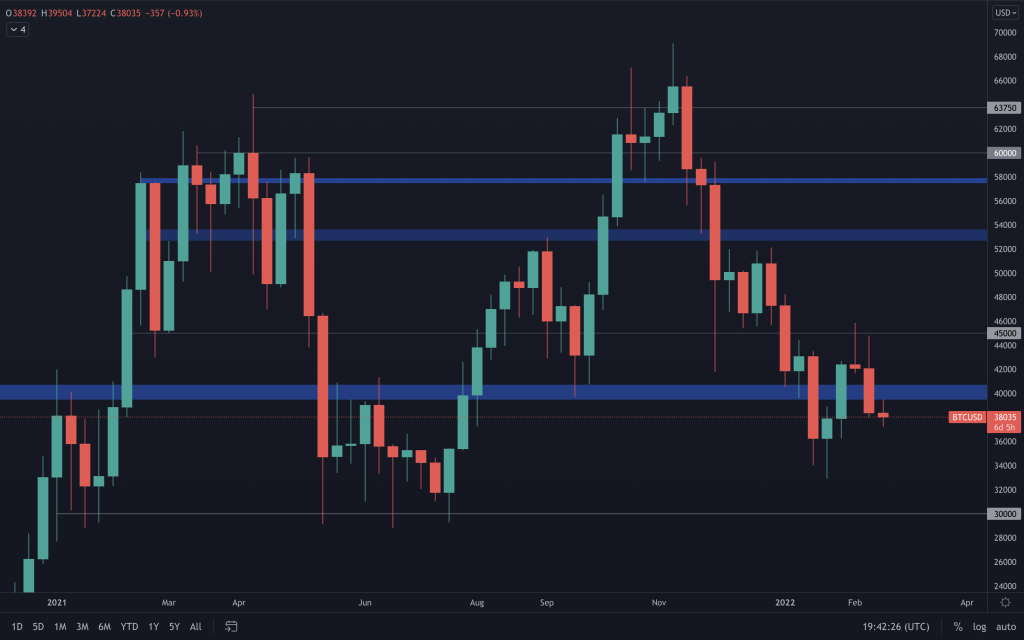
After creating a higher-high, we're in the situation where we are looking at Bitcoin to form a higher-low now. Of course, real-world events are playing a big part in the market movements at the moment, resulting in increased volatility, so it is important to keep one eye on them. Anyway, back to the TA. As we mentioned yesterday in our daily analysis, 'indications of change tend to happen subtly at first, so we make sure to pay attention and highlight every detail'. Think back to November 2021, when we stated that Bitcoin's market structure showed bearishness, although the Total Market Cap didn't reflect this. The result of that observation has been a move down from $60k to current price levels. So, the changes that we have observed here, on Bitcoin, an asset that occupies 40+% of the crypto market share, is a potential change in structure and the previous reclamation of a significant level to create a higher-high. Granted that this level has been lost, but a potential market structure change remains on the table. So, as mentioned above, we're looking to see whether Bitcoin can now create a higher-low. However, with it unable to take place at a support level, it's a matter of observing the market to see whether it forms and then followed by a reclaim of $40,000 to confirm it.
Ether
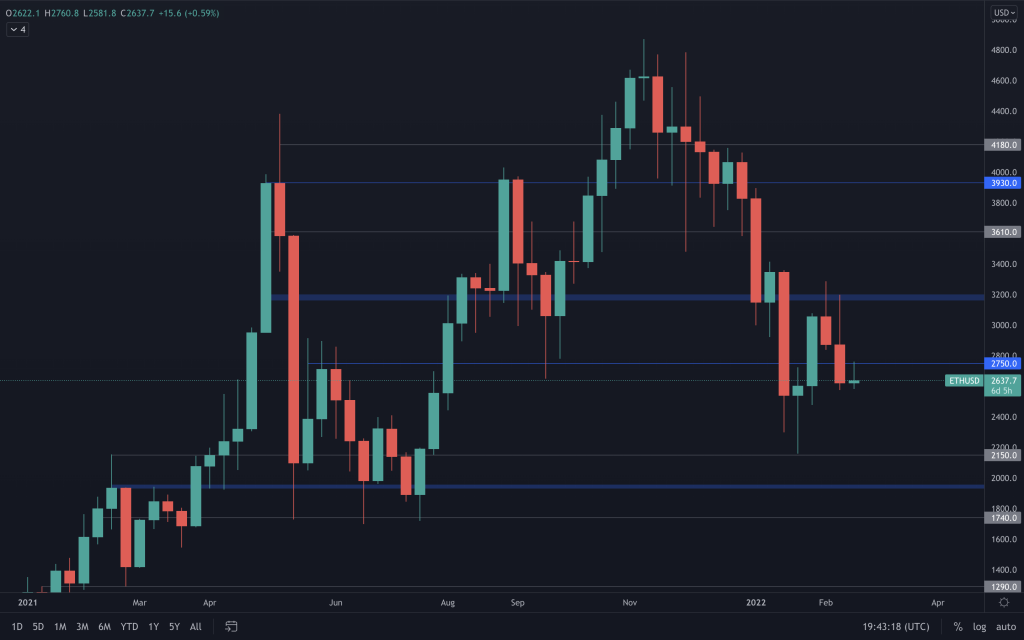
ETH has also closed below its support level at $2,750, which puts it between around $2,000 and $2,750. With it being one of the two majors, we'd expect to see the same reflected here if Bitcoin goes on to create a higher-low. If it doesn't, we wouldn't rule out ETH moving down to under $2k. With the possibility of a change in market structure on Bitcoin, we wouldn't be looking to short here.
DOT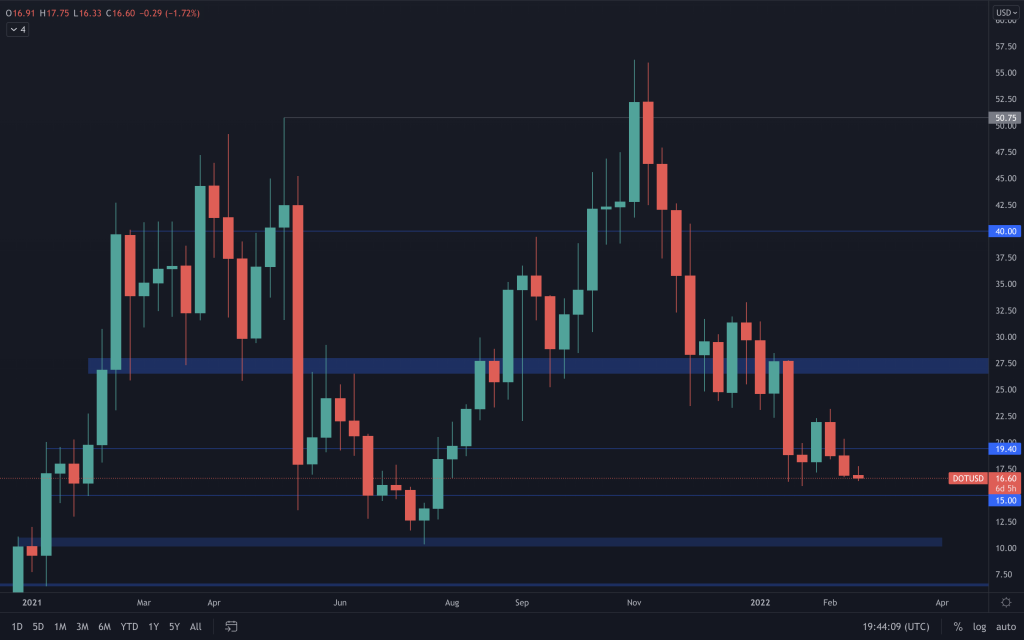
DOT's daily and weekly structures continue to reflect bearishness, as does much of the market. There's nothing to take note of as the price has continued downwards. If DOT were to lose $15 as support, $10 is the next level we'd look towards.
SNX
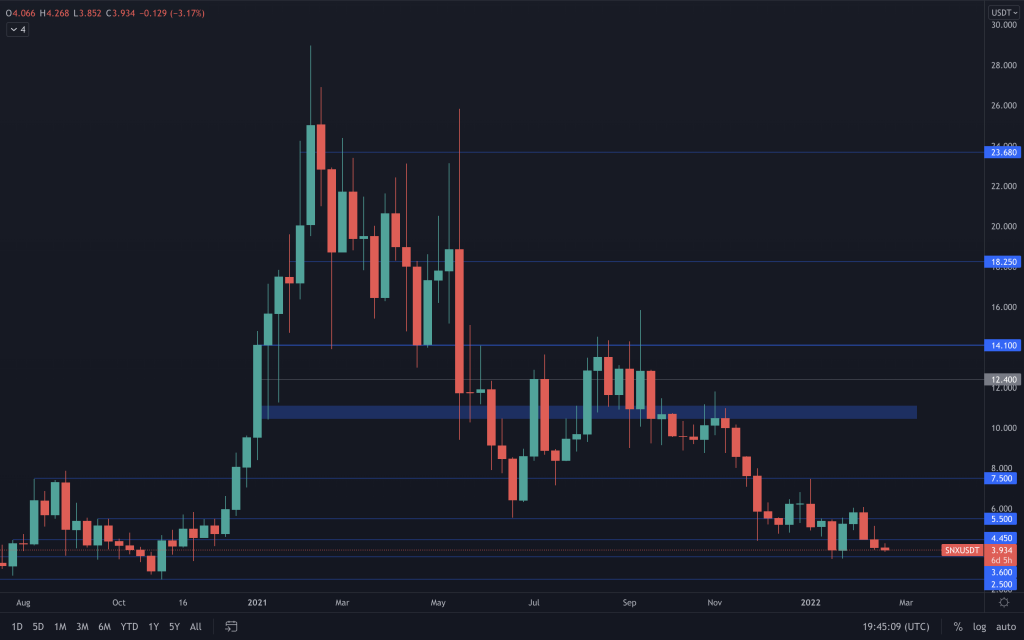
SNX is making its way back down to $3.60 after the previous week's bearish engulfing candle. It will, once again, need a strong reaction from there as repeated retesting brings weakness to a support level. Should a daily candle close under $3.60, $2.50 would likely approach quickly.
RUNE
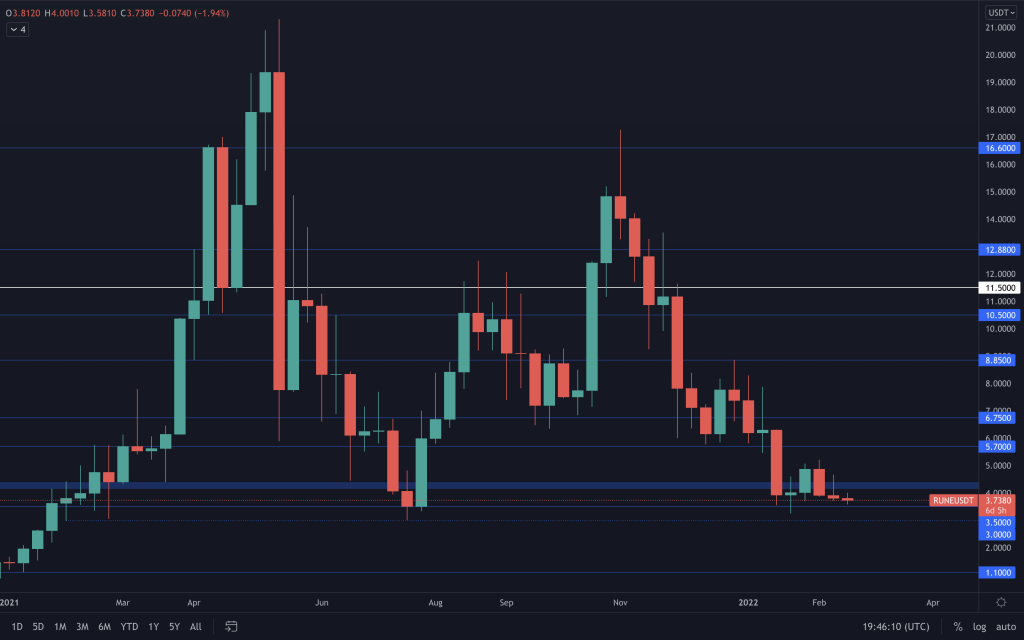
RUNE's downtrend continues, and we're yet to see any indication of relief as it continues to set lower-lows and lower-highs. The $3 level has been a good source of liquidity in the past, so we'll be looking at RUNE's reaction there. If RUNE were to close below $3, it would look bad on the weekly timeframe, as it offers $1 as the next weekly support.
SOL
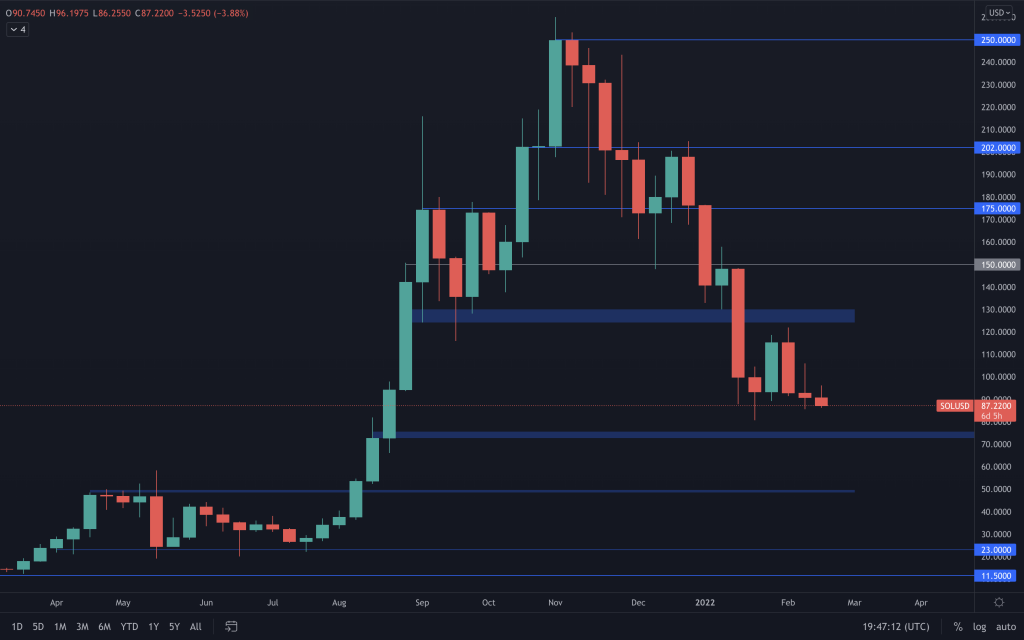
SOL continues to move within its range, and the range at this point is $75-$125. The structure continues to remain in 'down-only' mode, for the time being, creating lower-lows and lower-highs and heading towards $75. A loss of $75, should it happen, would certainly bring a $50 SOL into play.
SRM
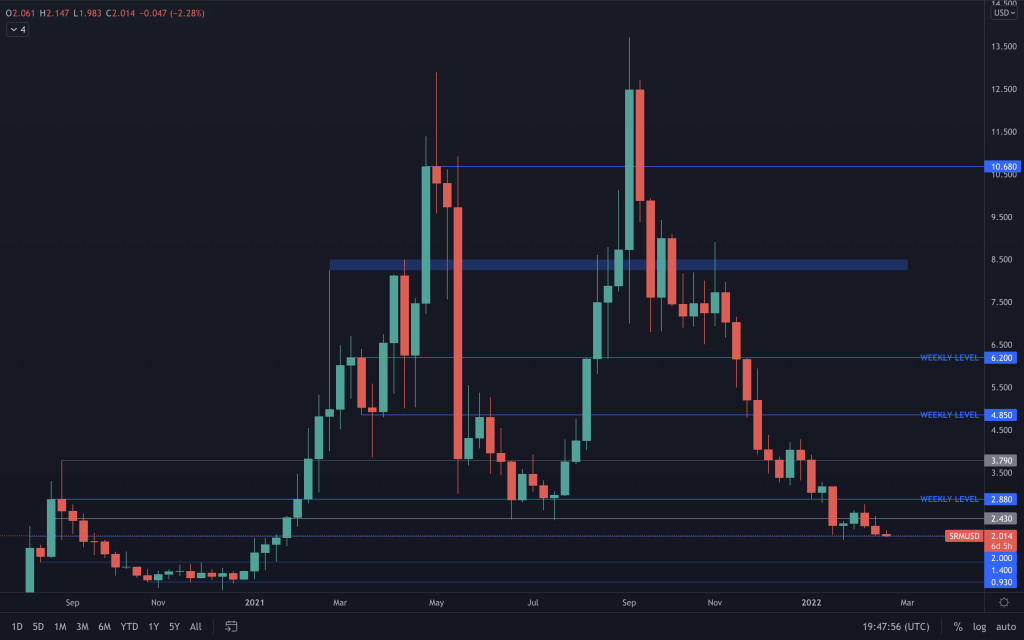
SRM has yet to show any real strength as it continues its bearish moves lower. Should price see it trade lower than the previous low ($1.92), we'd then expect to see $1.40 relatively quick too.
FTT
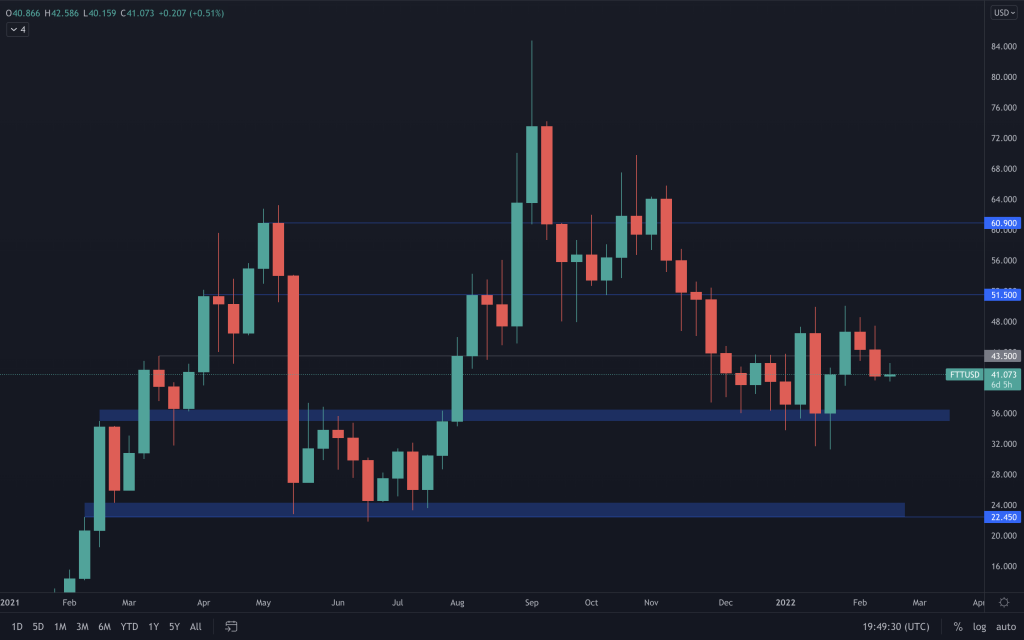
FTT continues to perform reasonably well. It has closed the week below $43.50, which hints towards another move back to the bottom of the range. And on that note, any close below $35 opens up the possibility of a move to $22.50.
MINA
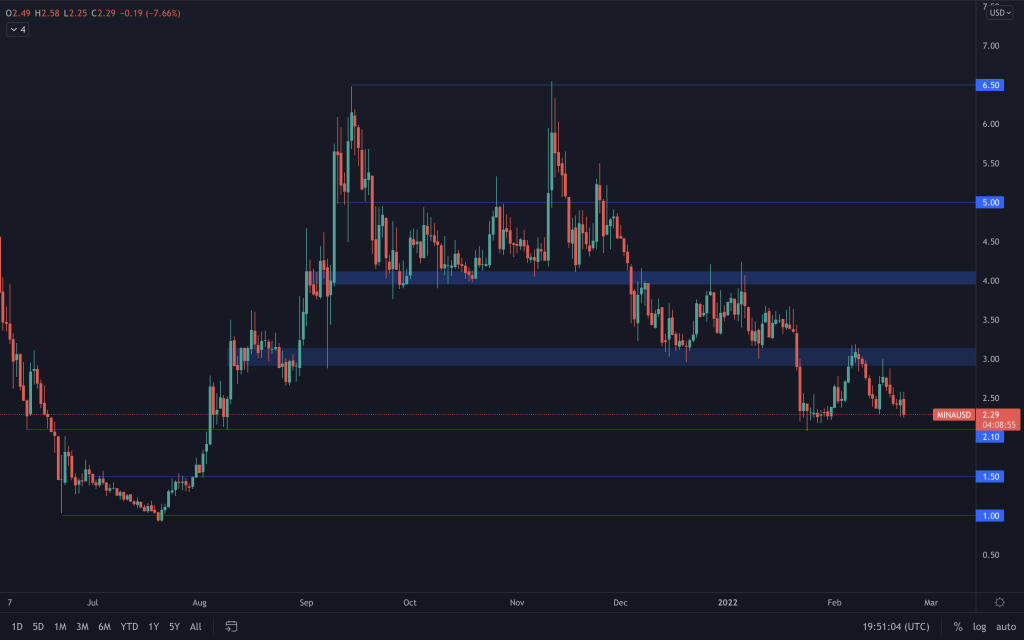
This is the daily timeframe chart for MINA as the weekly chart doesn't offer the best visual. We can clearly see that MINA has been in a downtrend since the middle of November, moving down through its supports, and it has offered little signs of bullishness. Should this downtrend continue and $2.10 be lost as support, it's likely that MINA eventually moves down to $1. There isn't really anything live on MINA since the delay of Snapps initially scheduled for Q1 2022. However, it should have several ecosystem updates (all going well) scheduled for Q2 2022.
DYDX
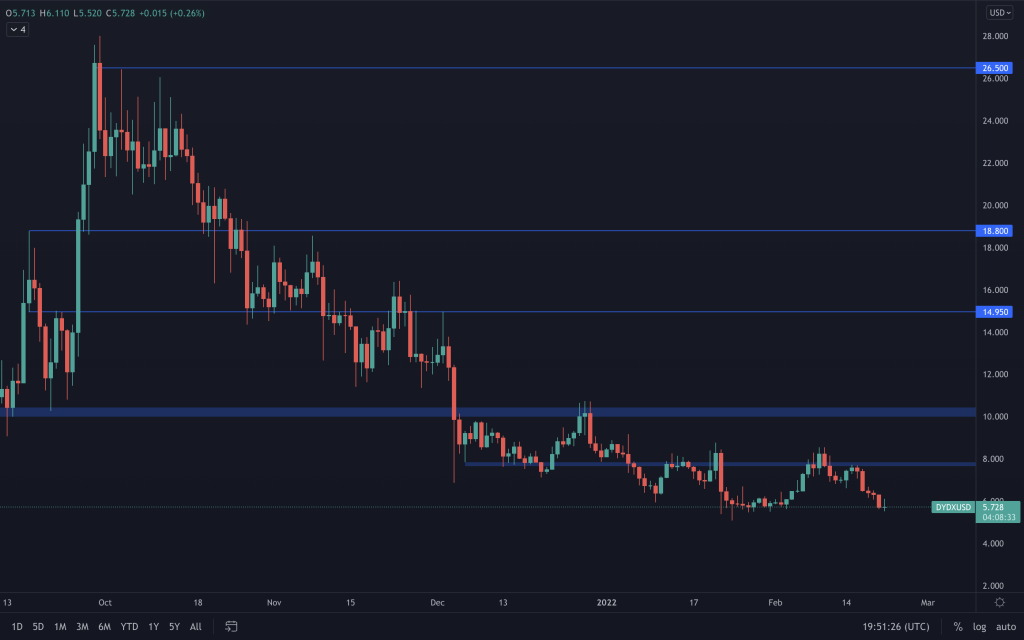
dYdX continues to move down as it moved towards our area of interest which is $3-$5.
Recommended from Cryptonary


