Save 23% ($351) & Get a Free 1-1 Call with our Team ⏰ : 0d 2h 59m 43s

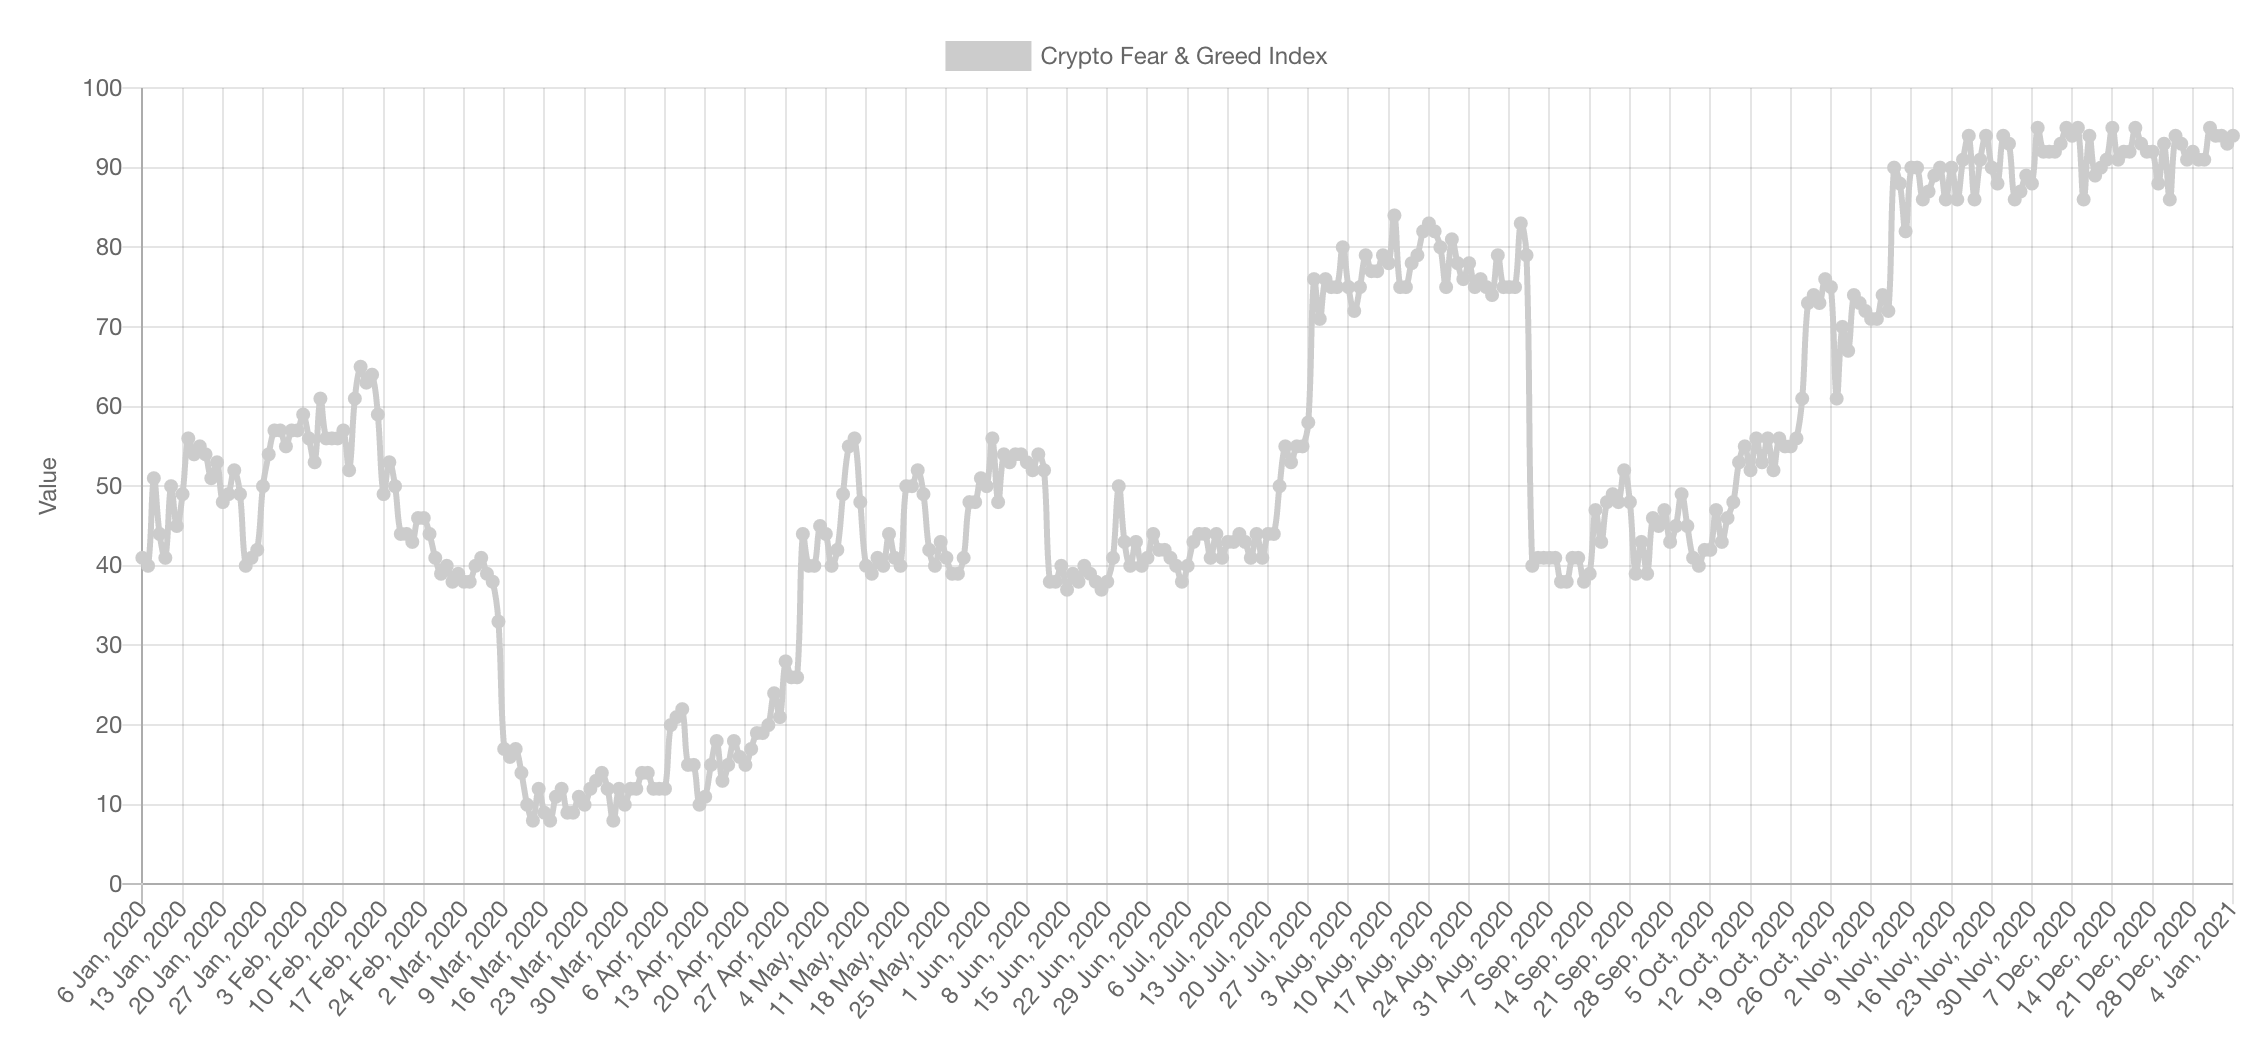
This metric is a good reality check to maintain cautiousness and maintain firm risk management at all times. Most definitely not a tool to time the market by any means as this has been in “Extreme Greed” since Bitcoin was at $14,000.
Trading Volume
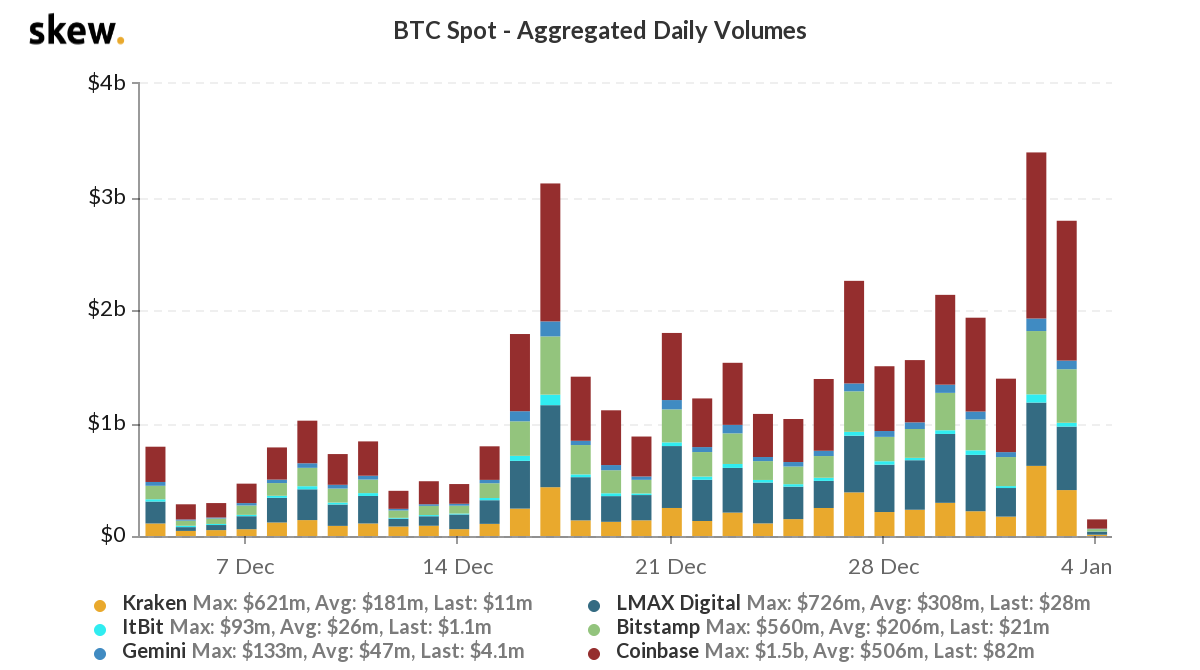
“Volume must confirm the trend”, this is one of the pillars of Dow Theory. Here, volume is confirming the very obvious uptrend Bitcoin is undergoing.
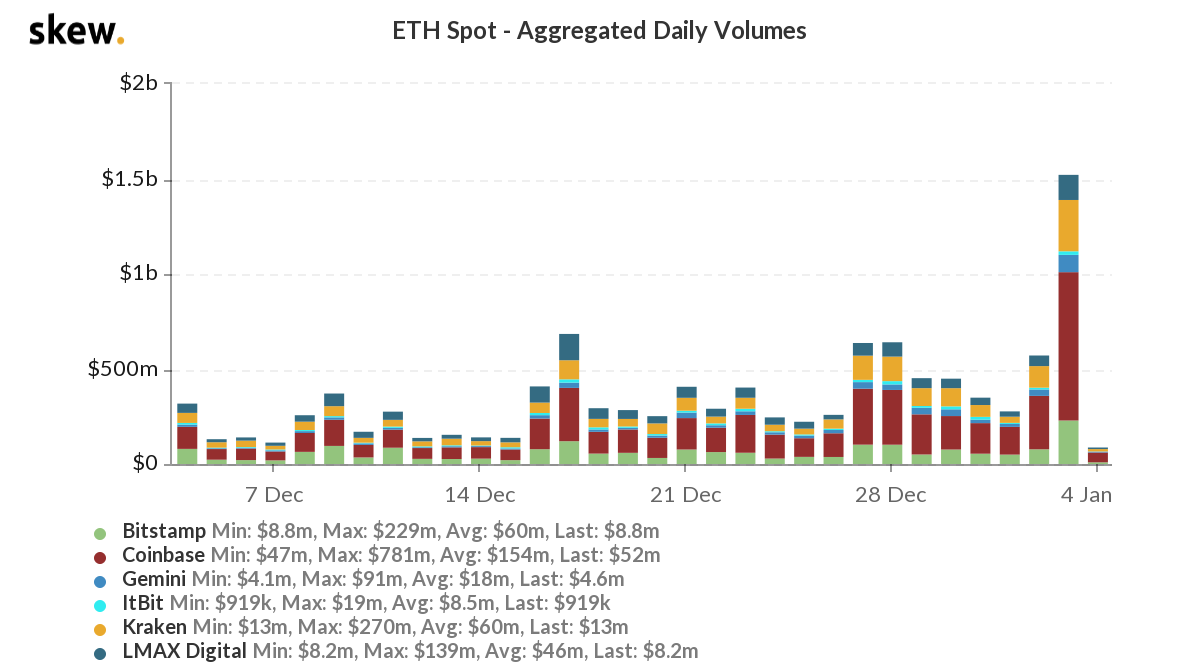
As stated for weeks now, ETH saw an increase in volume but it was not significant yet. We were awaiting for a big volume breakout like we saw on Bitcoin. It has finally happened. Over $1.5B in volume in a single day on ETH.
Market Indexes
Total Market Cap
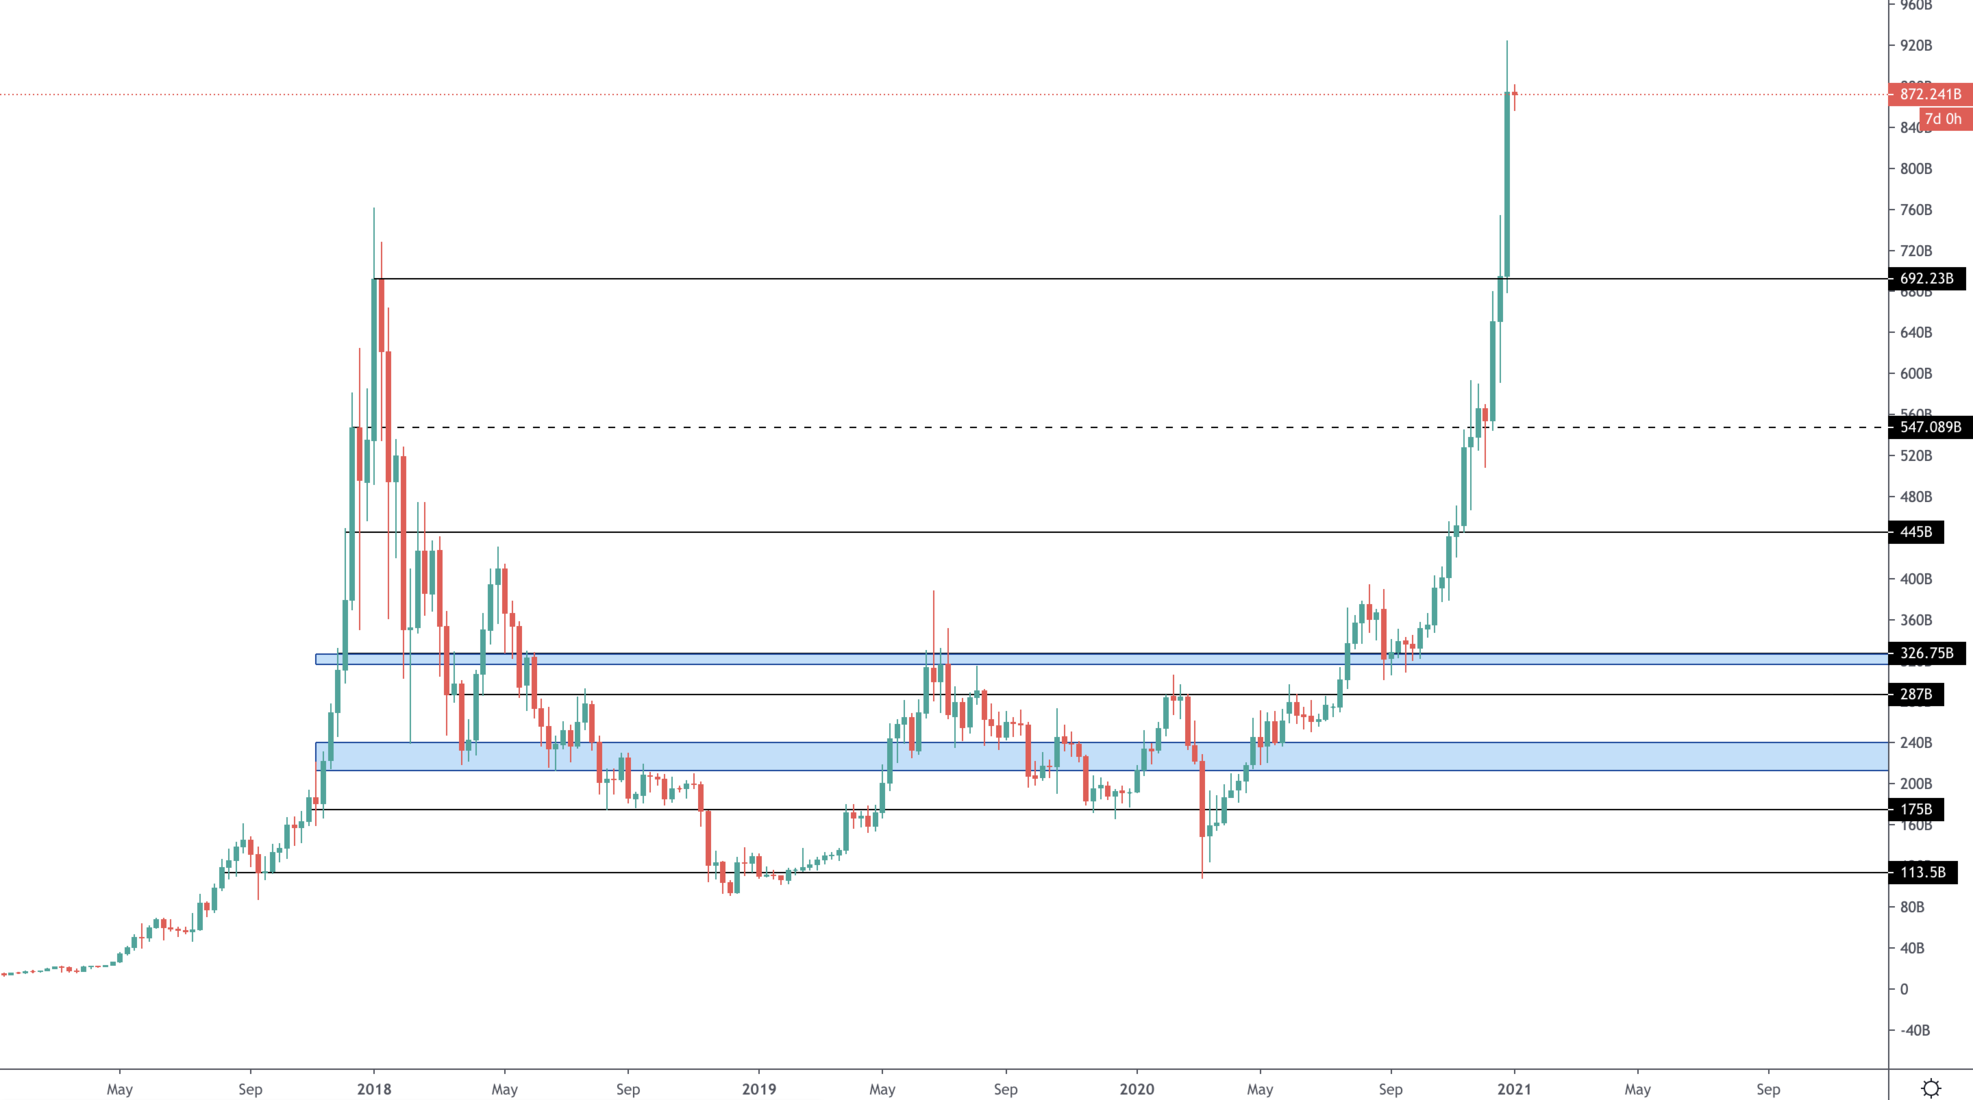
The Total Market Cap is finally at a new ALL-TIME HIGH. This is very obviously a new bull-run, one in which we expect to see a Total MCap in the trillions. First stop: $1T.
Altcoins MCap
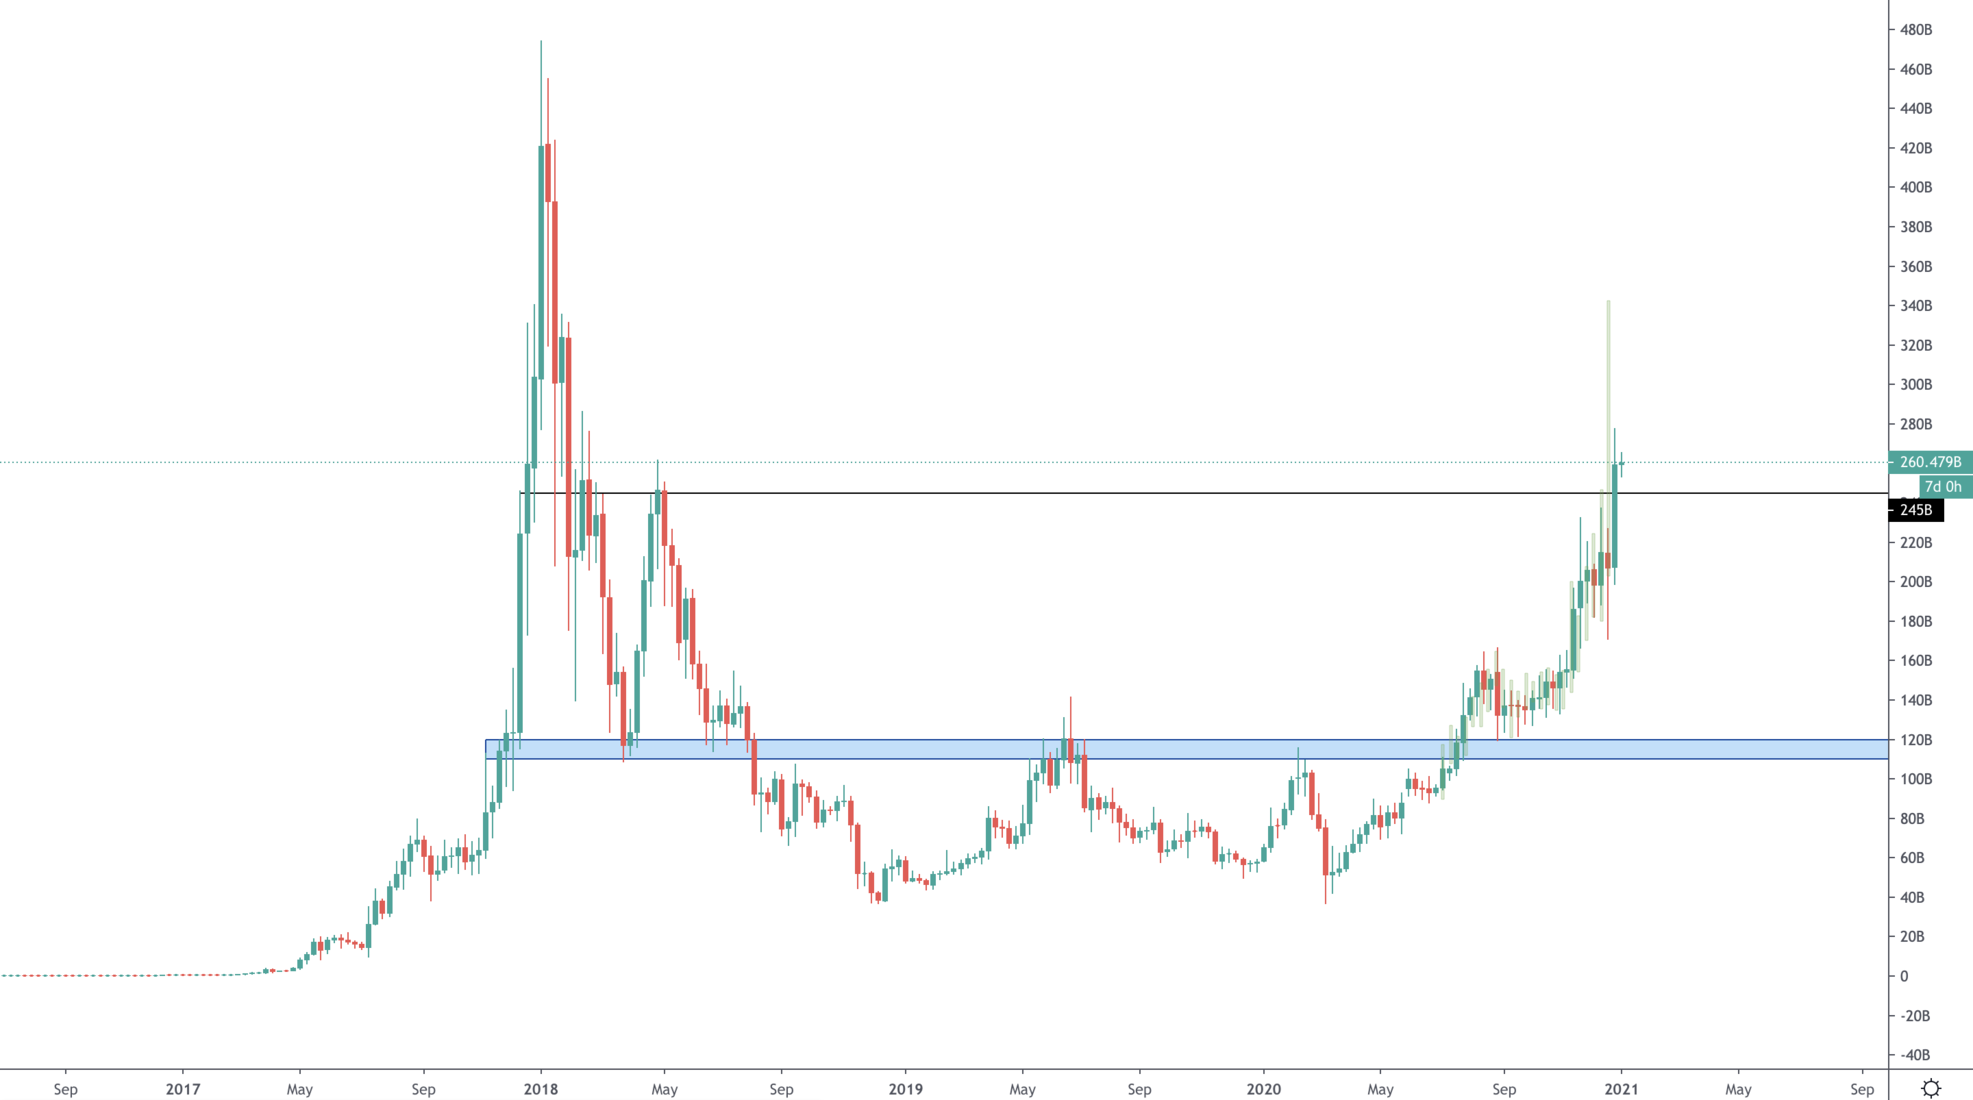
This fractal has materialised spectacularly well. Price has not only reached our $245B target but it flipped it from resistance into support on the weekly timeframe. As discussed on Discord Pro, there are a lot of over leveraged longs that will get flushed sometime soon, this is a good pullback level.
Bitcoin
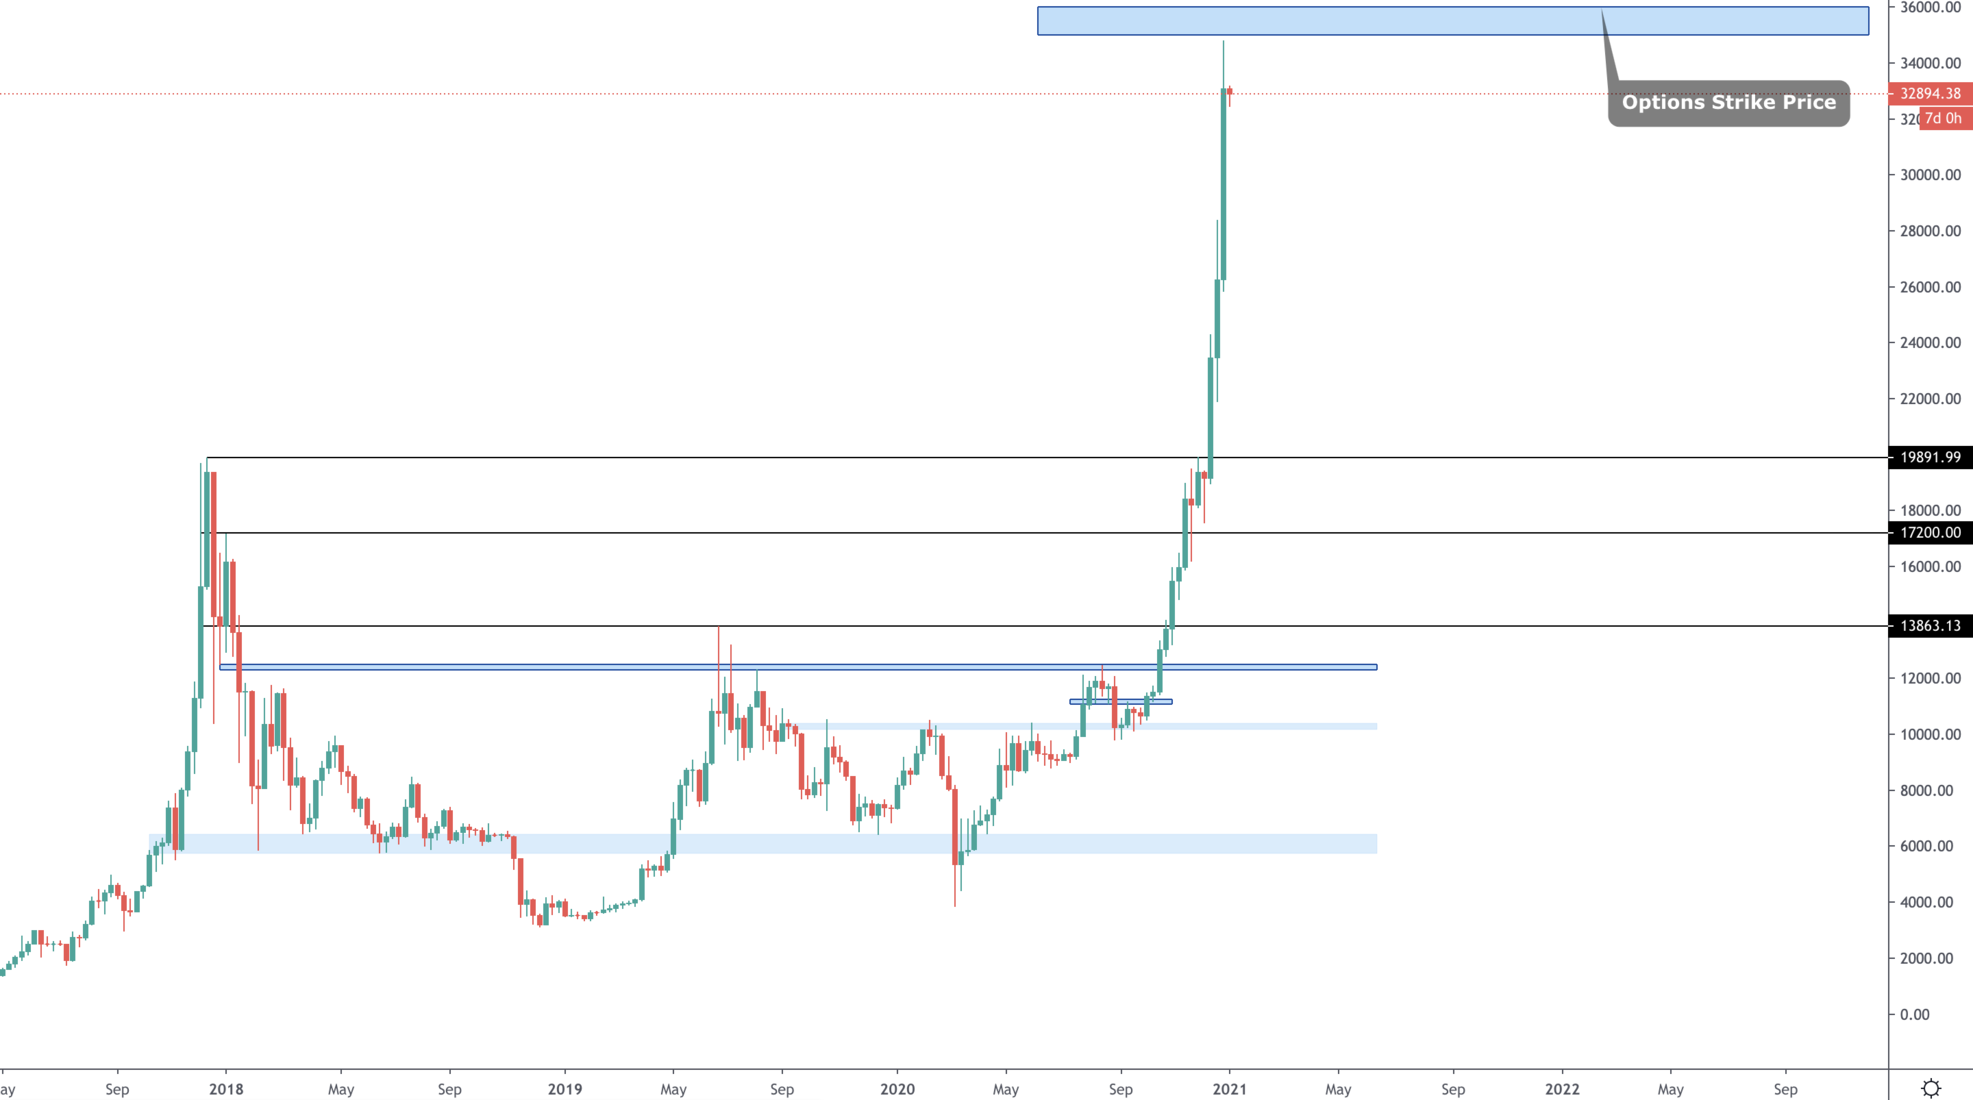
Undoubtedly a spectacular rally which begun all the way from the $10,000 flip from resistance to support to now price being 3.3x higher. The next level to look out for is $36,000 at the end of January in particular.
As explained in Discord Pro this a popular options strike price for the late Jan expirations.
ETH
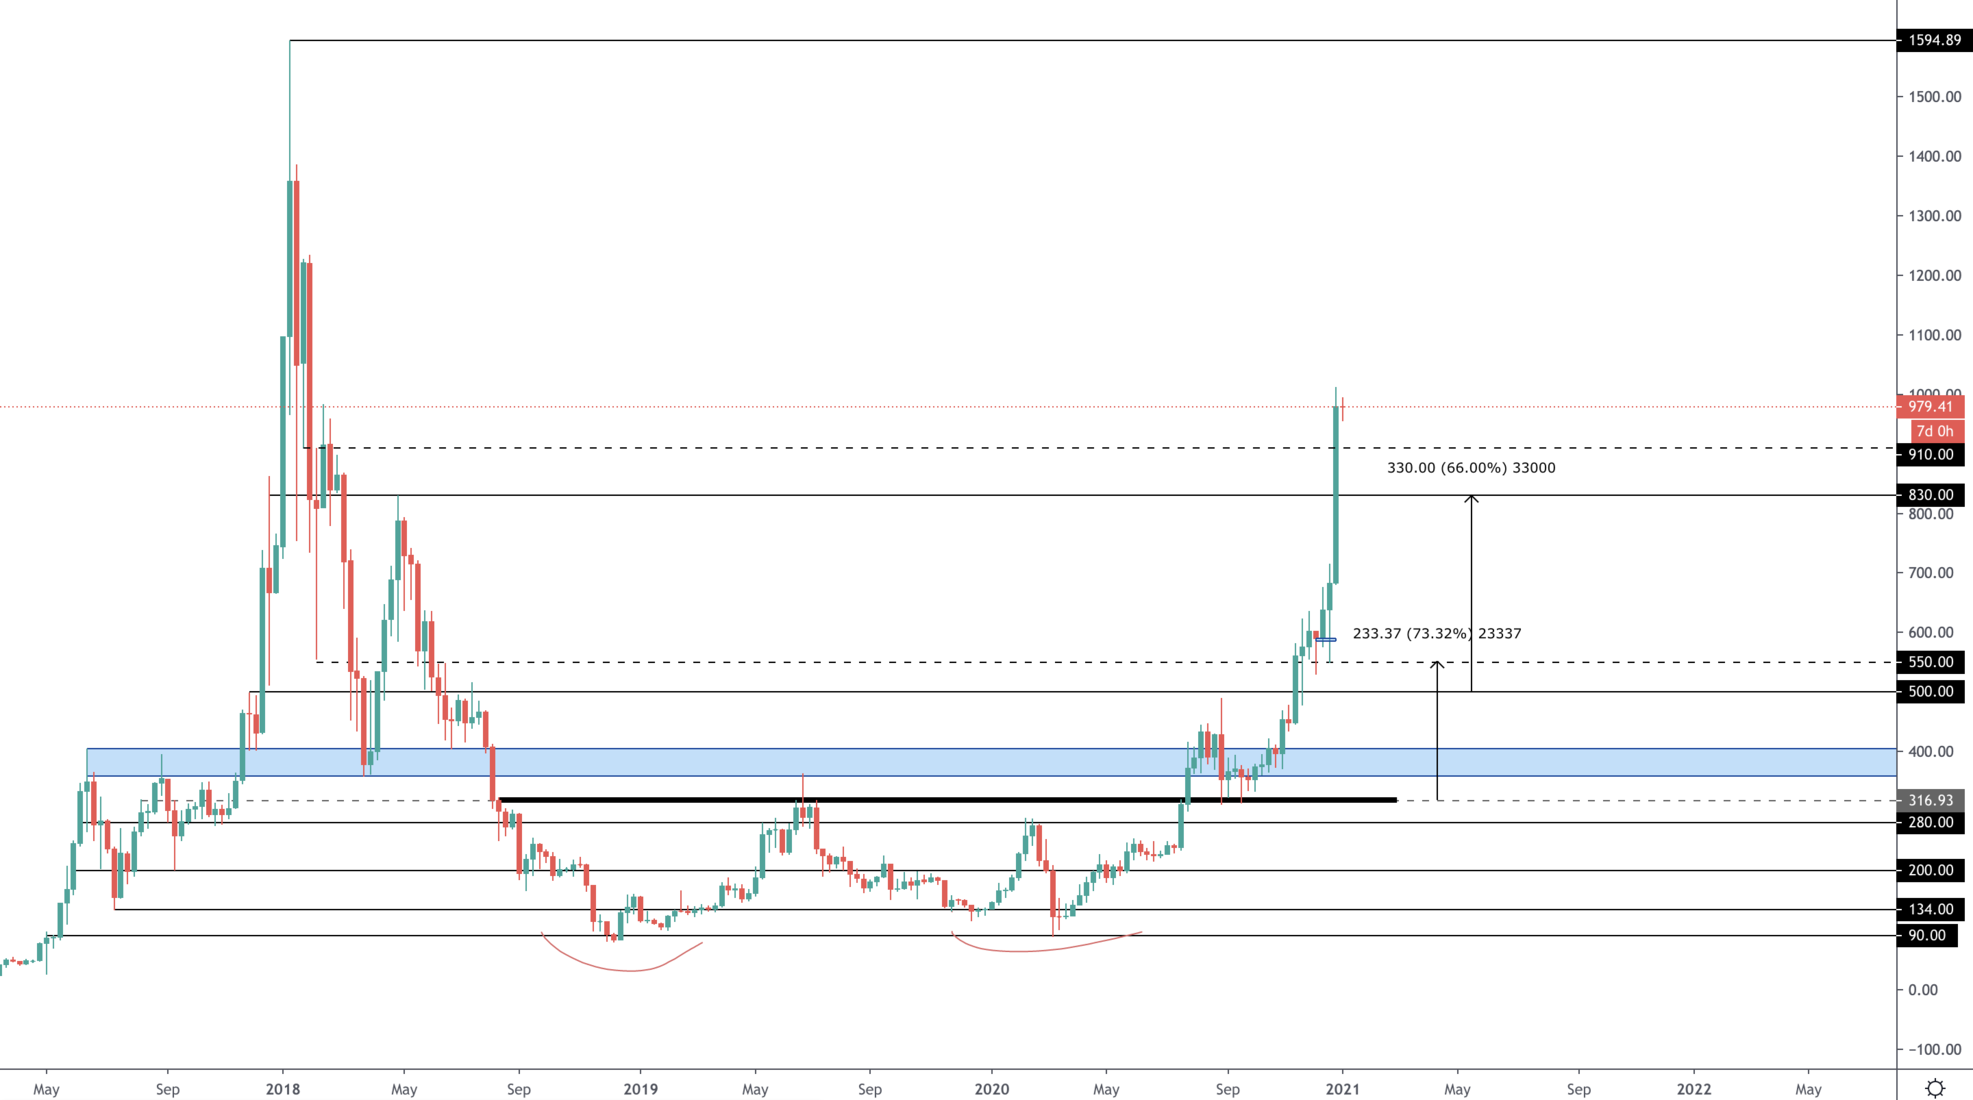
ETH has shown massive strength and massive demand. Price has reached and breached $800. The levels of support are $910 and $830. The target is ATH.
DOT
Another layer-1 platform went parabolic: DOT (native asset of Polkadot). It is in price discovery and creating higher highs and higher lows consistently. The only levels of resistance are psychological key round numbers.
SNX
As explained in the YouTube Video made exclusively for Pro members (click here to watch), SNX broke ATH and retested it for support and is now in price discovery like a rocket-ship. We are personally not selling anything under $60.
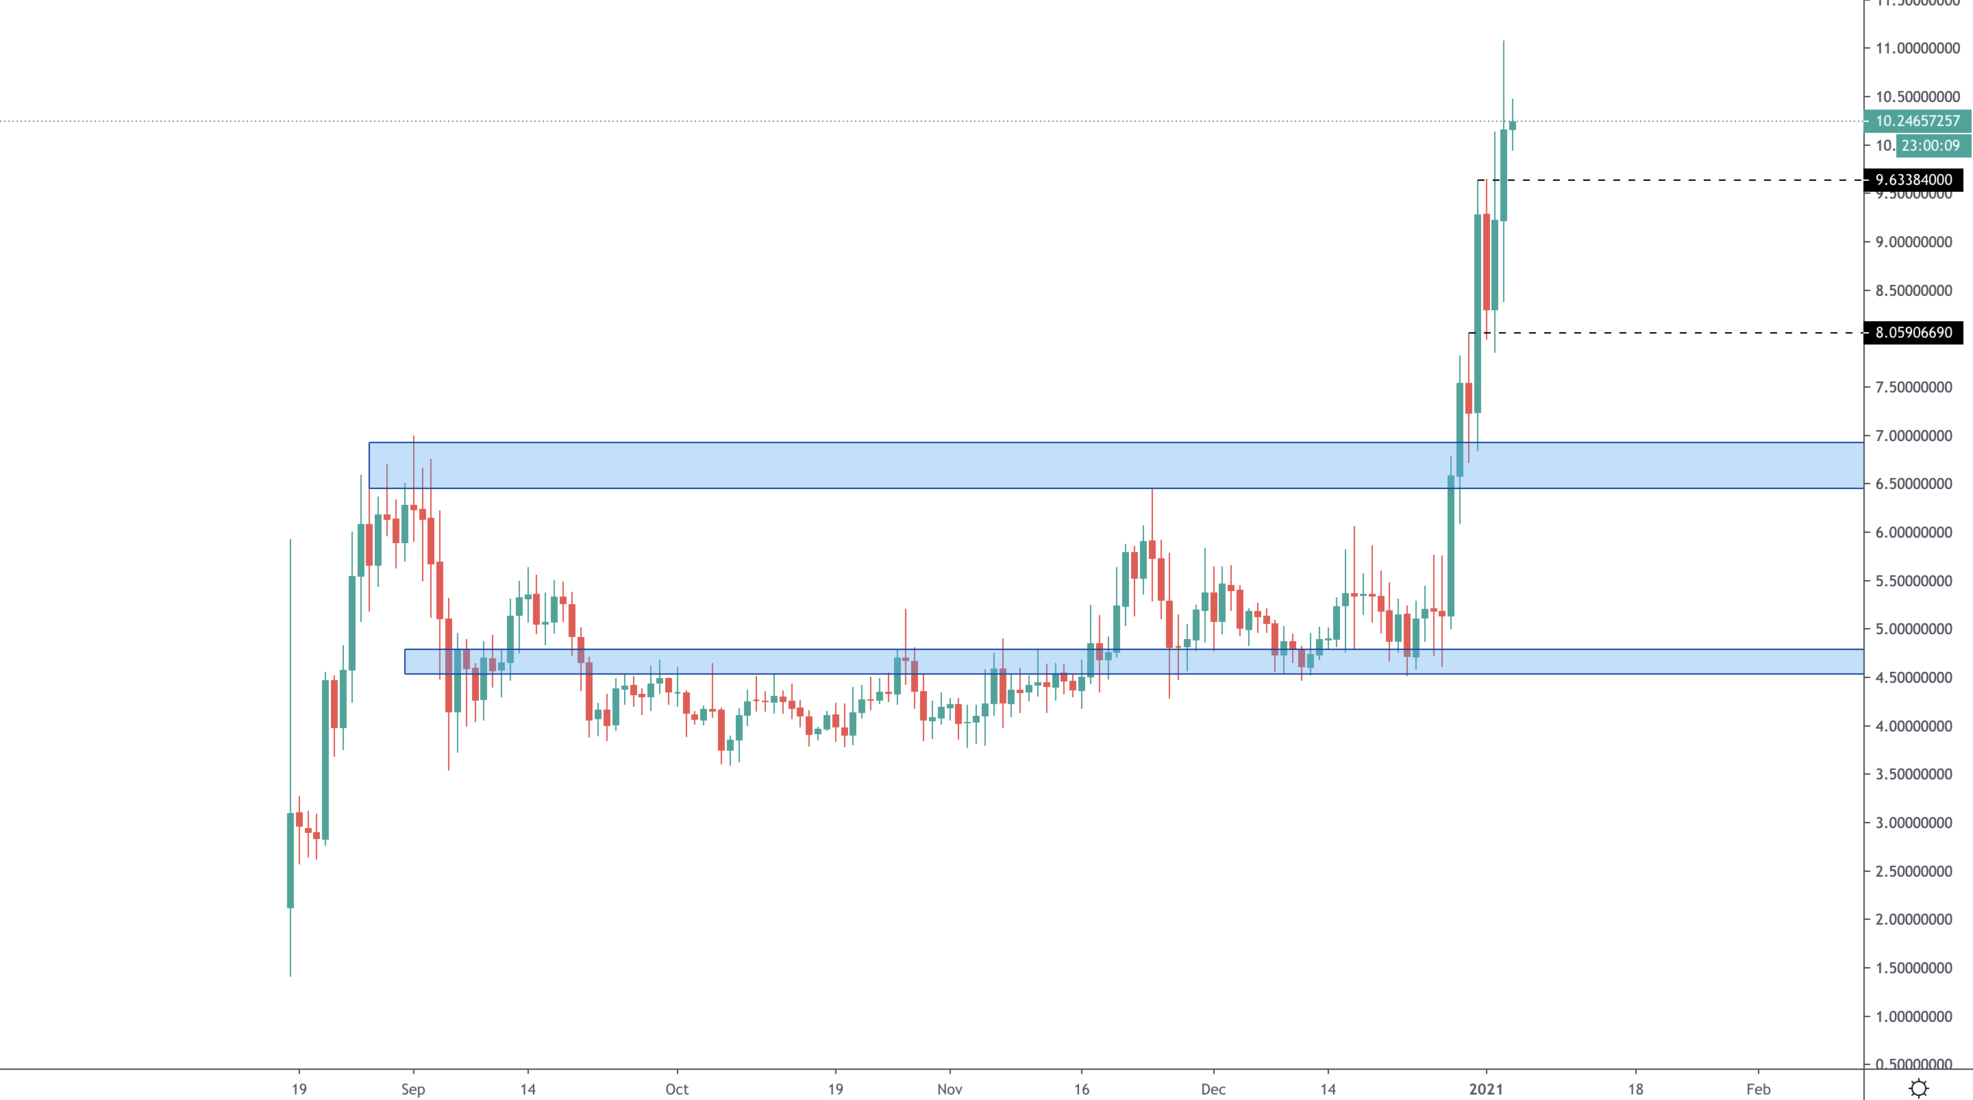
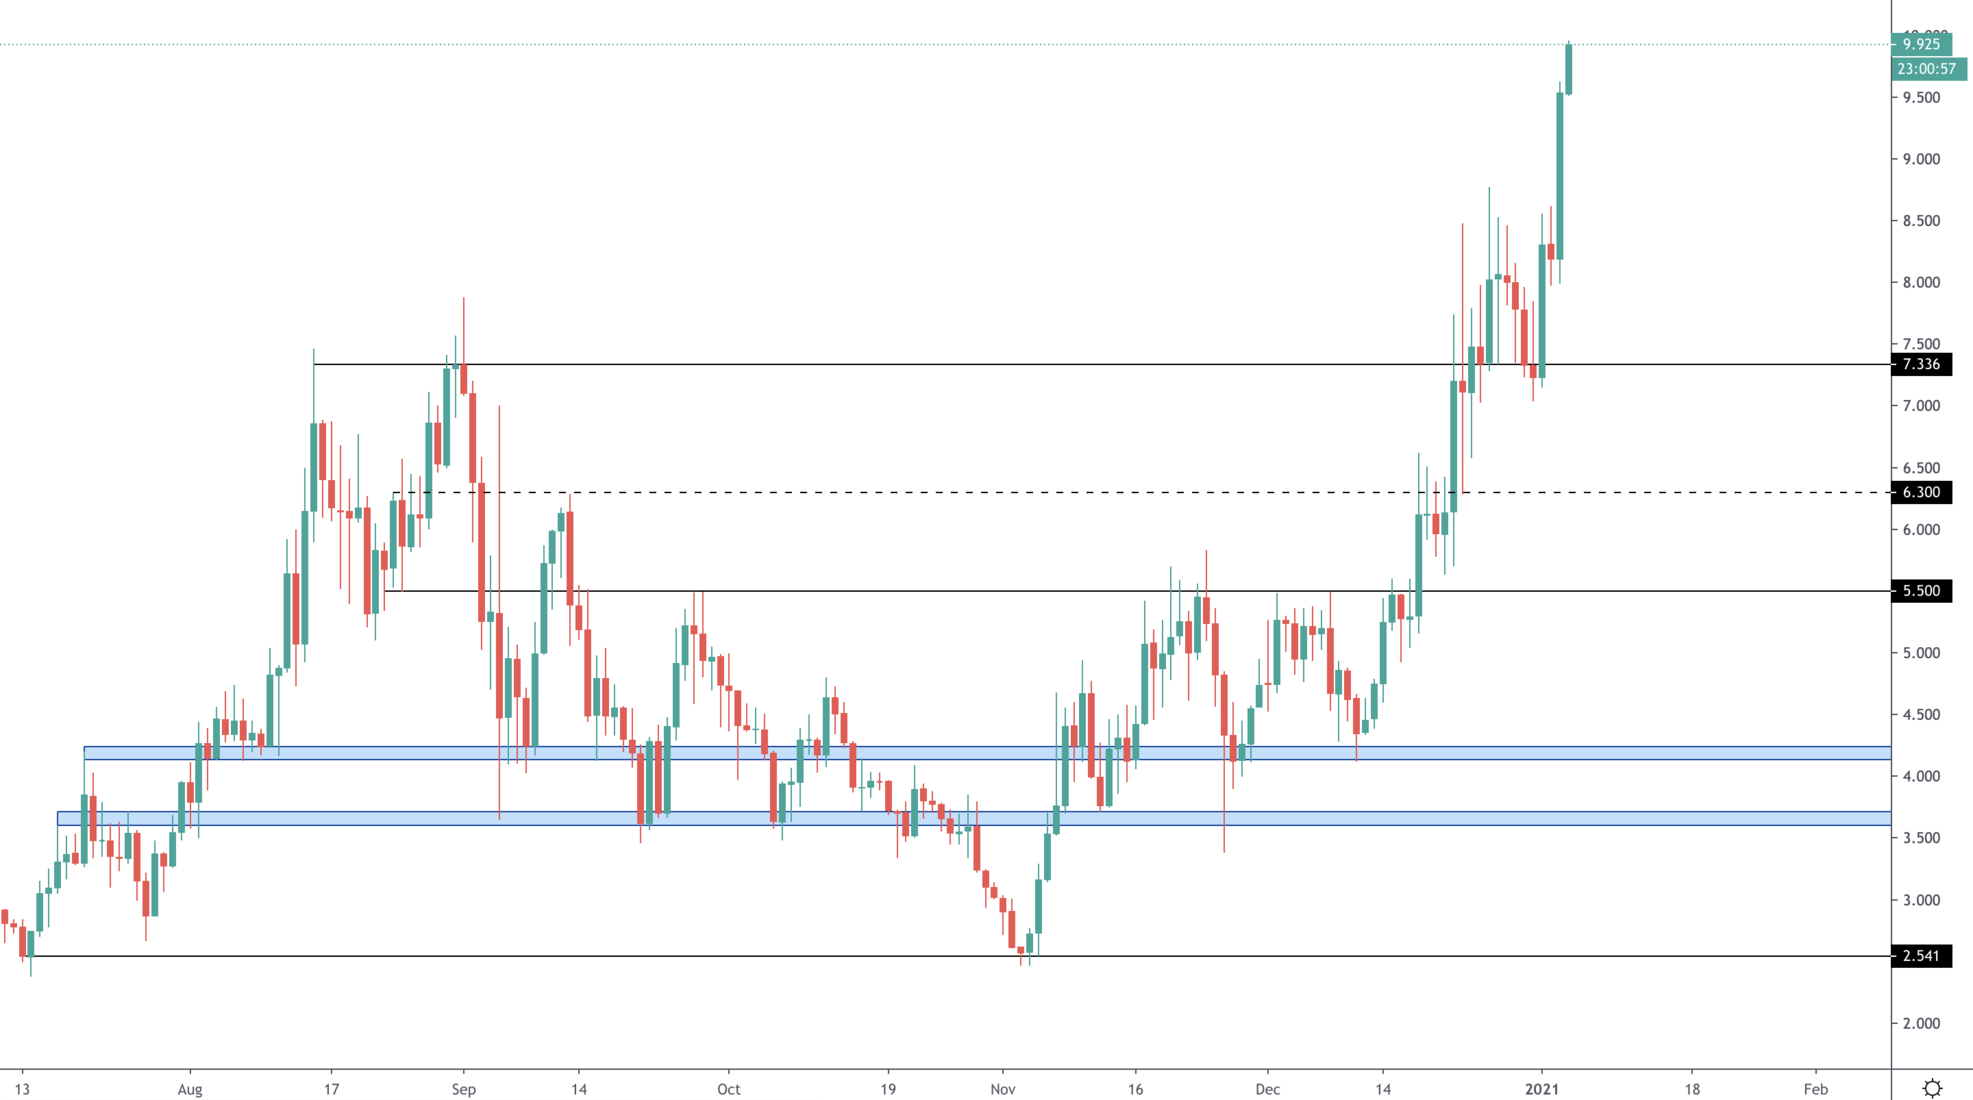
SRM
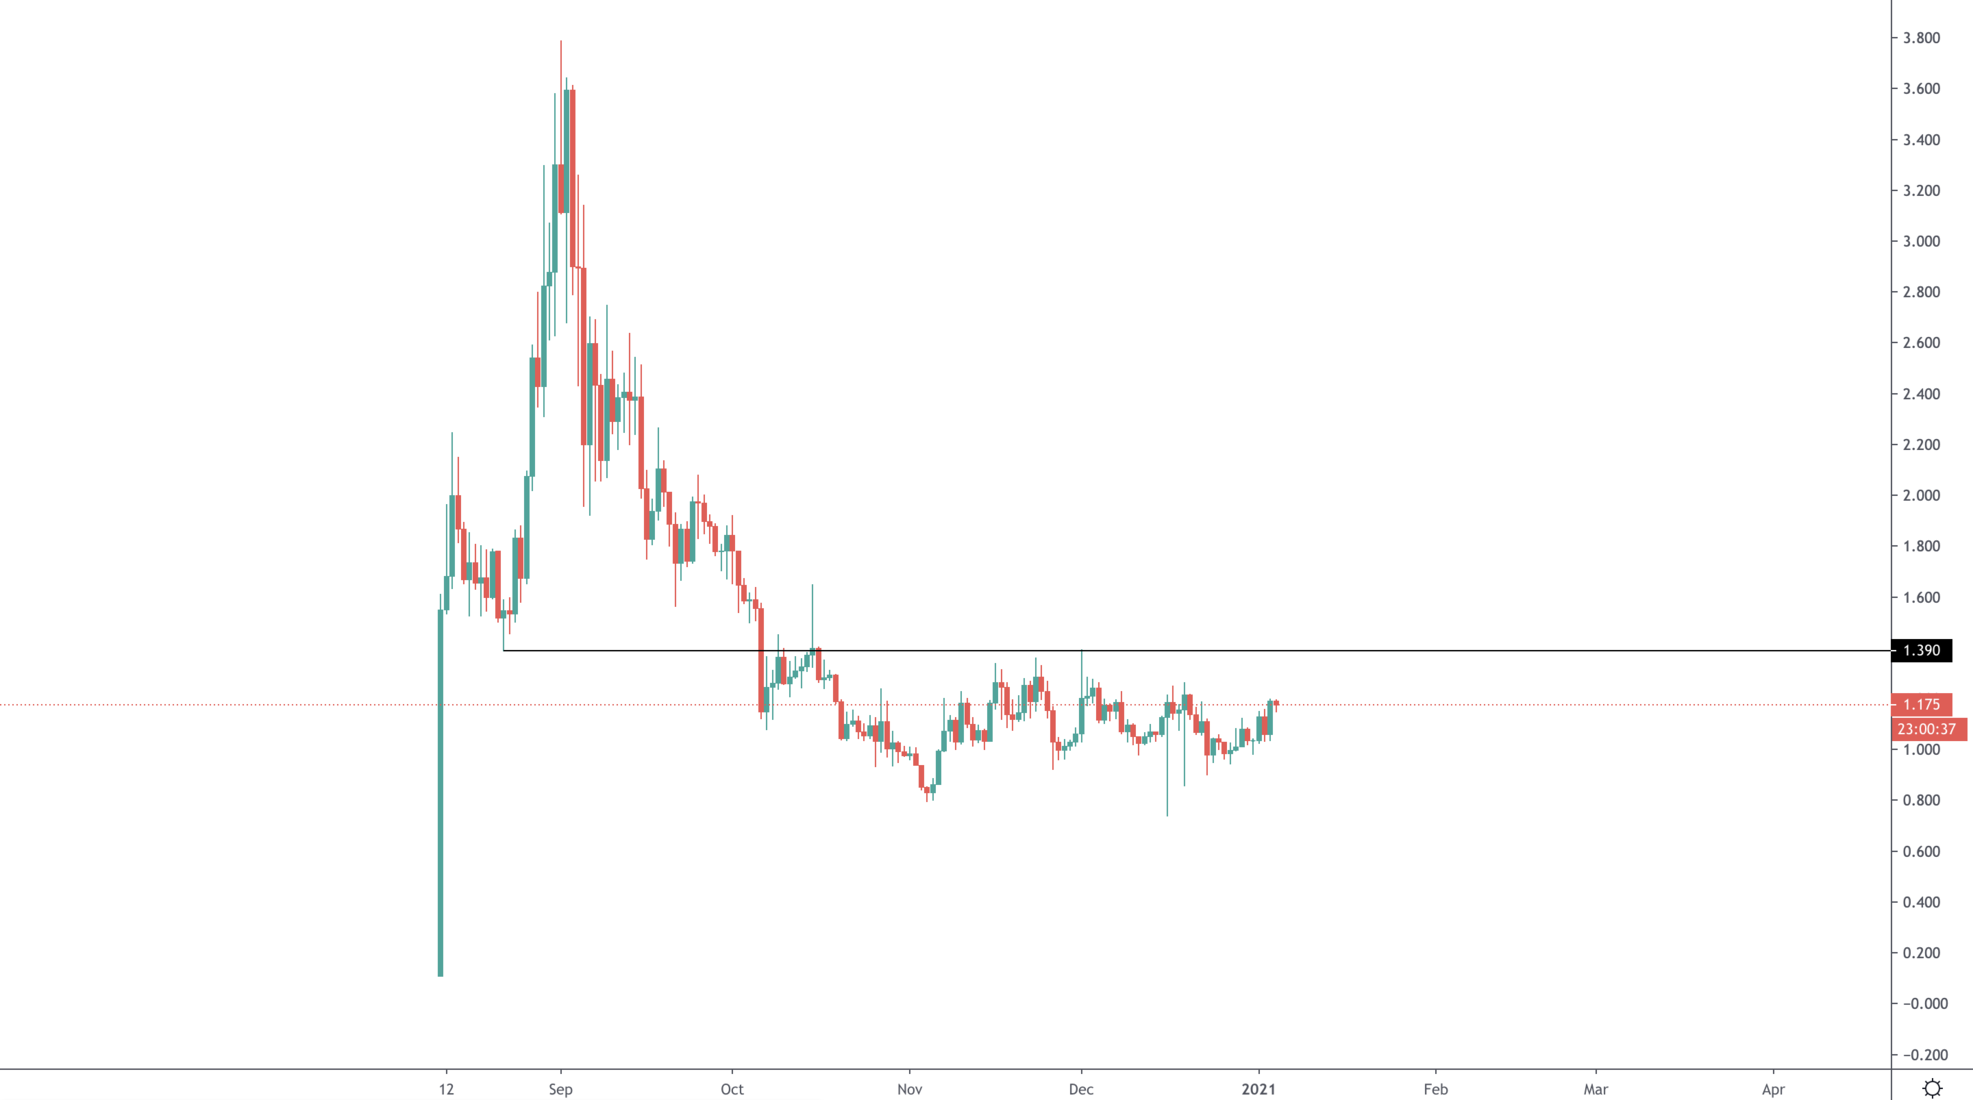
A flip fo $1.40 will signal the end of the consolidation phase. When that happens we expect another DOT-like move.
XRP
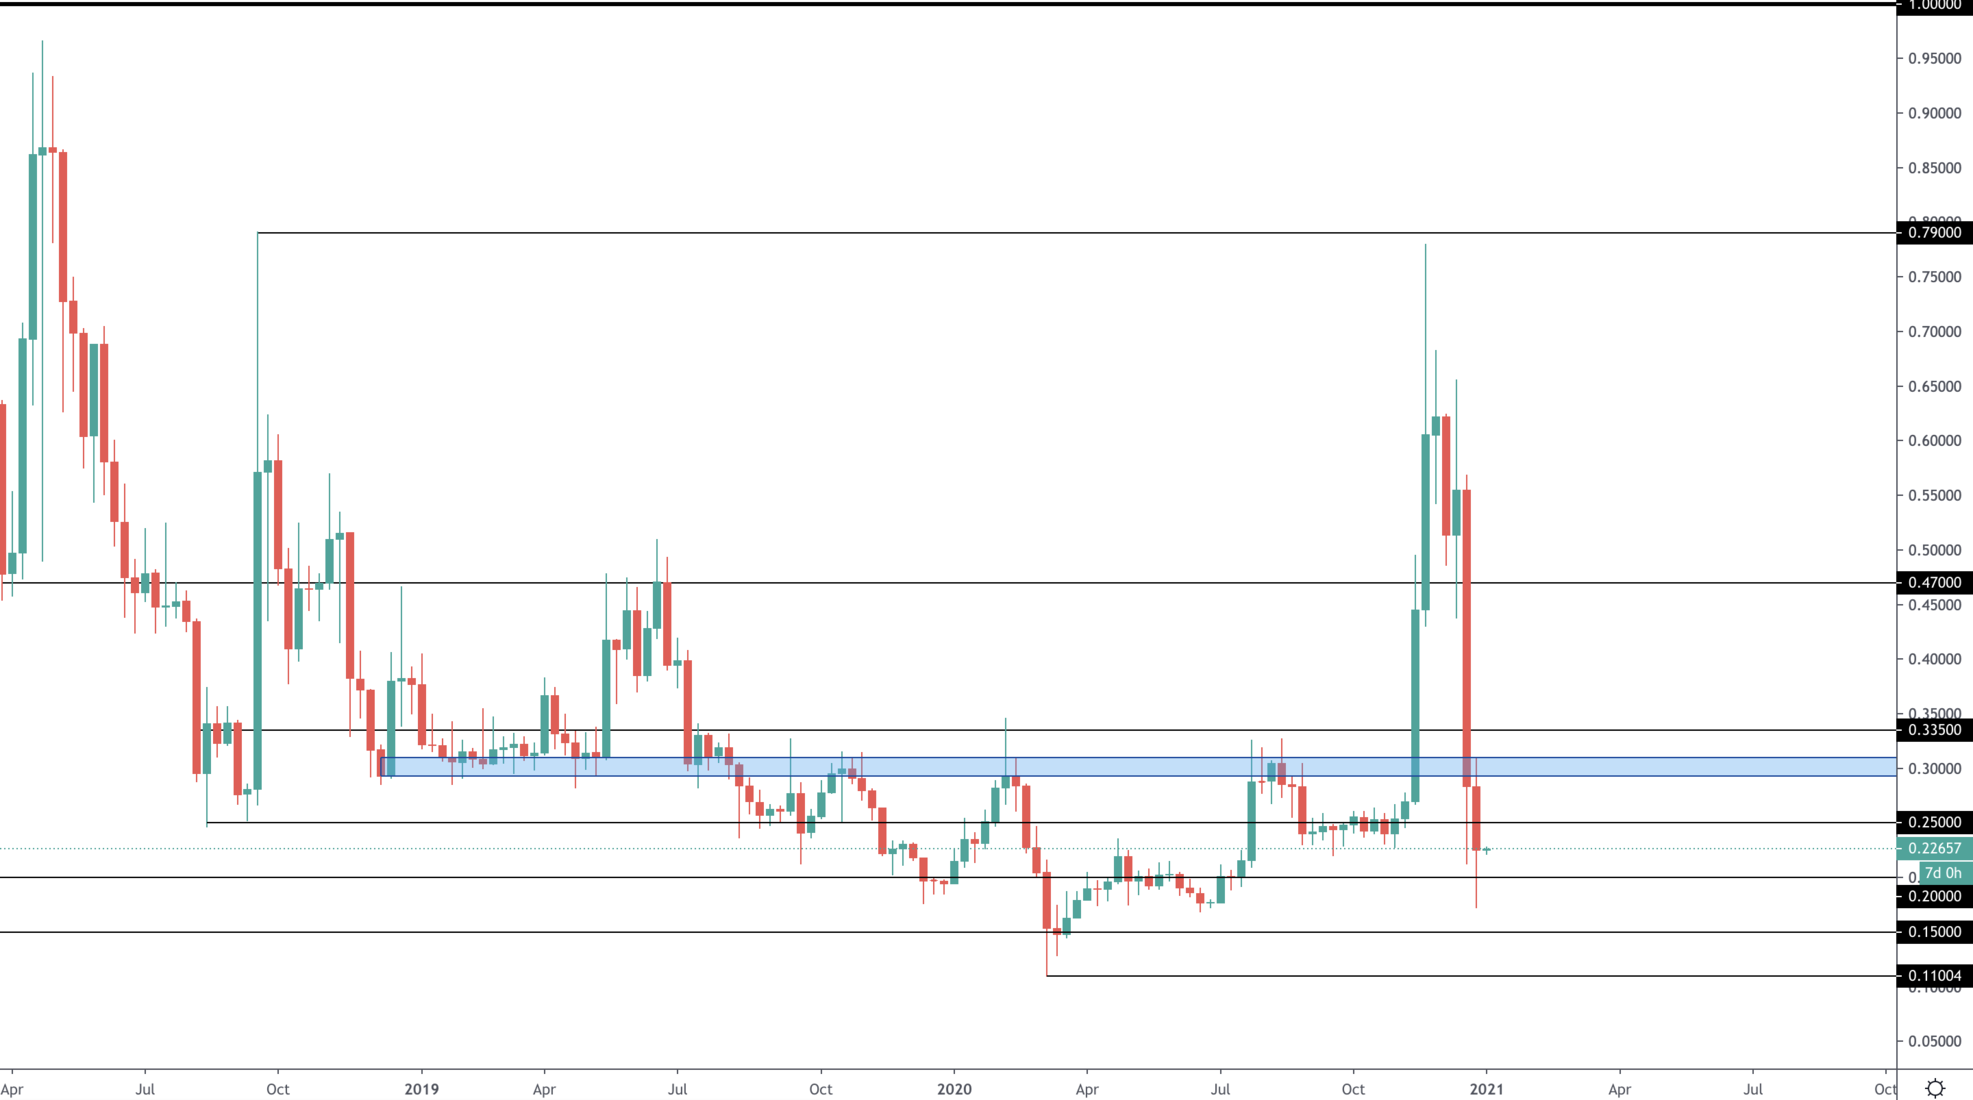
Massive delistings risk, has flipped $0.30 from support to resistance. This is not a bullish chart. $0.20 is technical support but we doubt it holds with delistings nearing. The market has spoken.
Disclaimer: None of the above constitutes financial advice or any sort of recommendation. These are purely opinions.
Recommended from Cryptonary


