Save 23% ($351) & Get a Free 1-1 Call with our Team ⏰ : 0d 2h 59m 44s

With rich and volatile price action, it is easy to get lost on the small timeframes trying to pinpoint the exact top/bottom. This is a rabbit hole, do not fall for it. Unless you are a day trader or scalper (with a proven track record), looking at the higher timeframes (1 Day/1 Week/1 Month) will prove to be a lot more beneficial in the long-run.
Market Sentiment
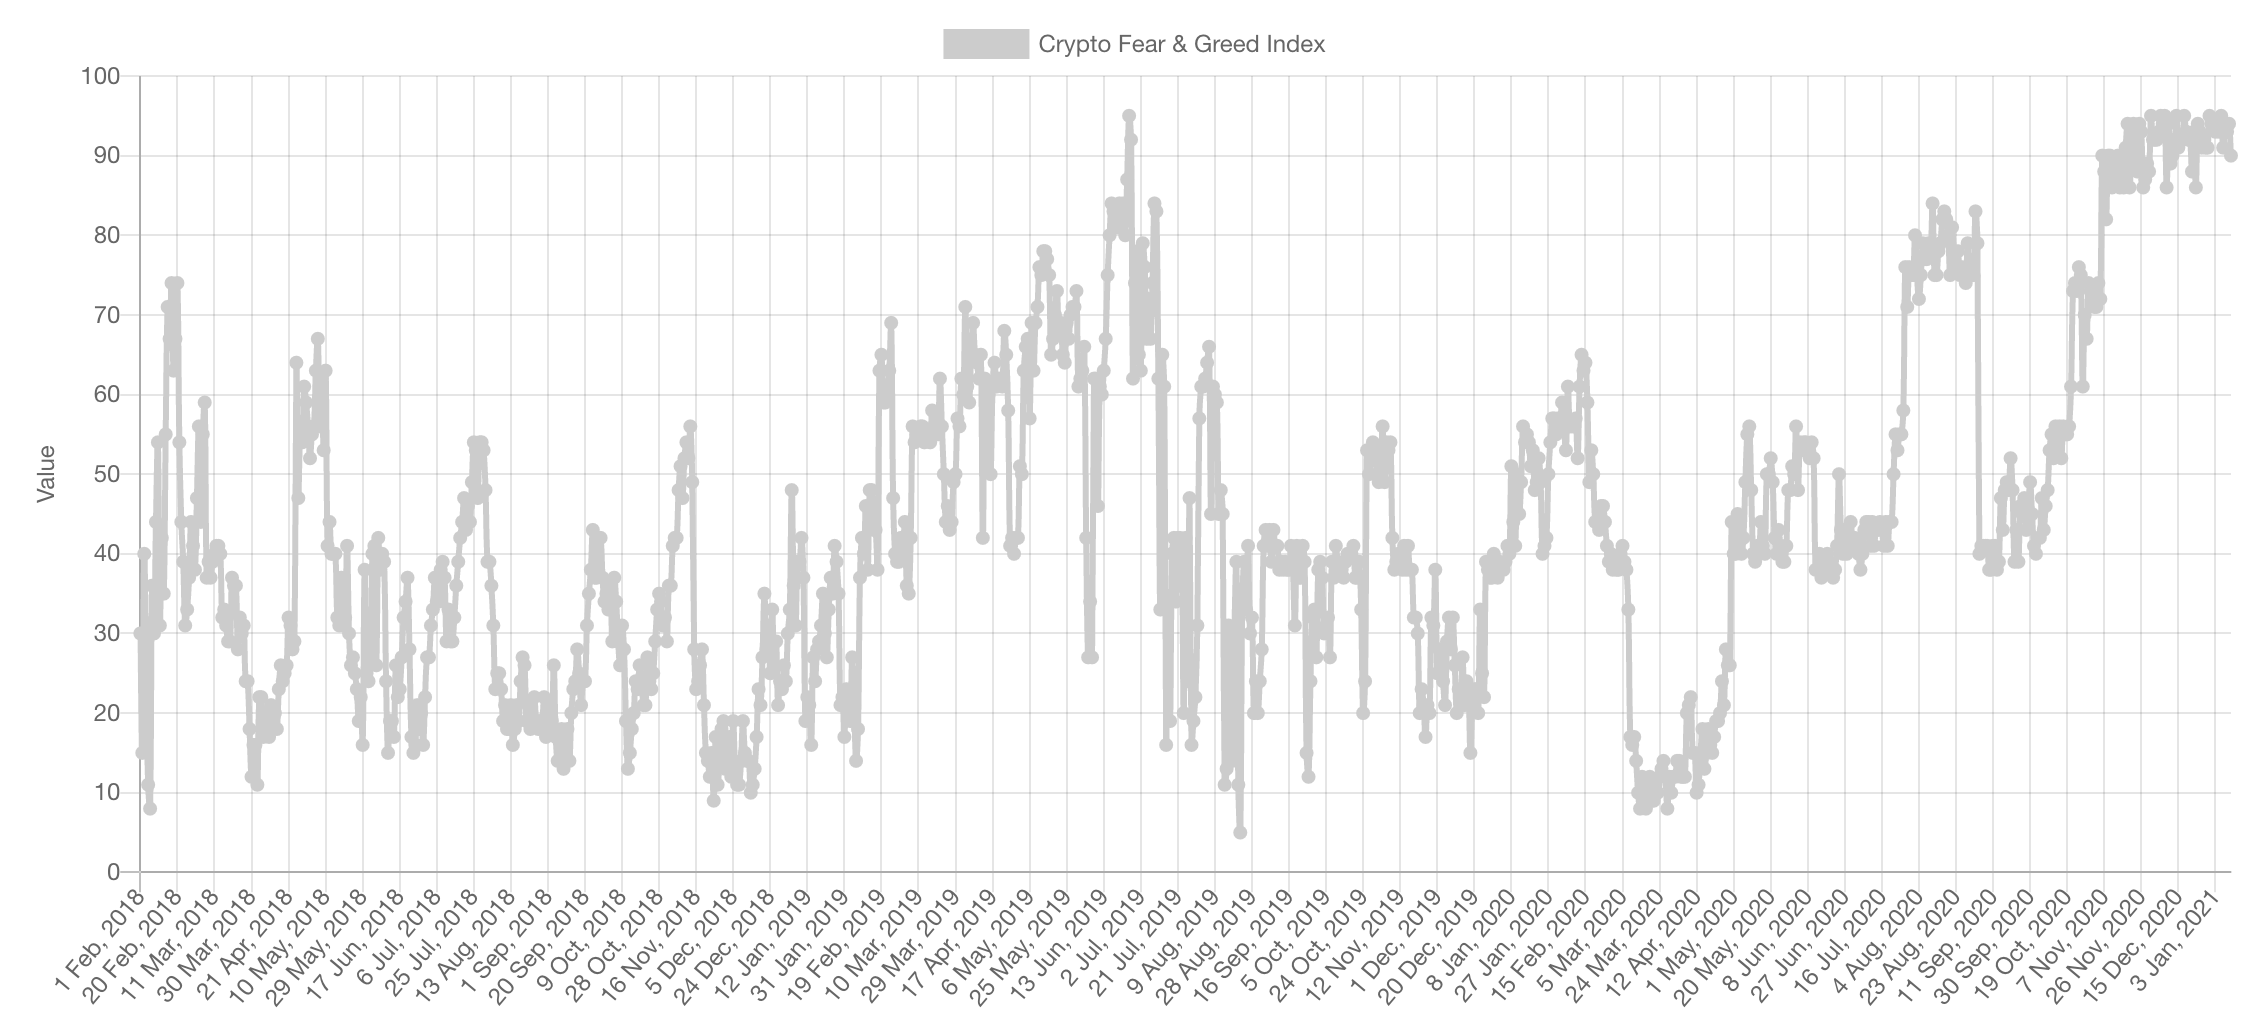
This is by far the longest period of time that market sentiment spends in the “Extreme Greed” phase according to the metrics provided. As stated in previous versions of Weekly Technicals, this is a good reminder to maintain proper risk management measures at all times but is far from a timing indication for a top.
Trading Volumes
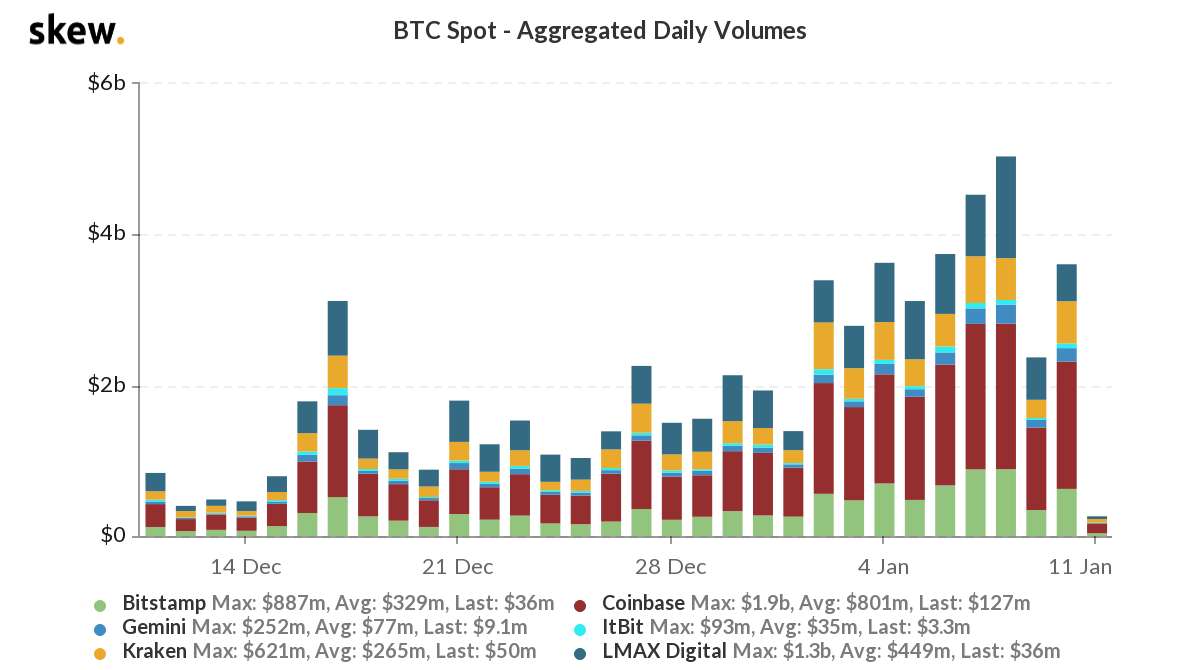
Bitcoin’s trading volume remains strong and confirms the trend. The majority of the volumes remain coming from upside movements which indicates that buyers are still outweighing the sellers for now, despite the downside movement seen a few hours ago.
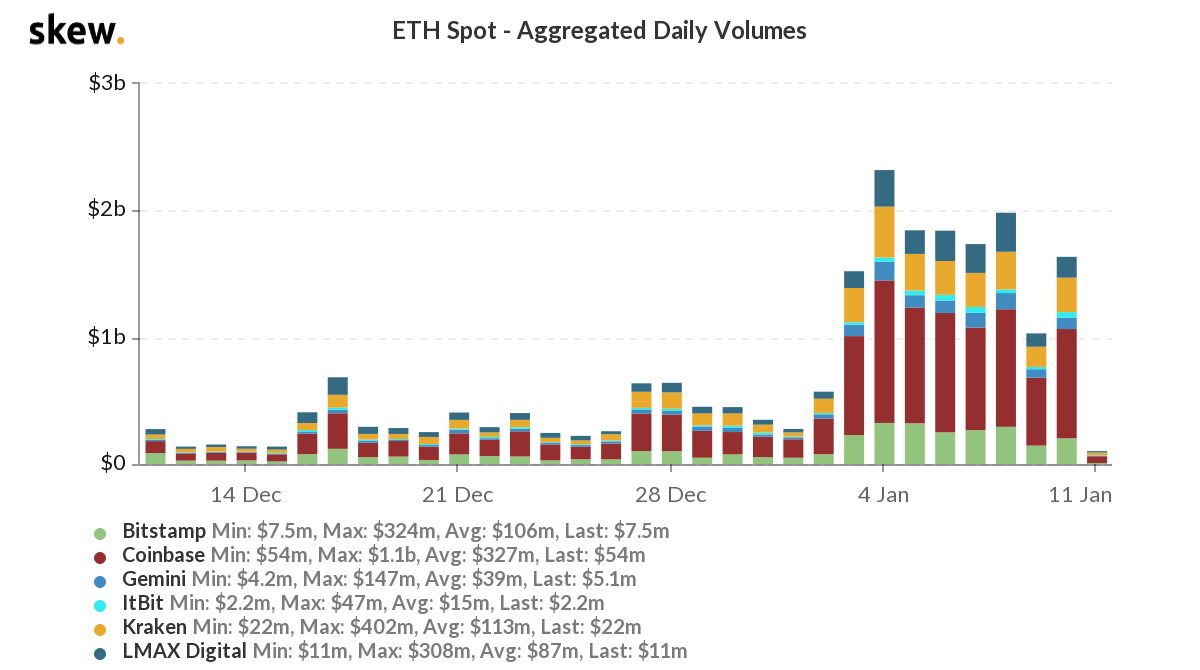
The same can be said about Ether’s trading volume, remains strong after the anticipated massive breakout. More details about price action and directionality to follow below.
Market Indices
Total Market Cap
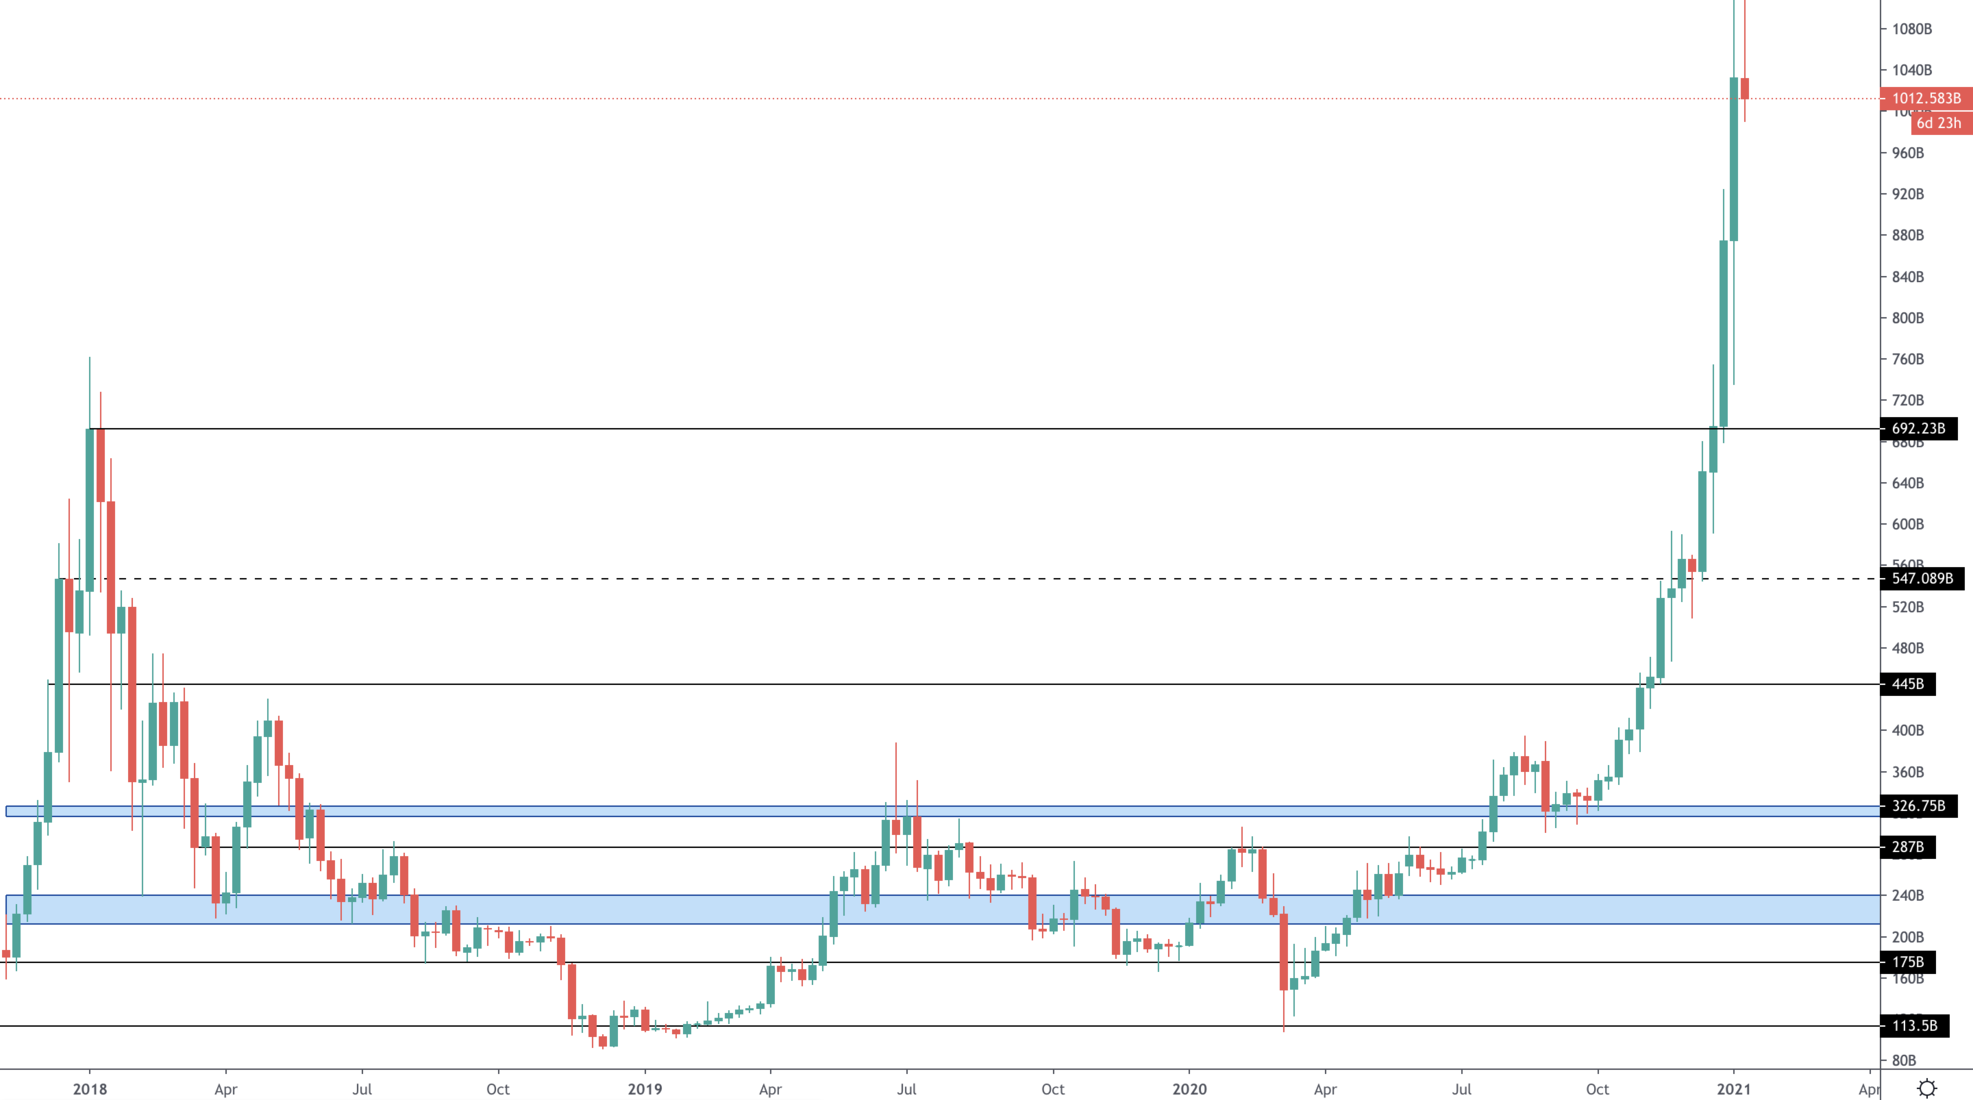
The Total MCap has finally broken $1 TRILLION for the first time in history. It is undoubtedly in a bull market; we’ve been saying it for months on end but perhaps everyone else is convinced now. Let’s dig deeper into the timeframes for a more details view (1 Day).
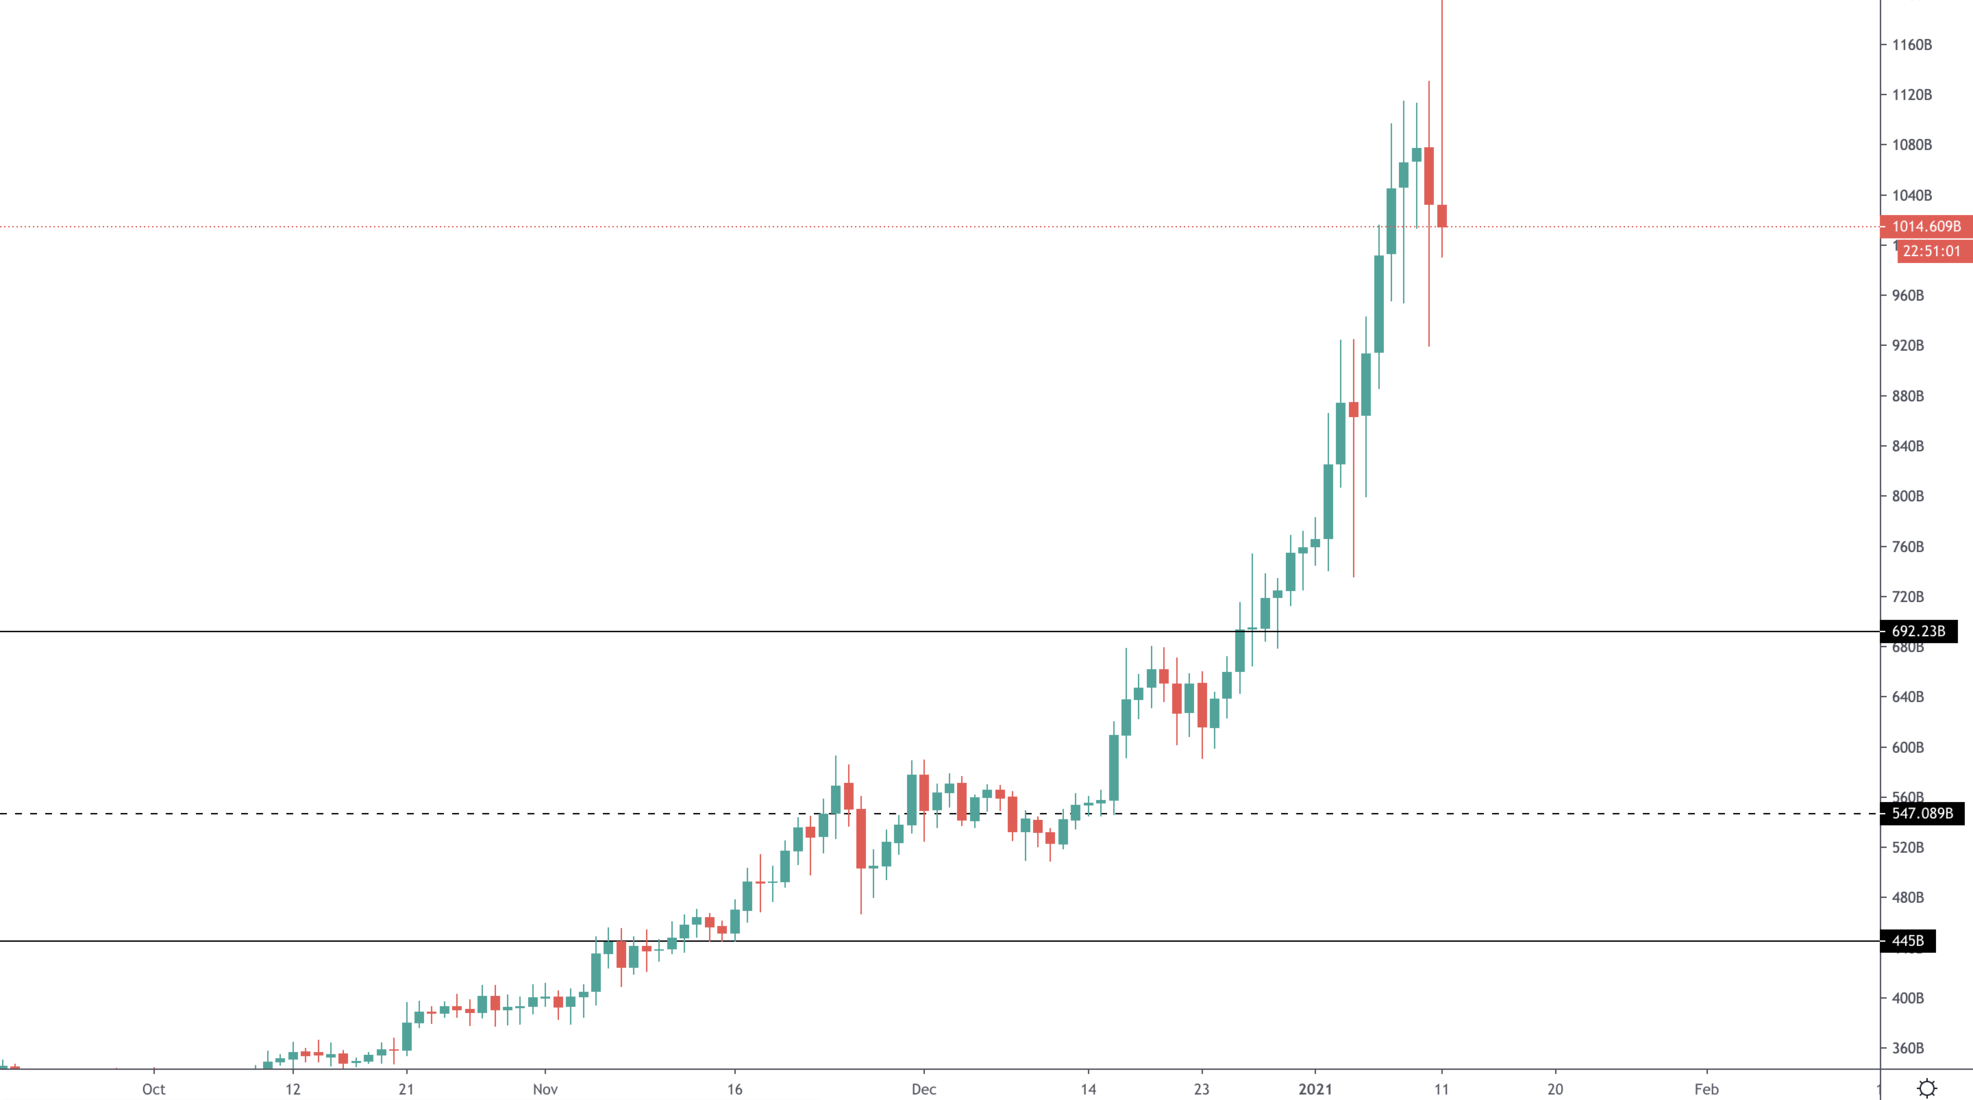
Price action is a typical parabolic advance with sharp higher highs and higher lows. These tend to eventually turn even more vertical for a steeper advance before witnessing a blow-off top. We personally view it that this will make new highs over the coming days.
Altcoins Market Cap
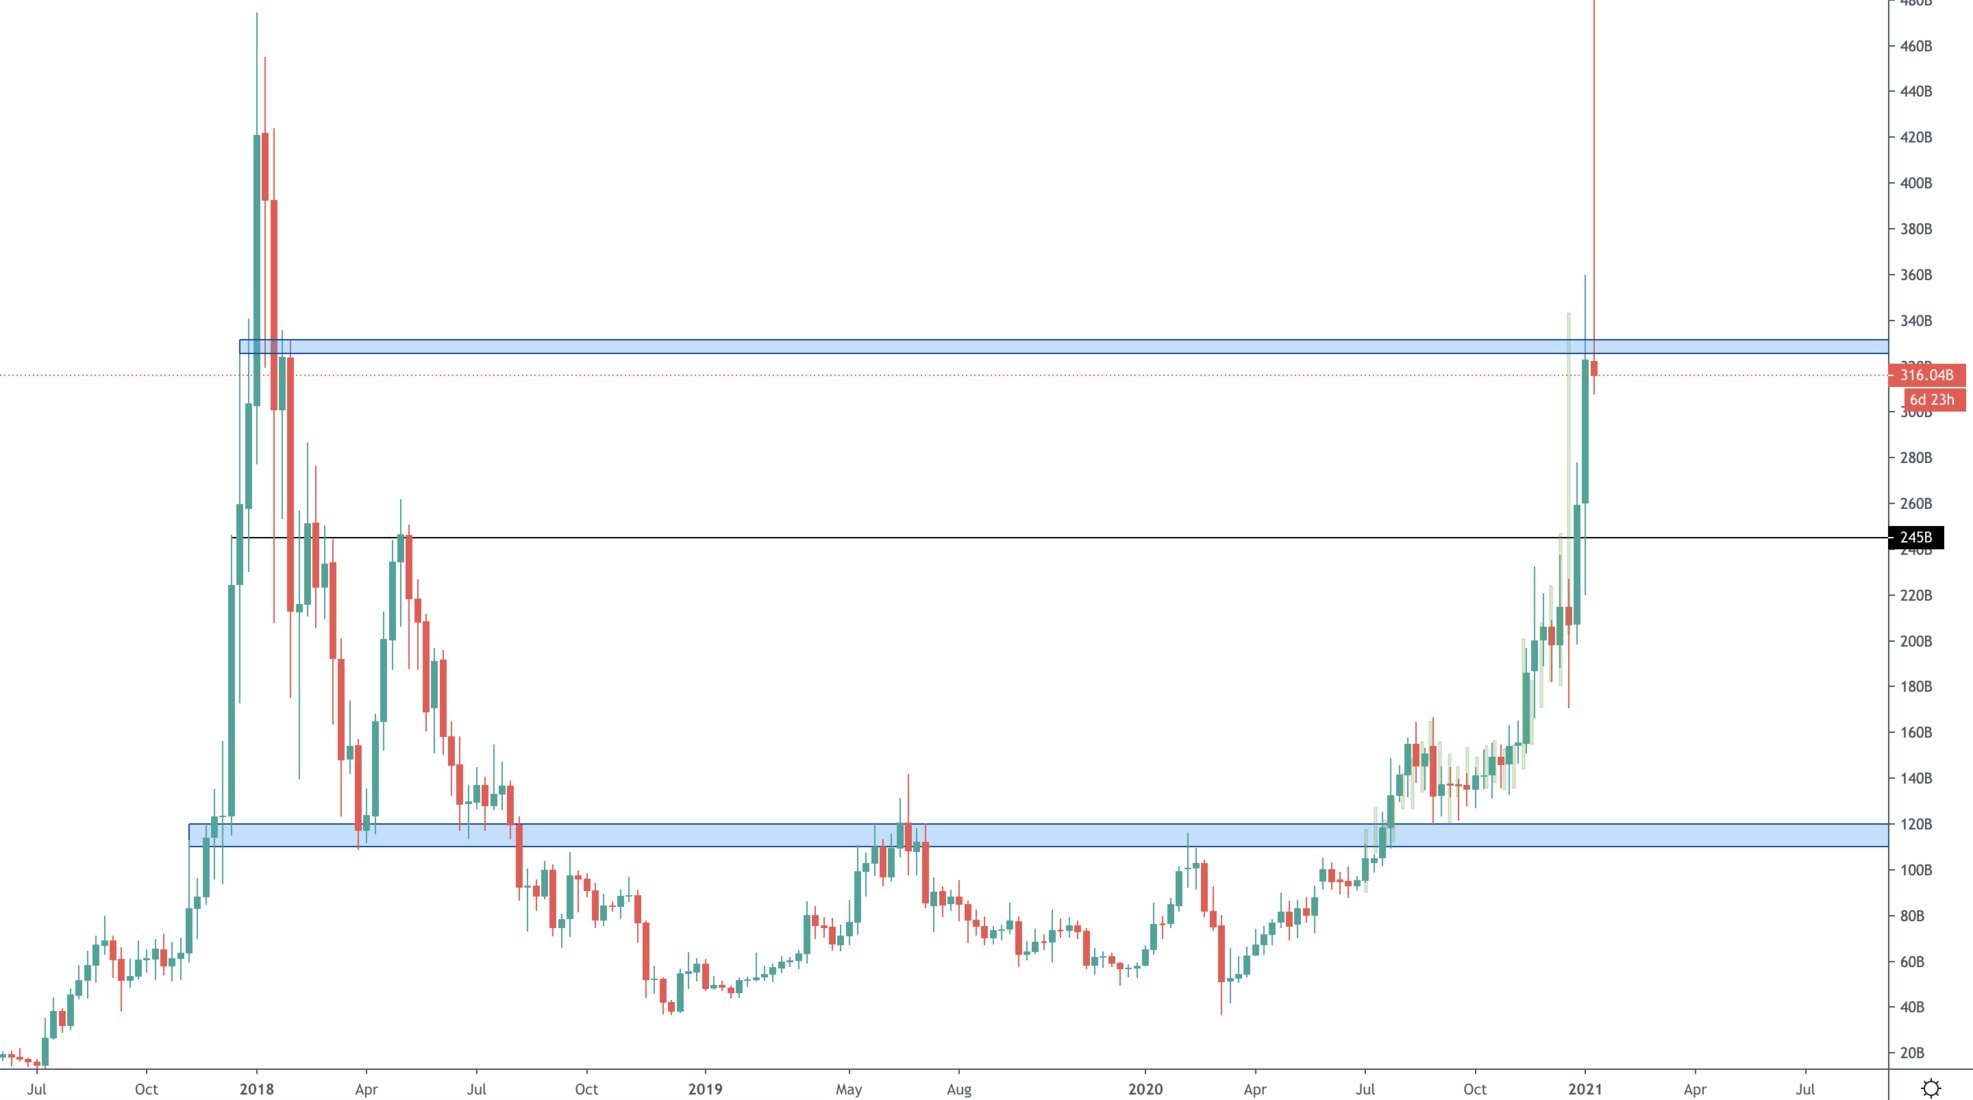
The Altcoins MCap has completed the fractal and it has been insanely accurate (it is still on the chart but you can barely see it because price overlaid right on top of it). Price is at the $330B resistance, once flipped then ATH for Alts would be very likely coming.
Also, ignore the excessively long wick on the latest candle, this is just an error from TradingView.
Bitcoin
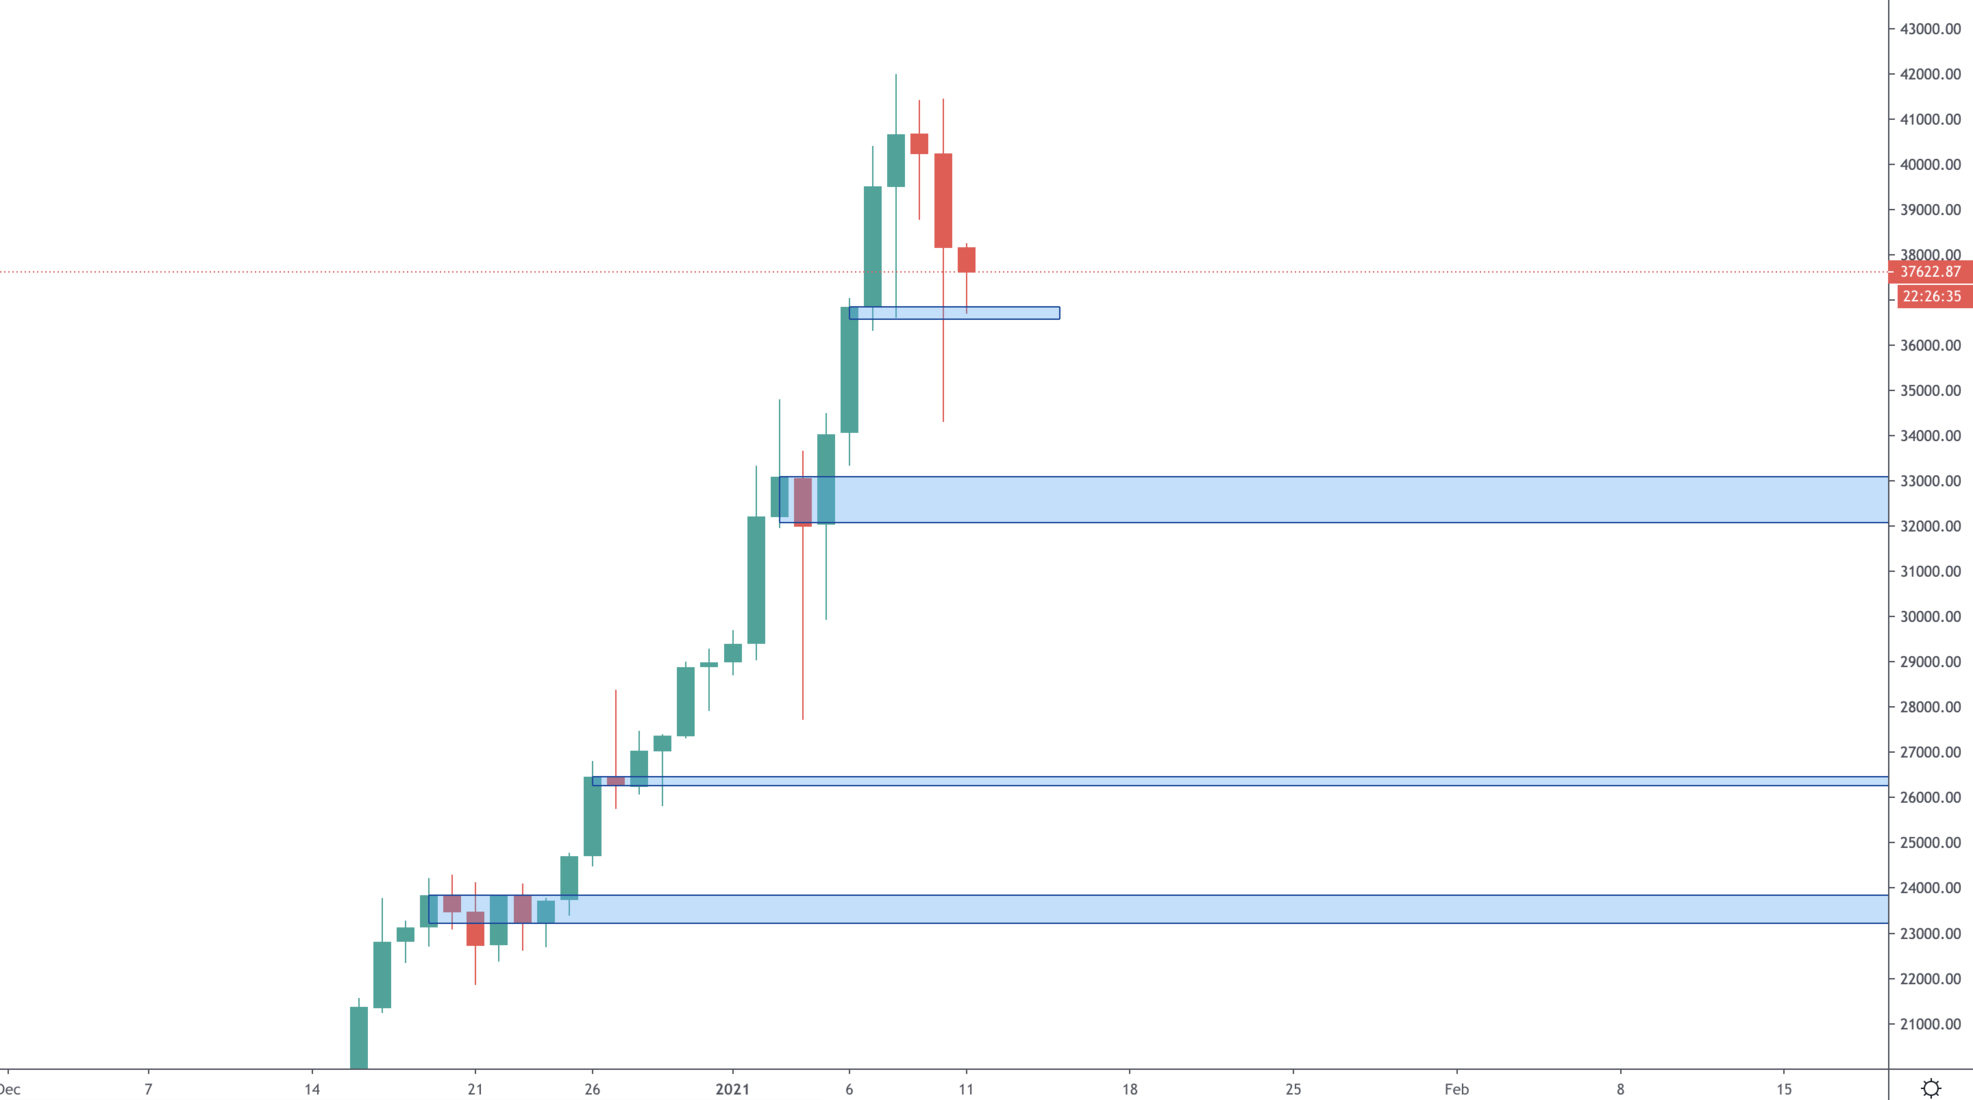
The weekly chart is literally vertical with little to discuss, therefore we’ll be covering the daily chart instead. Bitcoin’s price continues to register higher highs and higher lows, the staple of a bullish market structure. Price has found support at $36,800 as stated in Discord Pro pre-drop. There was a large downside wick, which was due to $1B in futures positions that were liquidated and caused a cascading effect on price.
Ether

ETH’s price perfectly tested $910 as support (Discord Pro) and has continued to rally. The daily timeframe, looking at the closures, is still creating subtle higher highs and higher lows (as simple as it gets).
$1,420 is the All-Time High for ETH which we expect to be reached within the next few days.
XRP
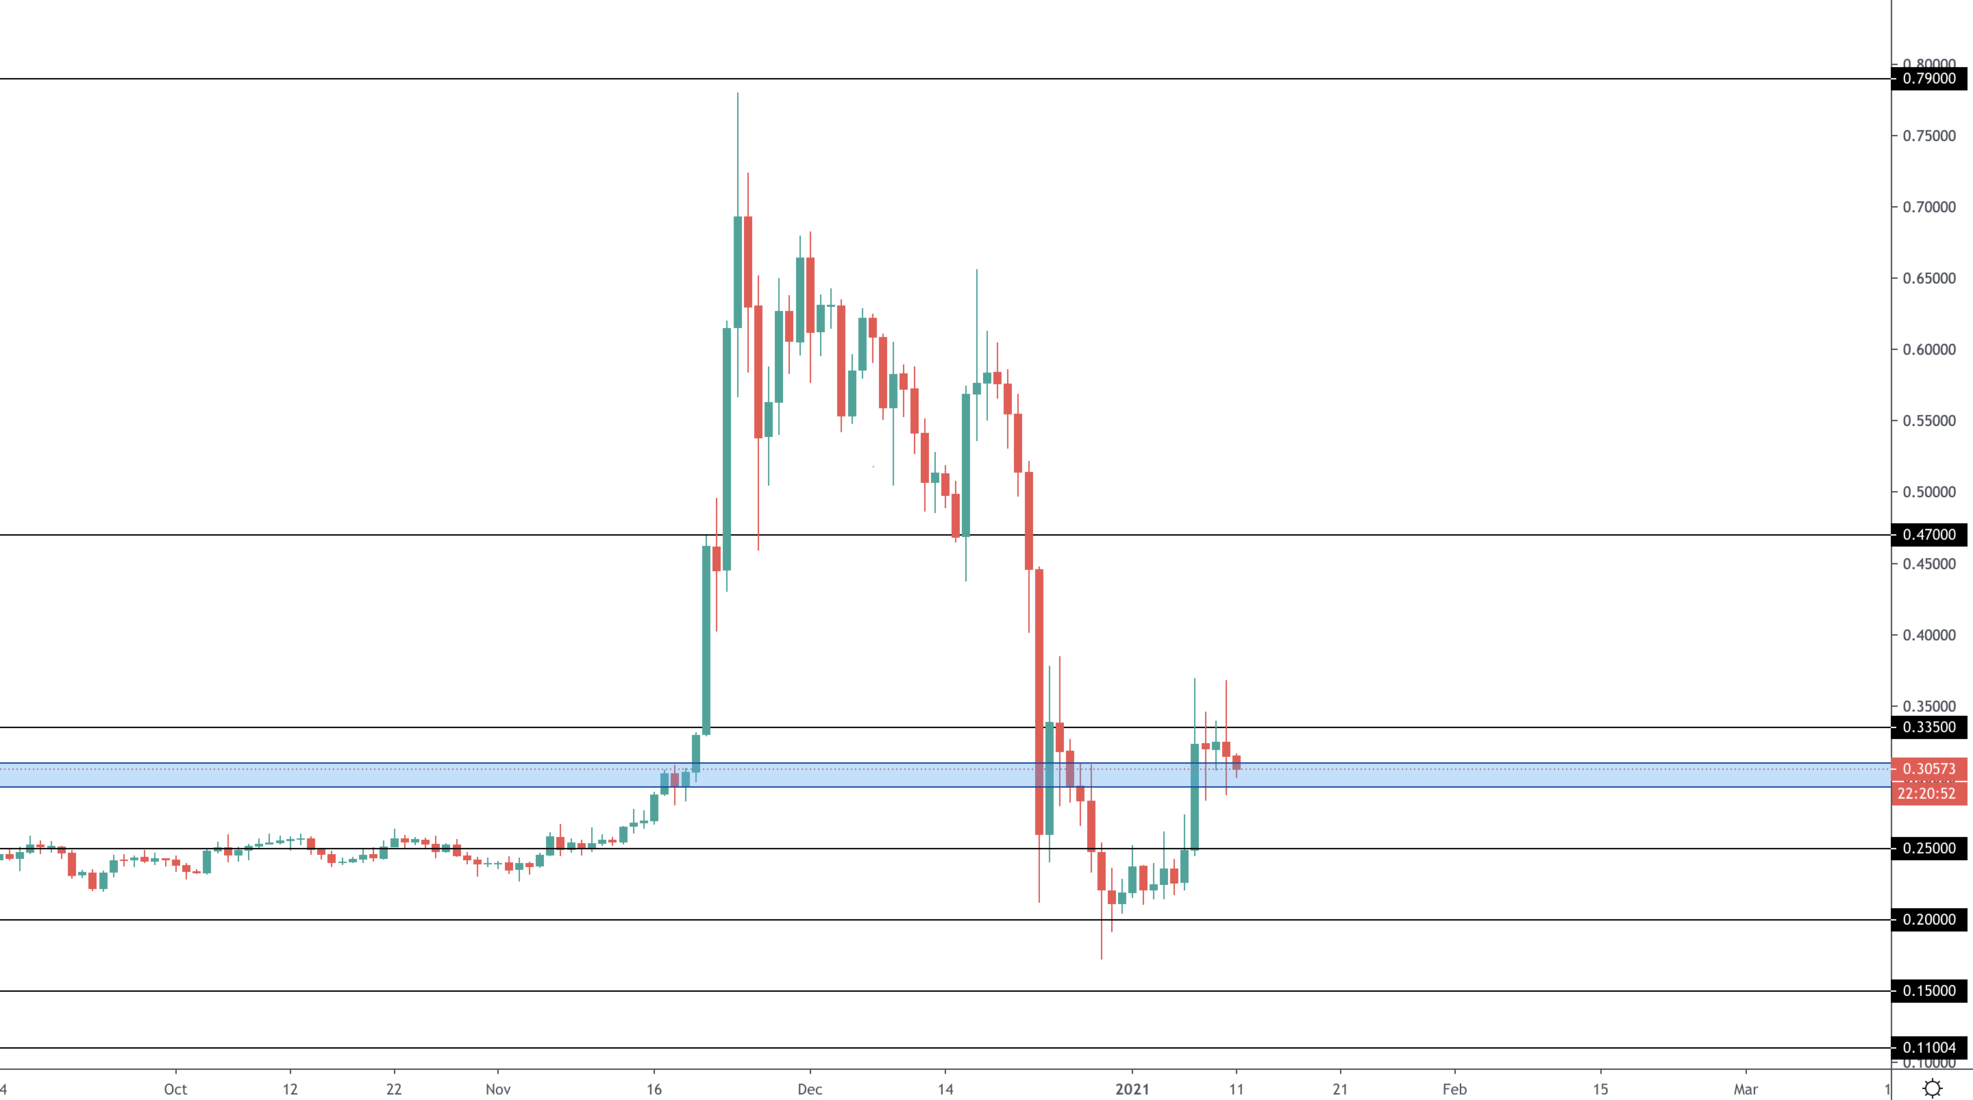
XRP’s price has the first hope in a while. It is sitting over the $0.30 liquidity area which is supporting it. As long as that is the case, XRP has a chance at a rally to $0.47. If on the other hand $0.30 breaks, more downside would be on the cards.
DOT
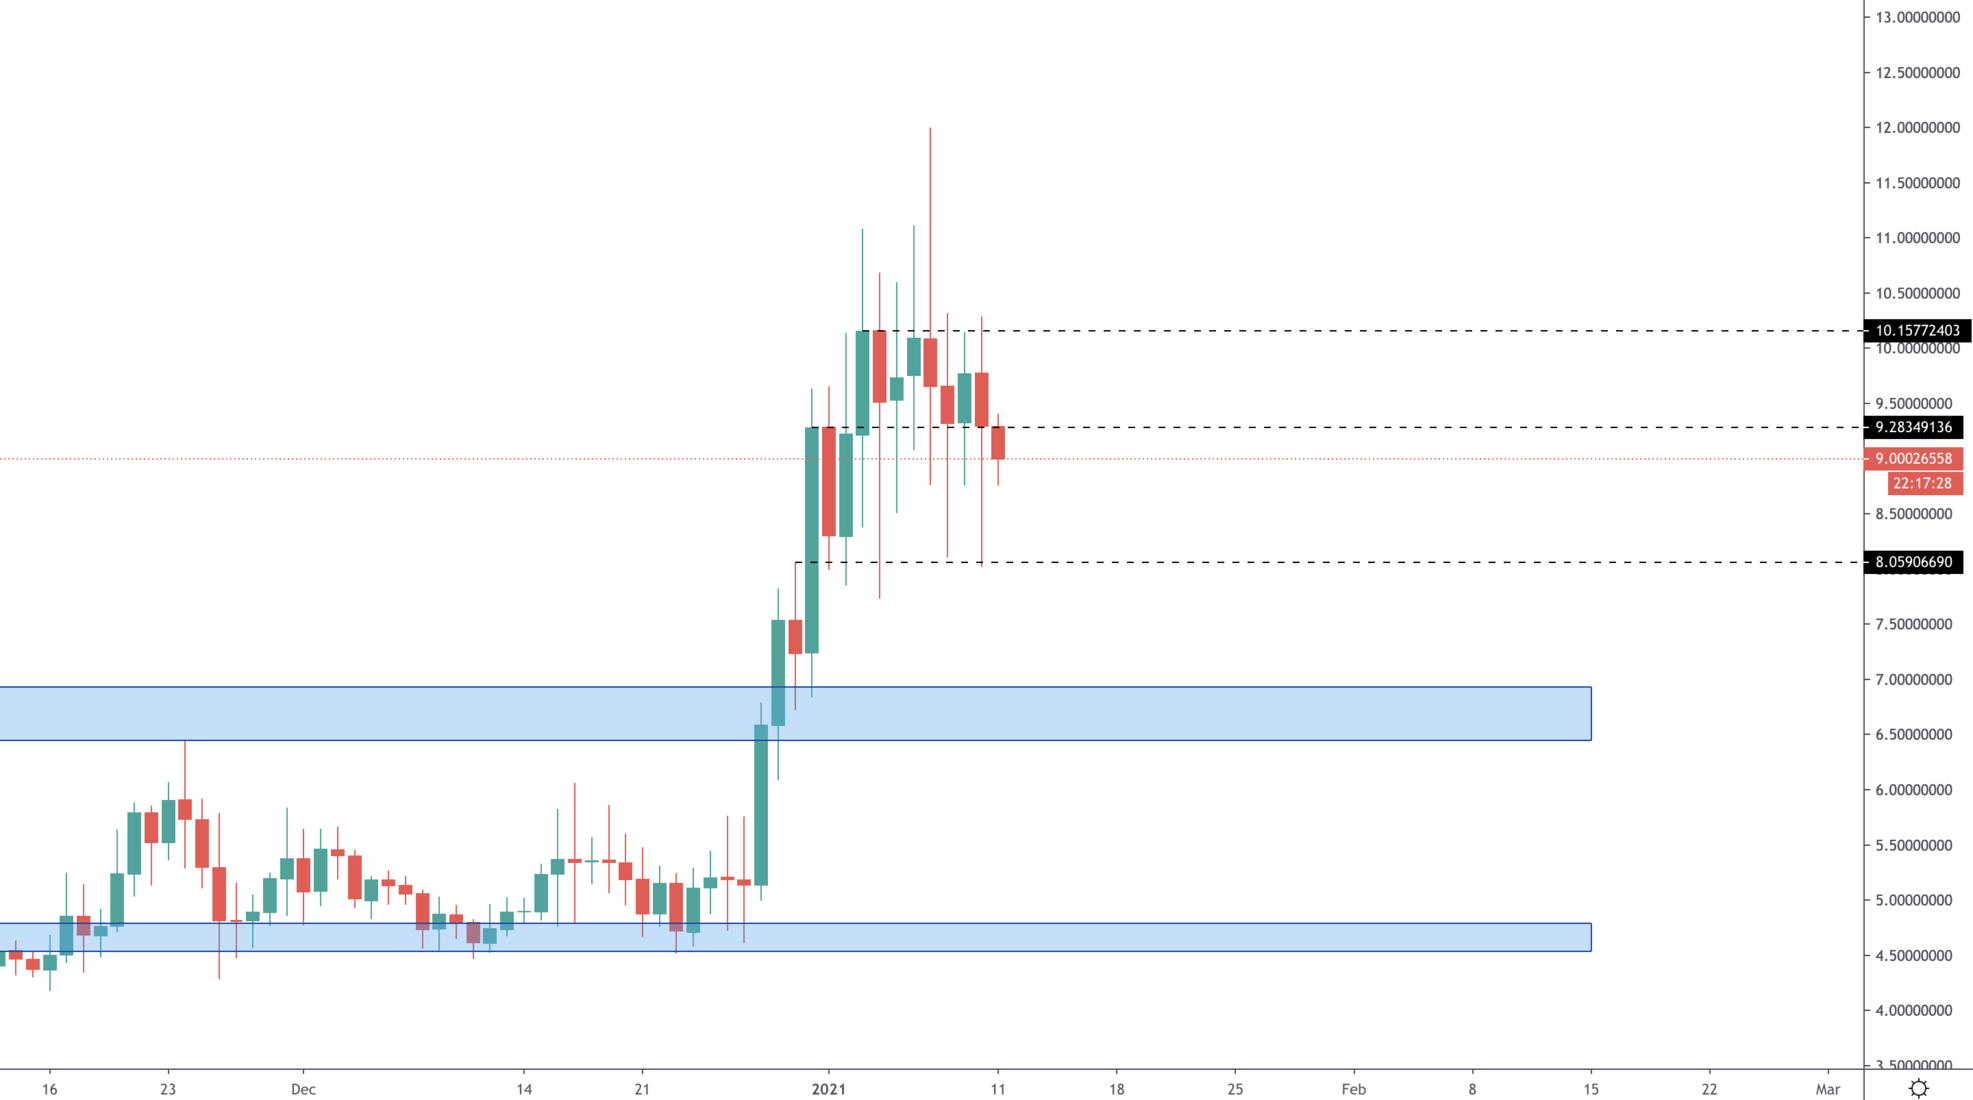
After a sizable rally, DOT has entered a consolidation phase we estimate it’d leave this week. Every daily closure has respected $9.28 perfectly, this puts the latter as support. The resistance is $10.15; once crossed it would create further price discovery.
SNX
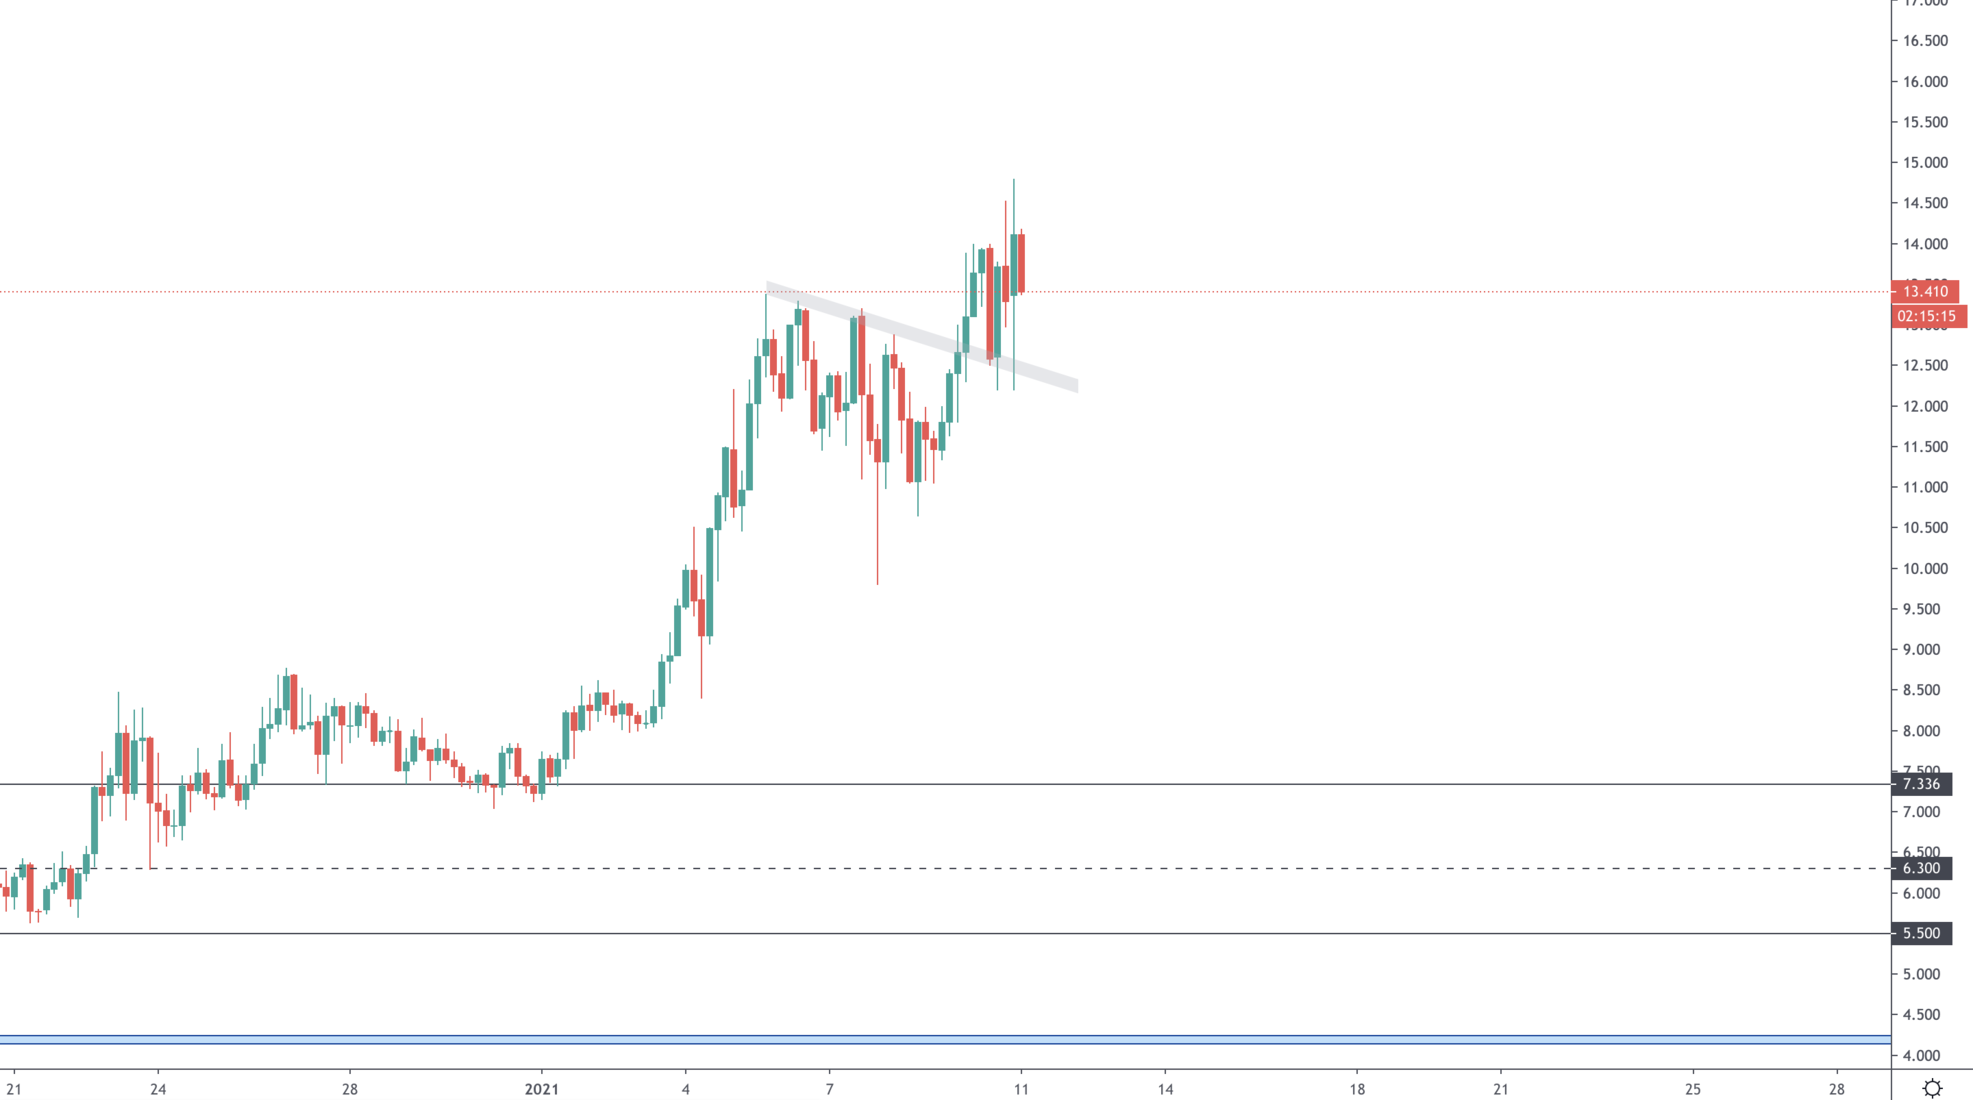
SNX has outperformed the vast majority of this market in a very short period of time, only a few weeks ago it was trading a single-digit figures. Price crossed both the counter-trendline and $13.20. The next target for this rocket ship is $20.
SRM
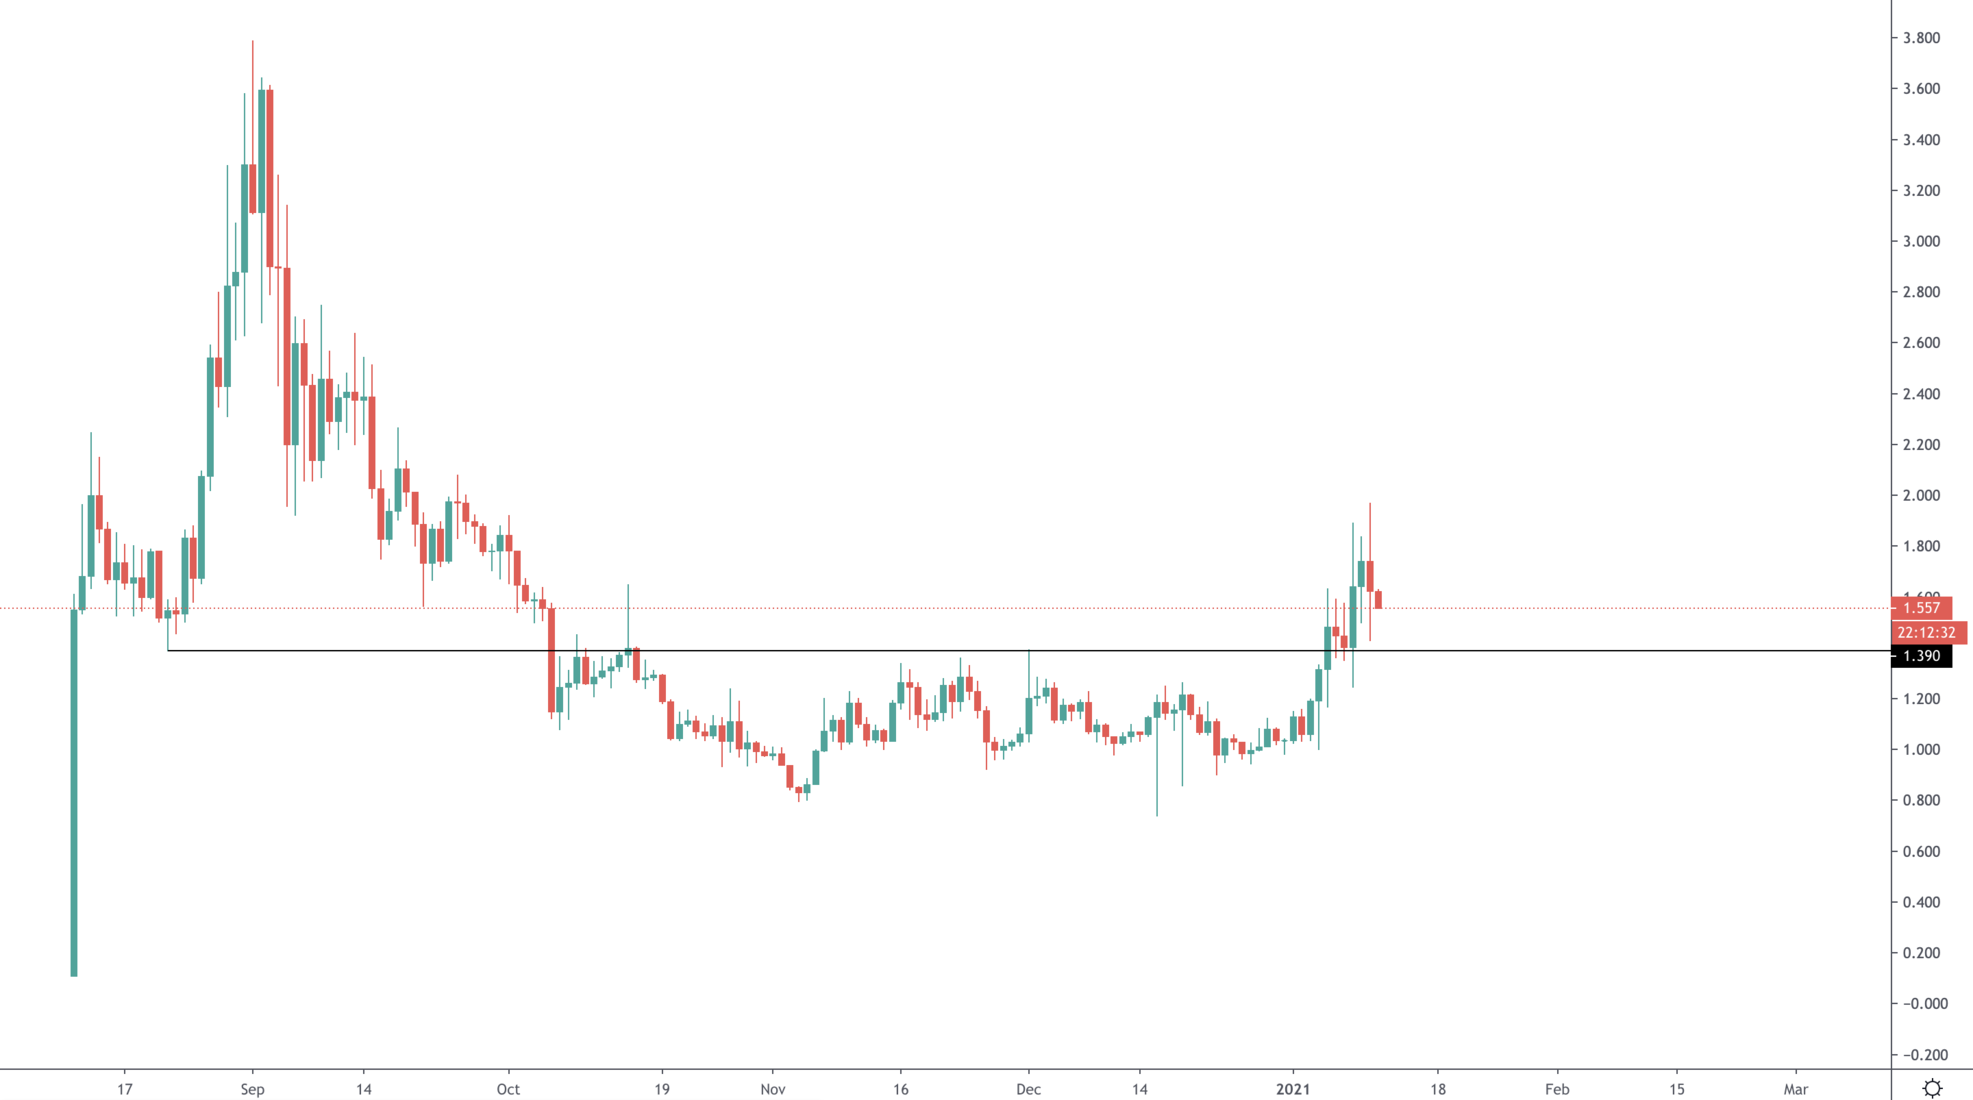
Lagging behind, SRM has finally begun moving. The accumulation phase is complete and price flipped $1.40 from resistance to support where it is consolidating here. As long as $1.40 remains intact as support, we expect a DOT-like takeoff.
Recommended from Cryptonary


