Save 23% ($351) & Get a Free 1-1 Call with our Team ⏰ : 0d 2h 59m 43s
Weekly Technicals Pro - Volume 43
After the quick reset from "Extreme Greed" back into "Neutral", market participants are once again starting to become greedy again. Given the fact that this is a bull-run this can run to 90+ levels and stall there before any push back down.

Market Sentiment

Where this metric is really helpful is keeping investors and traders on their toes. Forcing them to maintain good risk management practices and to not become complacent.
Market Indices
Total Market Cap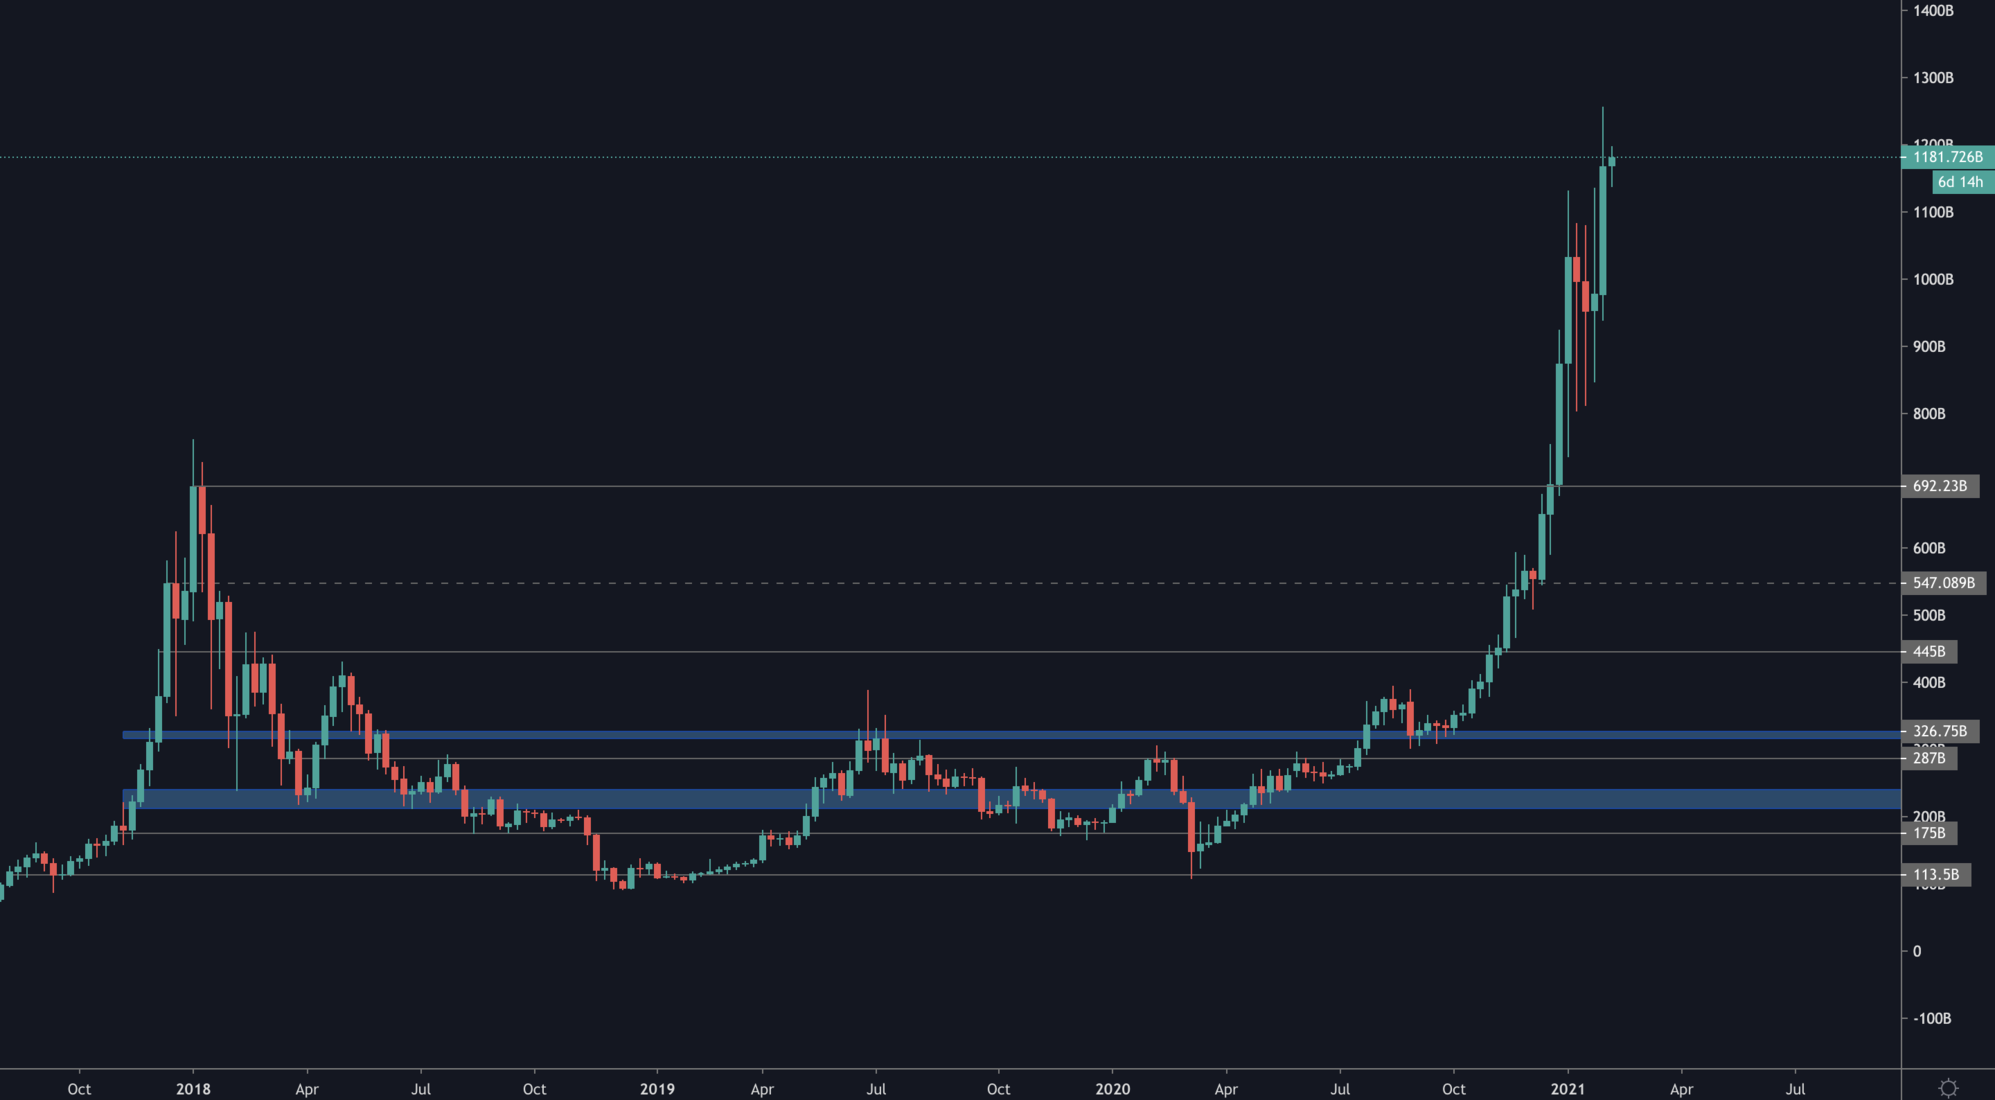
The Total Market Cap closed a strong weekly candle indicating further upside continuation. The weekly candle has also closed above the crucial $1 Trillion level, which has acted as resistance in the past couple weeks.
Altcoins Market Cap
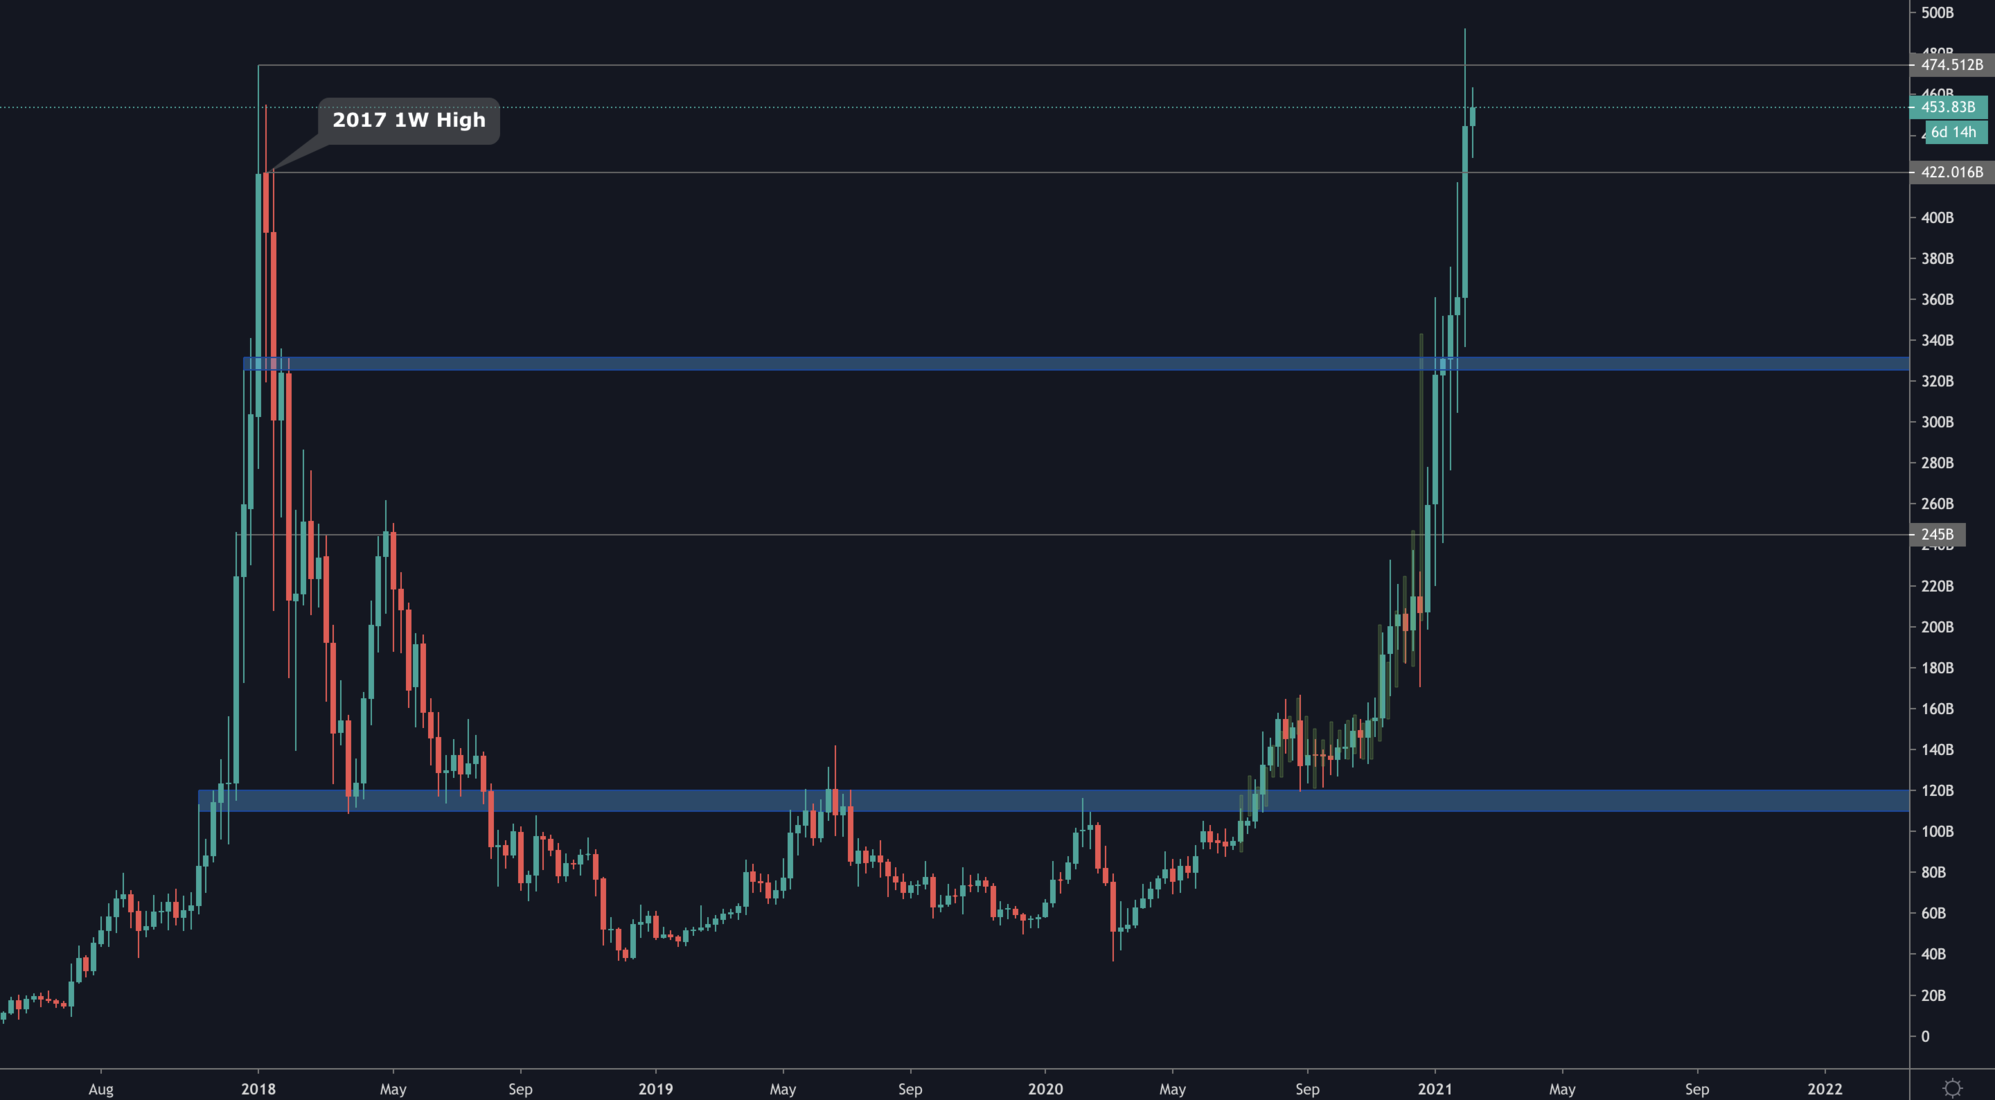
After closing a weekly candle above $325B the last two weeks, the run up to ATH had extremely high odds; a setup we shared in Weekly Technicals. This target has now been achieved, but will it stop there? Unlikely.
There may be price shenanigans at ATH, a usual occurrence but the Alts MCap created a new weekly candle closure high, which indicates an incoming price discovery phase.
Bitcoin
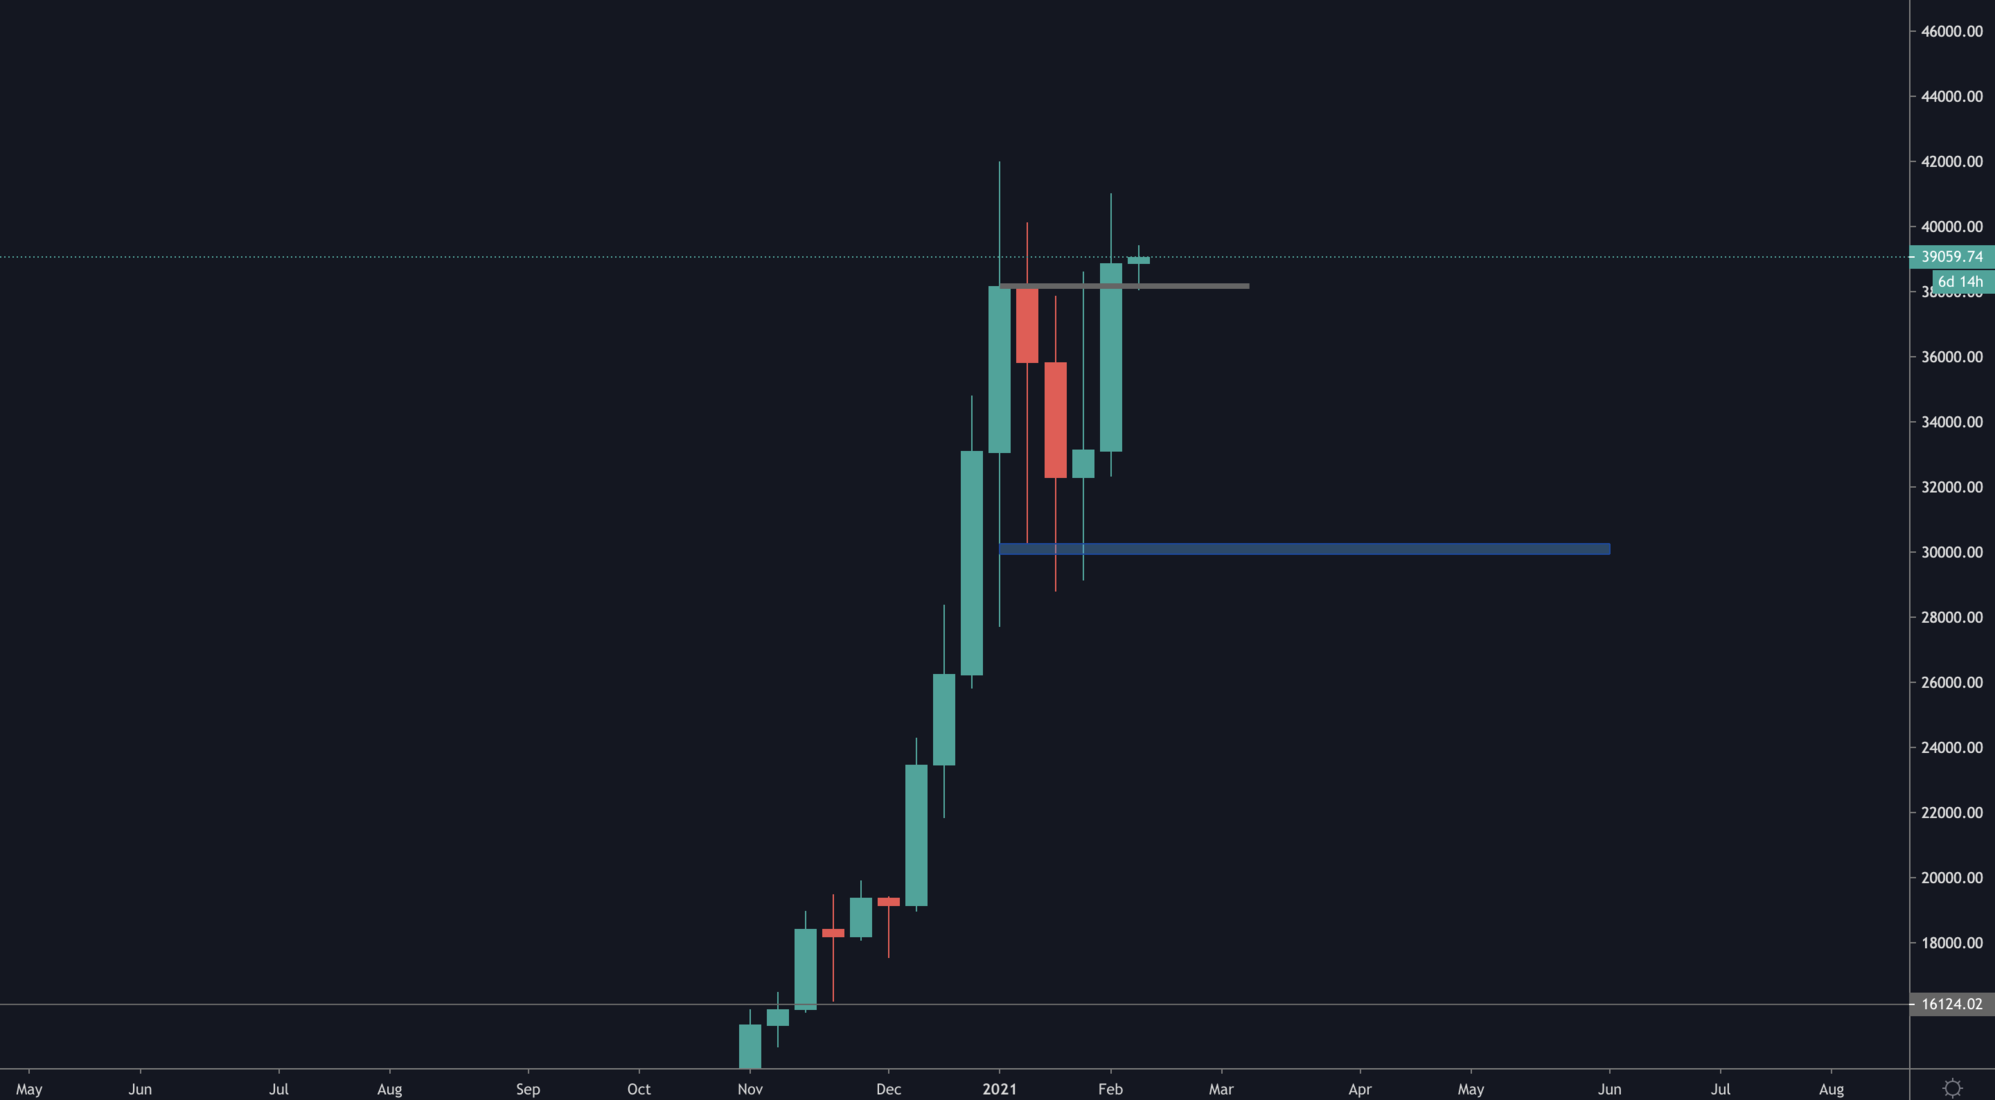
From a weekly timeframe perspective, the weekly candle created a new high which sets up the stage for further price discovery. What levels are next?
As previously done and explained, we use options strike prices with high Open Interest. In this case, the next incoming level (beyond the $42,000 high) is $52,000.
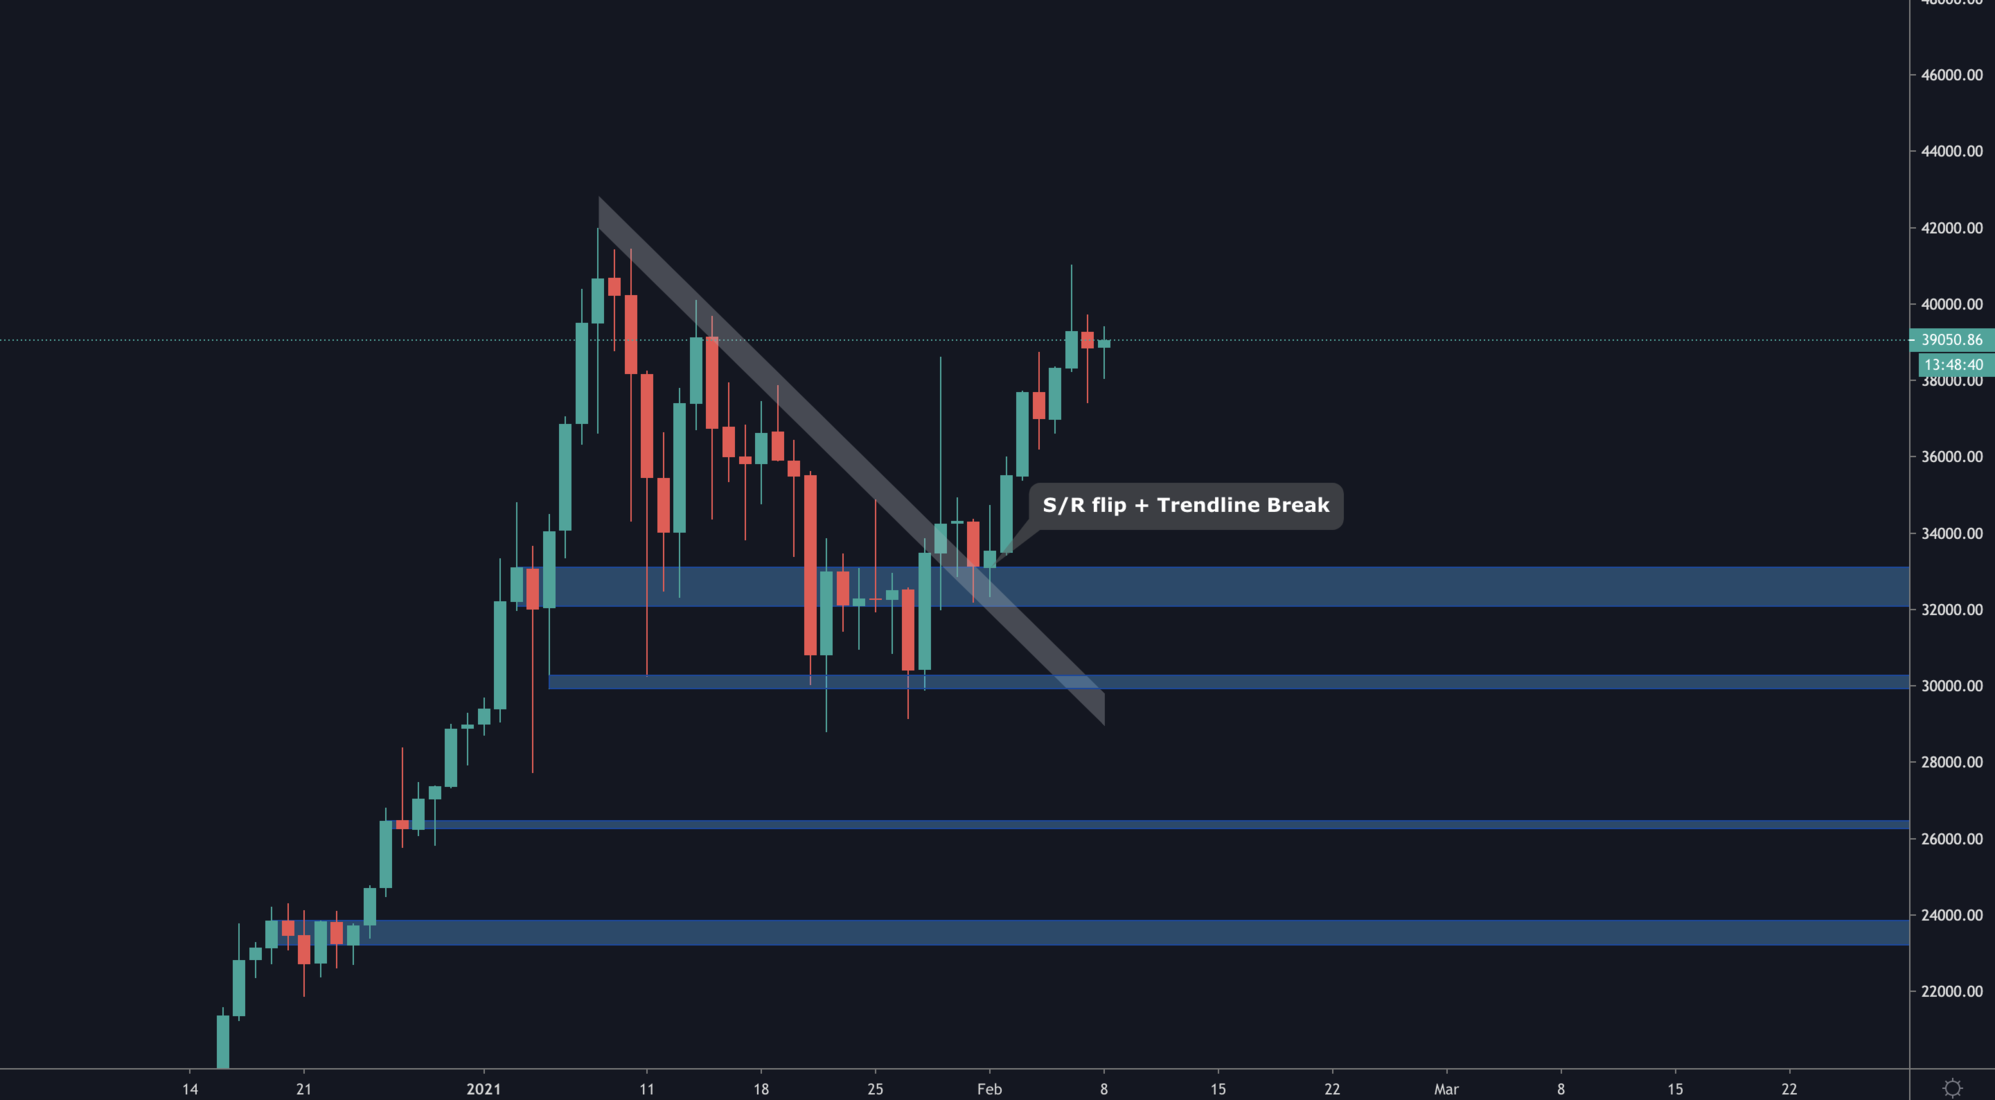
On a smaller timeframe (1D), post-S/R flip the level to tackle is $42,000, after which further price discovery can take place. The invalidation would happen via a daily closure under $36,000 which would bring about $32,000.
Ether
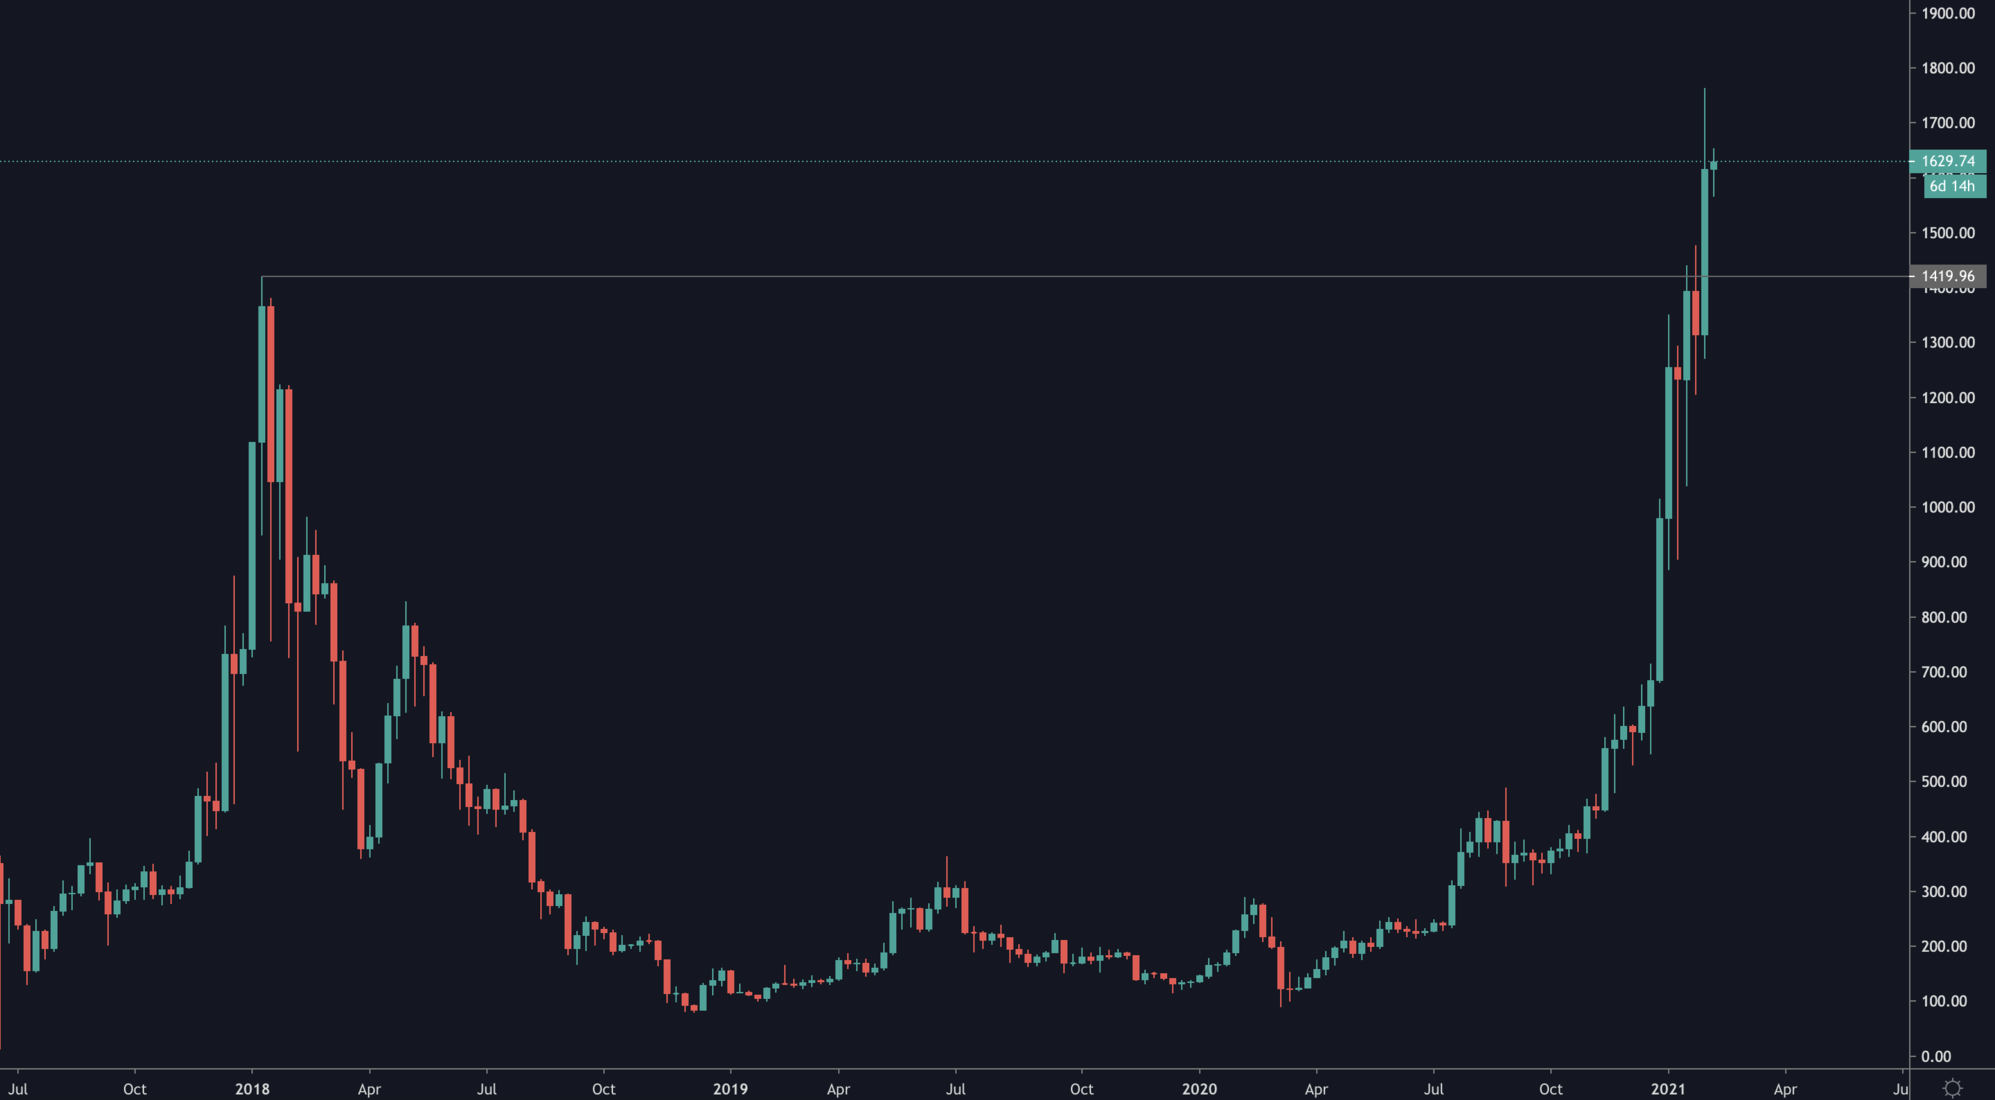
ETH closed a very strong weekly candle which pierced through the 2017 high. This is indicative of buyers' strength and an incoming upside continuation. Retests of $1,420 would be bullish too; only a weekly closure under the latter becomes problematic for bulls.
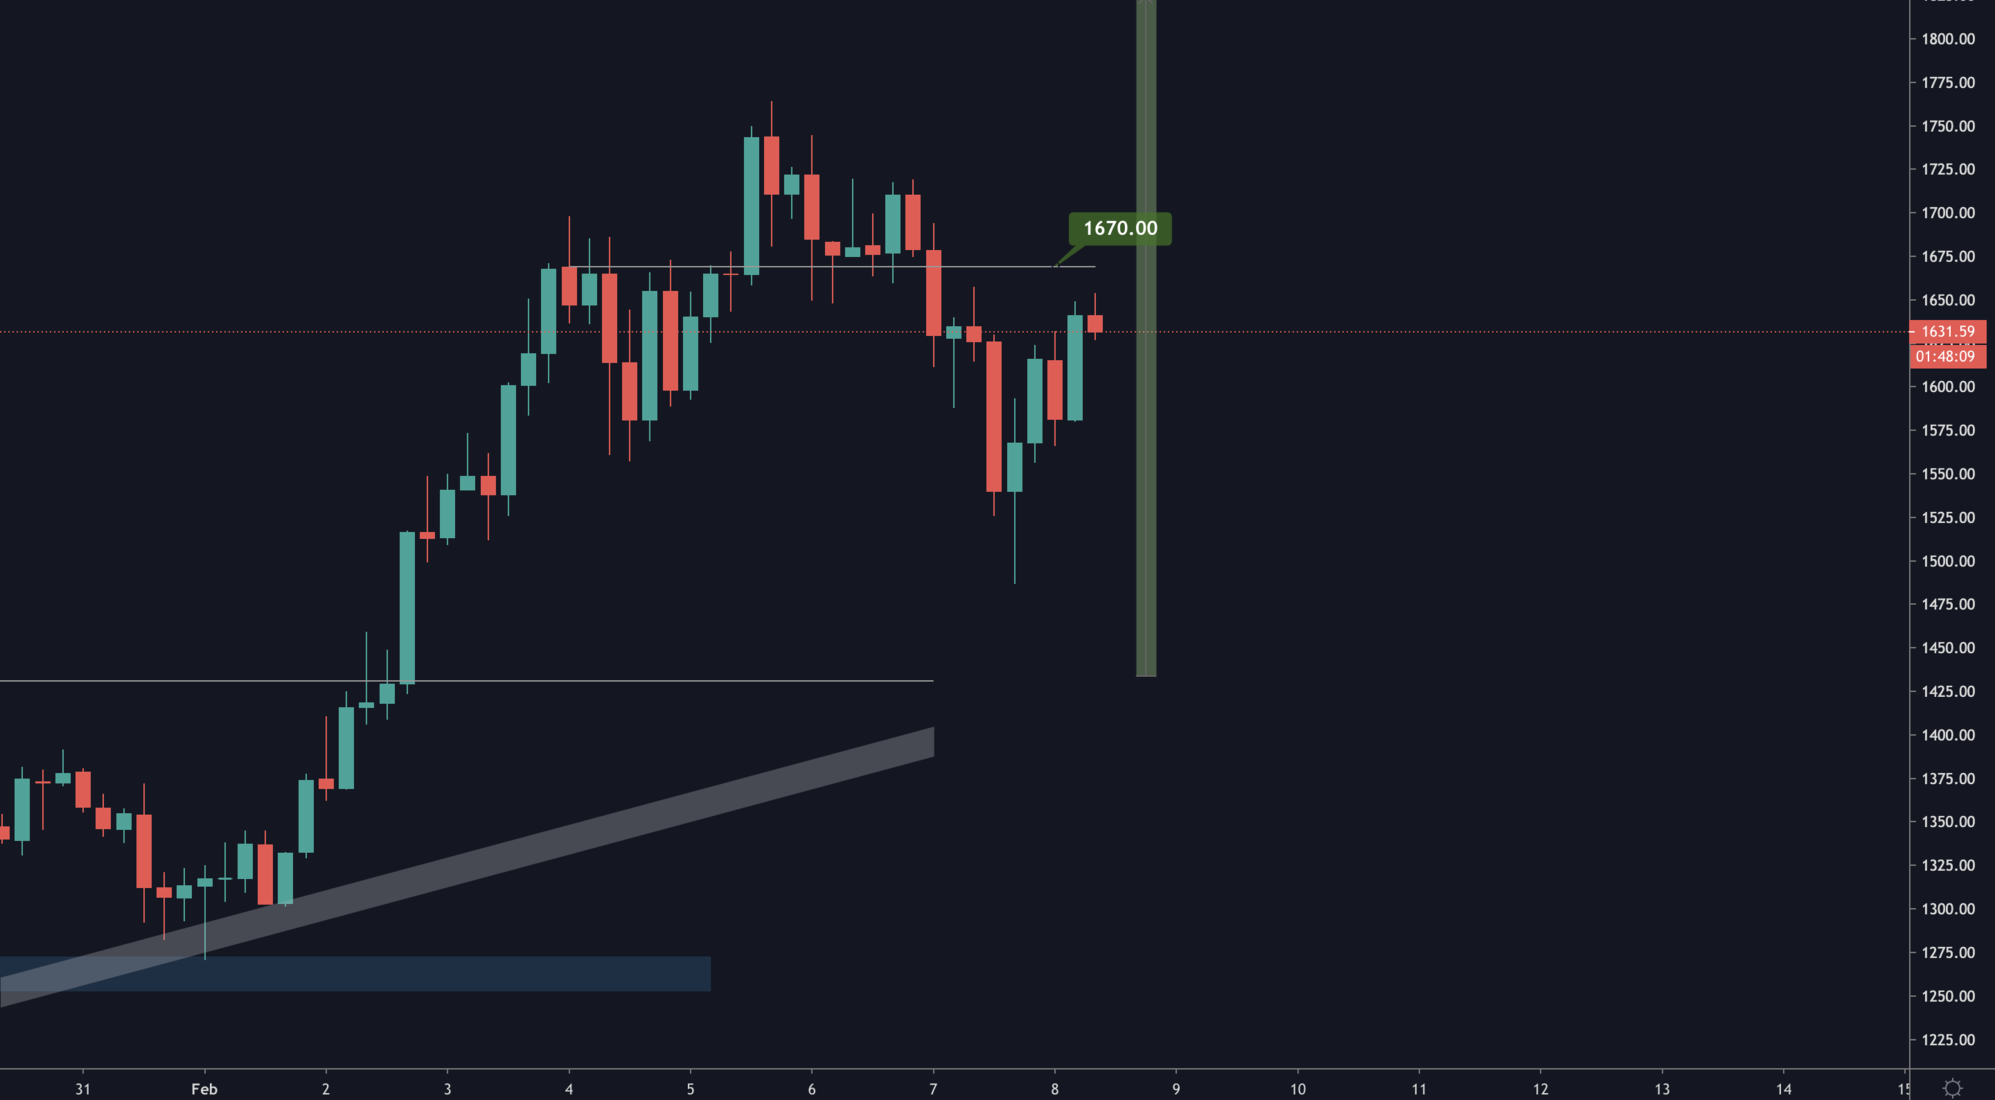
The $1,900 target of the ascending triangle is still in play. The pivotal point from a 4H perspective if $1,670; a price ETH should tackle in order to grow further. There will likely be some volatility around 11PM UTC (CME ETH Futures launch), however you can read here how the outcome is net bullish from a CME launch perspective.
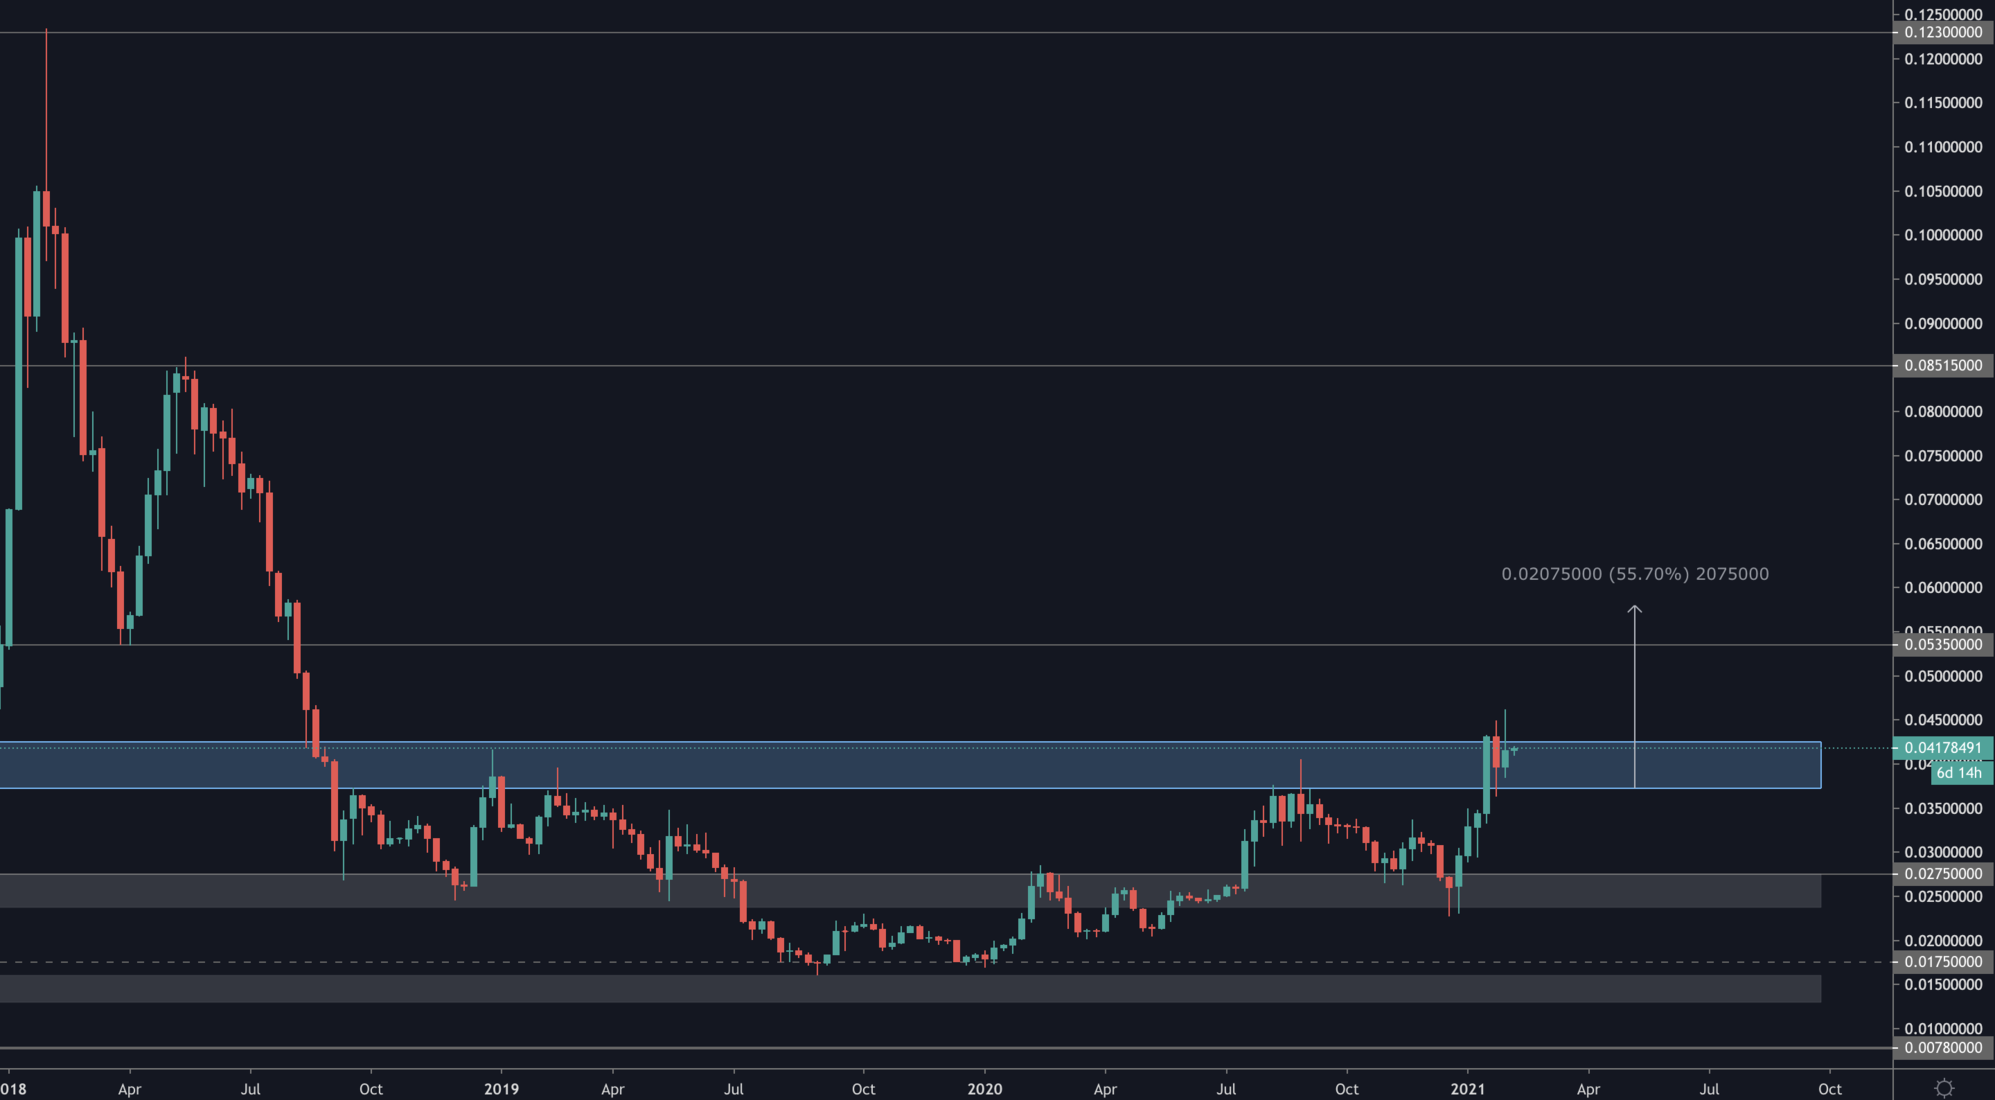
ETH/BTC remains respectful of the breakout (after 885 days). Price is consolidating at the resistance flipped into support and the target still sits at 0.058. The only invalidation we have for ETH is closure under 0.03725 BTC; until then we are net bullish.
DOT
DOT keeps doing what it does best: creating new highs and retesting previous one. For as long as this is true, DOT will remain in price discovery and we predict more upside.
SNX
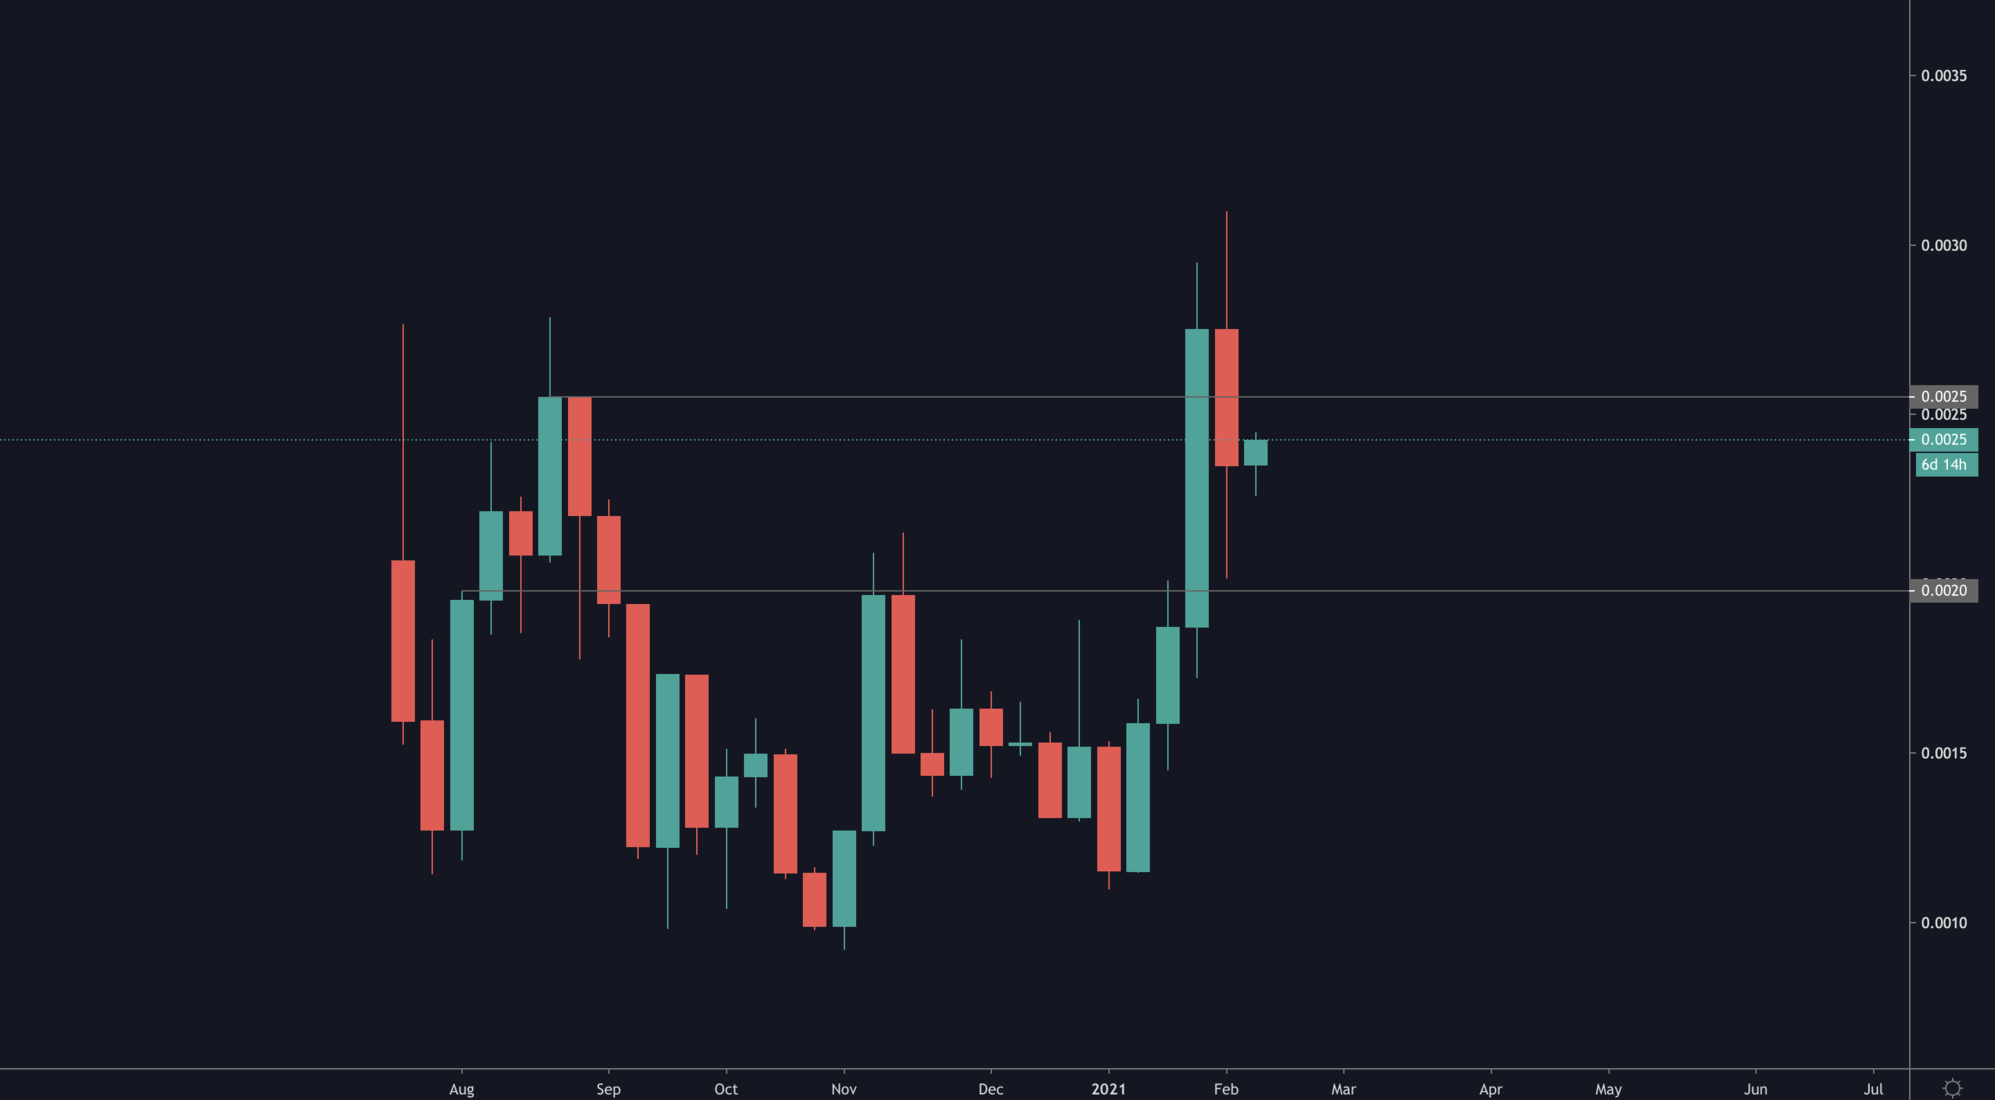
SNX is also creating HHs & HLs. The interesting chart however is not the USD pairing but rather the ETH pairing of SNX (below).
Very bullish candle closure and very high likelihood of outperformance coming from SNX.
RUNE
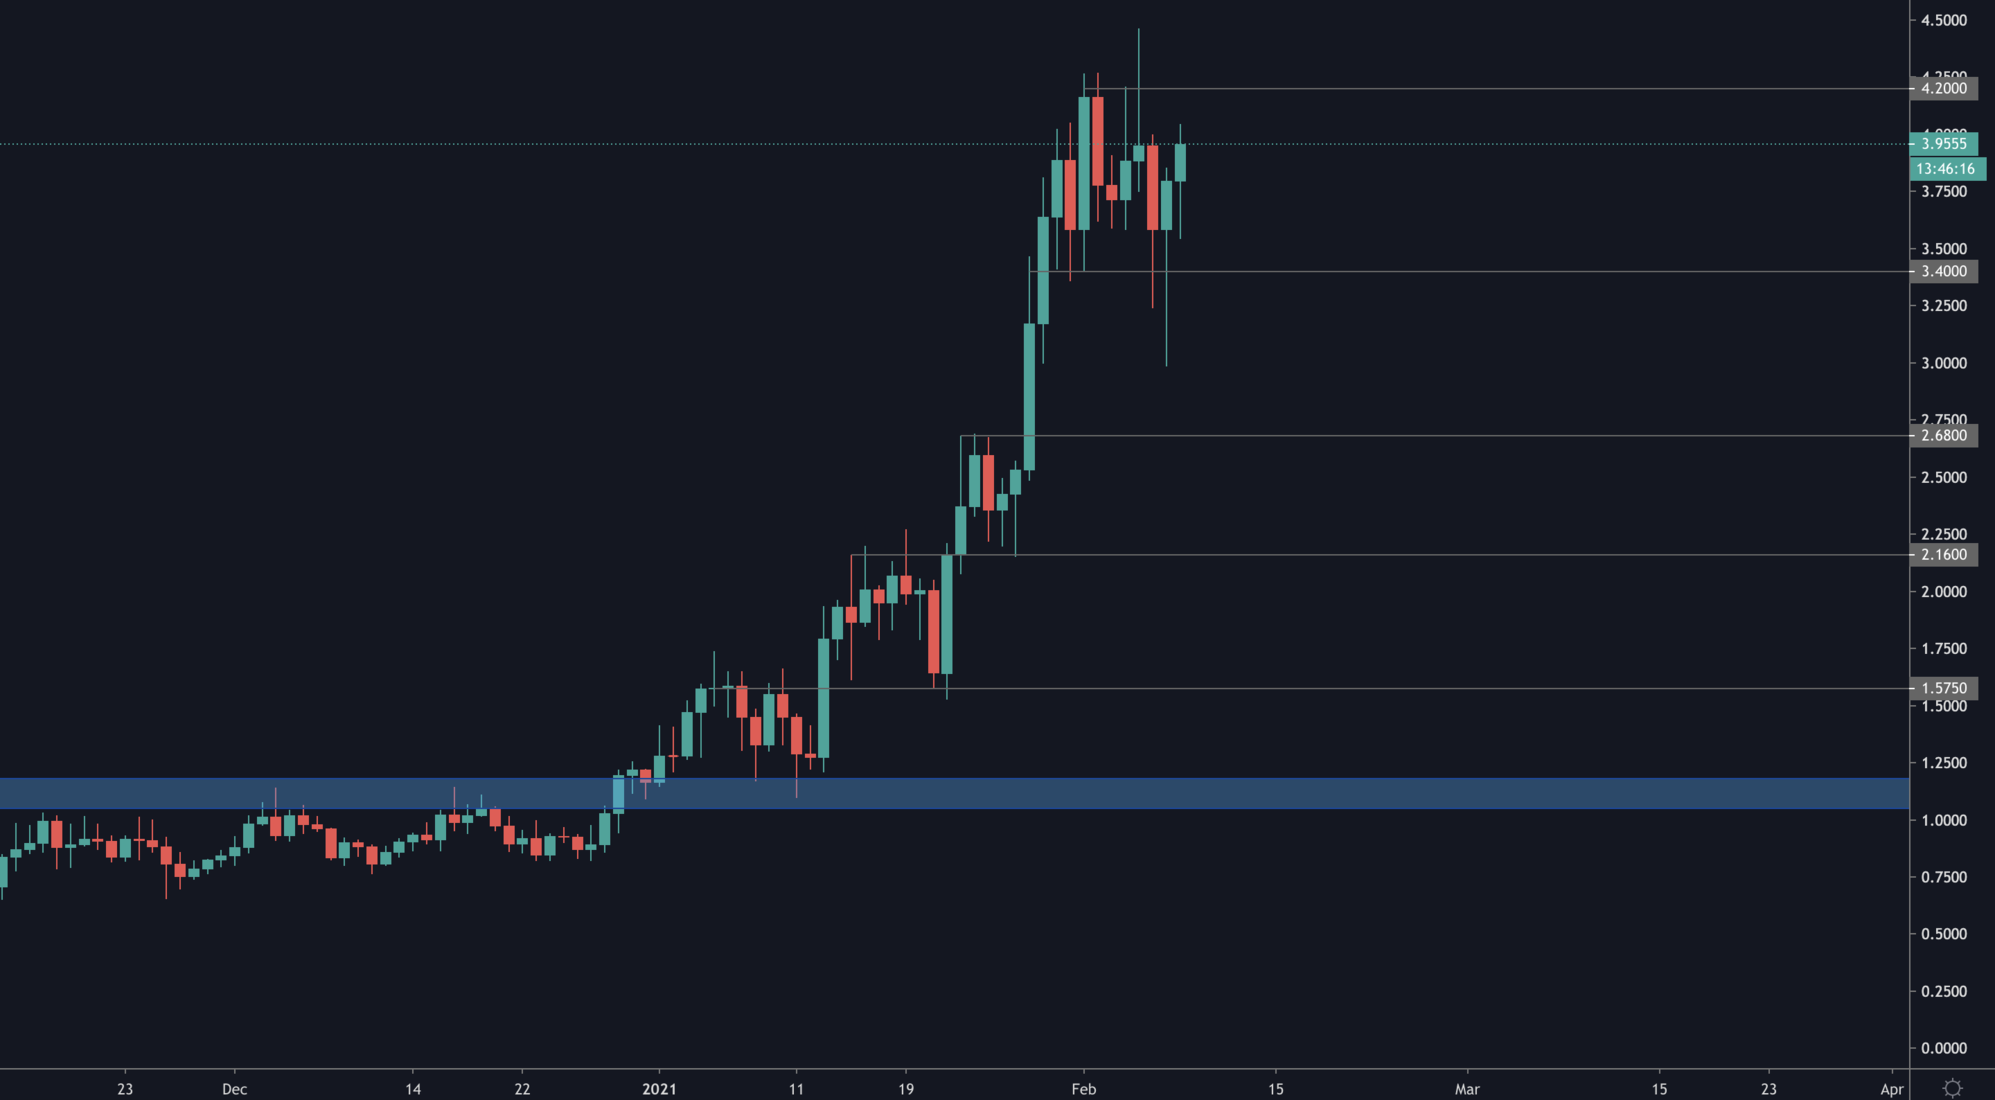
RUNE still sits in between the $3.40/$4.20 level. A breakout either way is imminent and will give further direction as to where price goes to next. Given the overall market environment and the level of demand seen yesterday around $3 we will say and upside break is more likely.
For the coming week, it seems like ETH will be outperforming RUNE. Which by linking, also means SNX will likely be outperforming RUNE. We hold both and our allocation proportions will remain the same but this is useful analysis to determine the market cycle and rotations.
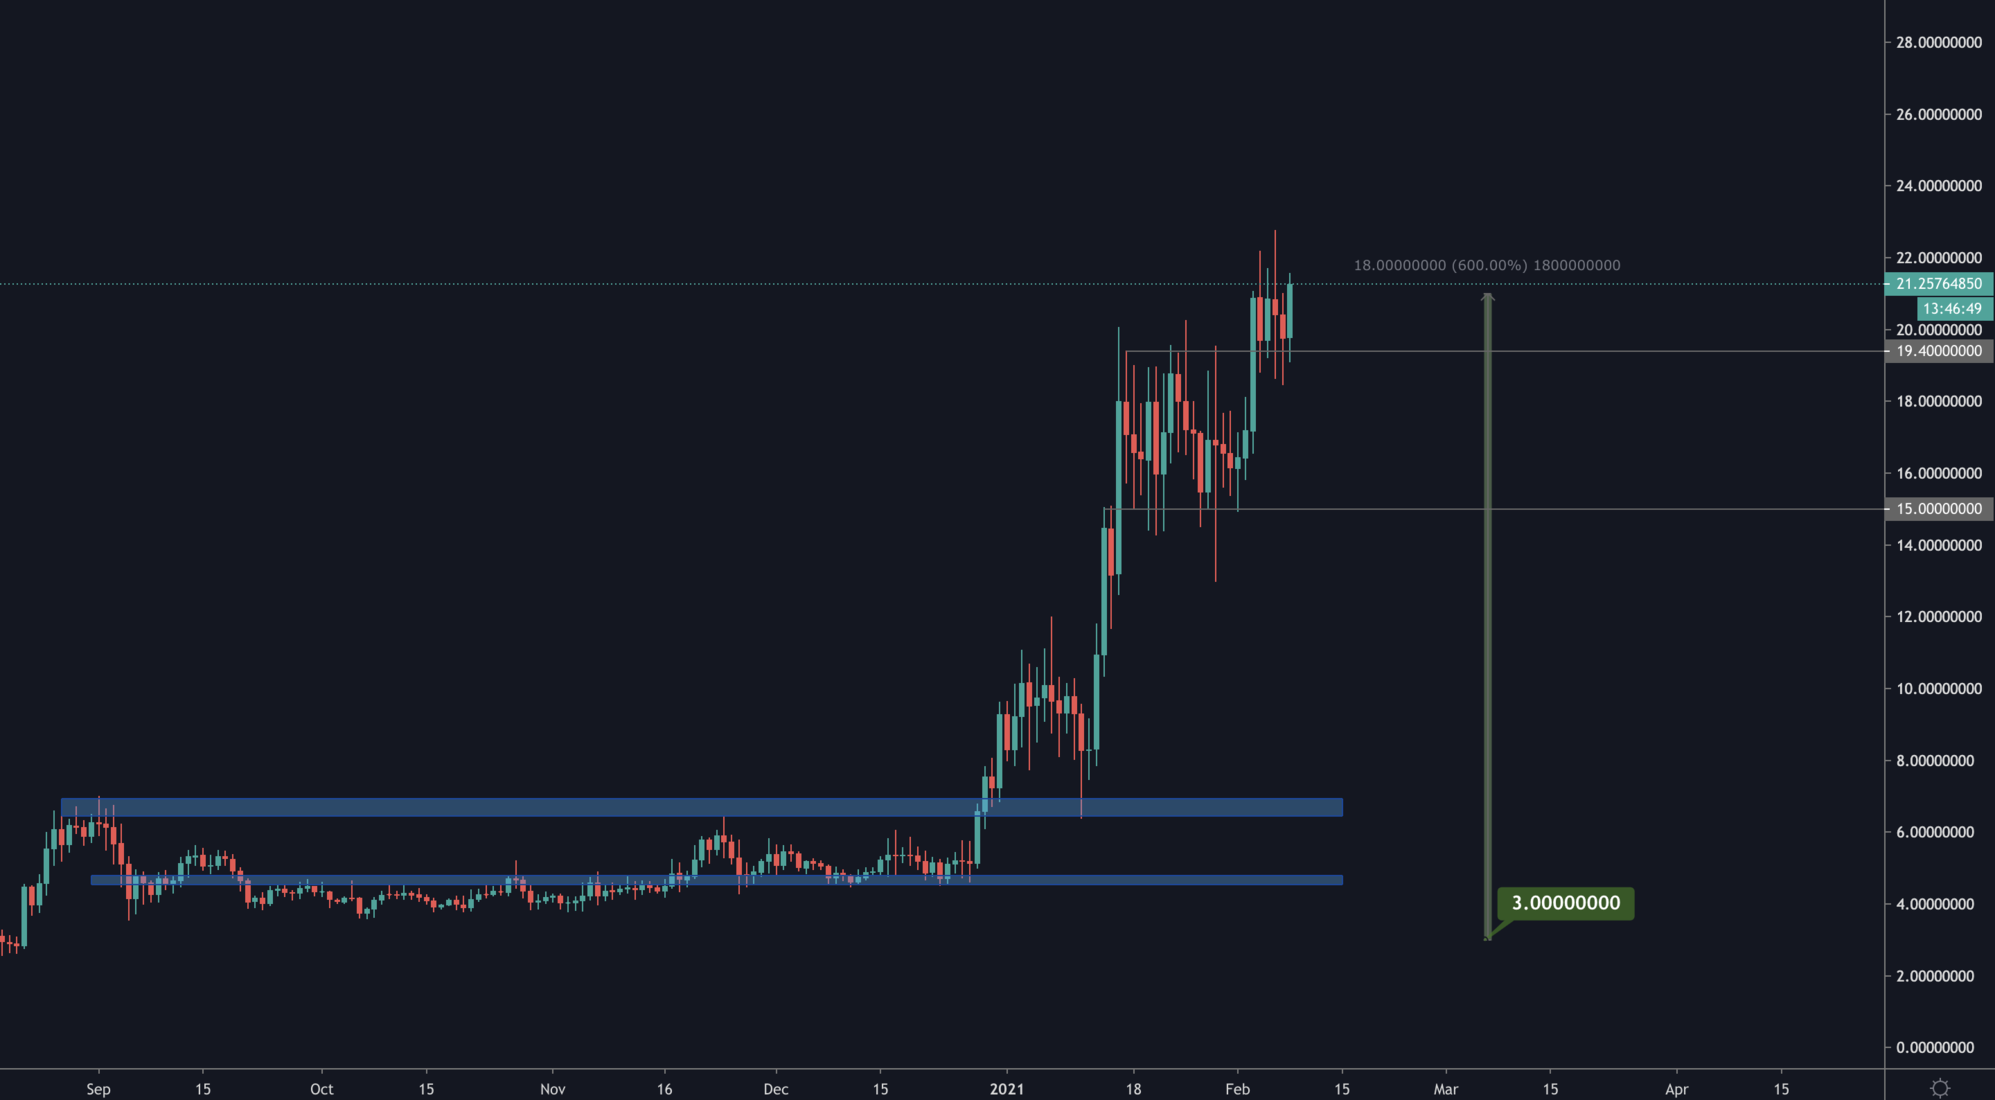
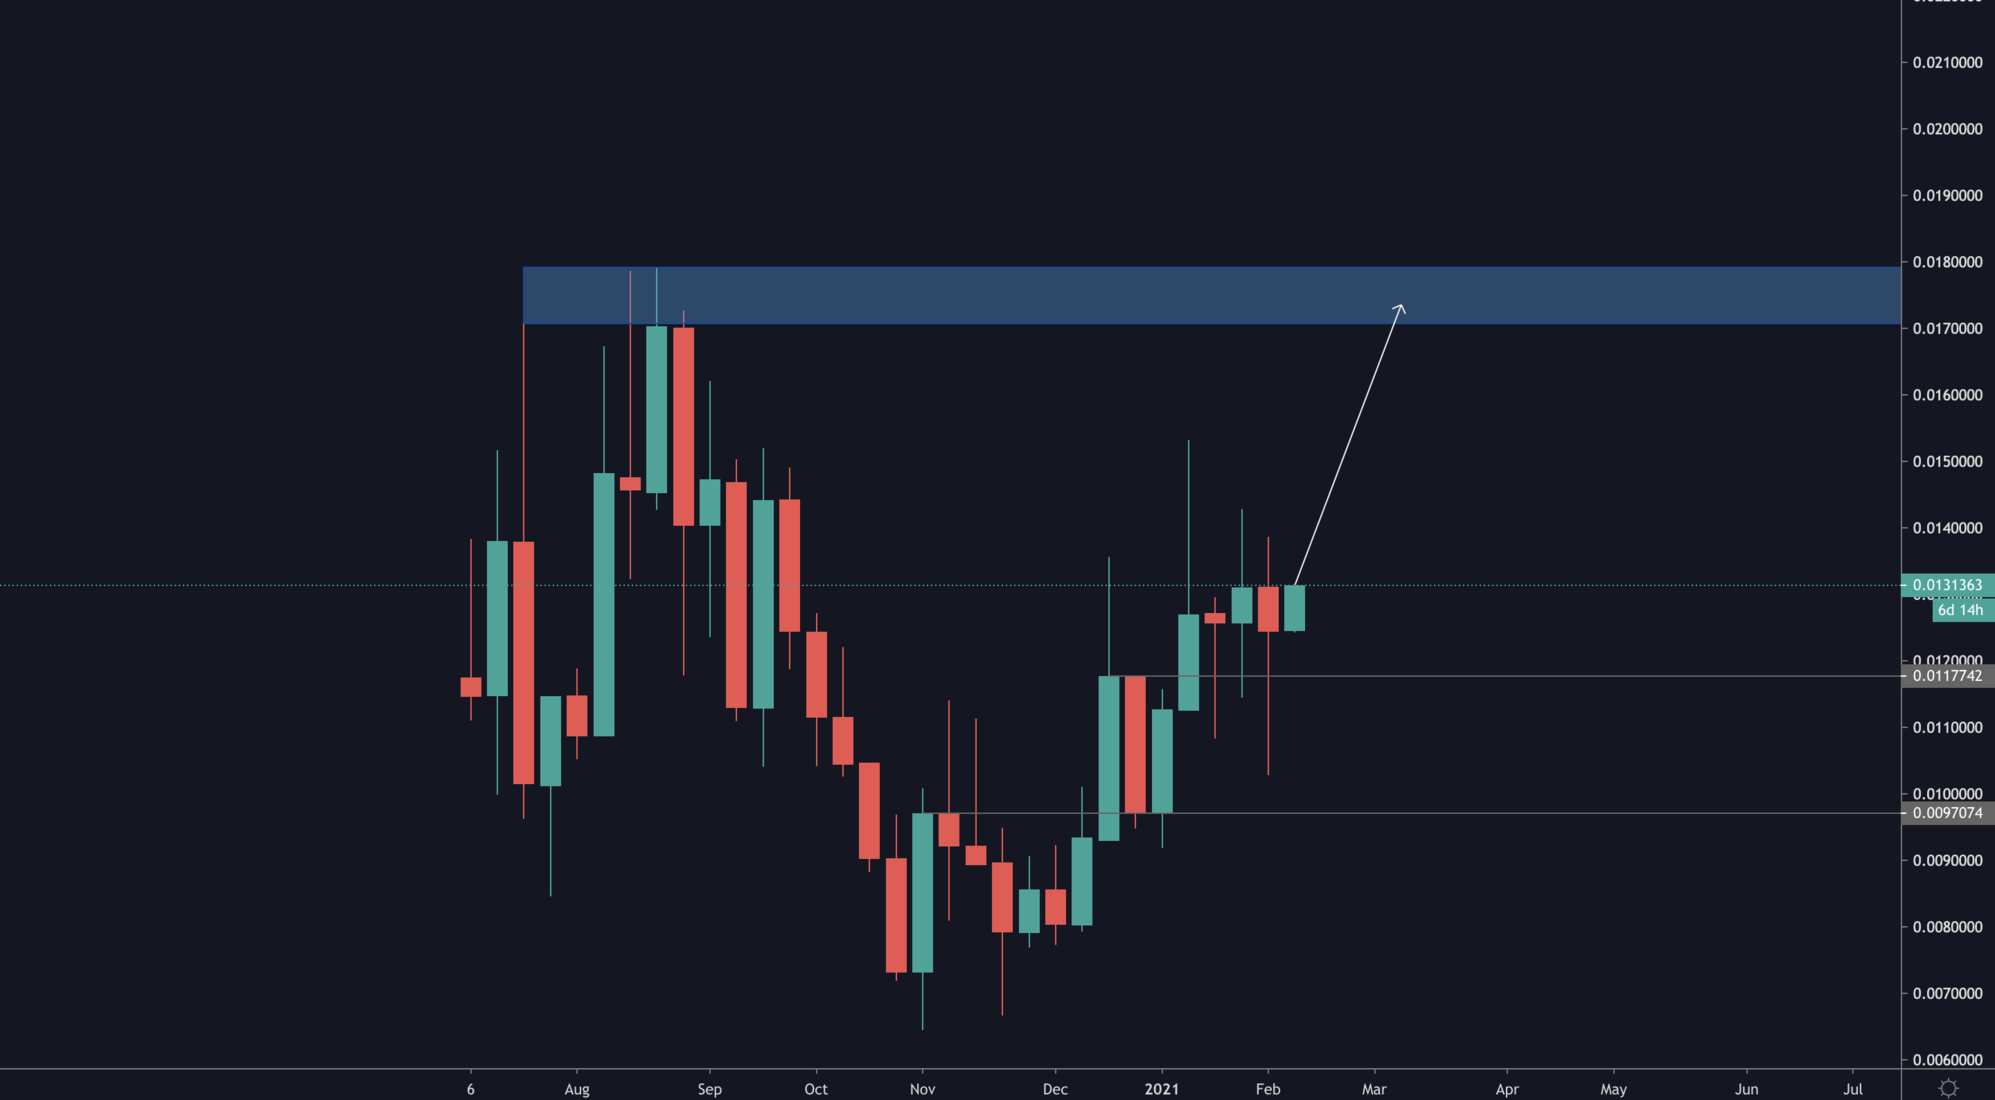
The following chart is RUNE/SNX:
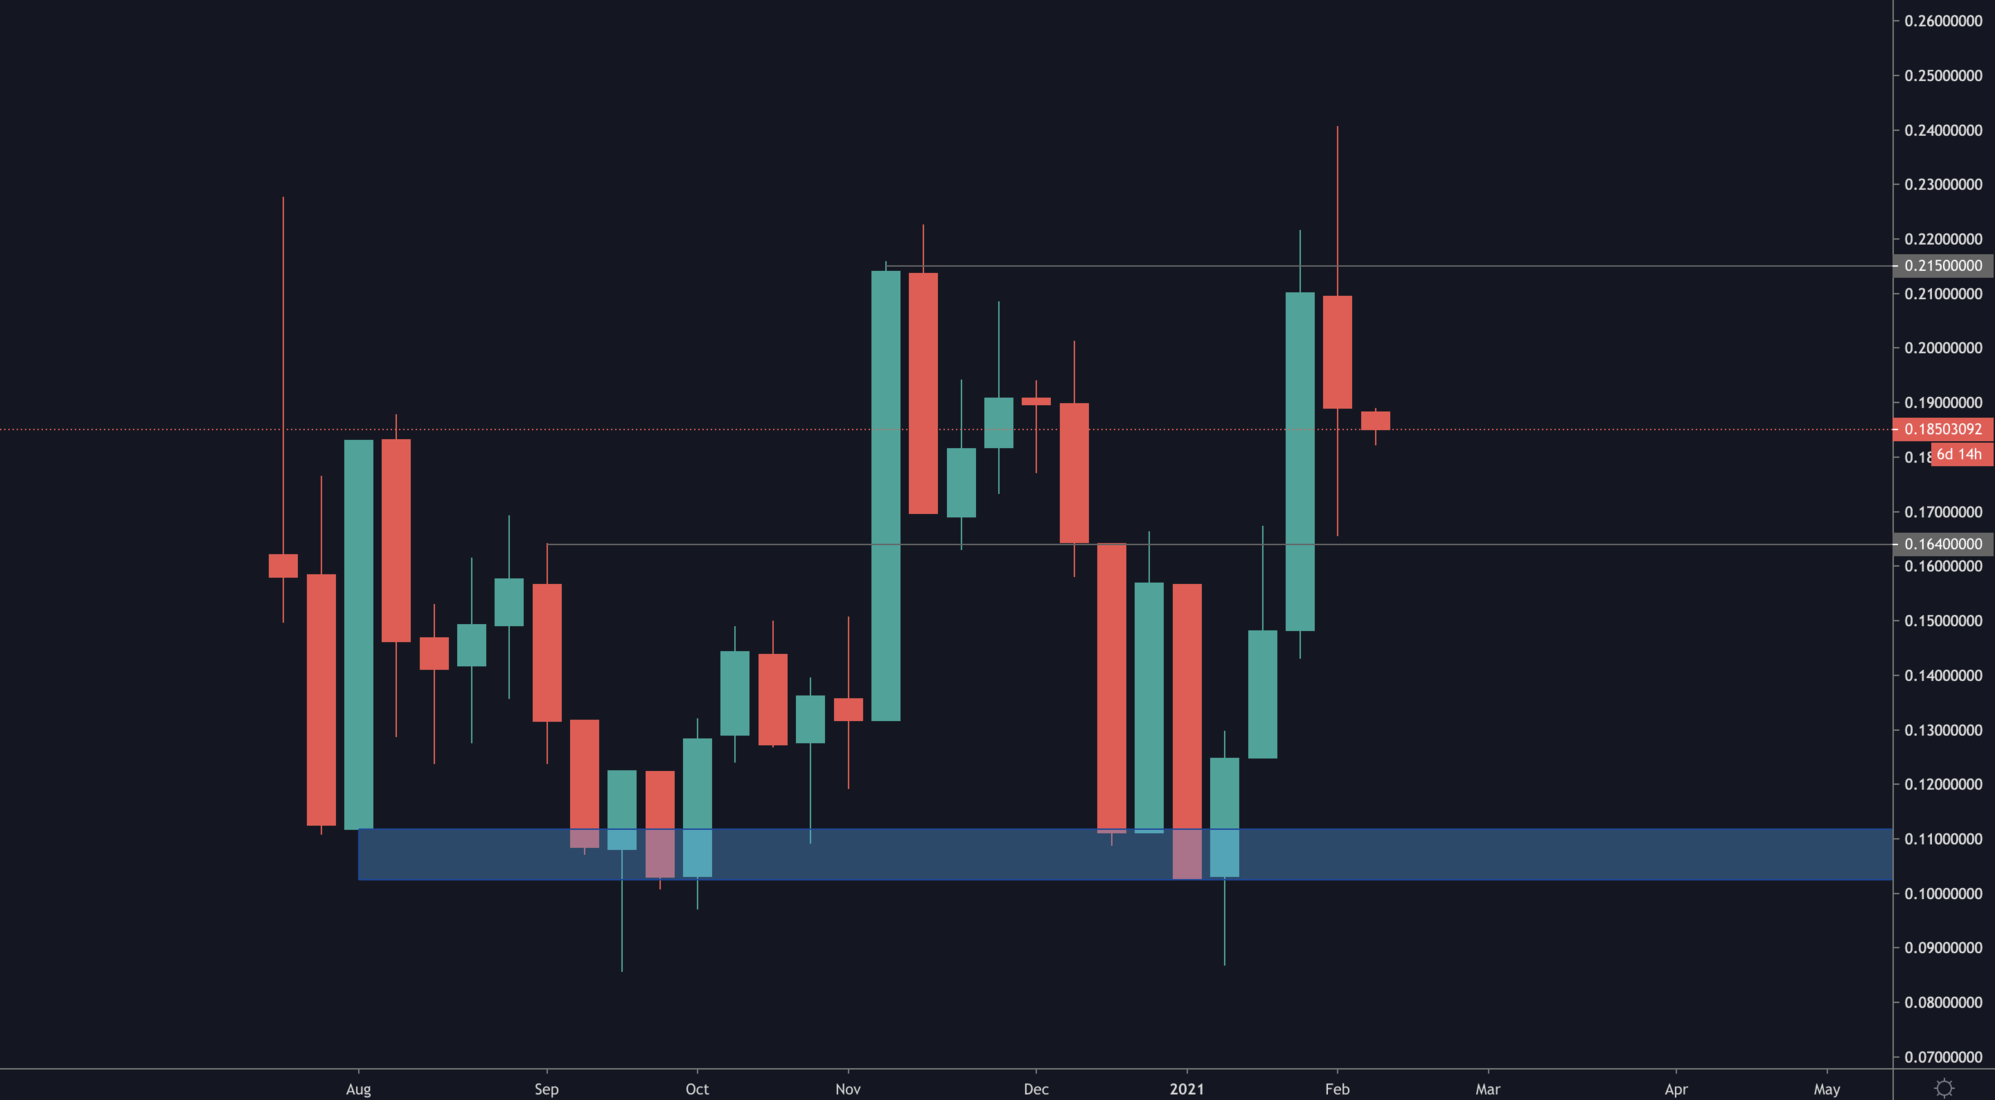
This pair (which shows whether SNX or RUNE outperforms) has been oscillating between a floor (blue area) and a ceiling (0.215). Given that price is at resistance, this reinforces the idea that SNX will be outperformer this week.
SRM
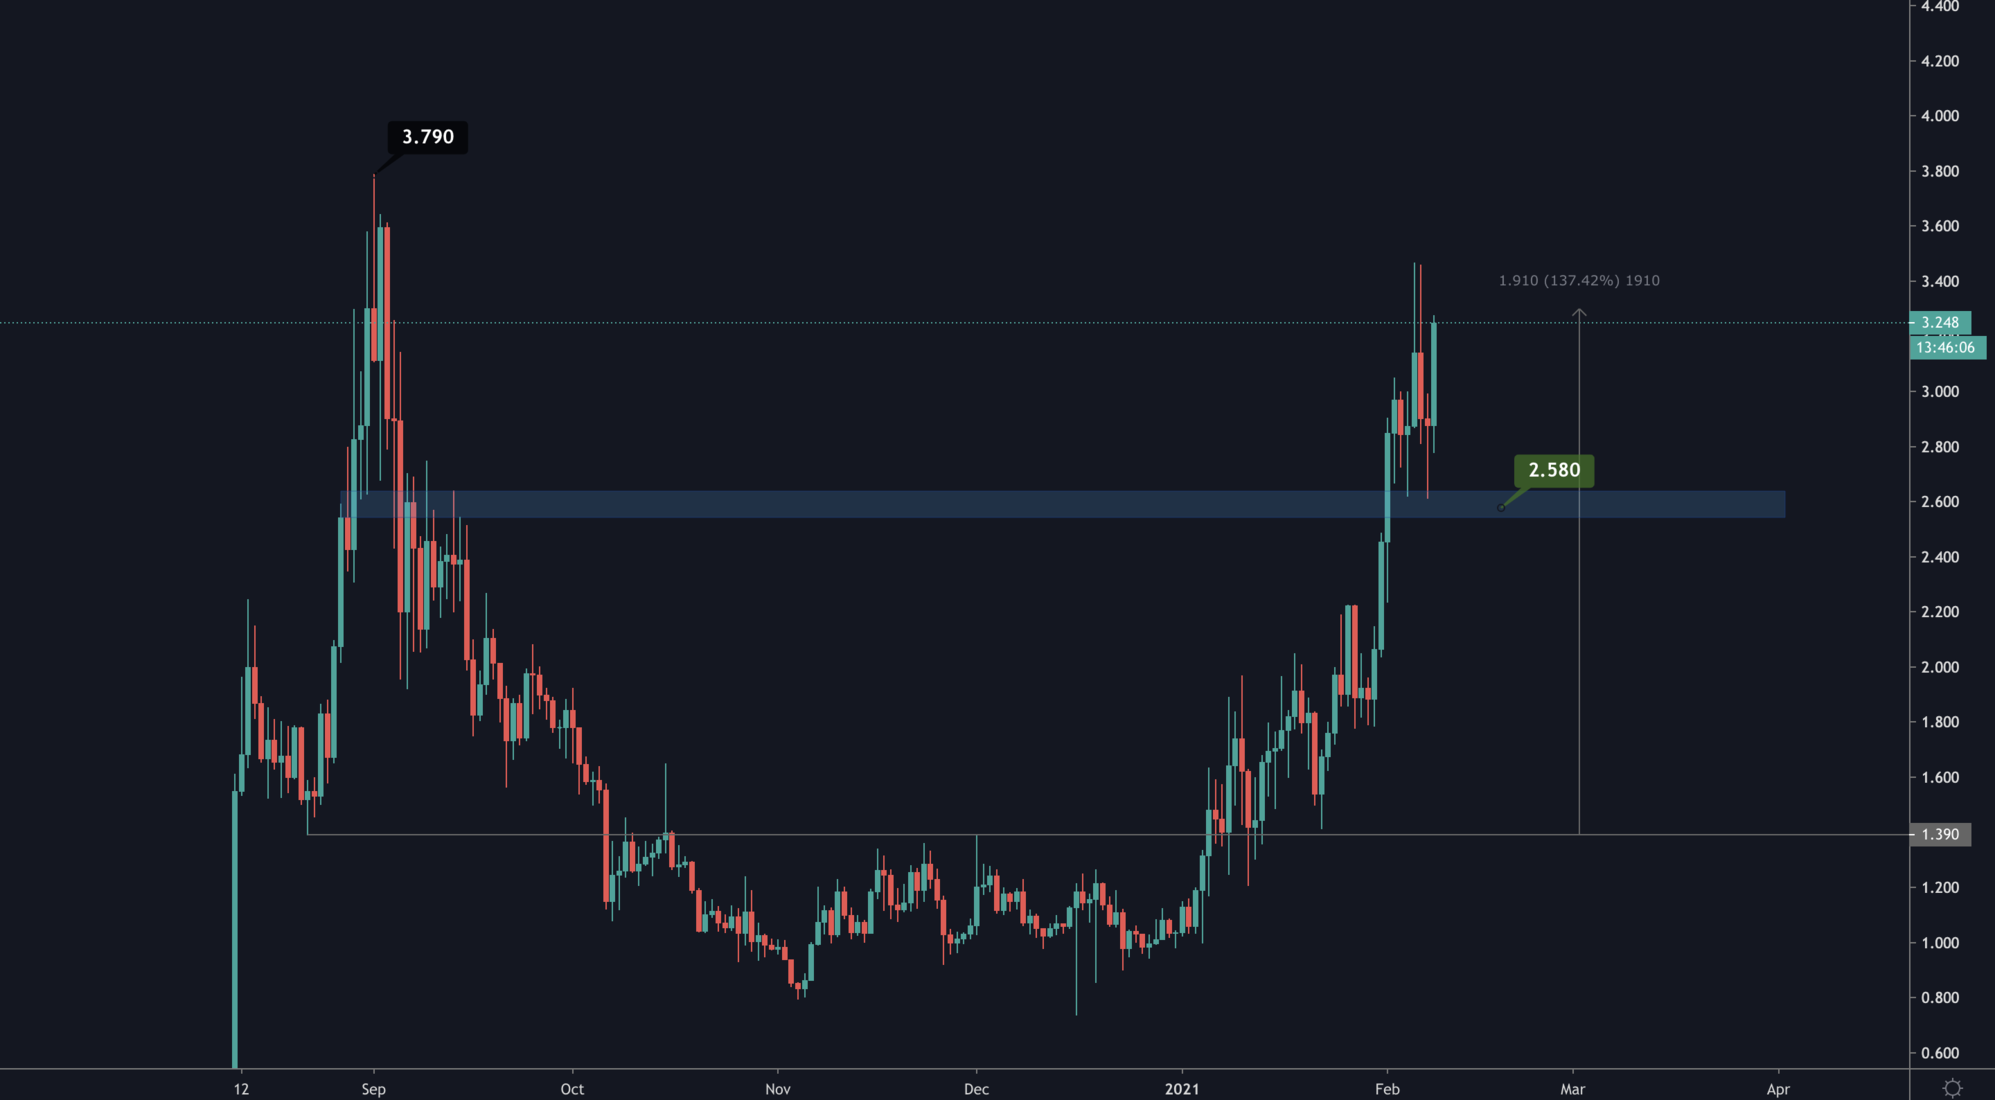
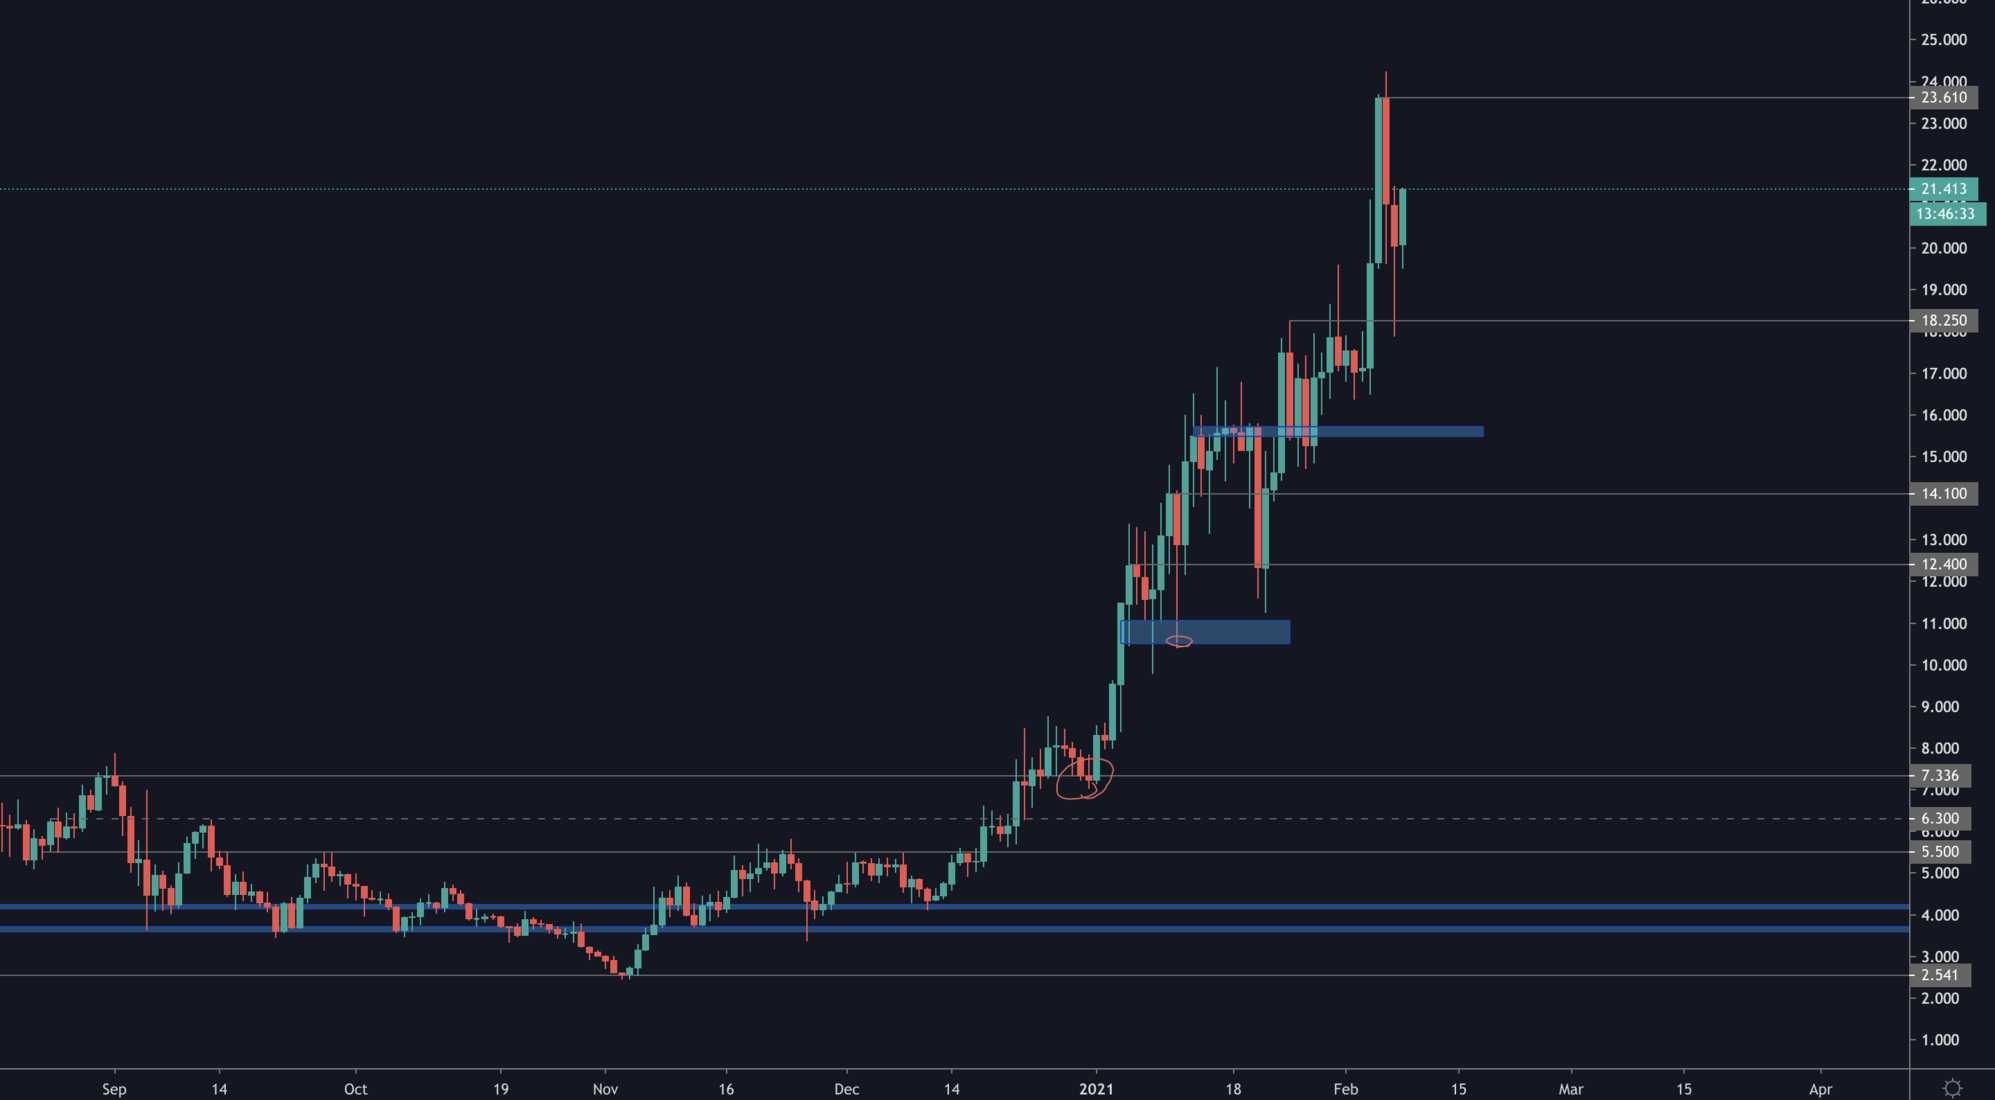
SRM has again dipped back into support and buyers stepped in quickly. Since $1.40 the swing trade target has been $3.79 and it is not changing.
Recommended from Cryptonary


