Save 23% ($351) & Get a Free 1-1 Call with our Team ⏰ : 0d 2h 59m 44s
Weekly Technicals Pro - Volume 48
Sentiment is in the "Greed" zone, not "Extreme Greed". The reason we are posting this metric's chart since 2018 is to show how the data will progress through the bull-run while showing specific opportunity windows along the way.

Market Sentiment
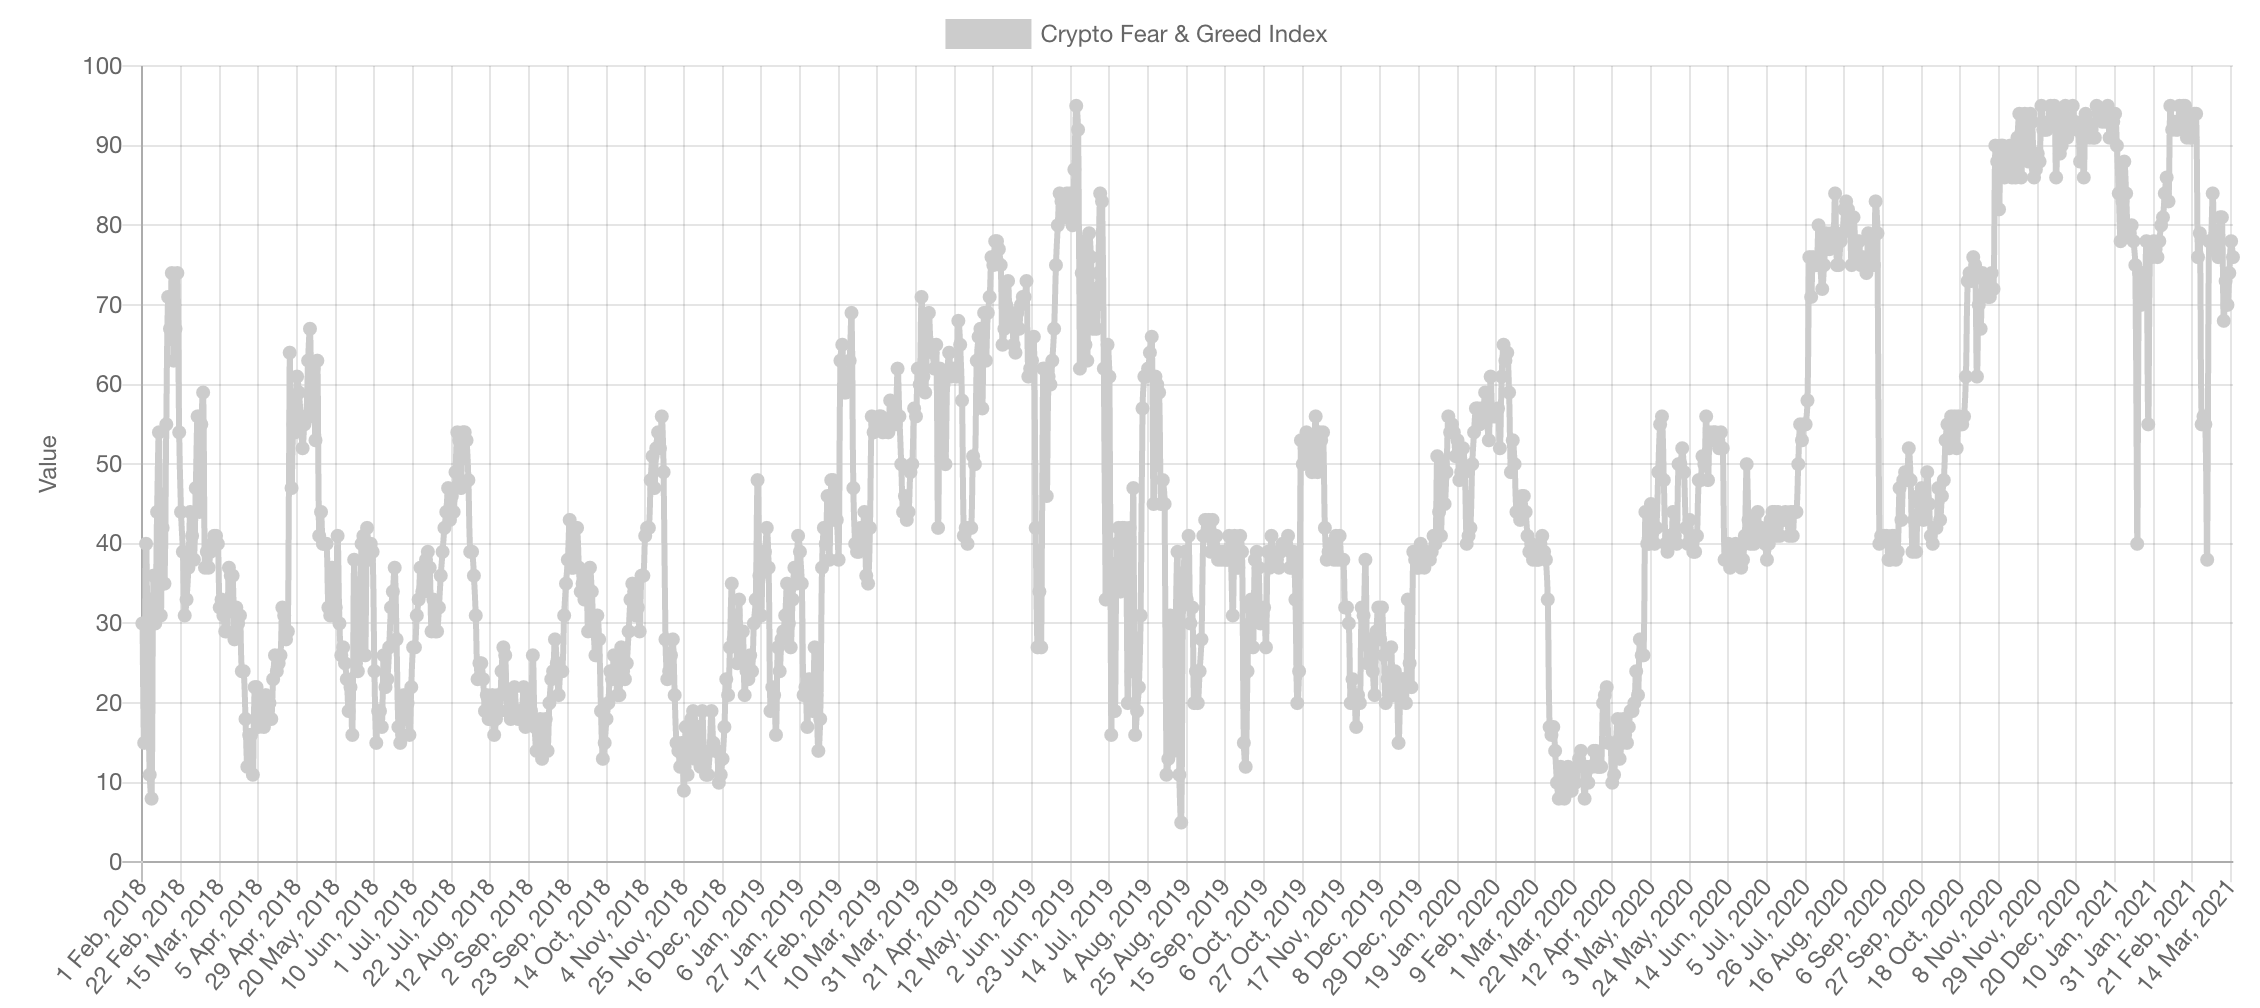
During the bear market, sentiment naturally gravitated towards "Extreme Fear" and spent a lot of time there with occasional peaks towards "Greed" which represented selling opportunities back then. Today, we have the exact polar opposite as sentiment gravitates towards "Extreme Greed" and has occasional peaks to "Fear" which have been great buying opportunities.
Funding
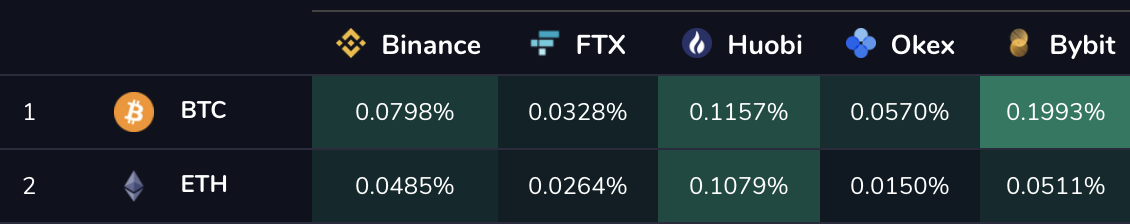
The Fear & Greed index gives a rough image about the overall sentiment on a large timeframe (days/weeks) while funding gives us an indication of sentiment on a shorter timeframe (hours/day).
Funding is positive and significantly higher than the standard 0.01% rate, however it is not at insurmountable levels (with the exception of ByBit BTC). Binance retail traders have been largely liquidated already and hence the quasi-reset on funding.
Market Index
Total Market Cap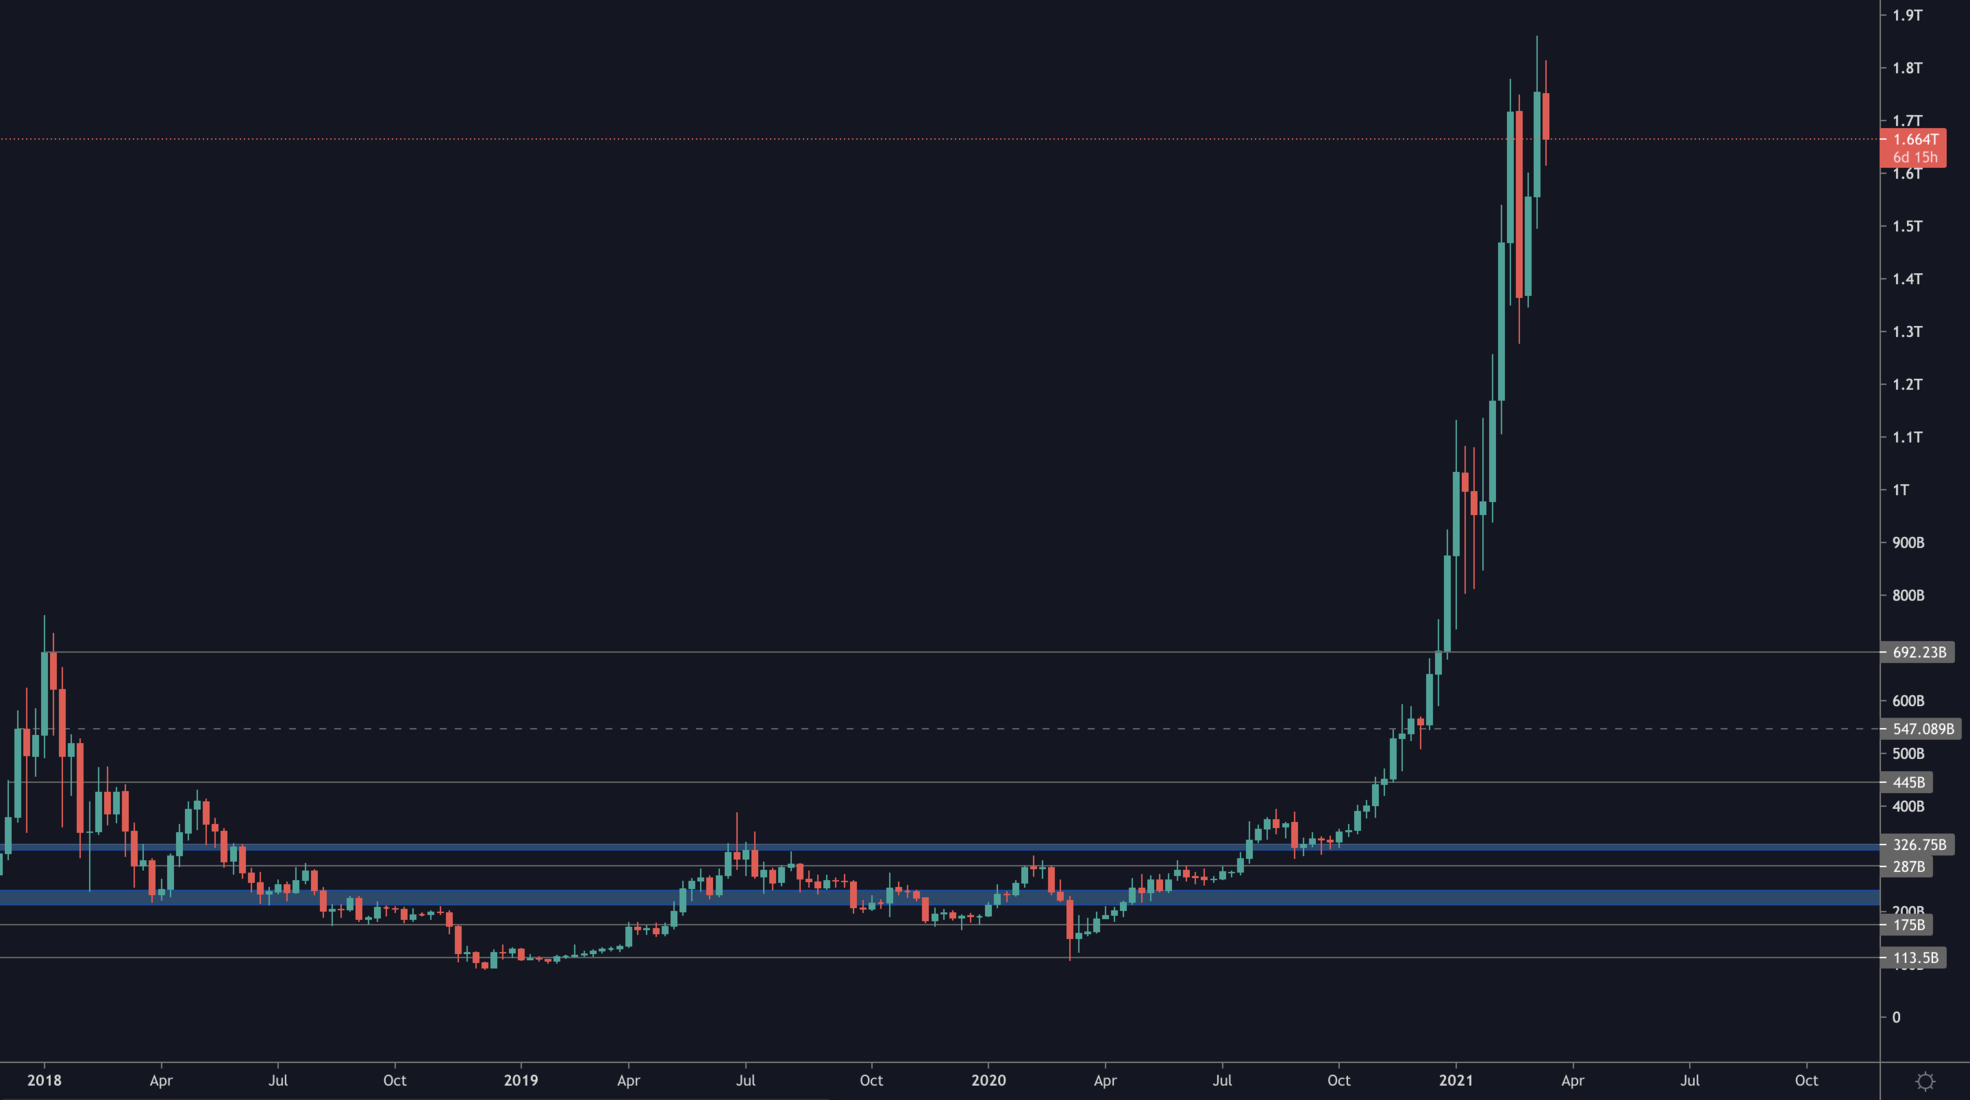
The Total Market Cap remains in a parabolic rise and has set a brand new weekly high on the latest candle closure. As long as the that new high is respected on the weekly timeframe, the crypto market as a whole has high odds at continuing its uptrend.
Altcoins Market Cap
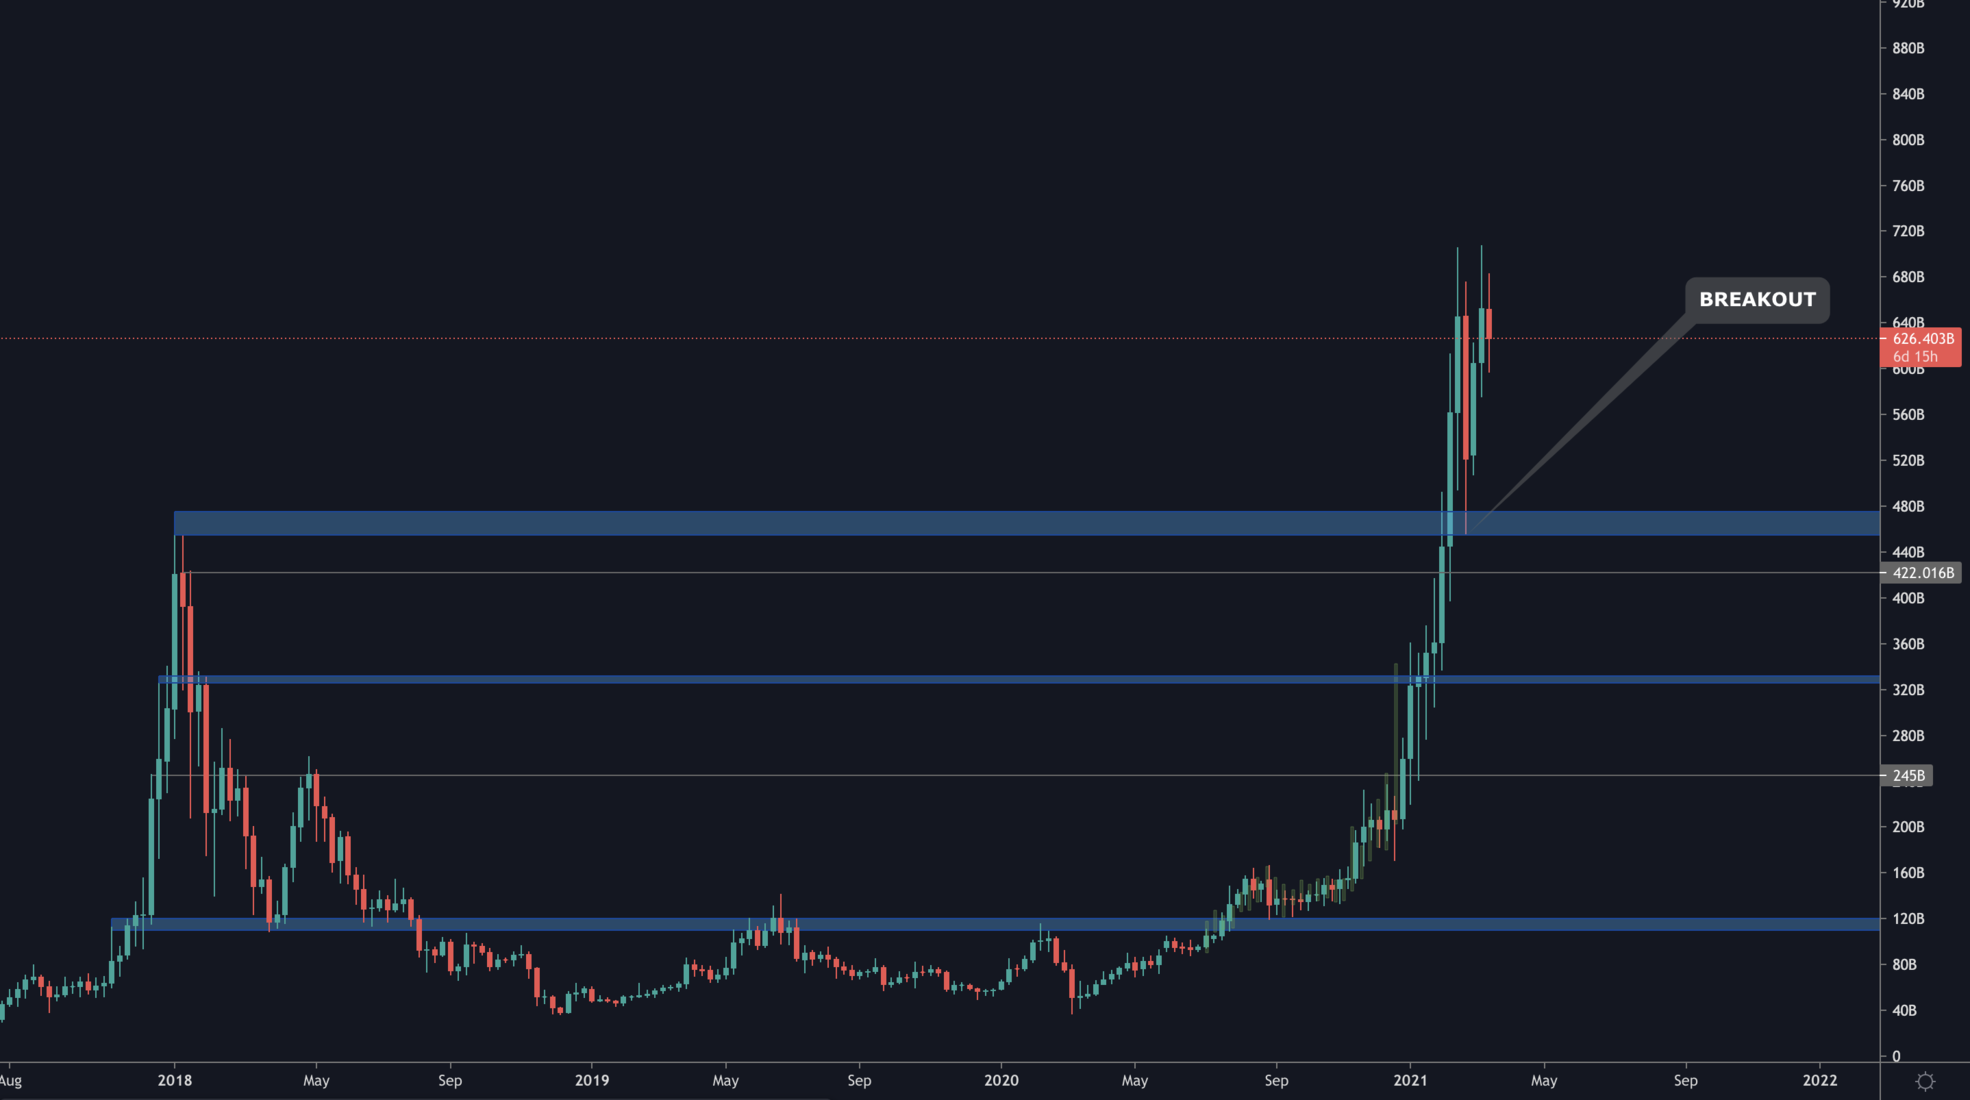
Altcoins by far are offering the single most lucrative R:R opportunity. After the breakout, the retest actually shook out many (crazy but true). We will remain highly invested in Altcoins and willing to long dips to the $450B 2017 high should they re-occur. The upside is uncapped here, as you know Altcoins can rally very hard - especially new sectors (i.e. DeFi) - the cap is only set when there is no more value to be extracted and the manic phased is reached. We will be maintaining our ear to the ground and posting continuous updates about this specific subject.
Bitcoin
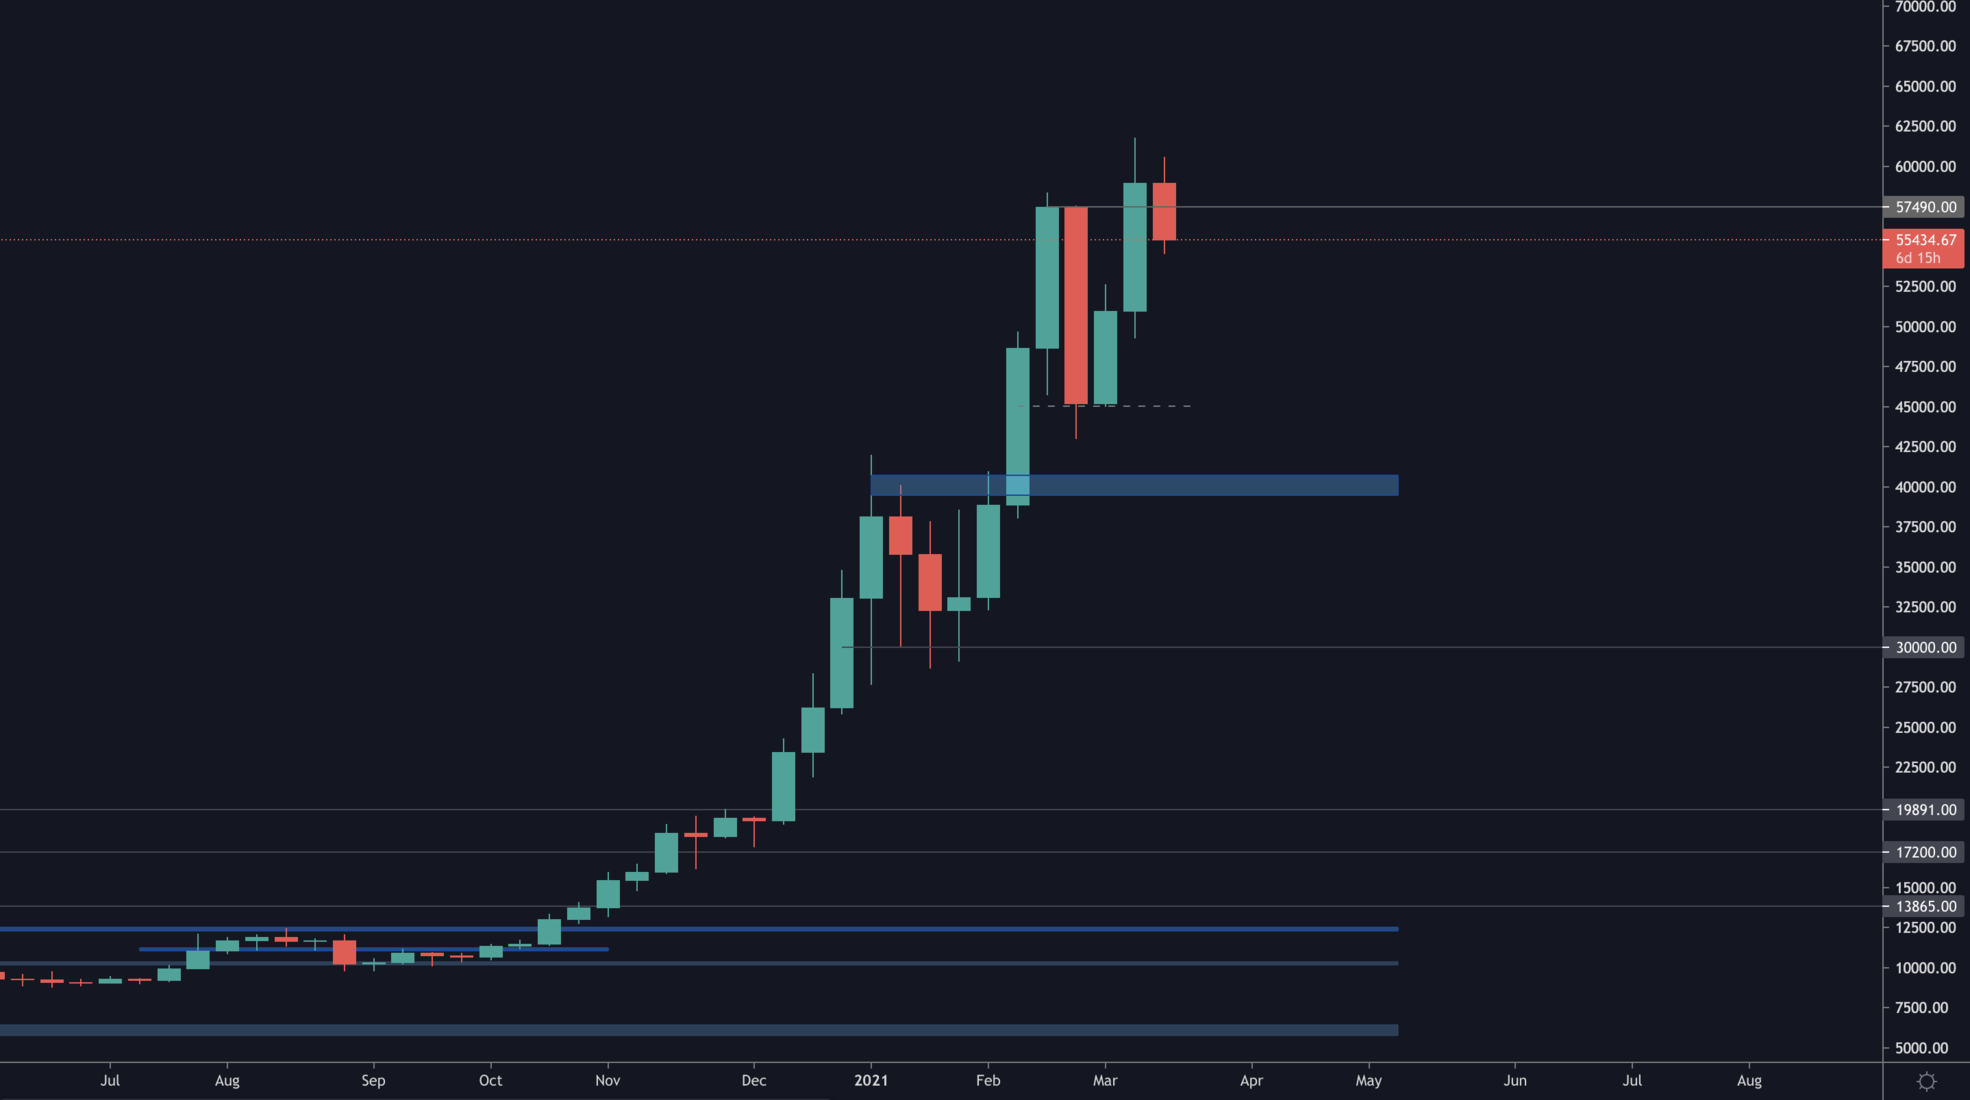
Bitcoin has crossed the previous weekly high, hinting further upside. The dip that occurred at the end of February was perfectly stopped at the $45,000 support level which was highly respected on the daily timeframe and hence providing fuel for this reclaim and climb into all-time highs. With the stimulus bills being processed and inflation rising, there aren't doubts that Bitcoin's value proposition is at its strongest still.
Ether
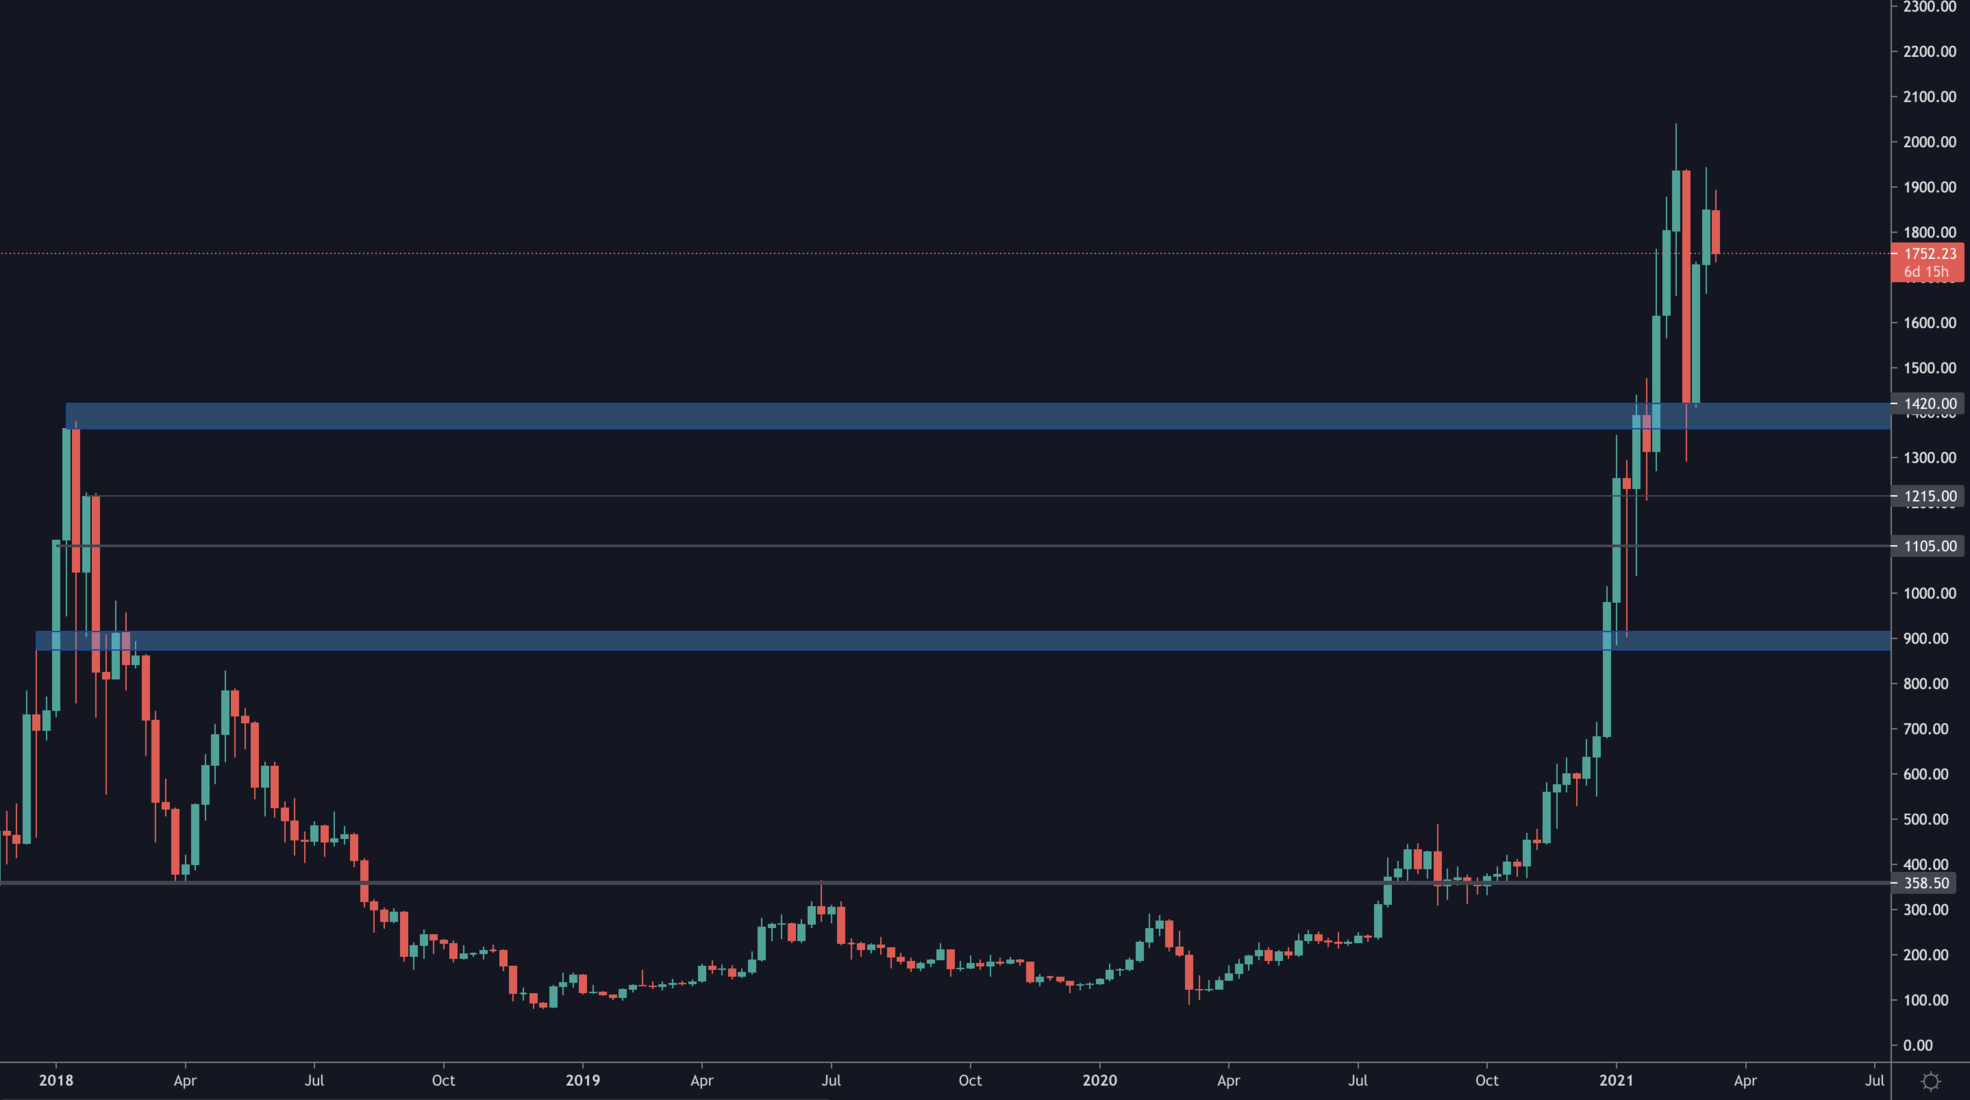
As Pro members know, we've longed $1,430 and we are targeting $3,000 with that particular swing trade. There is no reason for us to change views on ETH as long as it is perfectly holding to the breakout from the 2017 high.
DOT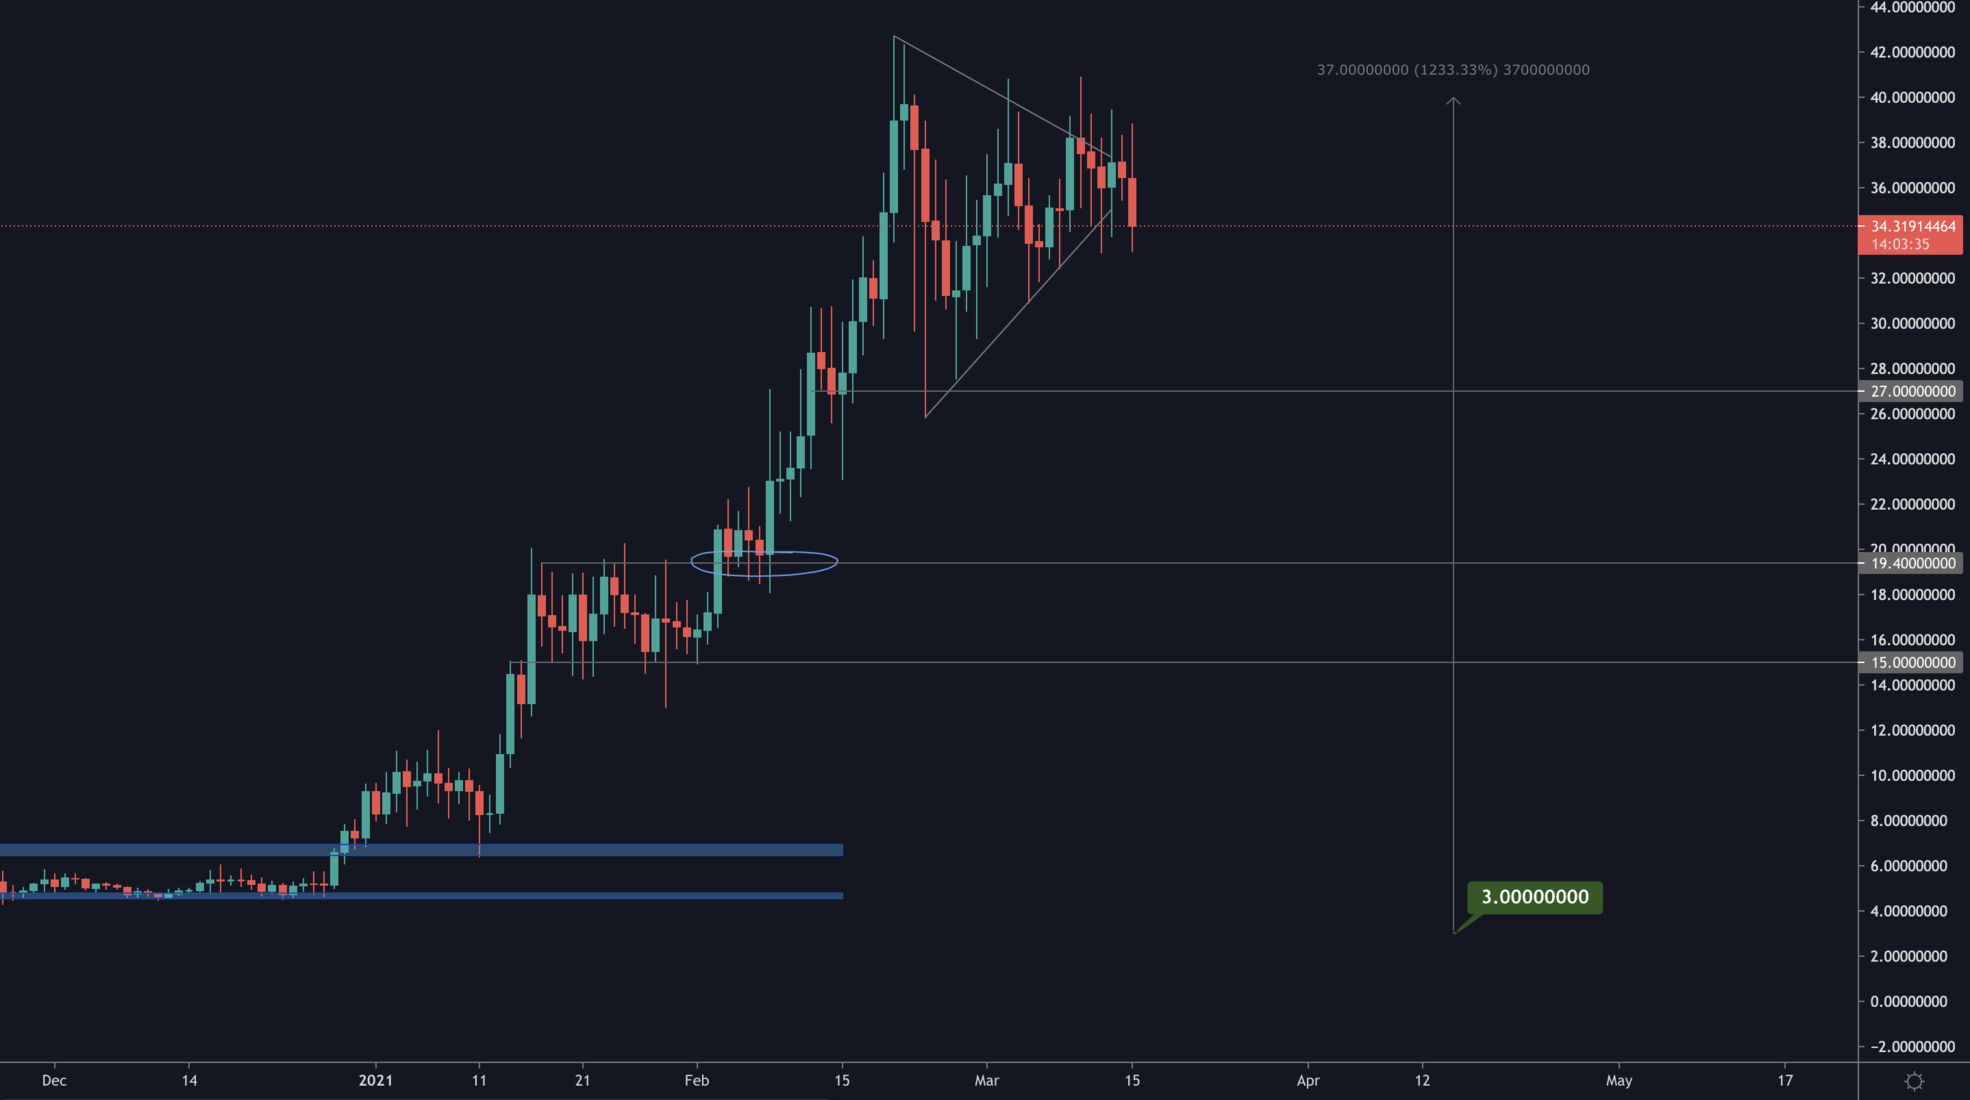
Depending on today's candle closure, we'll be able to judge the breakout. However, up until now it seems like DOT's price action is indicating a test of $27.
SNX
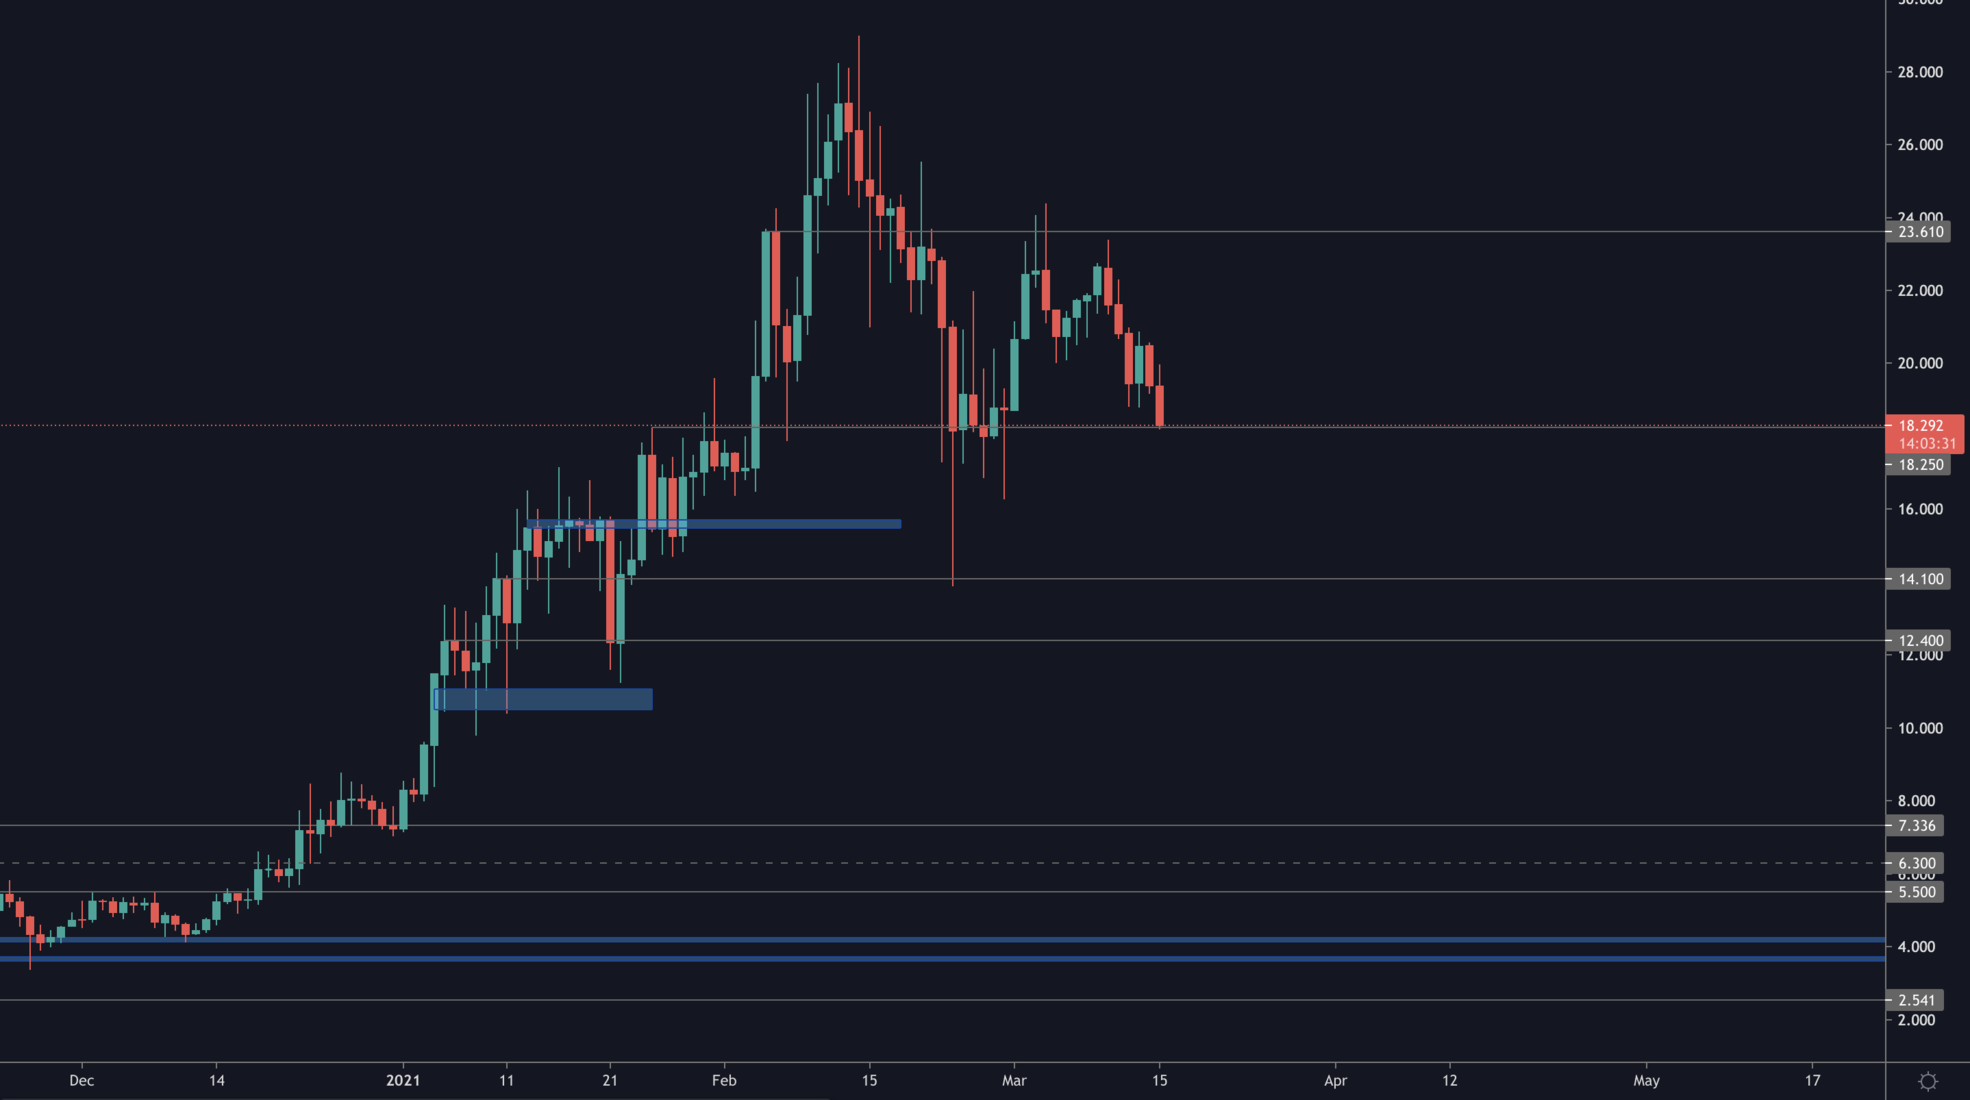
SNX has approached our longing level: $18.25 where we've opened a levered long with 50% of our desired position size as that strategy is great at reducing risk. We'll be opening the remainder of the position size should SNX flip $23.60 from resistance to support. Our invalidation is a daily closure under $18.25 - of course this is different from our investment in SNX which we've held since sub-$4.
RUNE
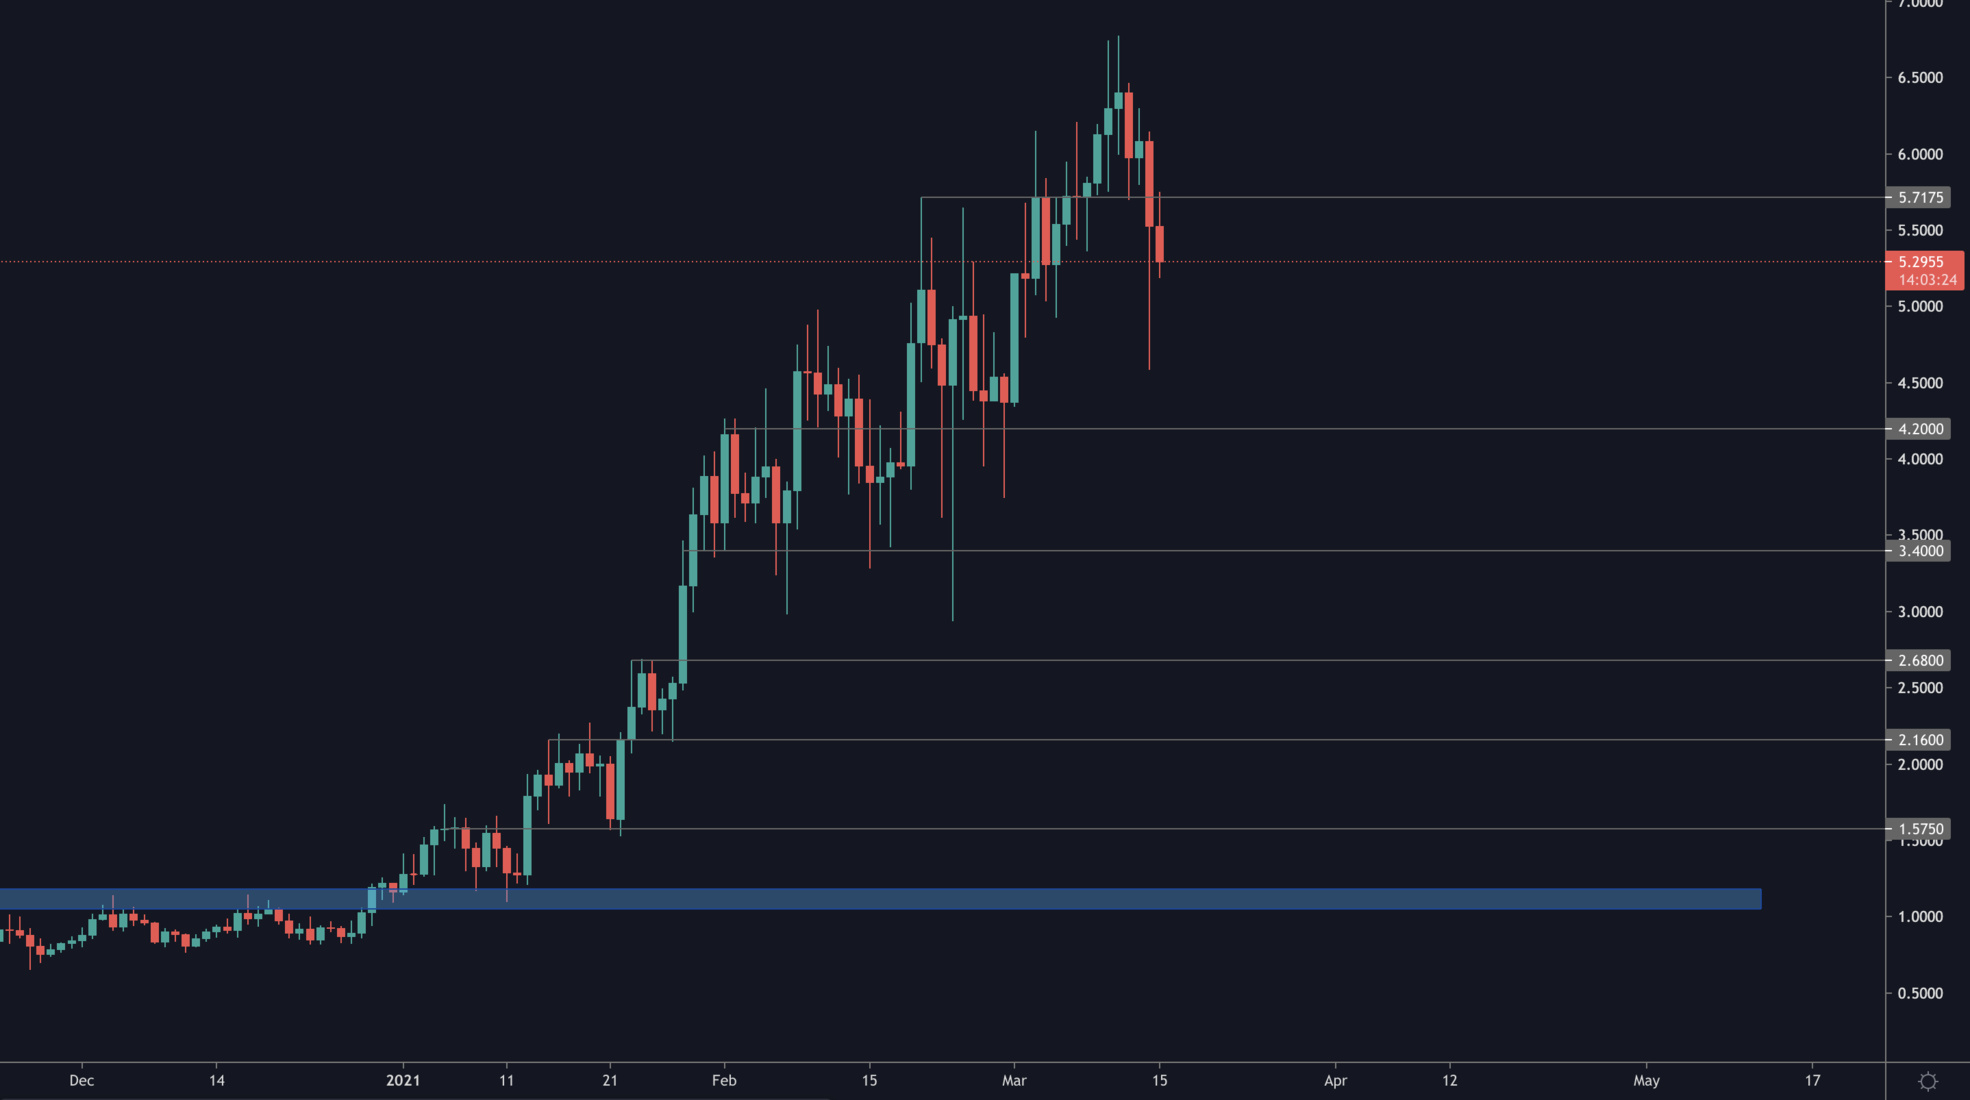
RUNE broke support yesterday which indicates a likely test of $4.20. That would only be invalidated by a daily reclaim of $5.77. DeFi Alts will have a turn after ETH.
FTT
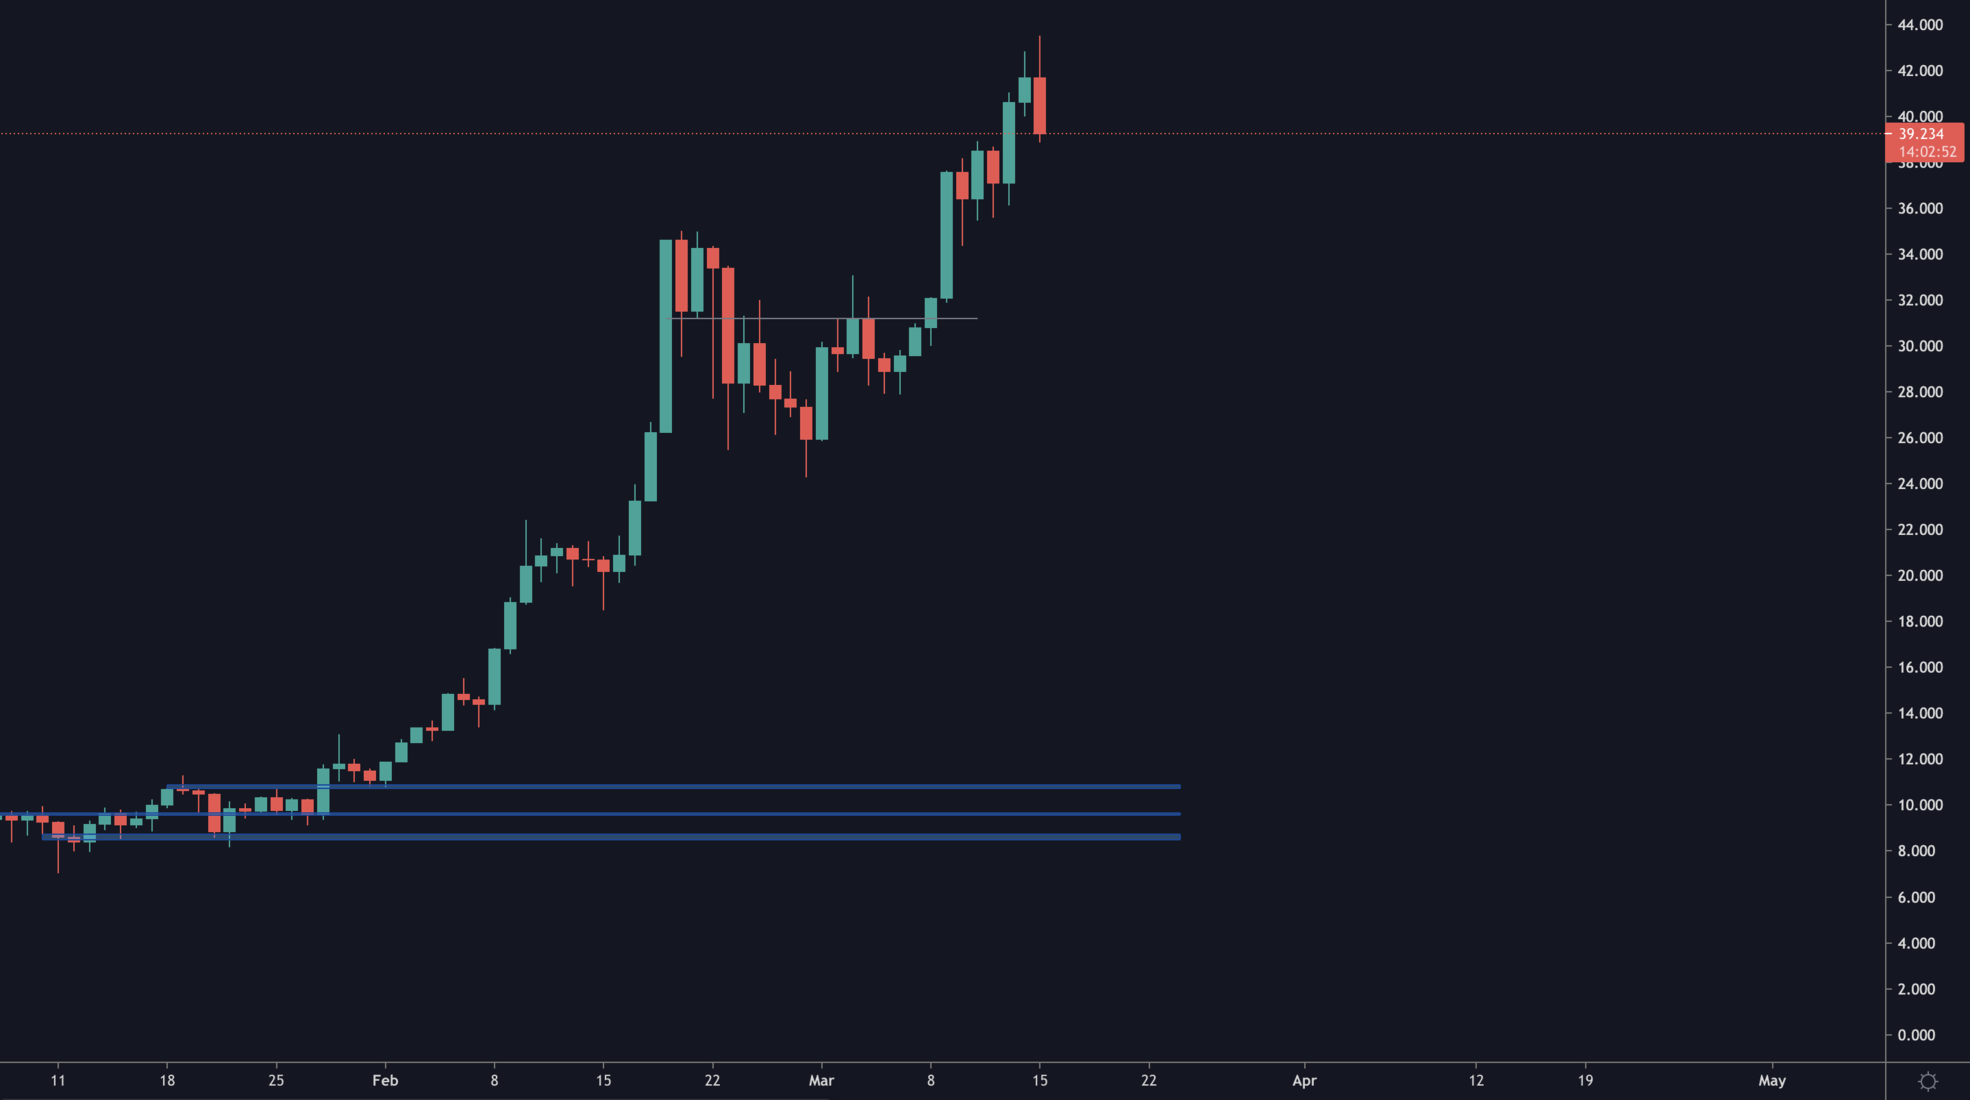
FTT went into big bull mode right after the daily close above $31.20. Through the rally, we have a plan of taking at least 25% profit at $100.
SRM
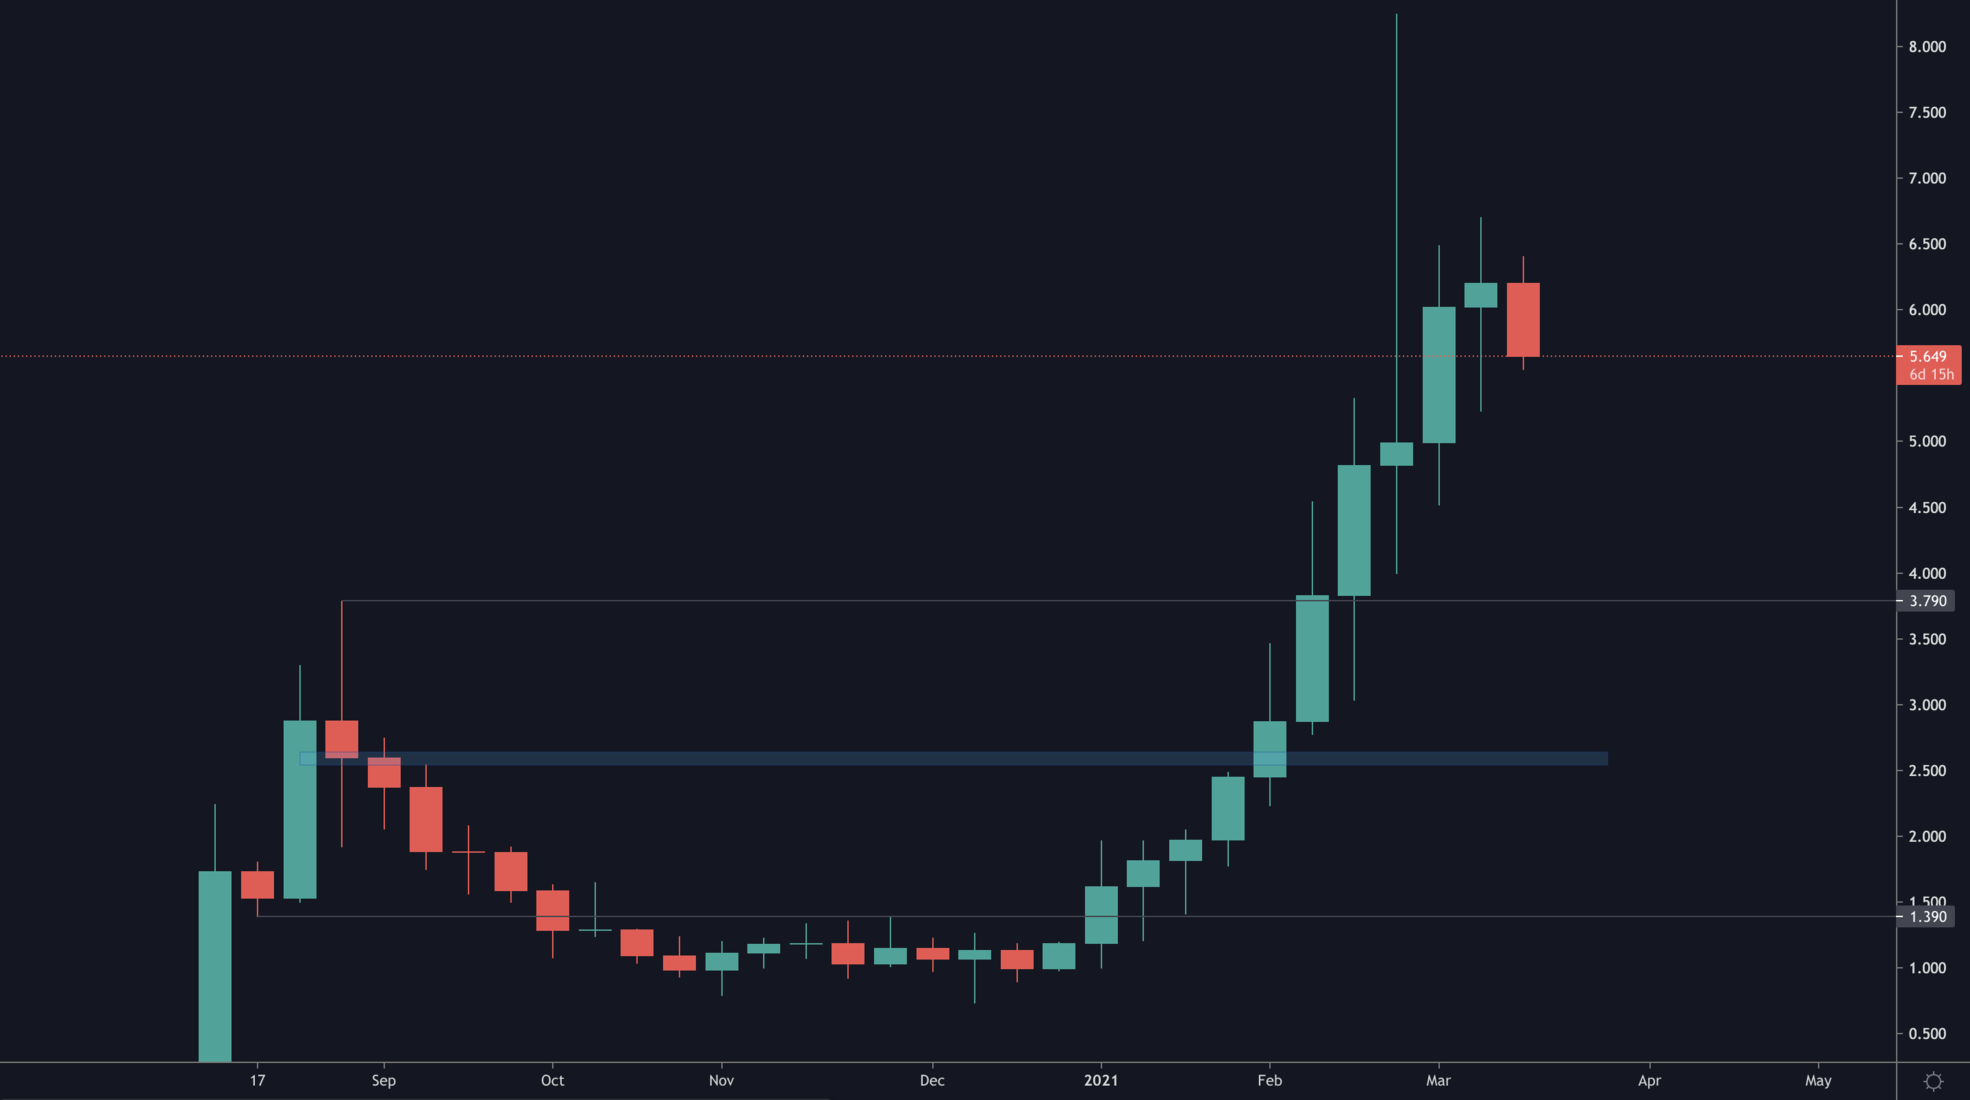
SRM's price action is quite messy to be swing traded. The perfect trade was longing the accumulation breakout from $1.40 which we continuously covered. We entered SRM at $0.80 and we're HODLing on to that position till $20. The short-term direction will get clearer at price action consolidates.
SOL
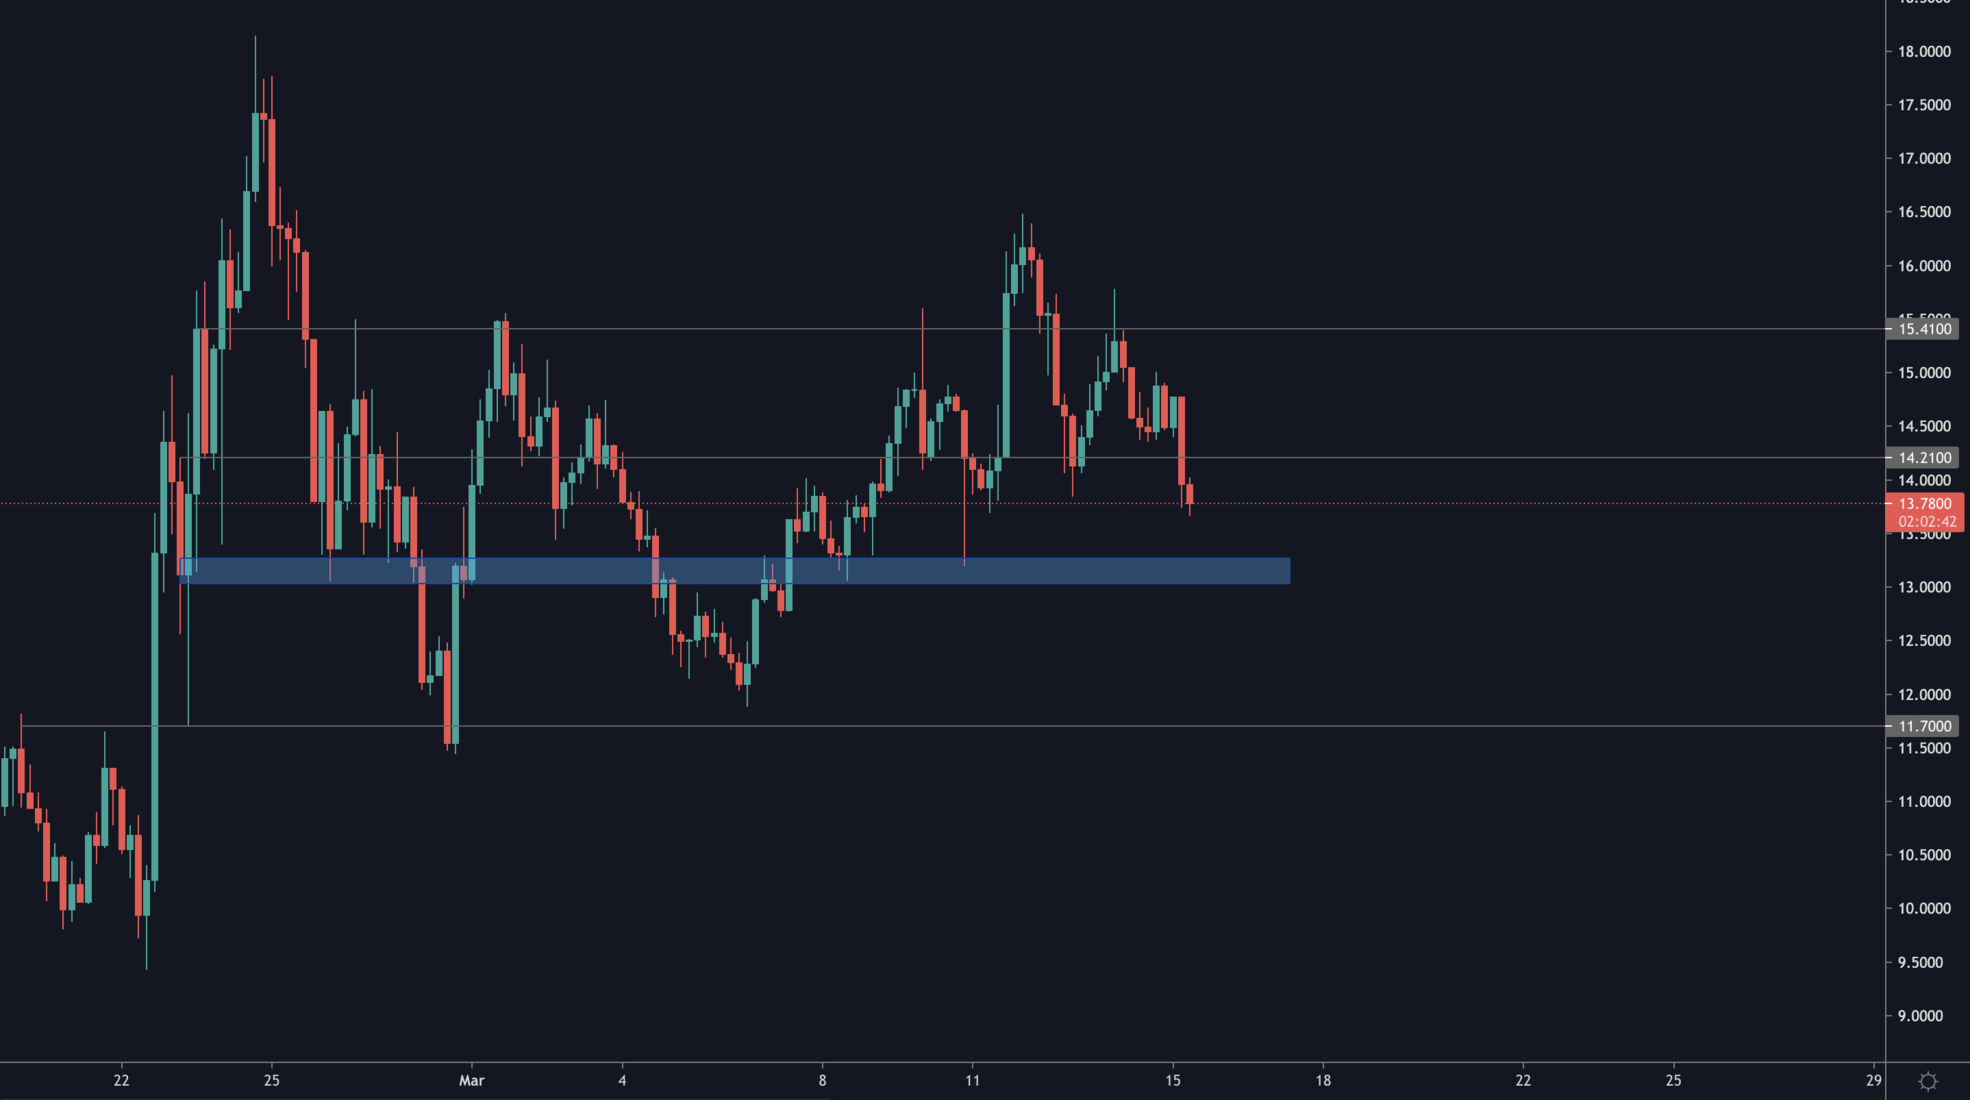
When we longed SOL at $10 we expected a certain demand to show up. It did but without large follow through, which is why we decided to take 40% of our position off at an average TP of $14.80 (+48% return). The remainder (60%) we are still holding but the derisking proved to be the right decision.
Right now, SOL's price action is communicating an incoming retest of the blue region (~$13).
XRP
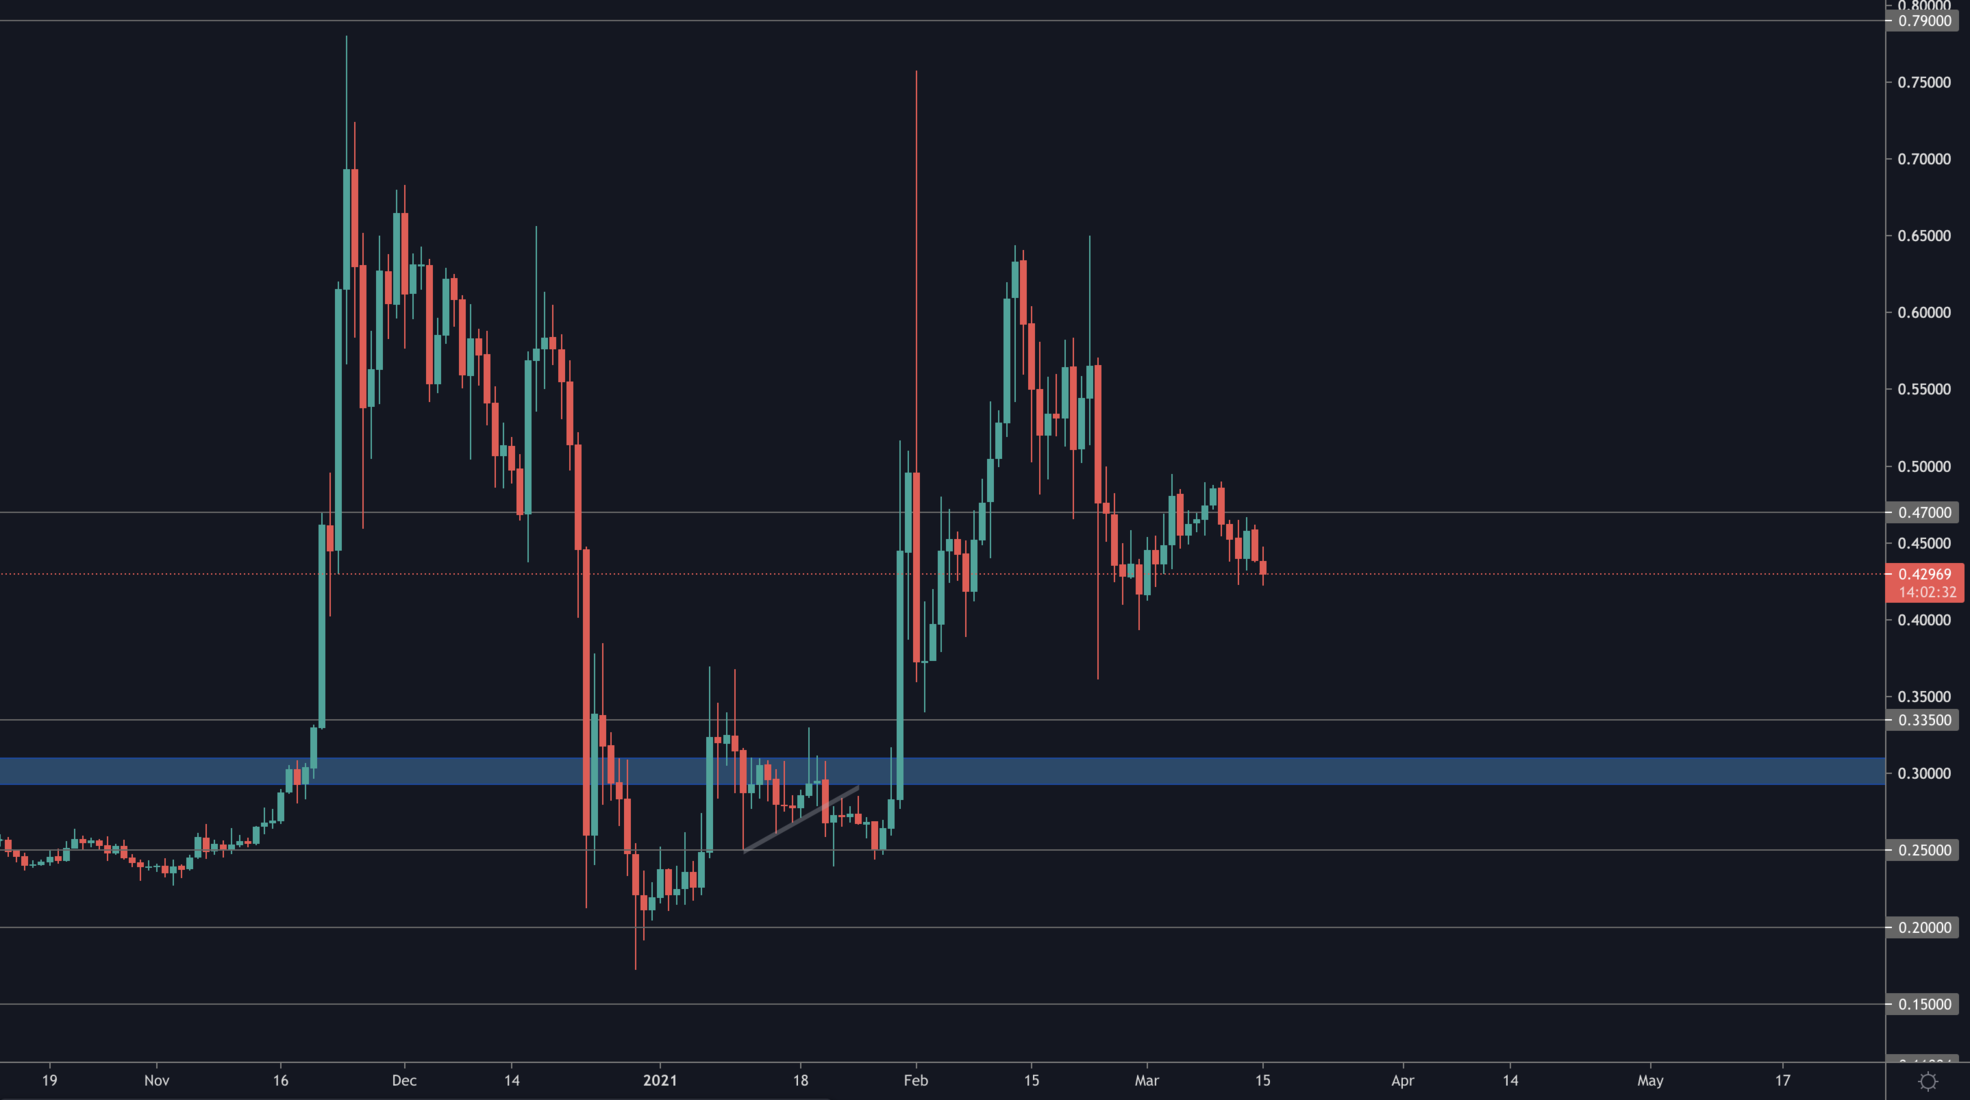
XRP has been mainly streamlining in the $0.40s and not doing much else. Unless XRP is able to reclaim $0.50, the head and shoulders formation may play out and send price to low $0.30s.
Disclaimer: NOT FINANCIAL NOR INVESTMENT ADVICE. Only you are responsible for any capital-related decisions you make and only you are accountable for the results.
Recommended from Cryptonary


