Save 23% ($351) & Get a Free 1-1 Call with our Team ⏰ : 0d 2h 59m 44s
Weekly Technicals Pro - Volume 53
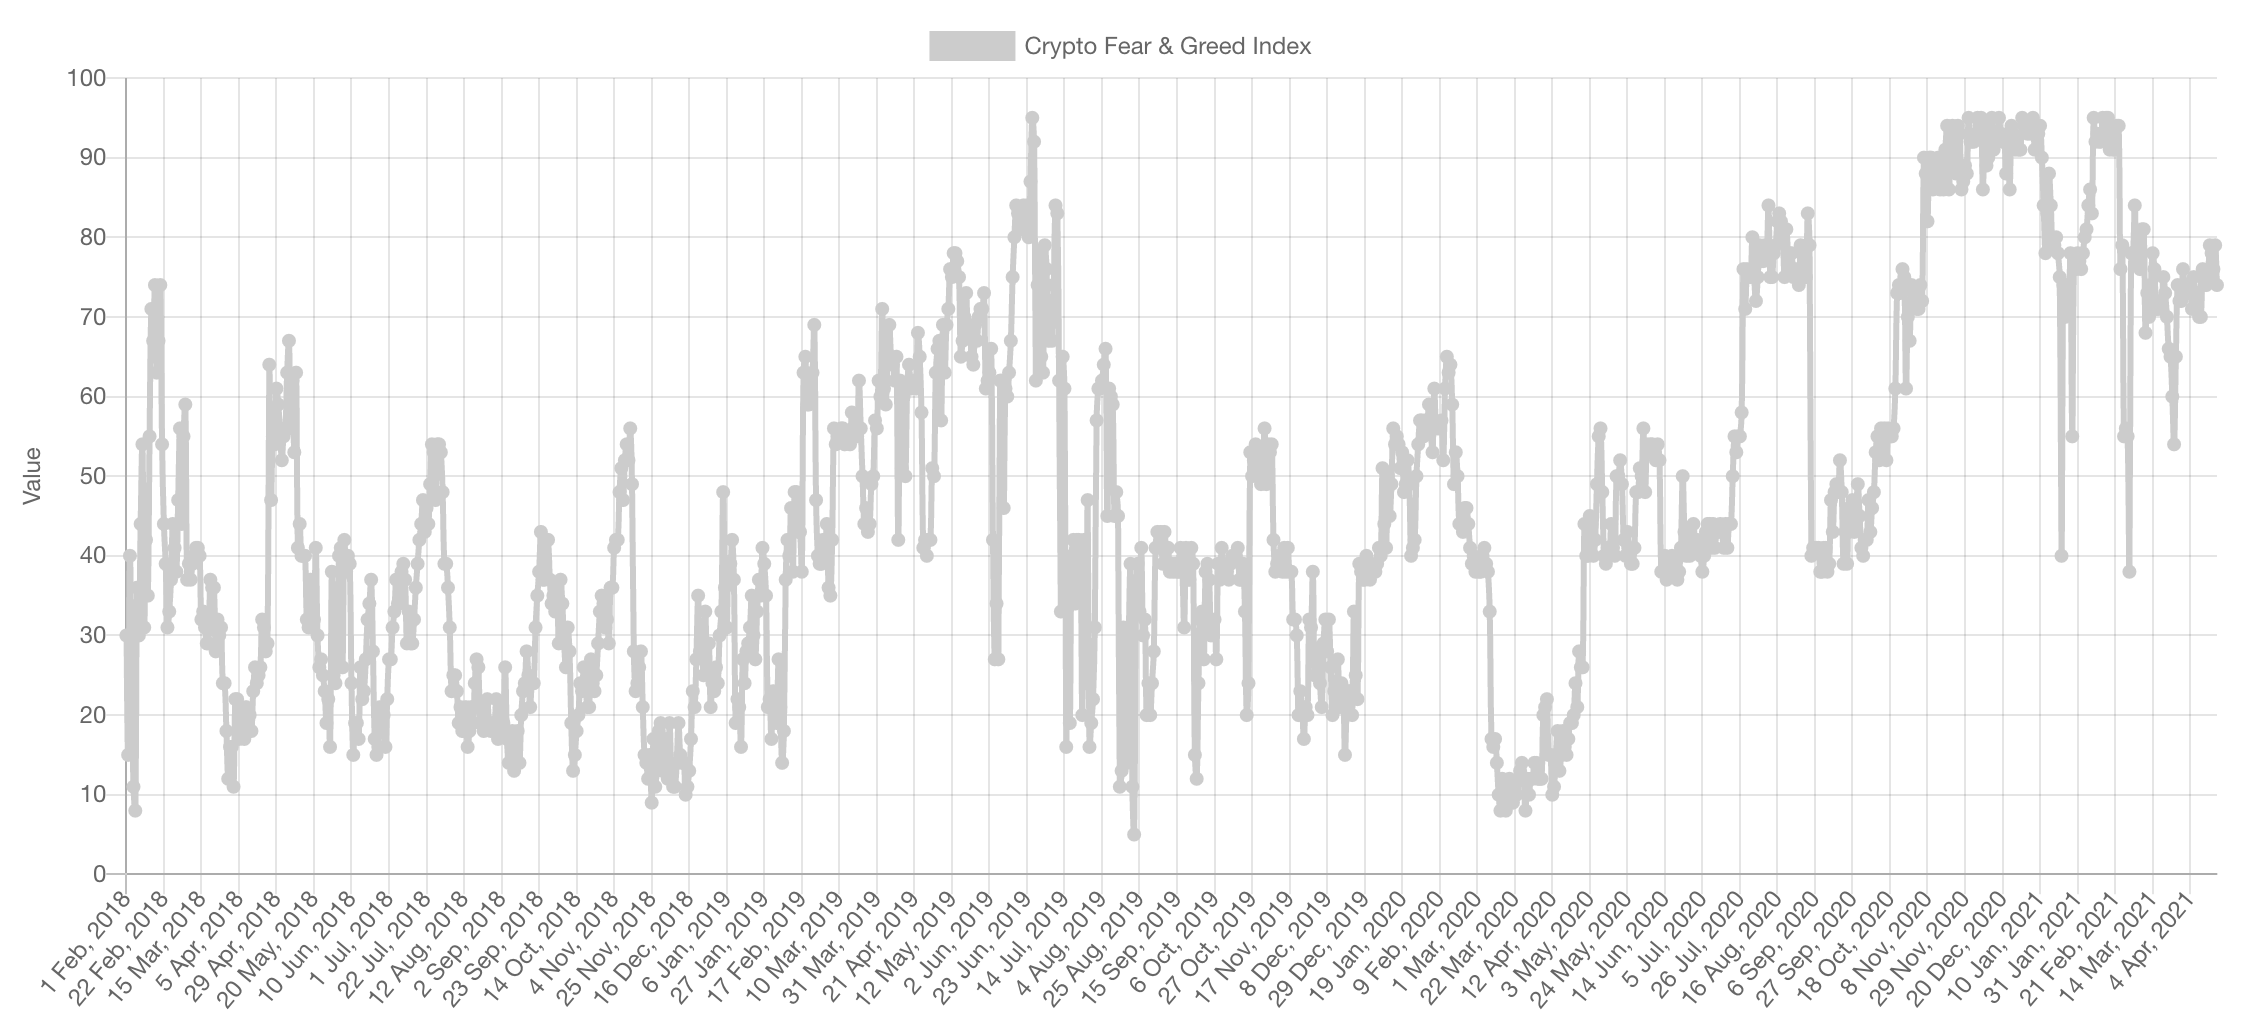
Sentiment has been very stable over the past few days and clustering around mid-levels of greed. Traders and investors are leaning bullish - natural given the market structure - but are not fully convinced. The fact that we're at mid-levels of greed with certain crypto-assets hitting all-time highs and ETH over $2,000 is indicative that the run still has more legs before exhaustion.

Market Sentiment
Market Indexes
Total Market Cap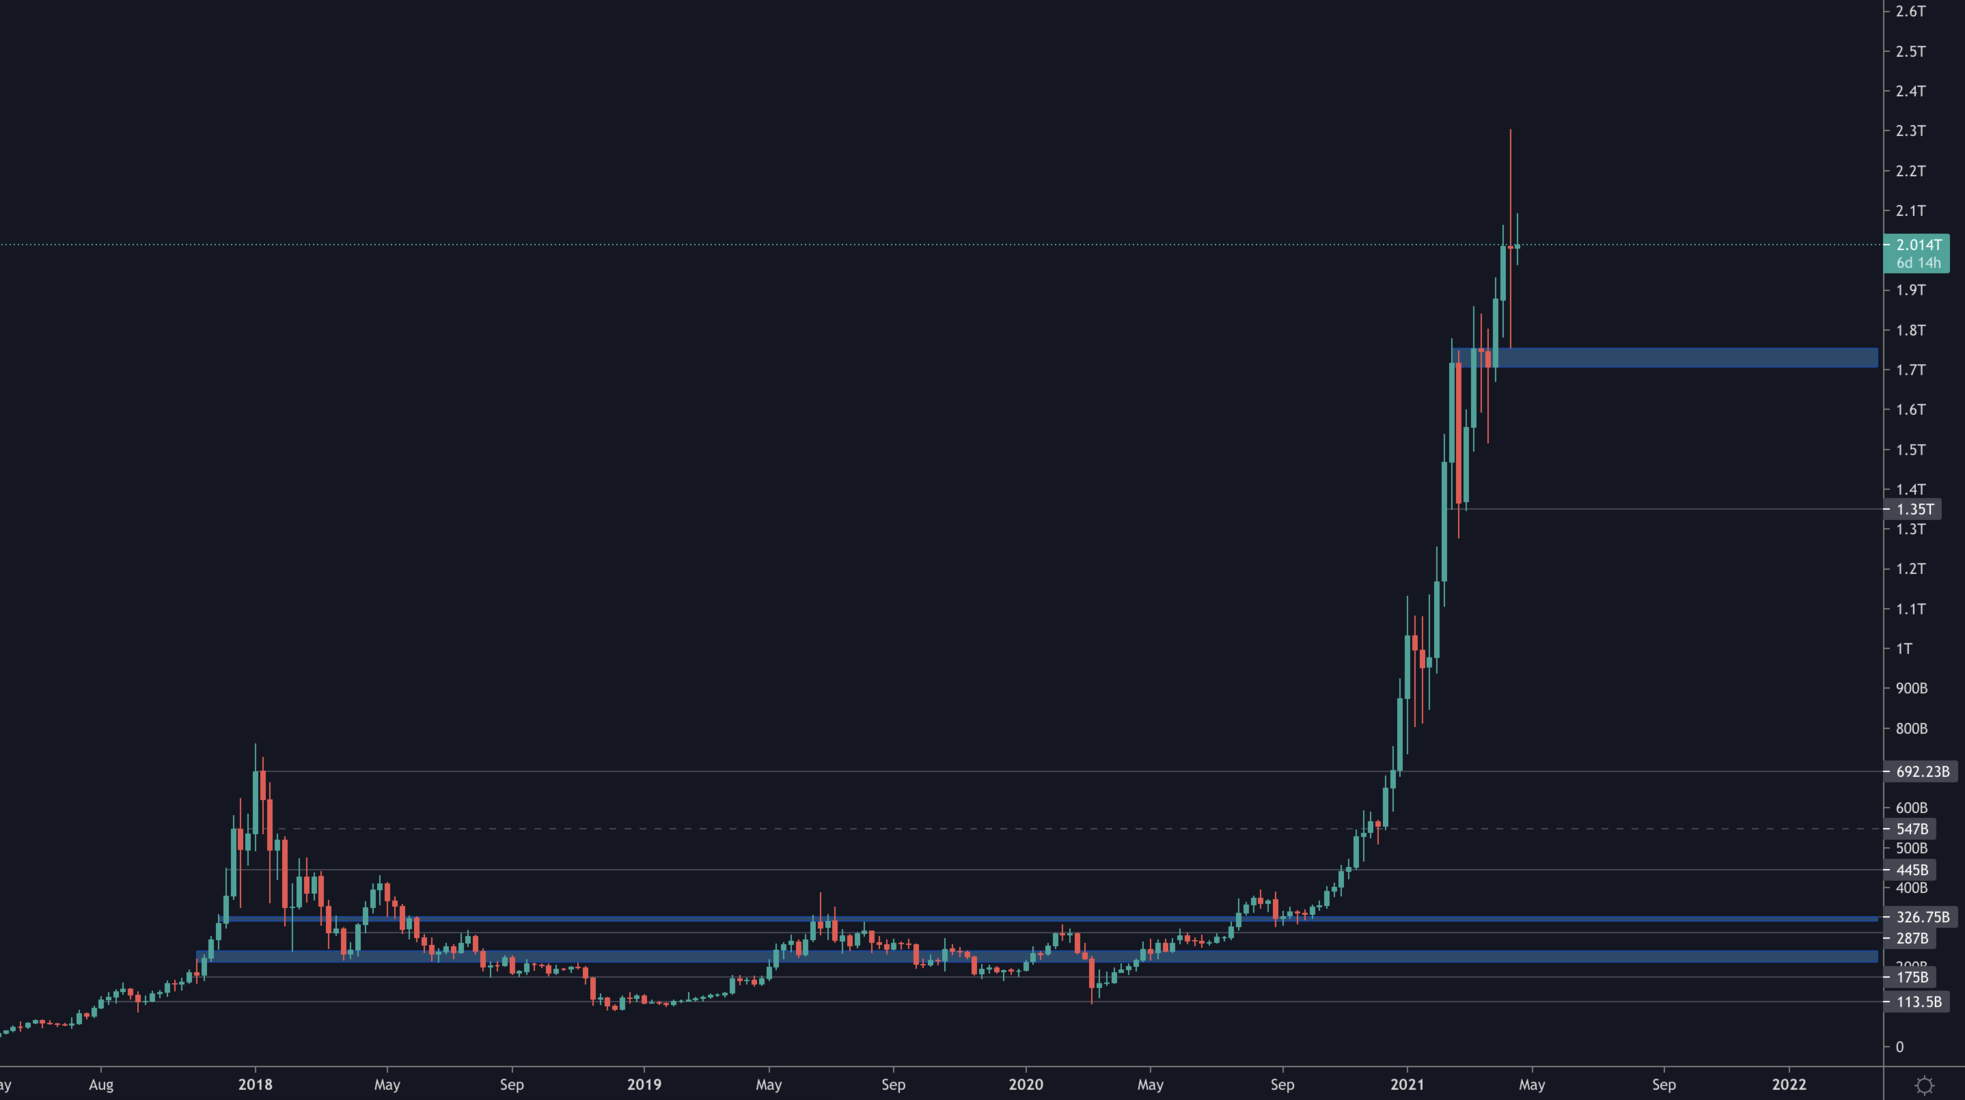
The Total MCap is our main gauge for the market and precedes individual charts in our overall bias-building process. The flash crash yesterday, triggered by false news about the U.S. Treasury charging several financial institutions with money laundering via crypto, brought down prices to the $1.75 Trillion area of support.
Overall, we can state the Total MCap remains in a bullish market structure with the creation of higher highs and higher lows. Unless the $1.75T area of support breaks, we see prices going further into the $2T+ and $3T territory this quarter.
Altcoins Market Cap
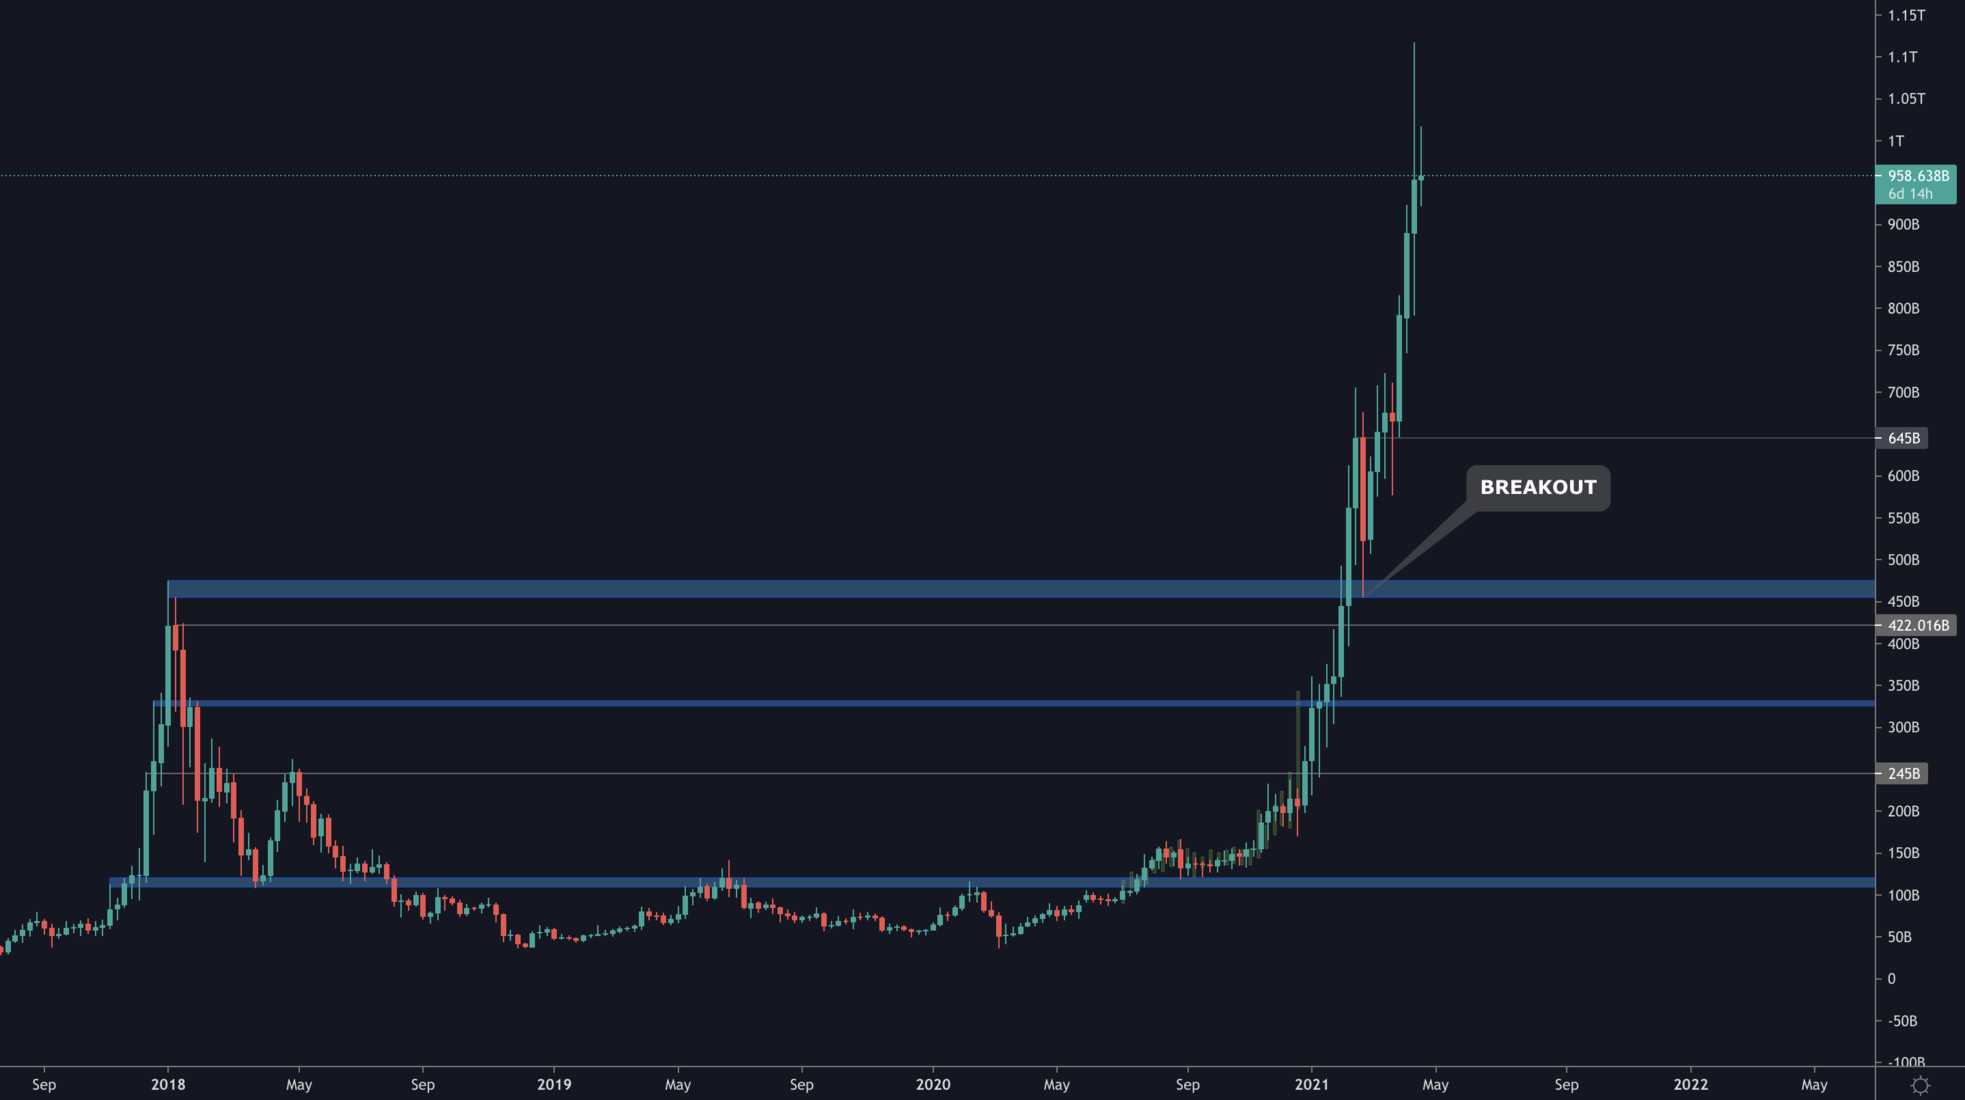
When the Alts MCap broke above $110B, we stated continuously that this was a break that will lead prices to reach ATH again (YouTube video here). When the Alts MCap broke above the high set in 2017, we also continuously stated that this most definitely was not a breakout we would ever fade as it is going to lead to $1T.
Update: It did.
Bitcoin
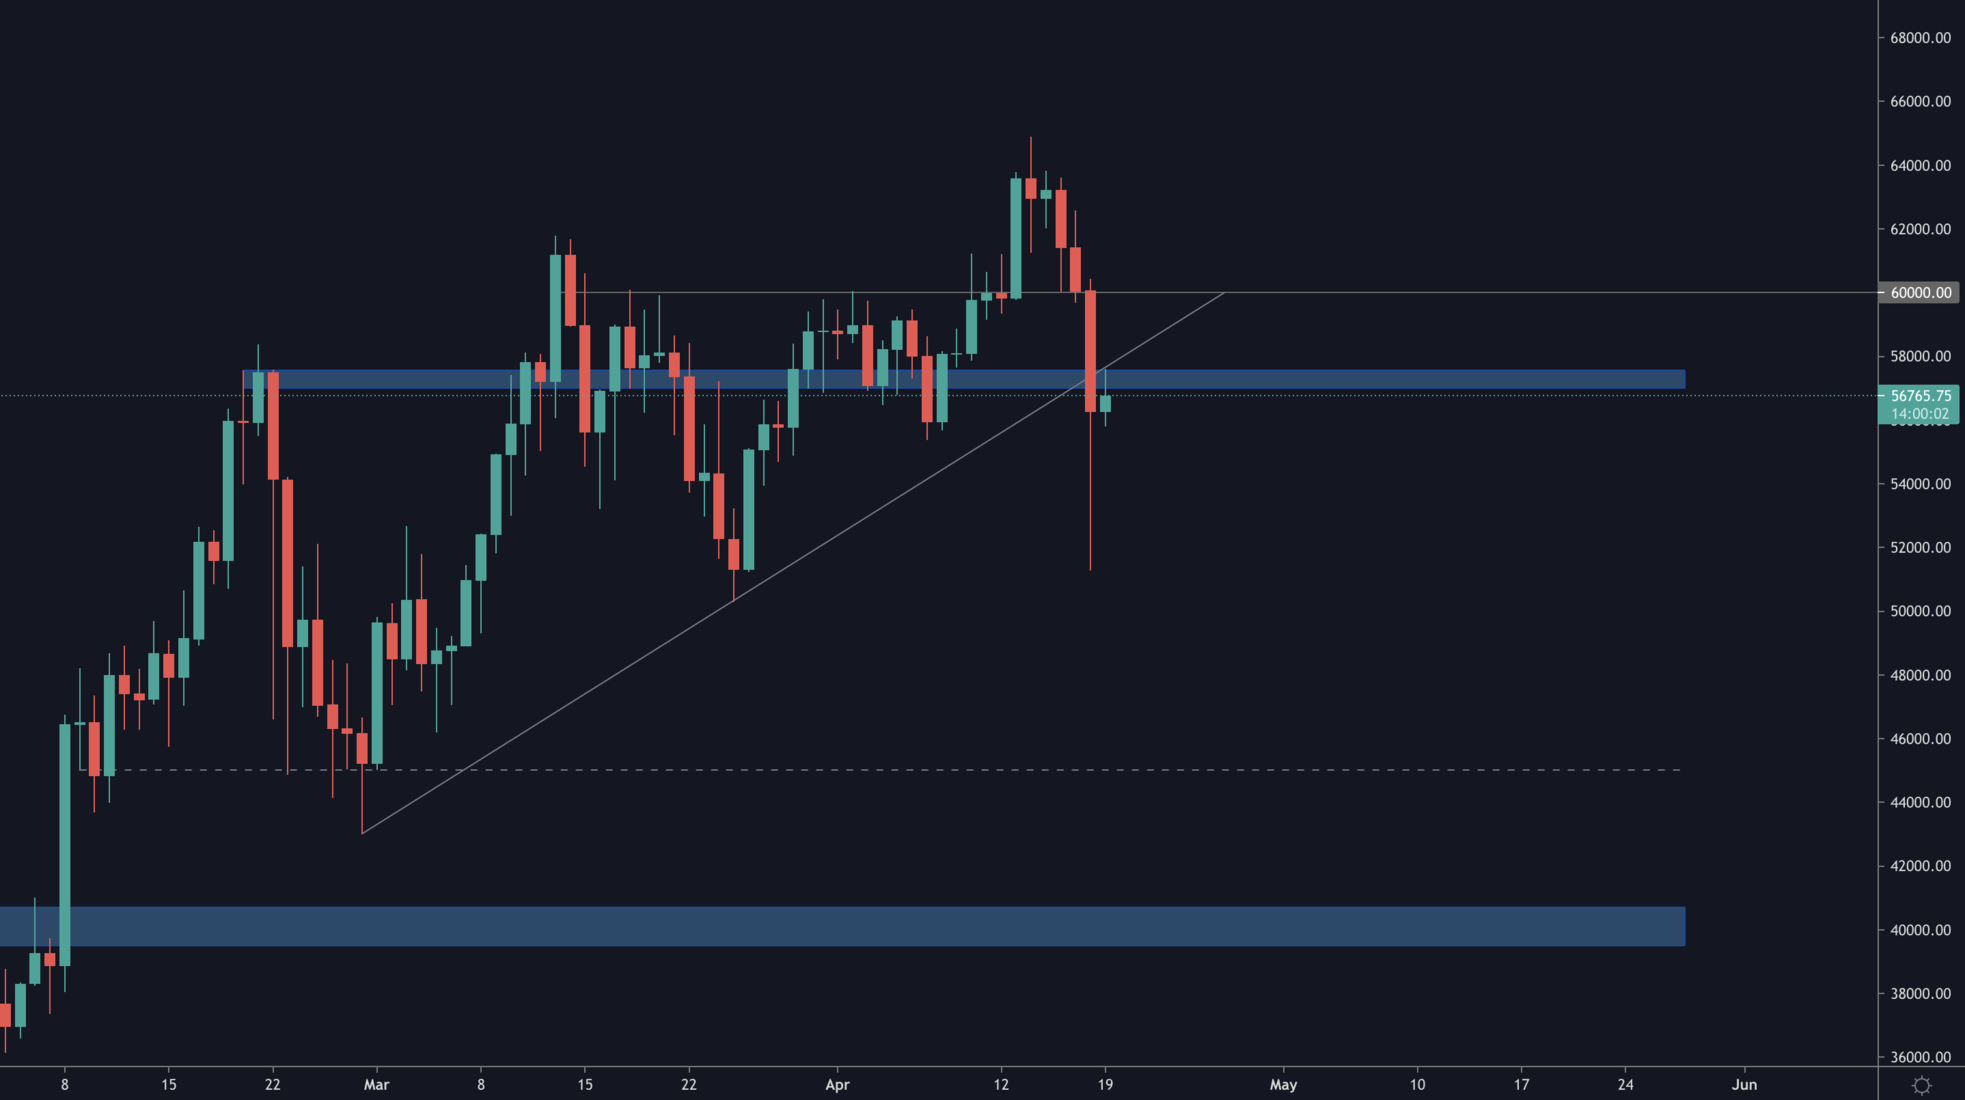
BTC's price action was hurt the most by the flash crash yesterday as it led price to break through the supporting trendline as well as the $57,000 area of support. Unless the latter is reclaimed, BTC has good odds of revisiting $52,000 again.
Ether
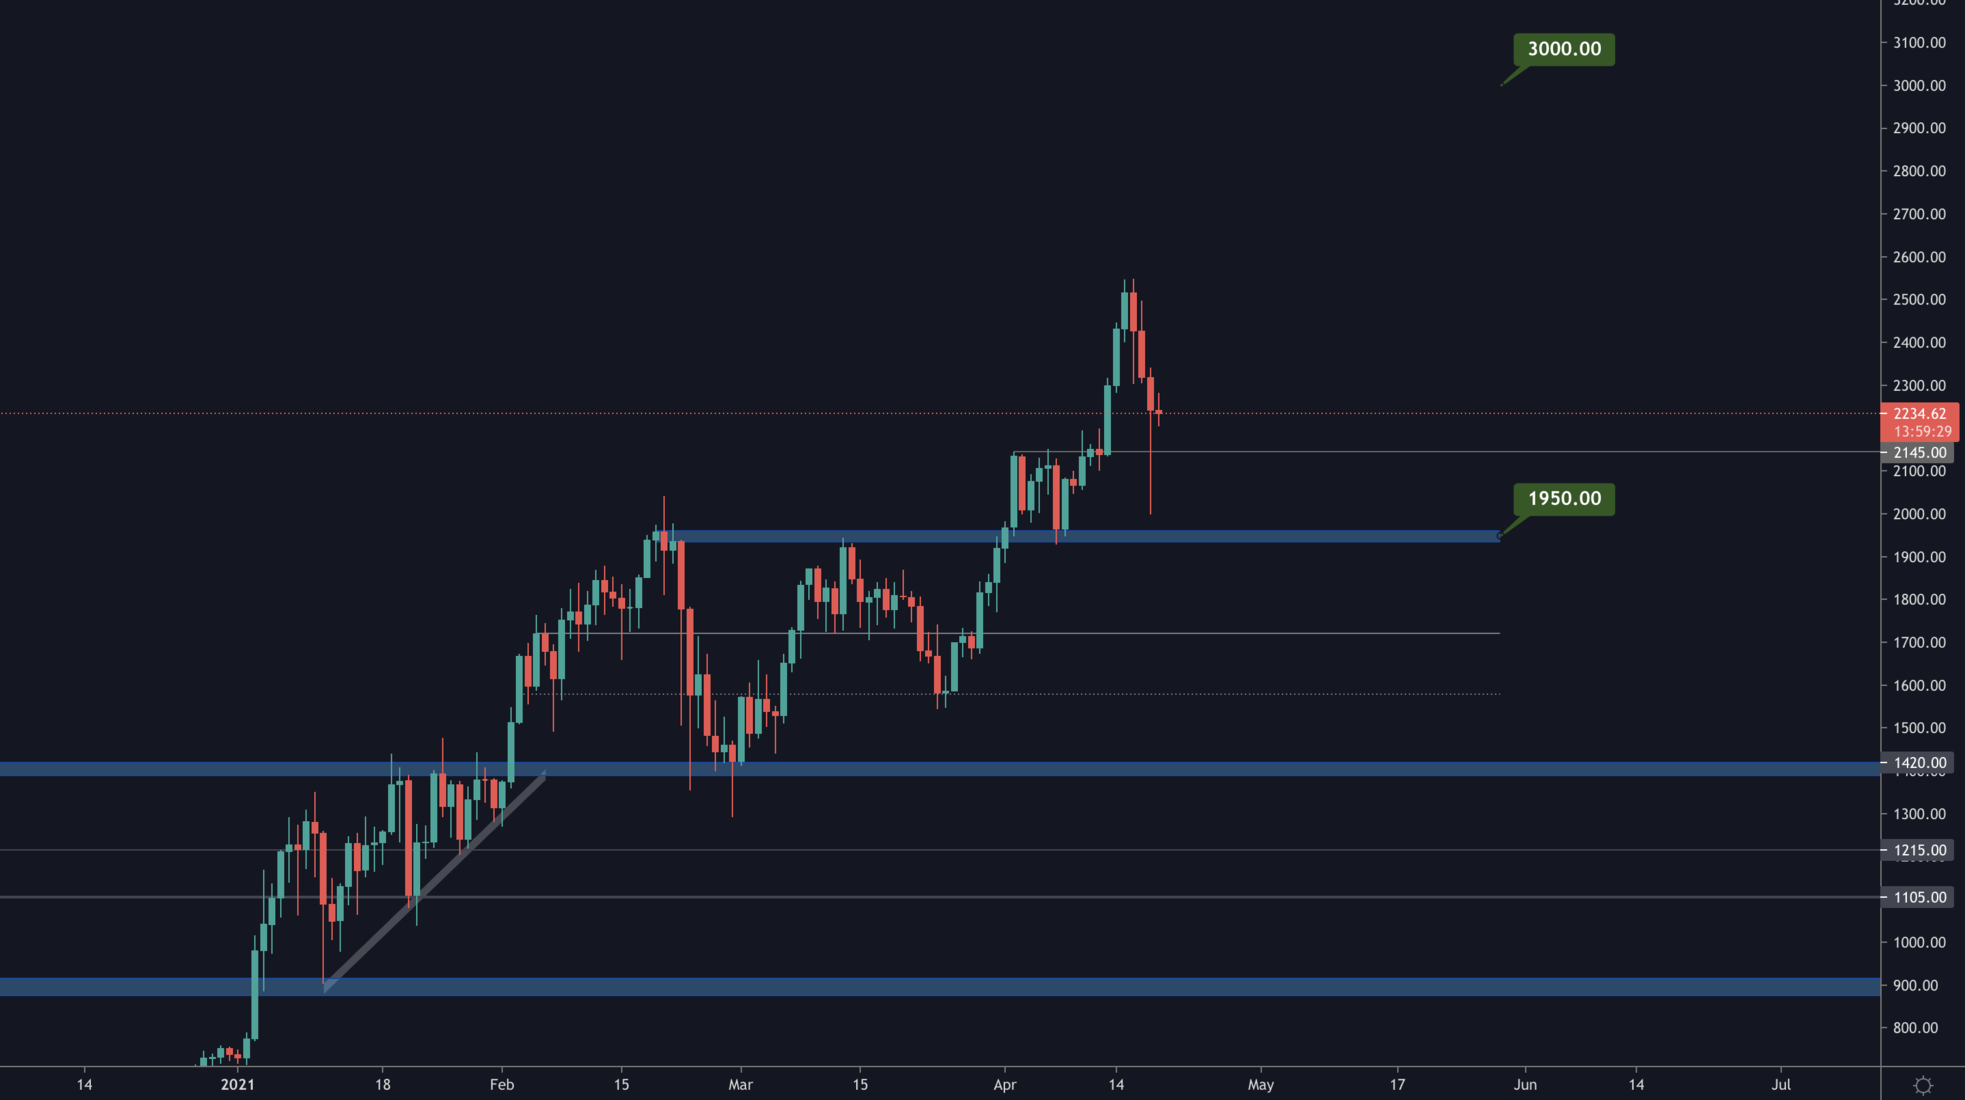
Flash crash or not, buyers stepped in heavy on ETH at $2,000 and set the bottom. In fact, looking at the orderbooks yesterday, Coinbase buyers piled in thousands of ETH buy orders from $2,000 to $1,800 in steps of $50. The move has likely instilled panic amongst many new market participants which may lead to another, less aggressive, push down towards $2,145. However, we do expect ETH to recover its losses in the upcoming weeks and reach our $3,000 target this quarter.
Our swing long from $1,430 remains fully open.
DOT
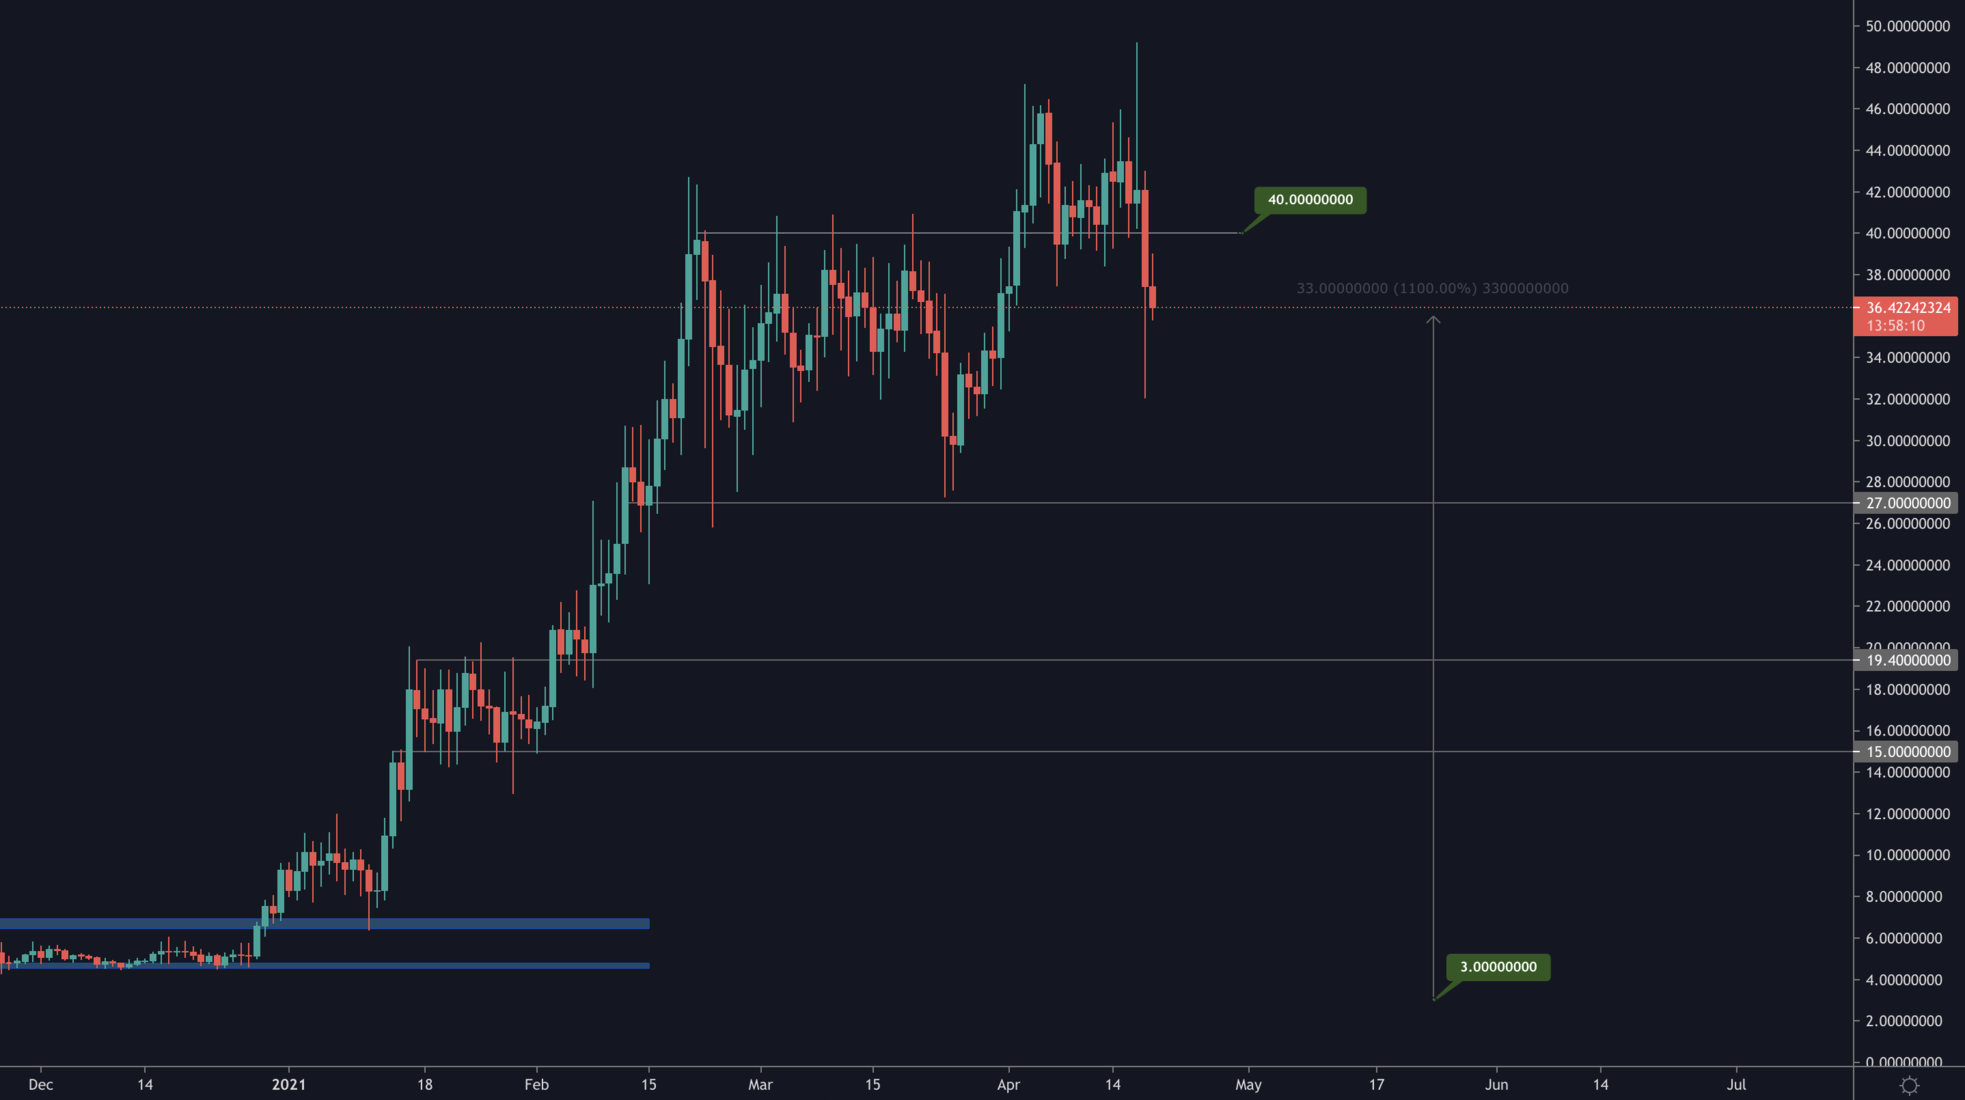
DOT broke $40 with conviction on the daily timeframe, unless price is able to reclaim that level, DOT is likely to revisit $27.
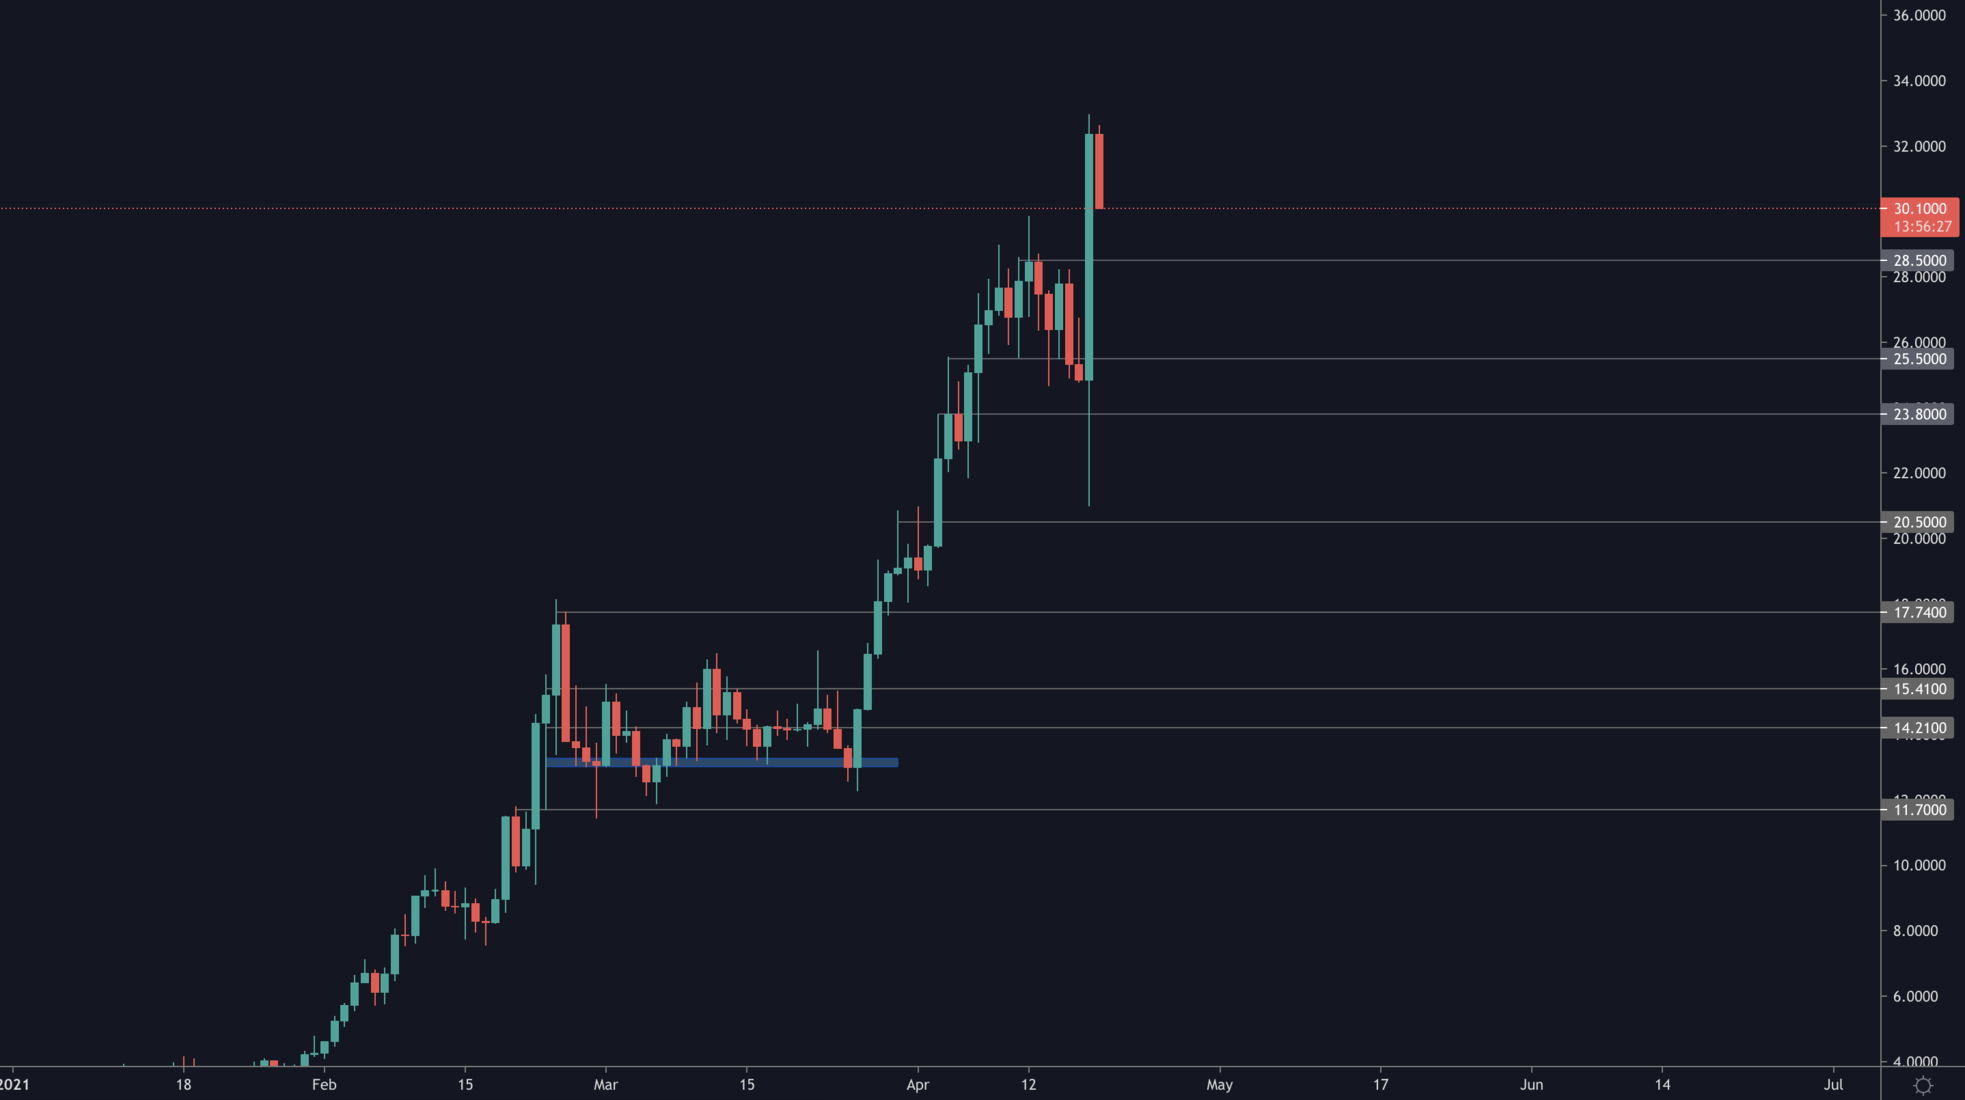
SNX

Reasonable demand stepped in on low priced SNX yesterday but we cannot ignore the fact that it closed a daily candle under $18.25. Once again, reclaim or revisit $14.10.
RUNE
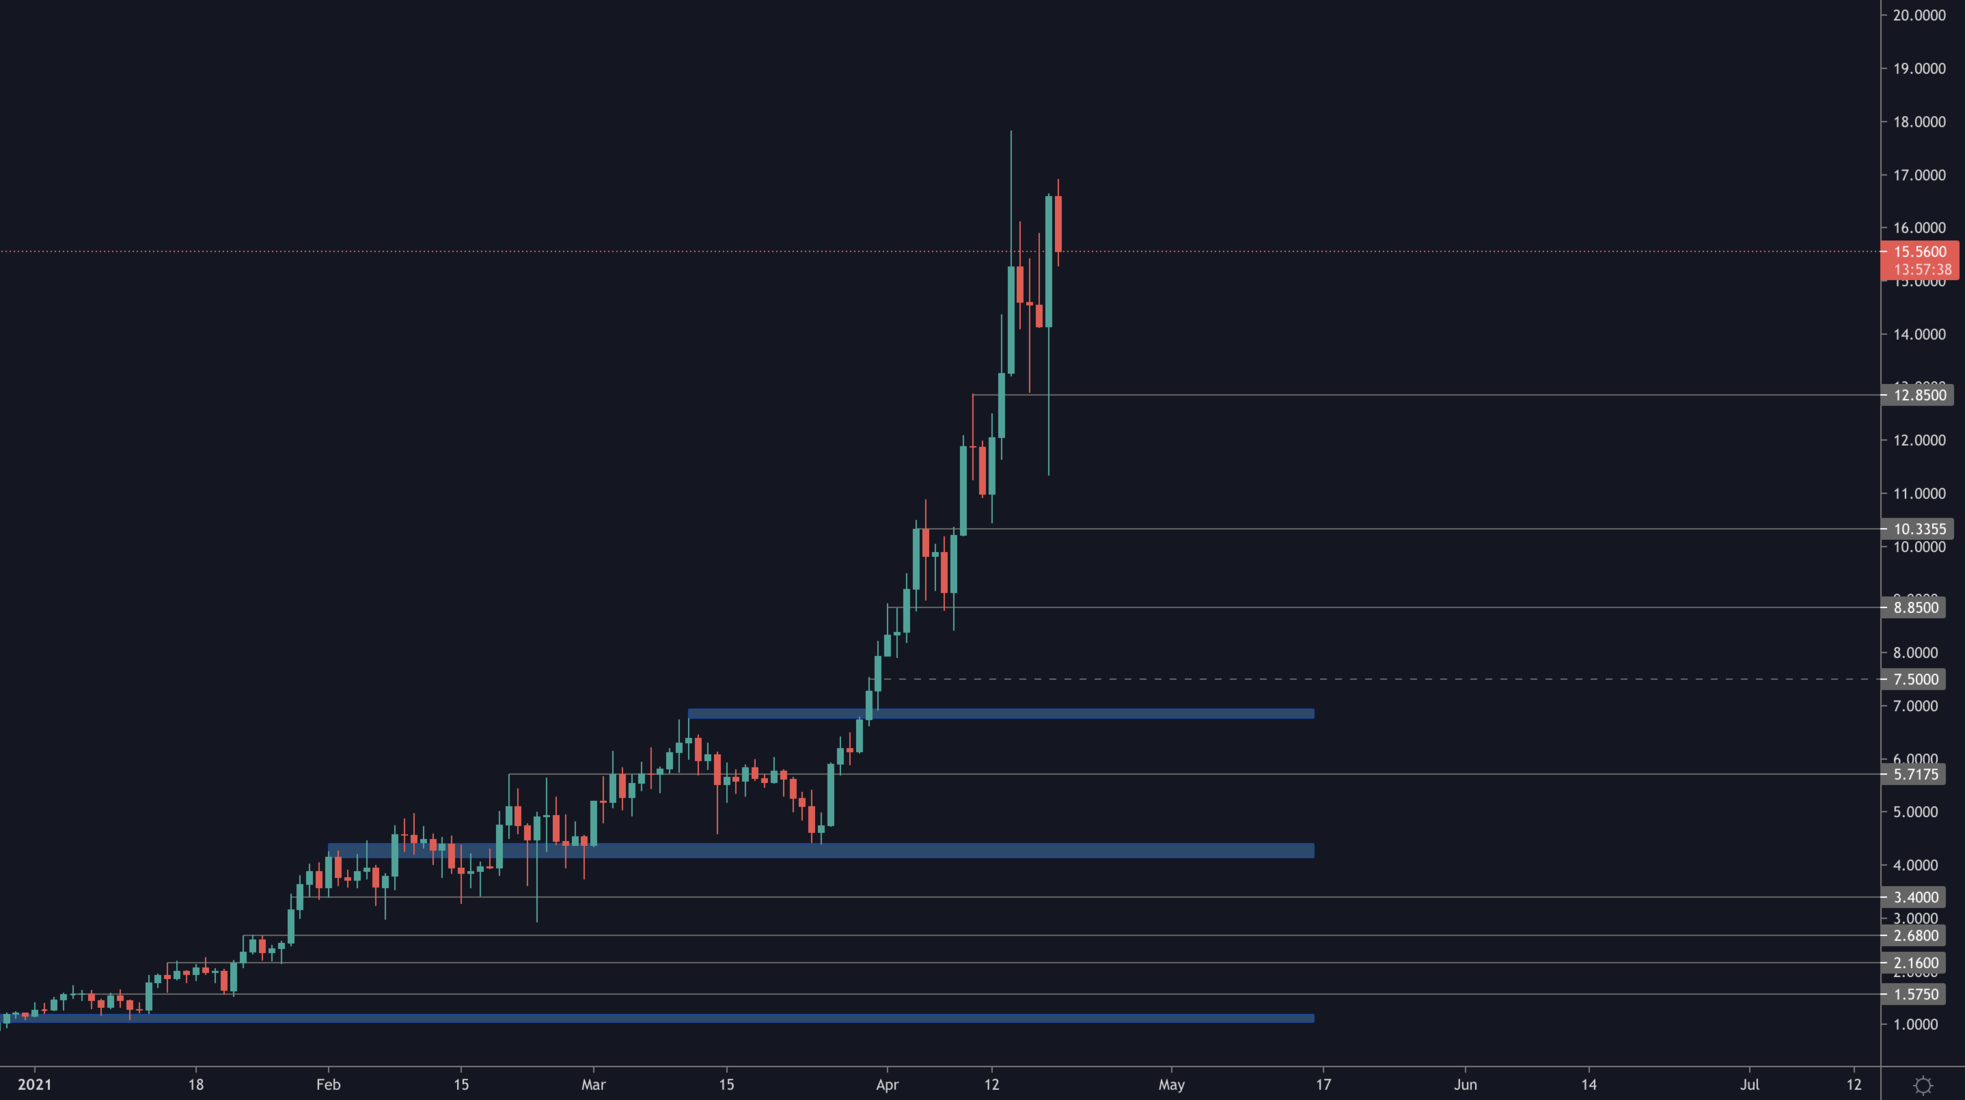
RUNE showcase what true demand was yesterday. Over the last few days, market participants had expressed (through price) that they believed $15 to be a fair price for RUNE. This was seen via strong demand under $15 and supply over it. A flash crash day was turned into a +17% day for RUNE with that demand. It also led price to create a new high amongst daily candles and turn the previous high ($15.30) into support.
FTT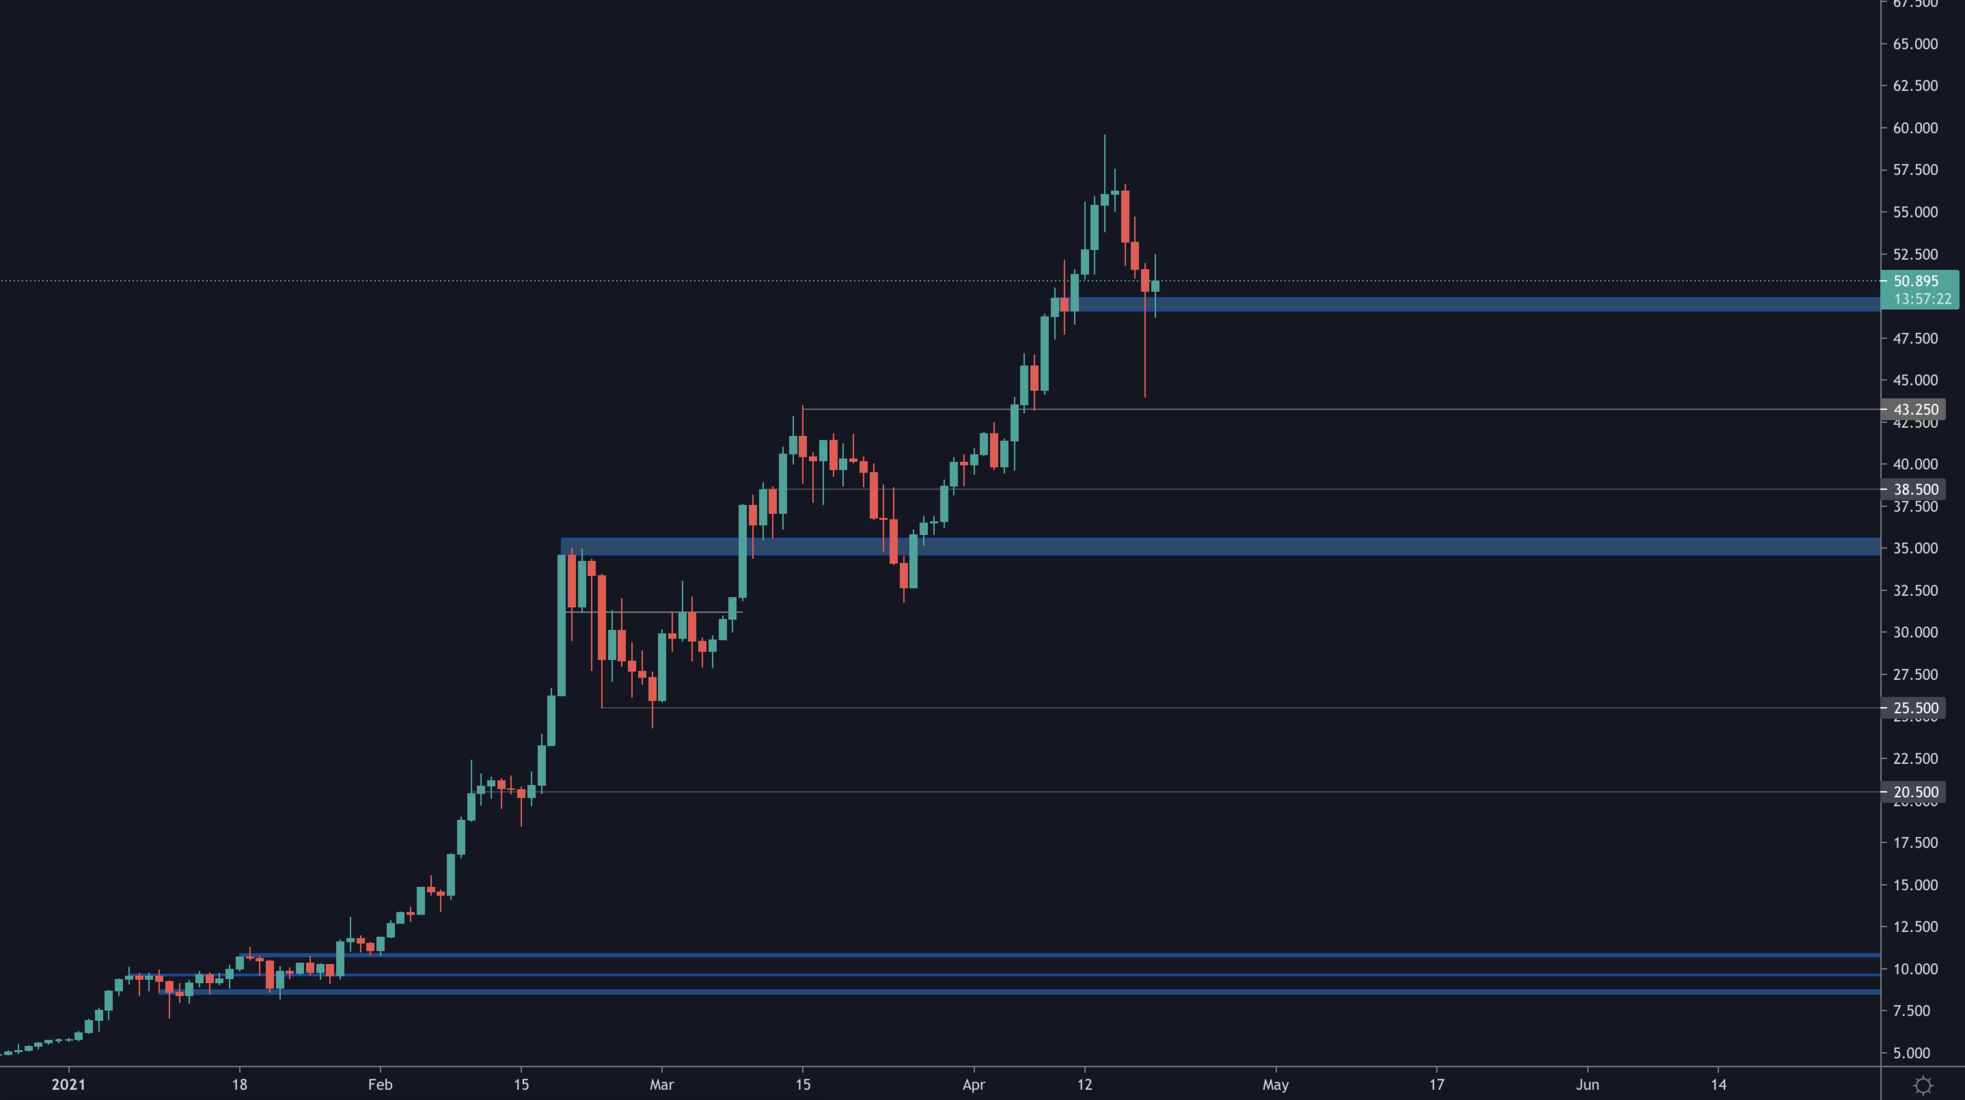
Exchange tokens benefit directly from large transactional volumes and flash crash day was no exception. This is what pushed buyers to step in and get price back above $50 - which stands as support. This has furthered our conviction in FTT reaching $100.
SOL
Flash crash? SOL pulled a +30% day and outperformed the entire market while setting a new all-time high. Support now sits at $28.50 for SOL.
SRM
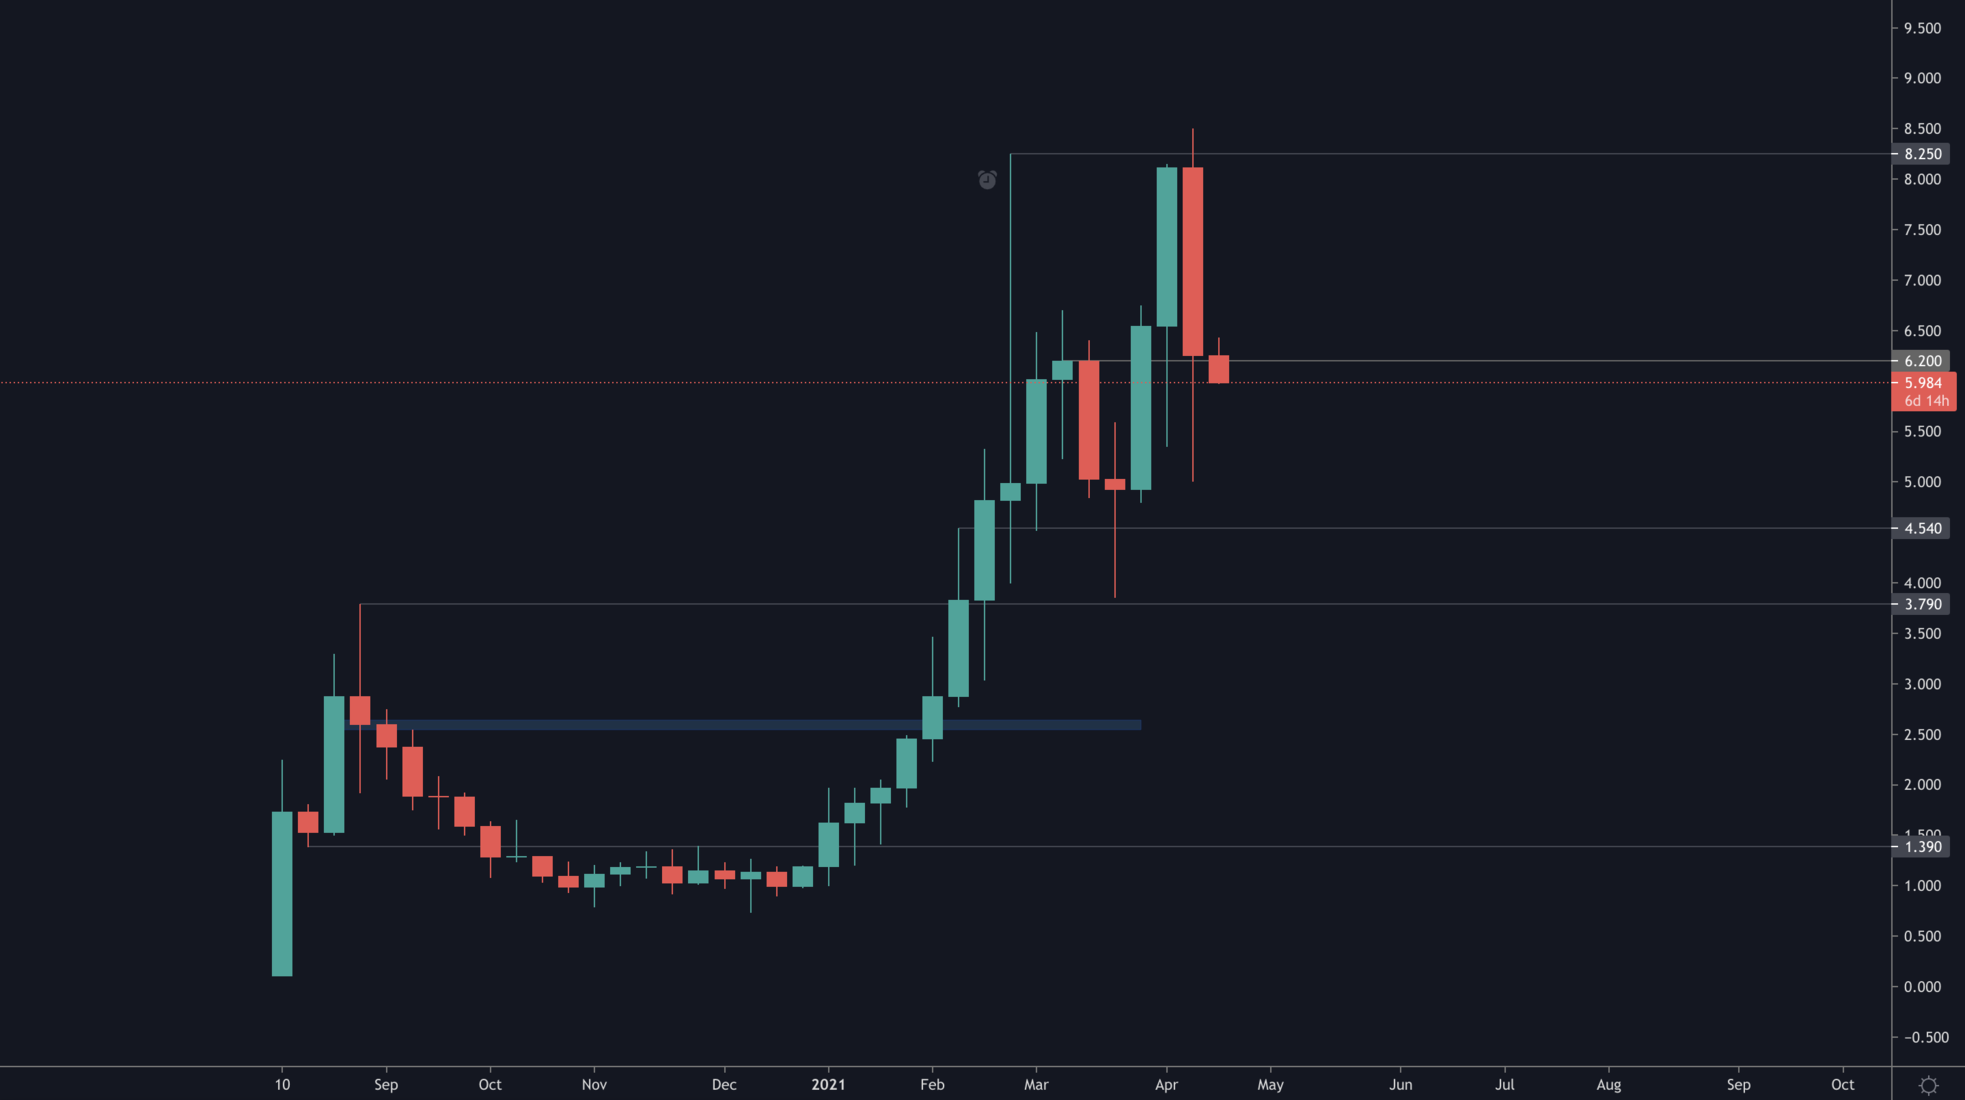
The weekly timeframe is respecting the bullish market structure but the daily one has not. This means it's likely we see SRM dip towards $4.55 on an intra-week basis, unless $6.45 is reclaimed on the 1D TF (1 Day TimeFrame).
OXY
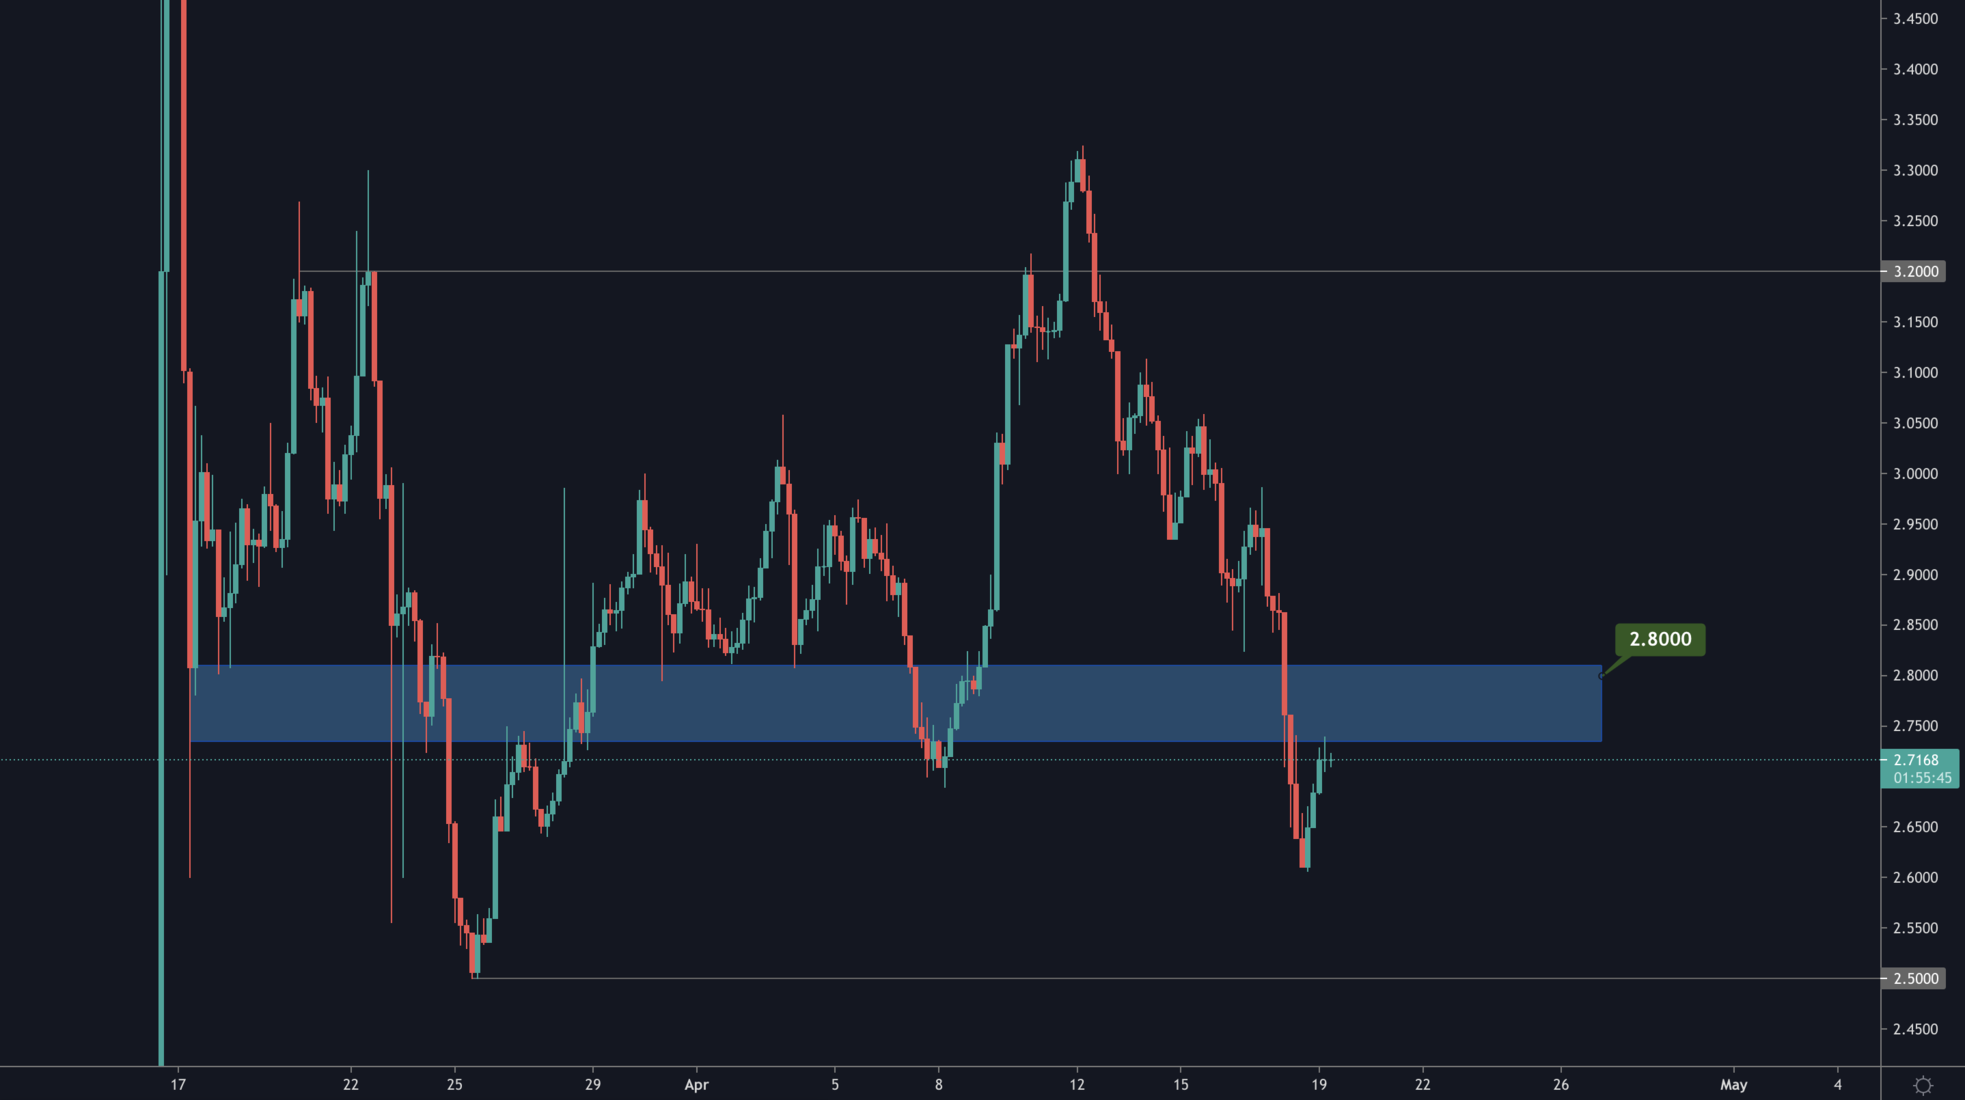
OXY's price action is very indecisive. However, given the fact that it's not getting devalued at a fast-pace even after a massively successful IEO leads us to believe OXY is in an accumulation phase and a break of $4 would signal the end of it.
XRP
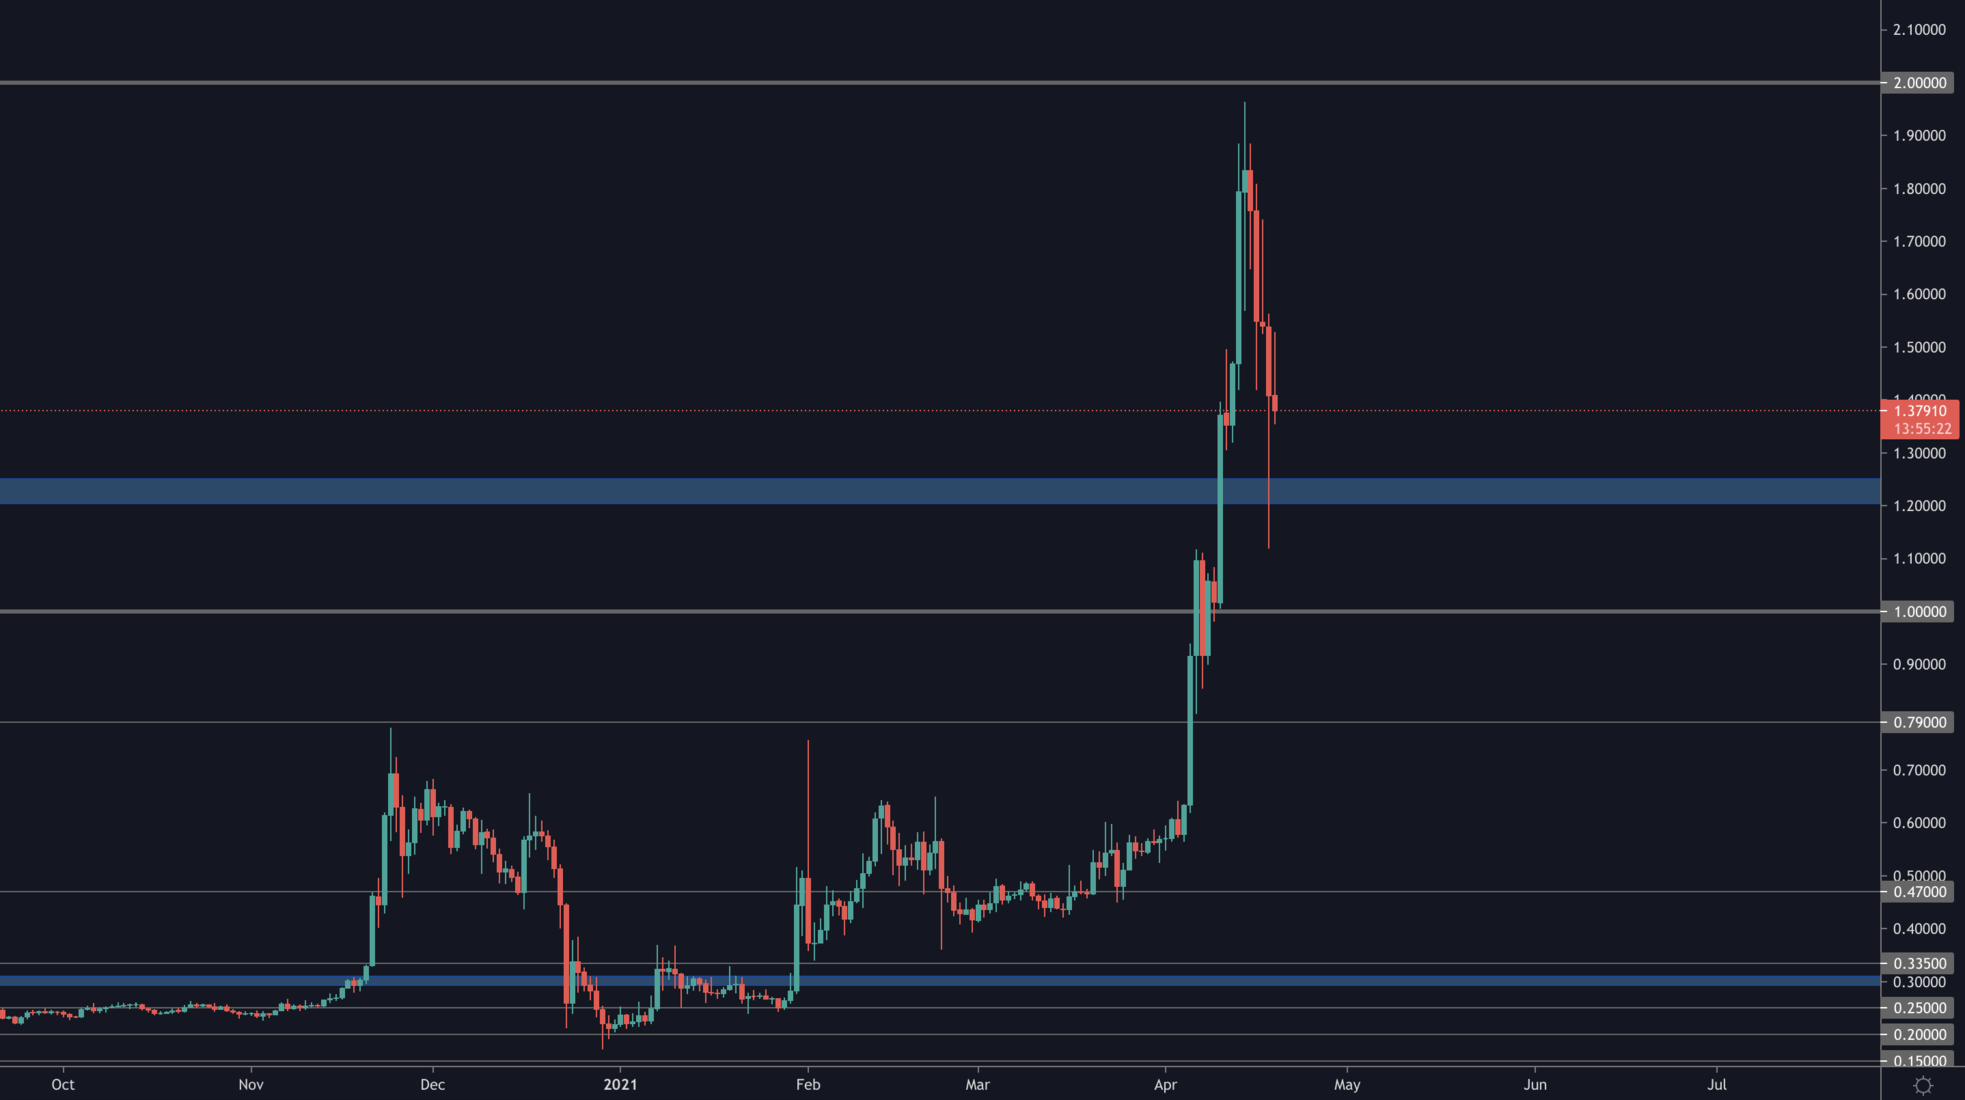
XRP has retested $1.25 for support. From a technical perspective, the next level sits at $2.
Disclaimer: NOT FINANCIAL NOR INVESTMENT ADVICE. Only you are responsible for any capital-related decisions you make and only you are accountable for the results.
Recommended from Cryptonary


