Save 23% ($351) & Get a Free 1-1 Call with our Team ⏰ : 0d 2h 59m 43s

Market Sentiment
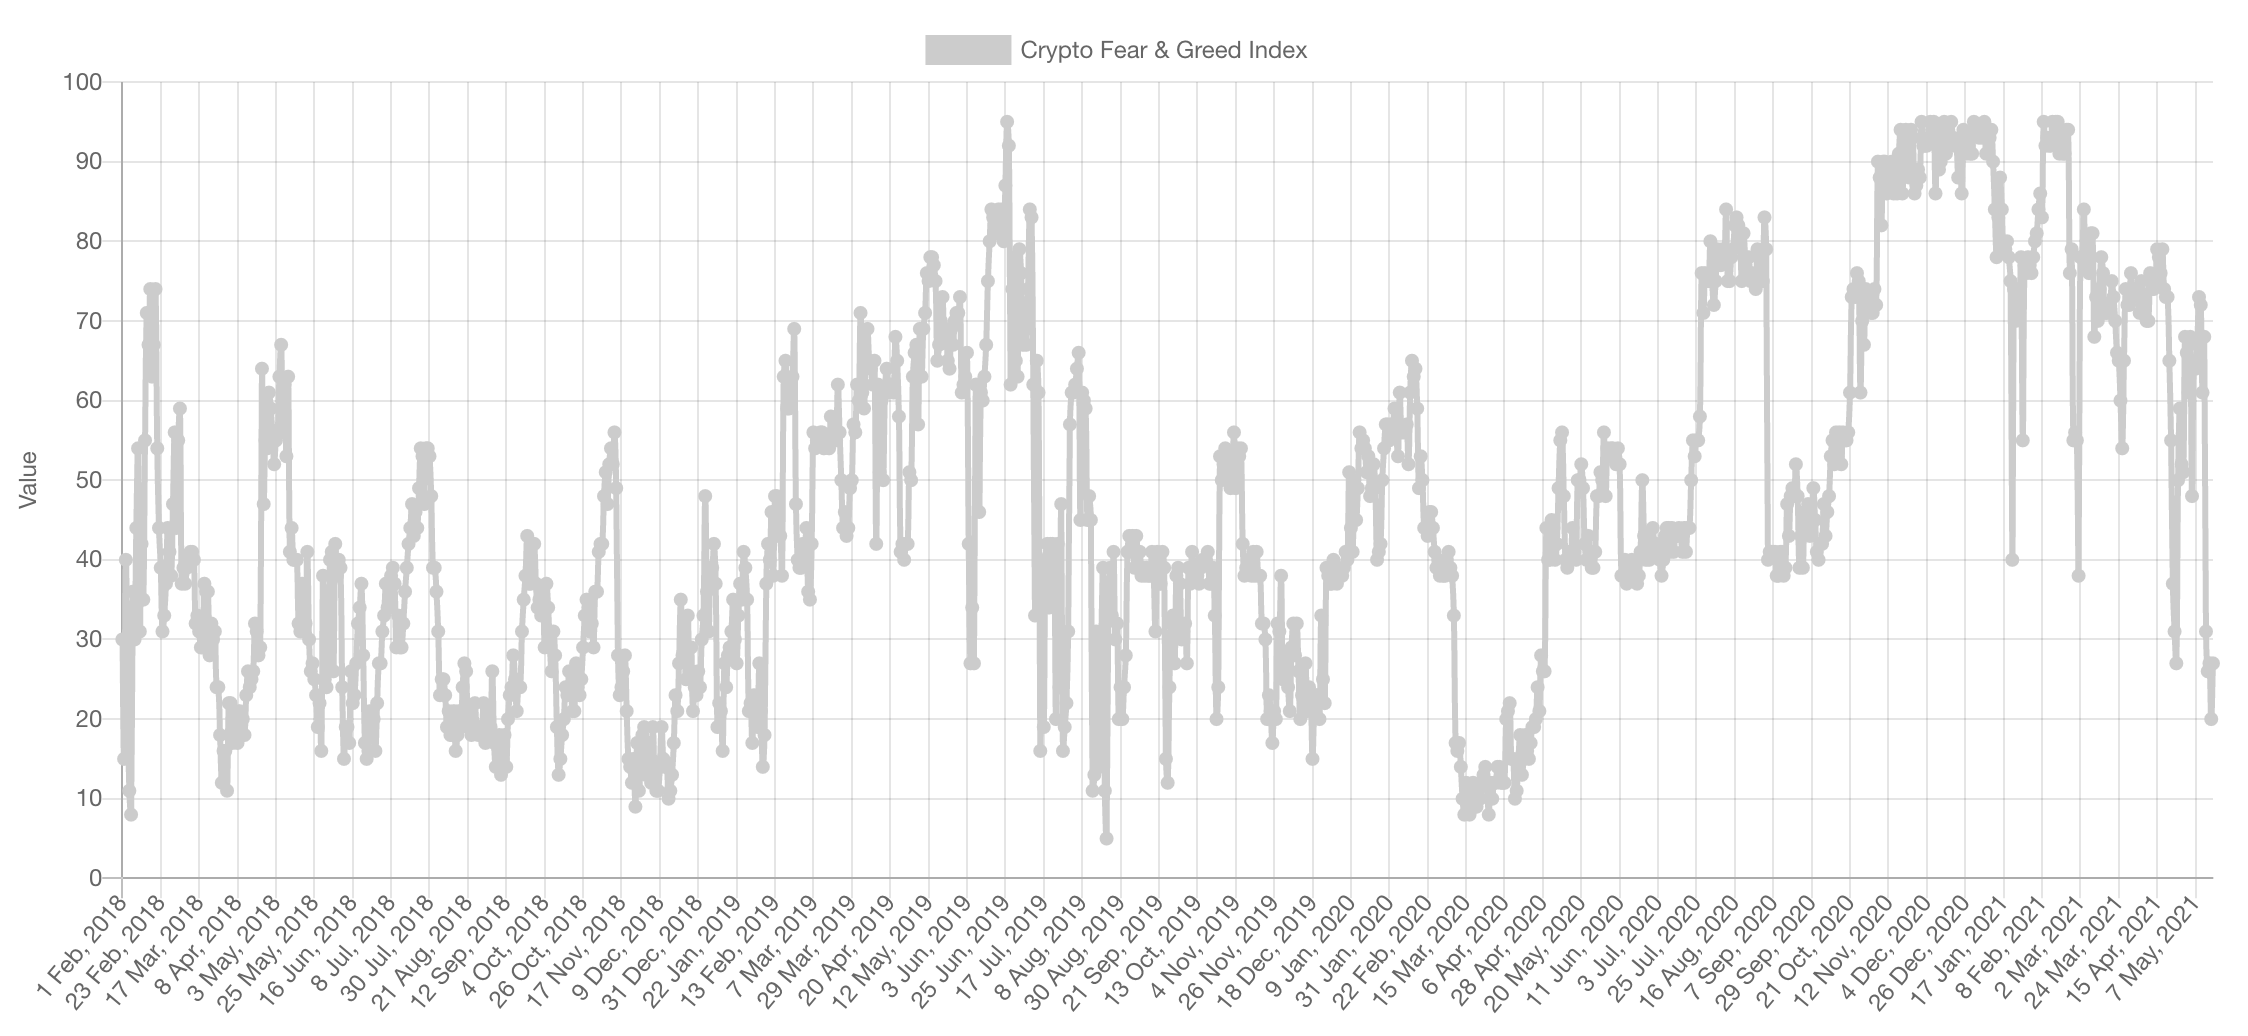
During bull markets, which this is, a sentiment of Fear tends to be temporary and only fast touches of such levels usually happen. You can mirror it to bear market sentiment and how sentiments of Greed signaled certain selling opportunities.
Market Indexes
Total Market Cap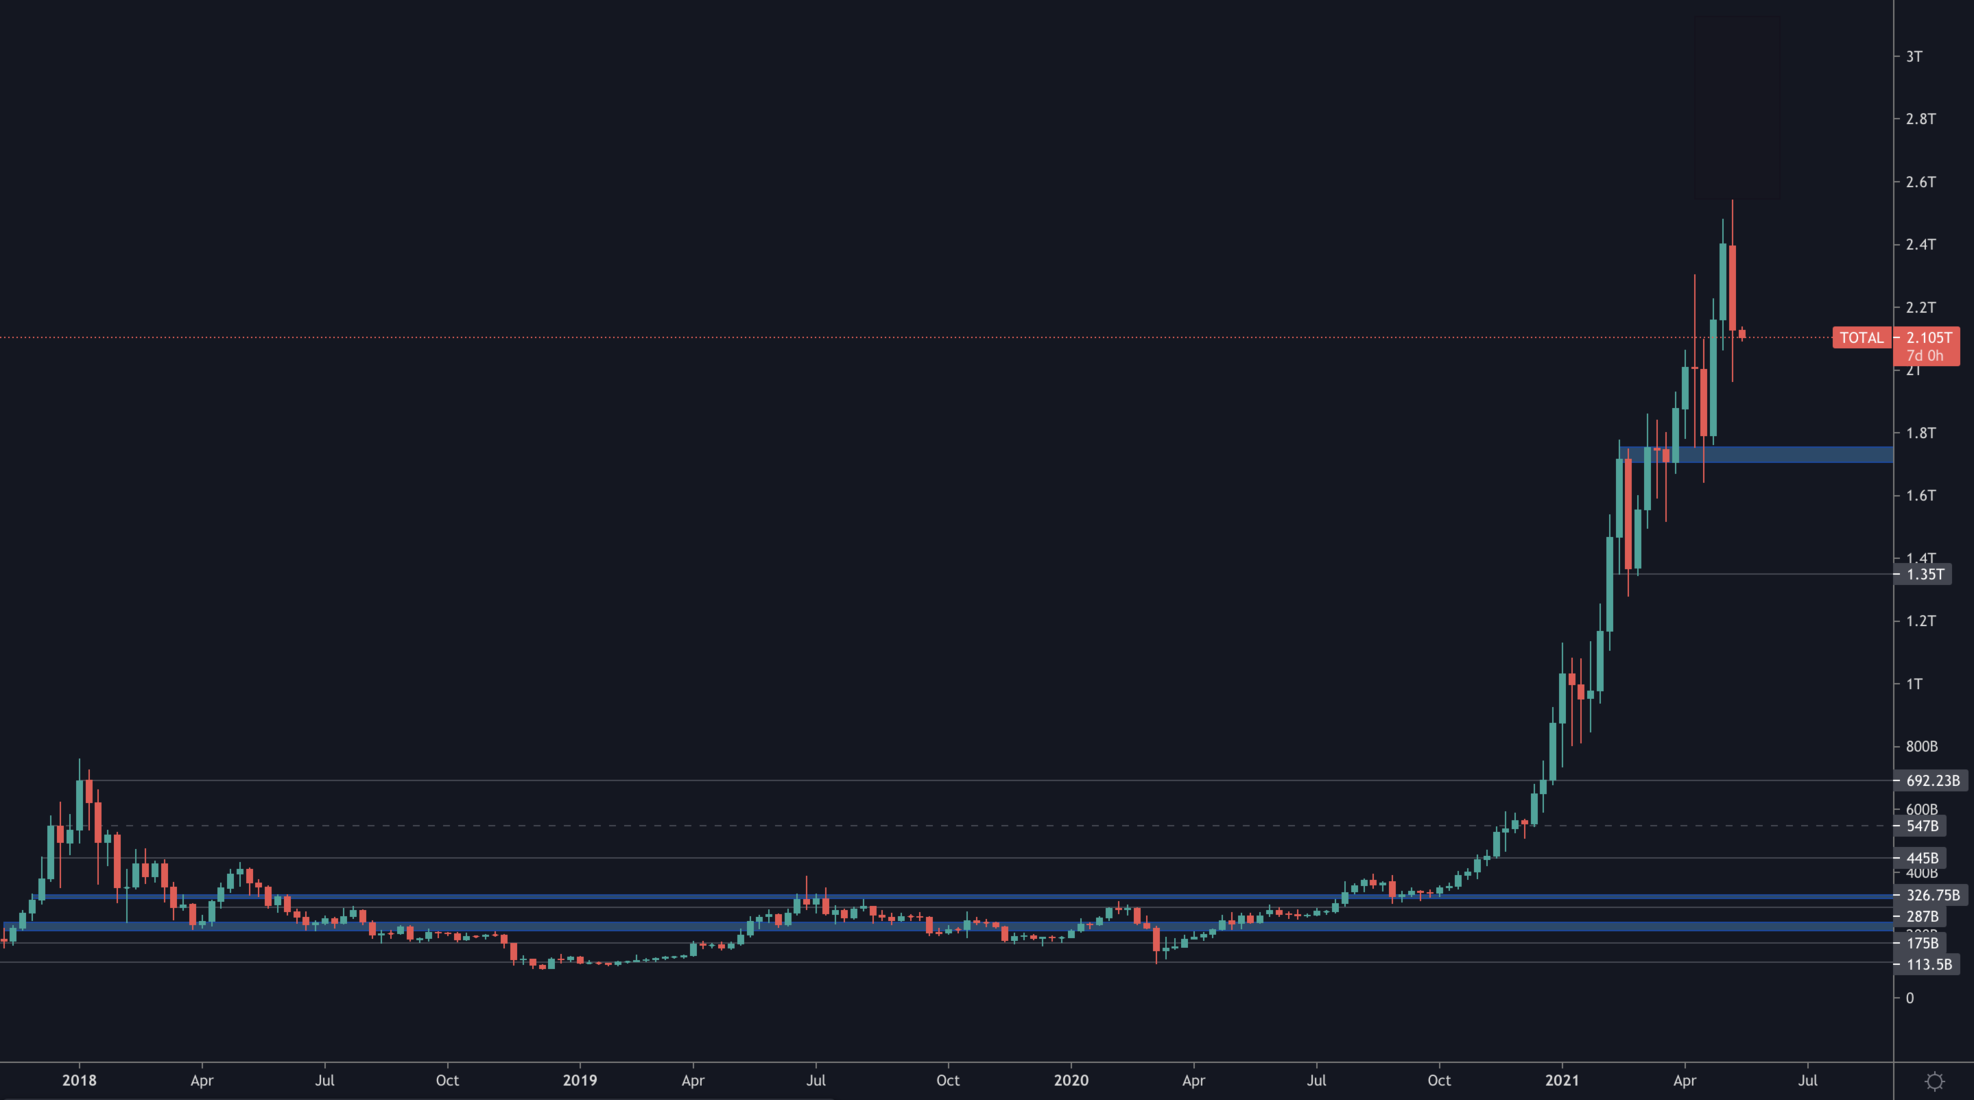
The Total Market Cap is still setting higher highs and higher lows - which denominates a bullish market structure. There are no warning signs yet showing on this market's main index which means further upside continuation over the next few weeks remains the more likely outcome.
Note: Both the Total and Alts MCap indices built by TradingView are showing wrong wicks - for the purpose of correct representation we have partially removed the excess wicks.
Altcoins Market Cap
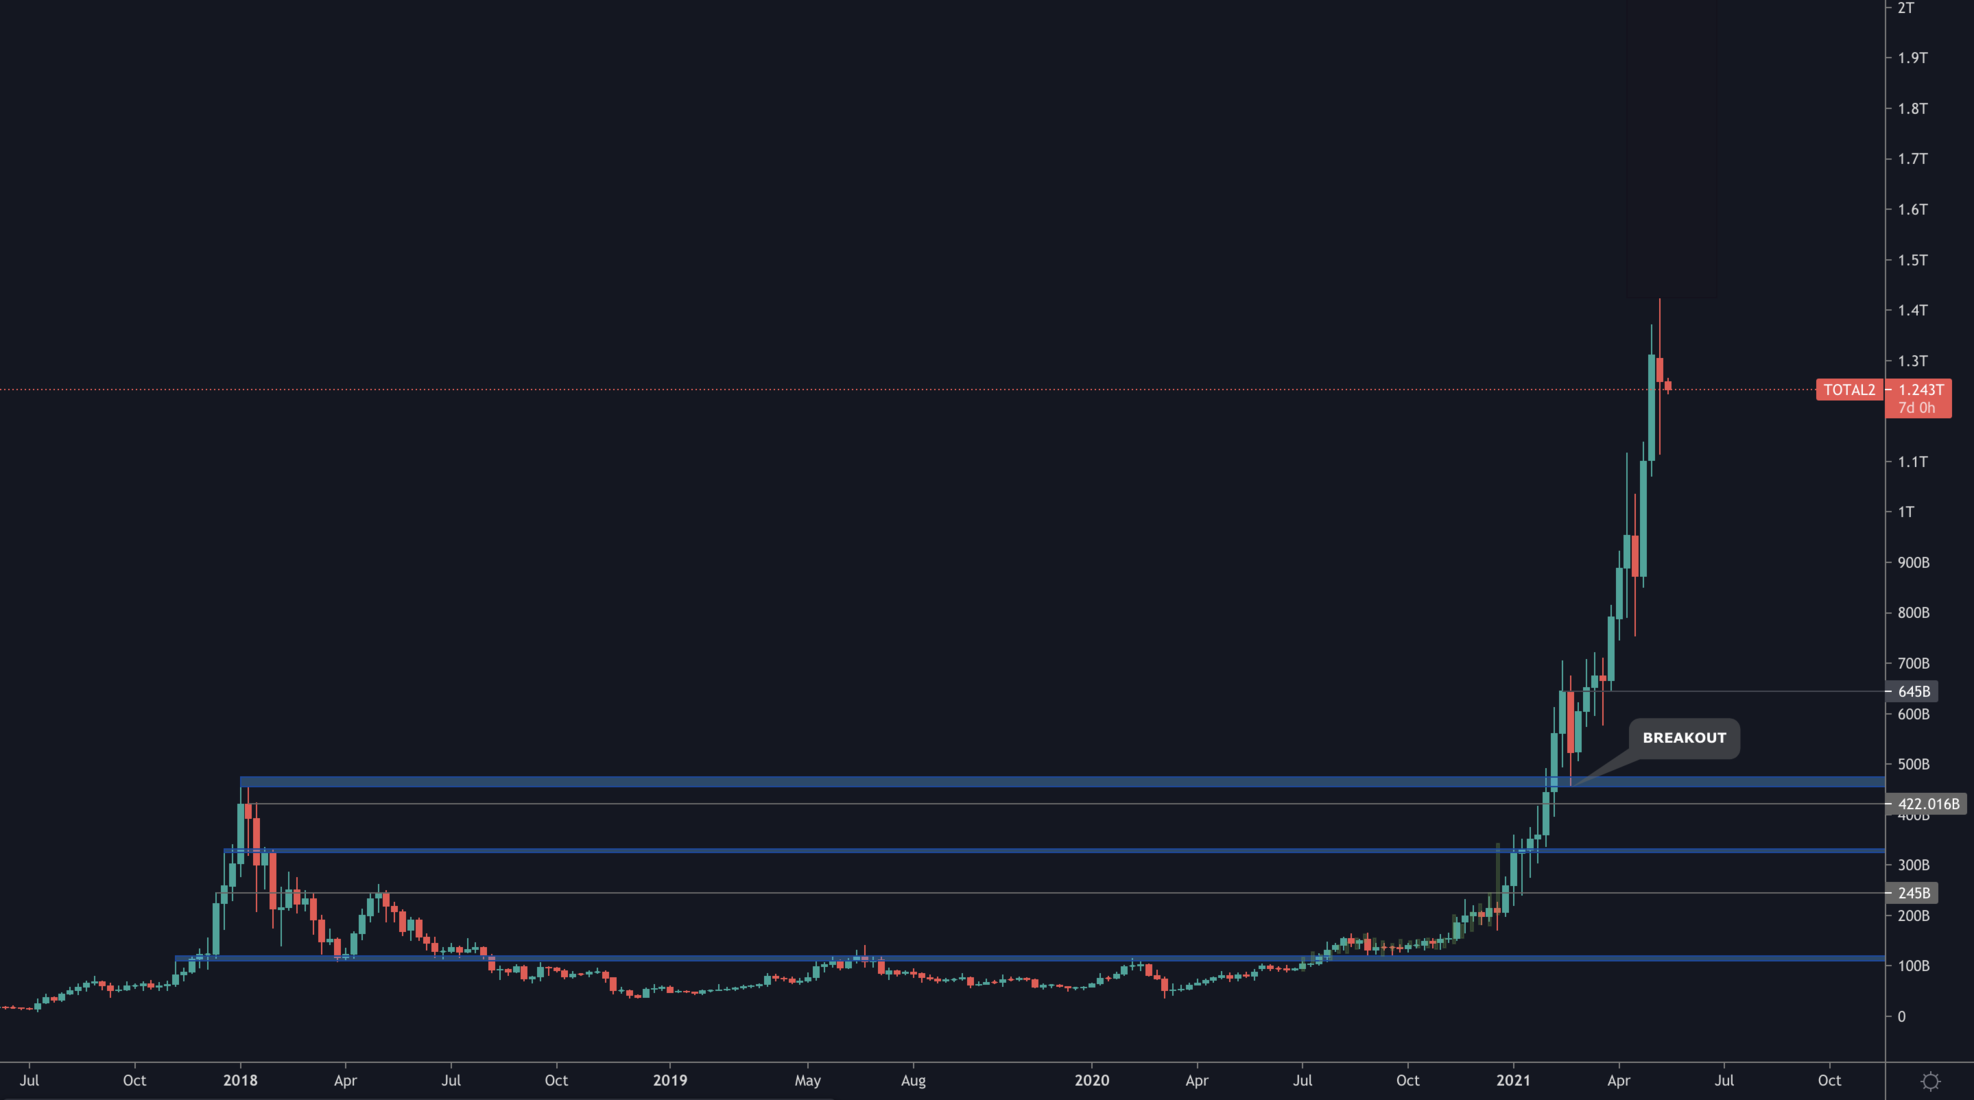
Despite the intra-week dip in the market, the Alts MCap was able to recover a large part of it which proved the continued demand on Altcoins right now. The next key level for Alts is $2 Trillion.
P.S: This is why we didn't want to fade/short the breakout from the 2017 highs - in retrospect, it was inevitable.
Bitcoin
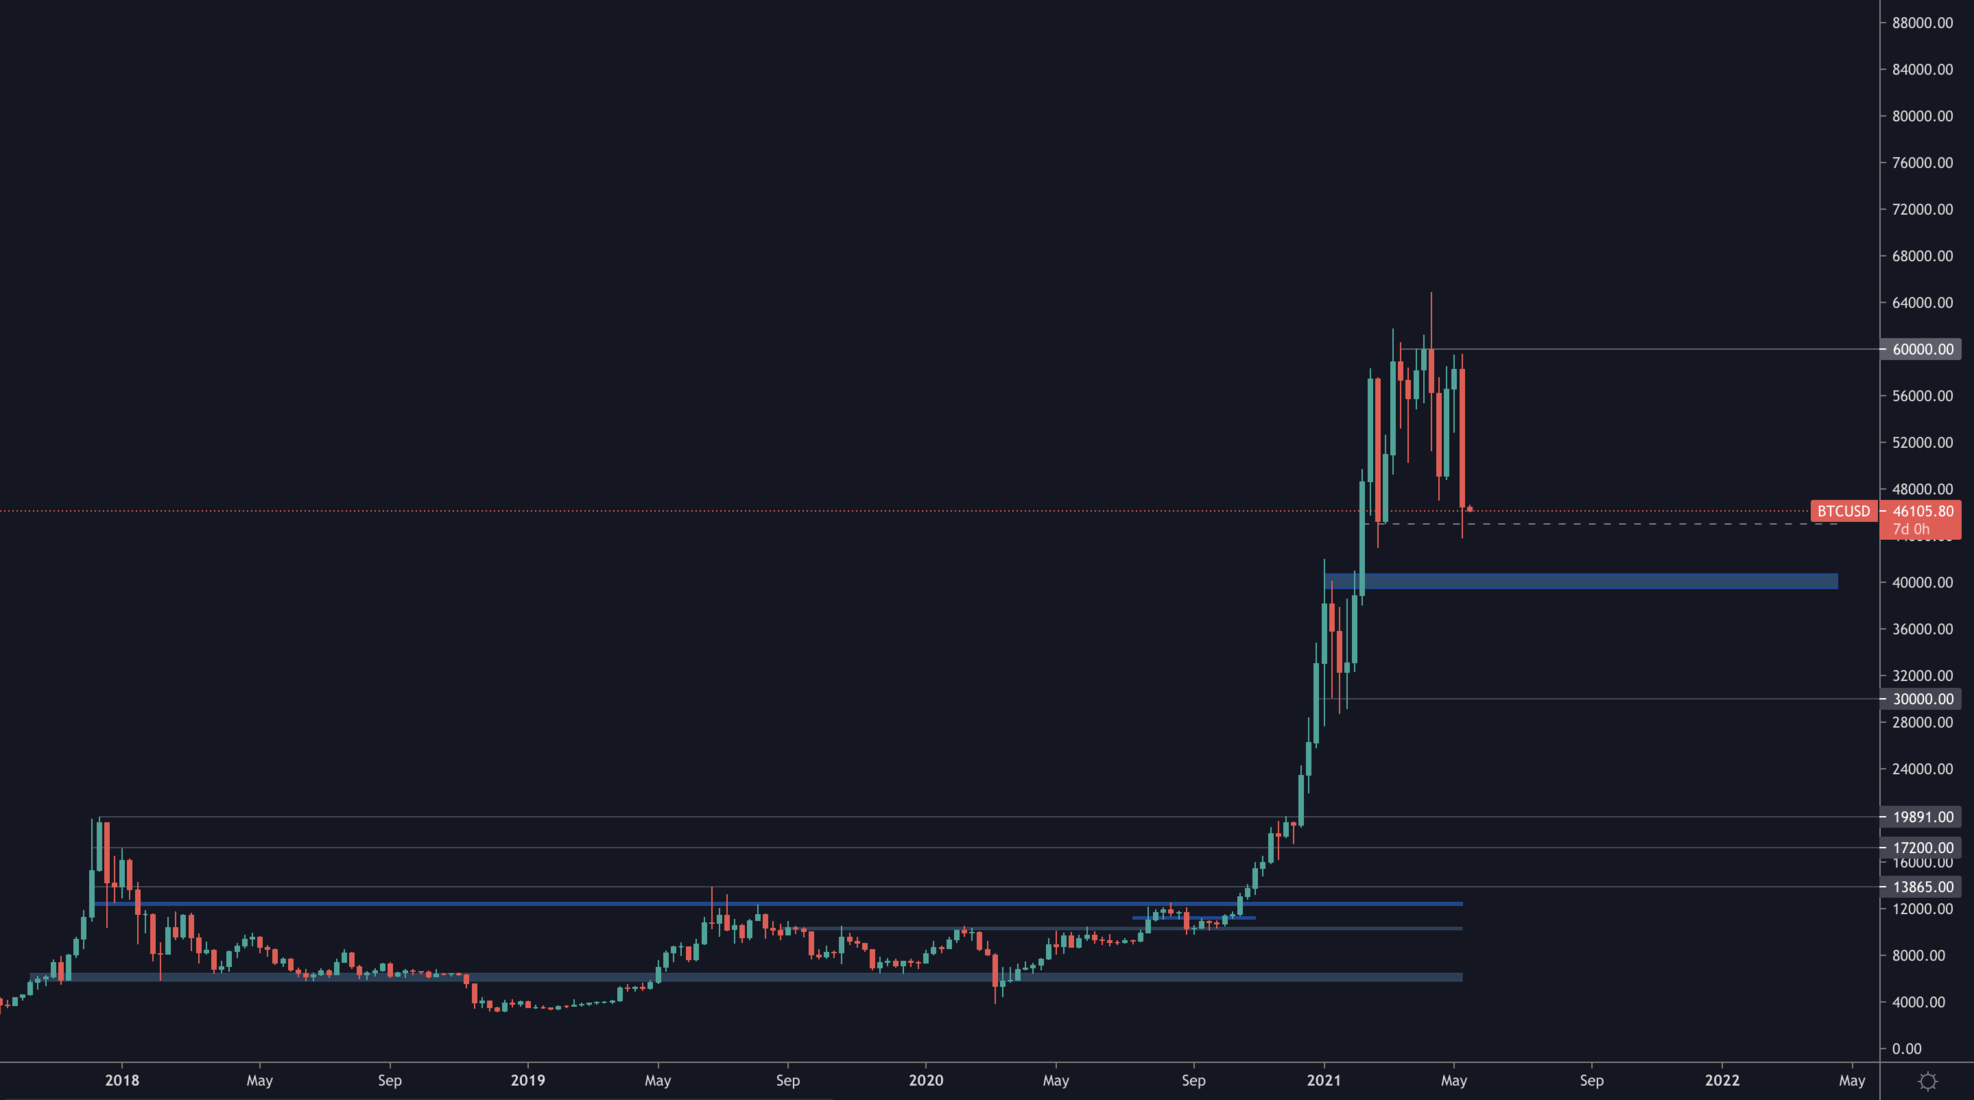
Bitcoin in and of itself is currently showing signs of being heavy (more sellers than buyers). However, in regard to Altcoins we must note that BTC has just hit a support level at $45,000 which will most likely offer a bounce for BTC and a market wide relief rally that can really advance in price (for altcoins).
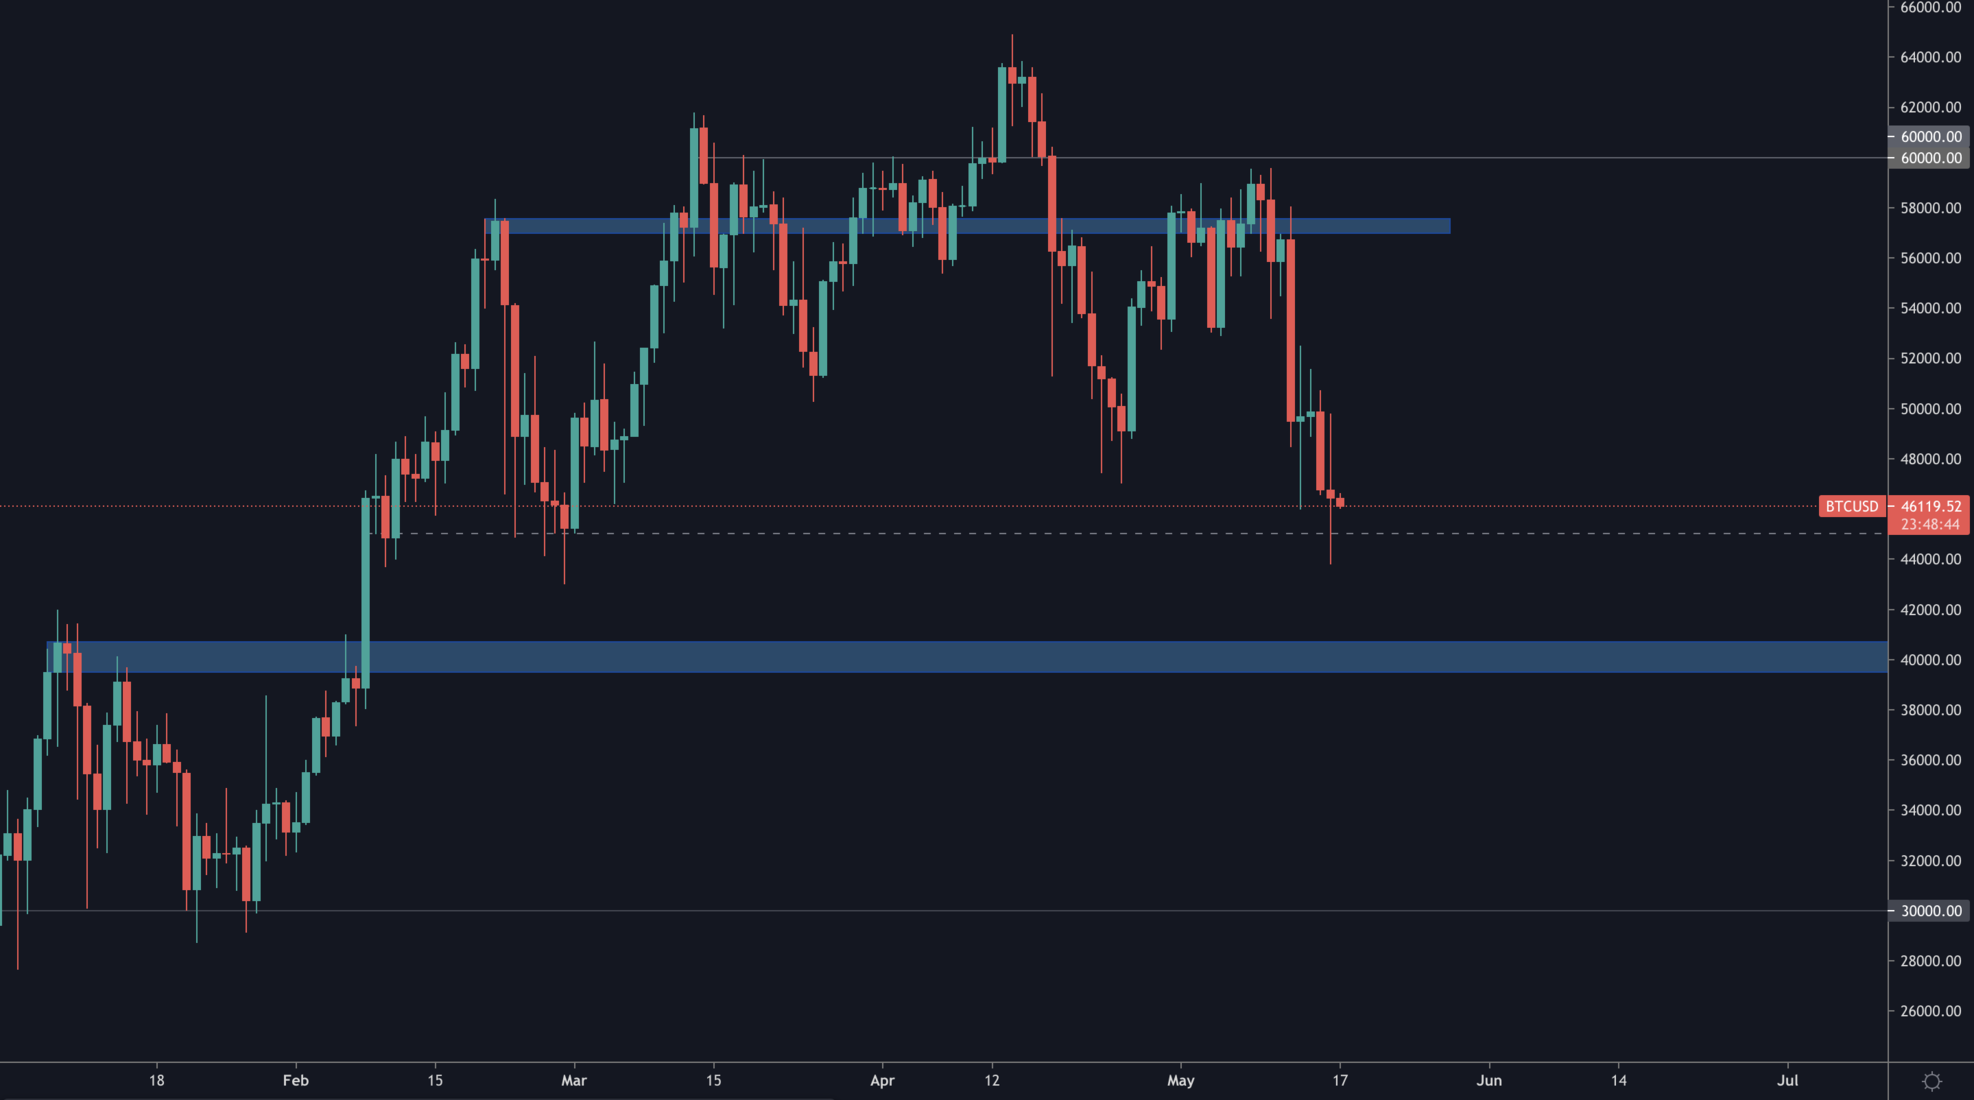
Note the market structure change. Bitcoin has set two consecutive lower highs and lower lows - which denominates a bearish market structure. Right now it is at the $45,000 level of support (bullish for Alts). However, we don't believe that'll be the bottom for BTC, rather around ~$35,000 which we expect to see in Q3 2021.
Ether
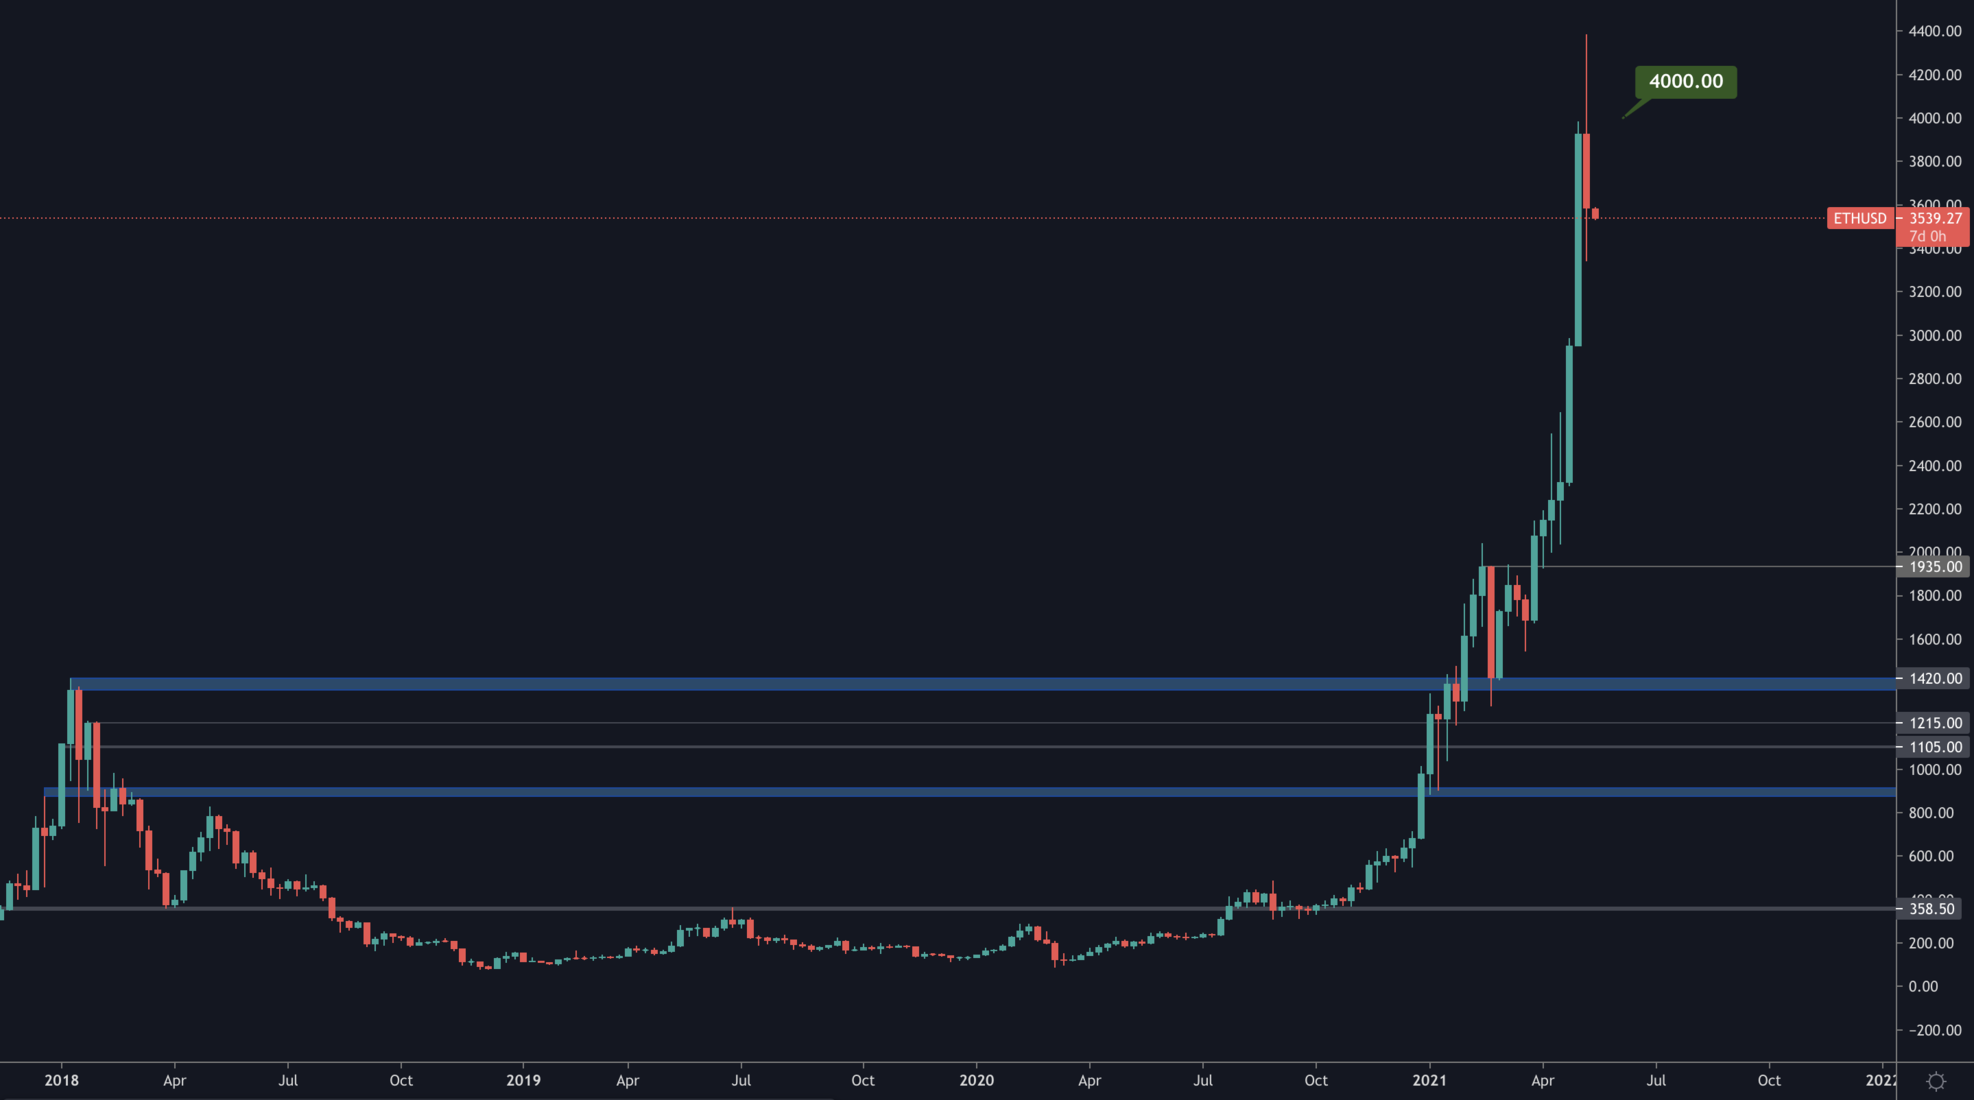
ETH has achieved our Q2 2021 target of $4,000 (stated here). This price was met with selling, mainly induced through Bitcoin's price action. After a large parabolic rally, a pullback of this size is rather normal.
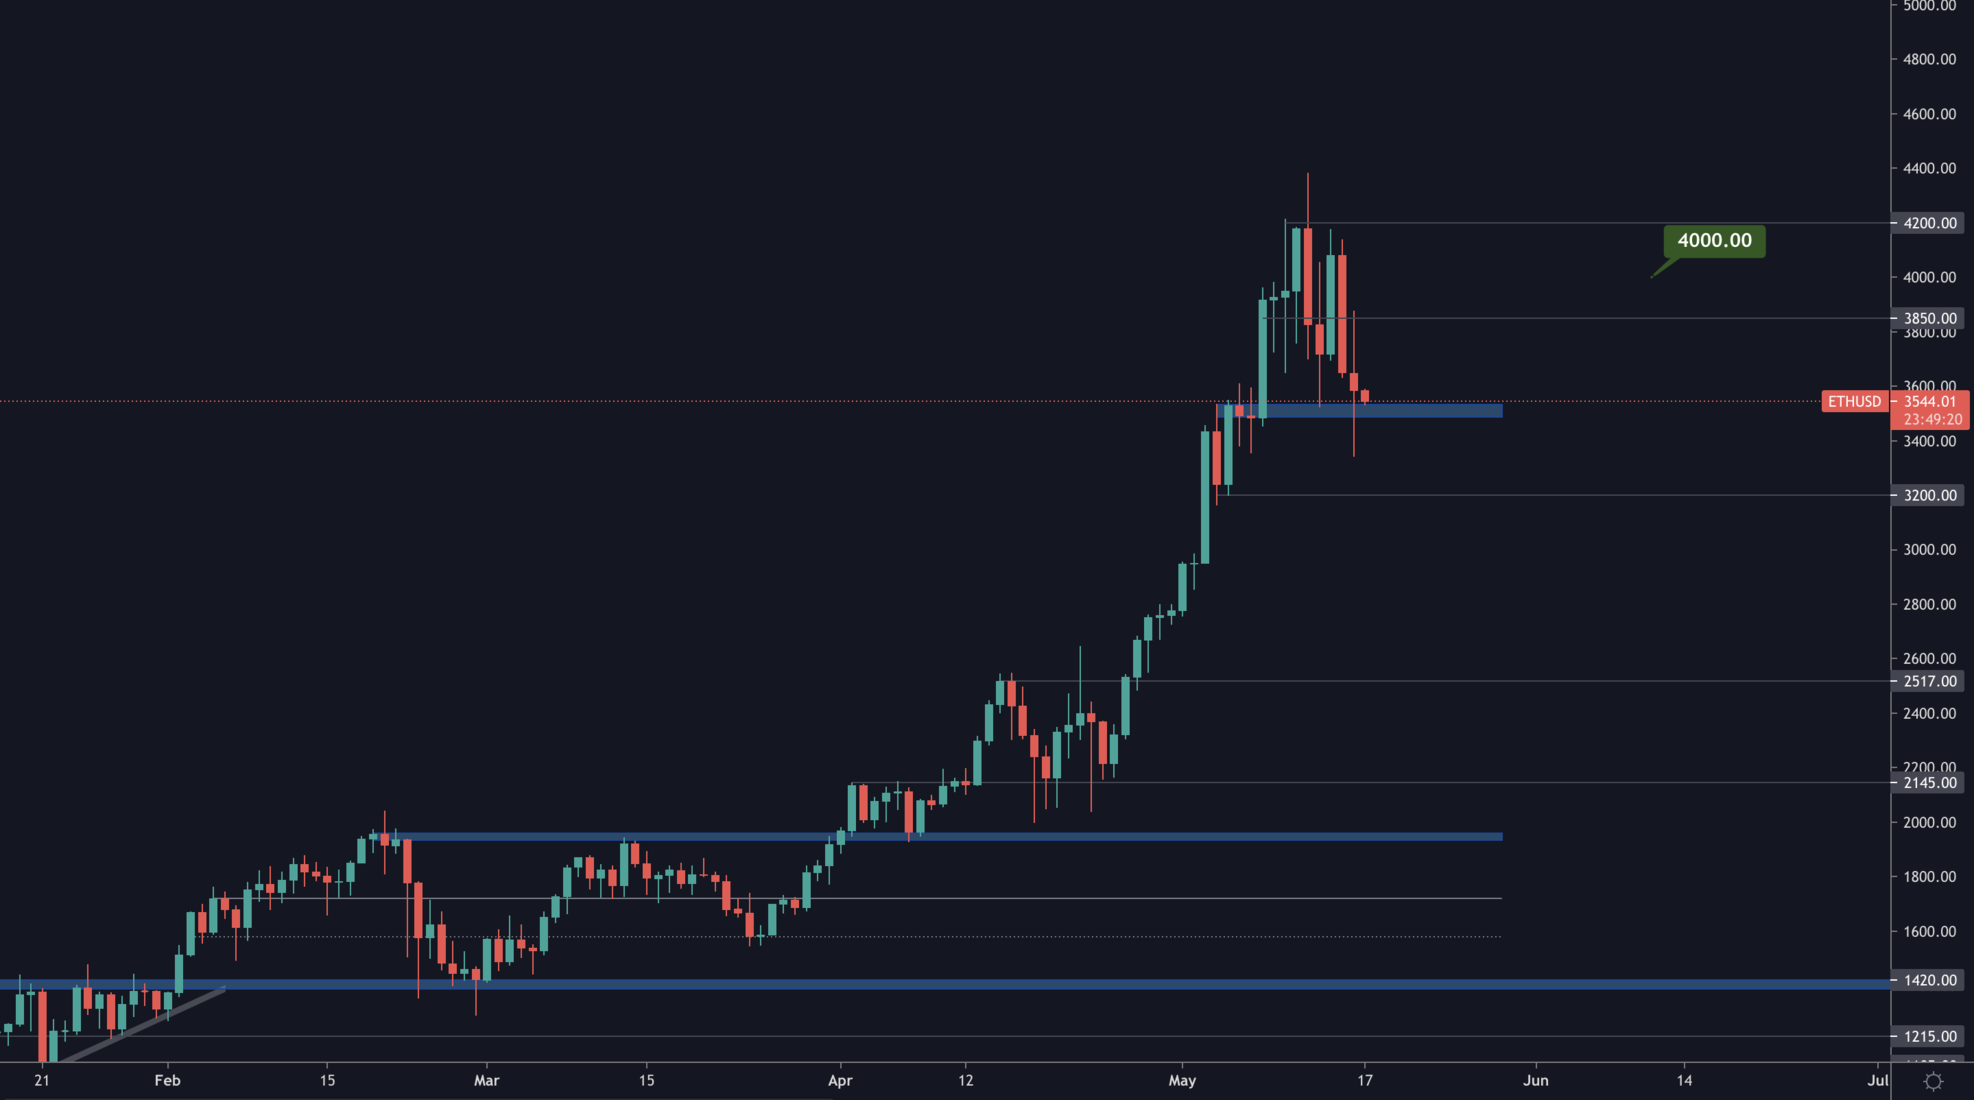
The daily timeframe is showing that ETH is respecting the bullish market structure as well as key level set along the way. $3,500 perfectly held as support on the daily timeframe which indicates that the next level in sight is $3,850.
DOT
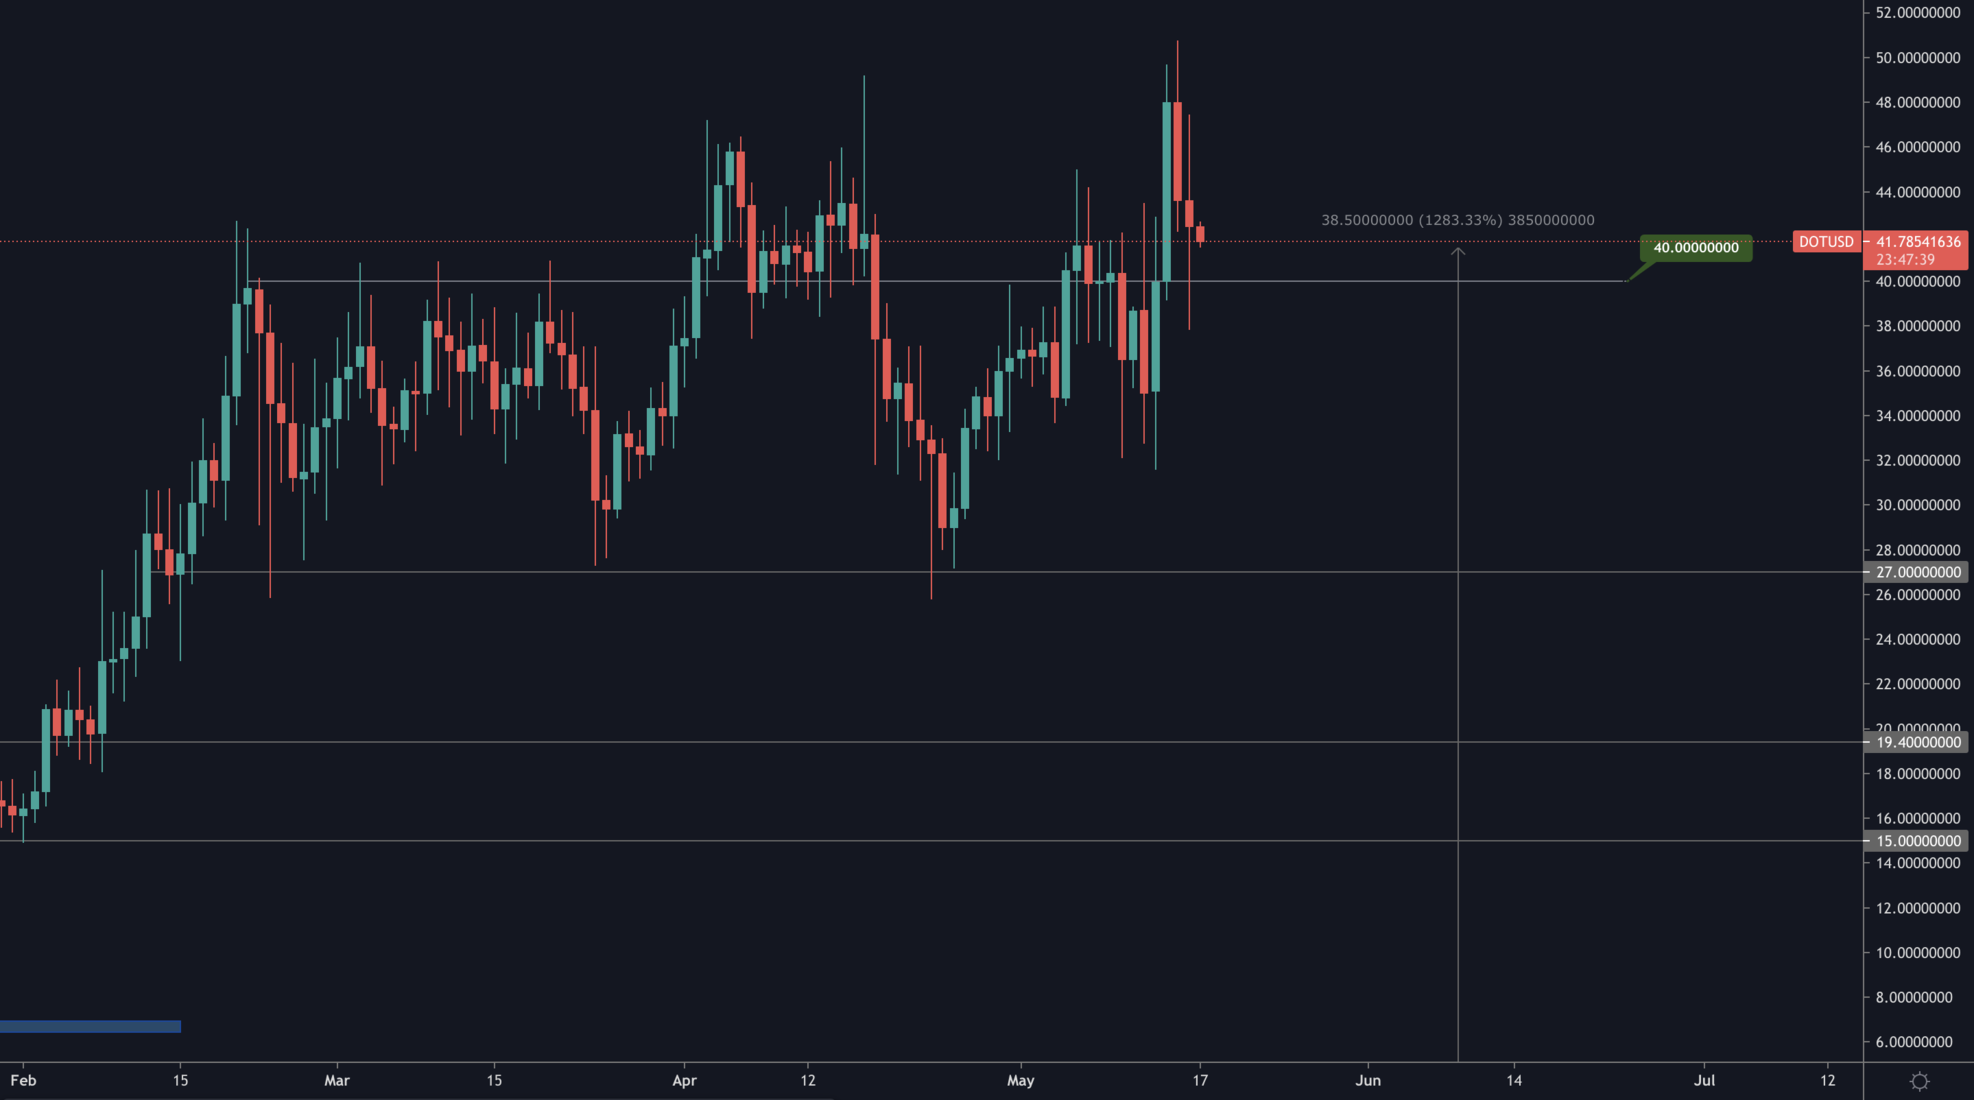
DOT has reclaimed $40 as well as set a brand new all-time high this week (~$50). As long as $40 now holds as support, DOT is poised for further price discovery.
SNX
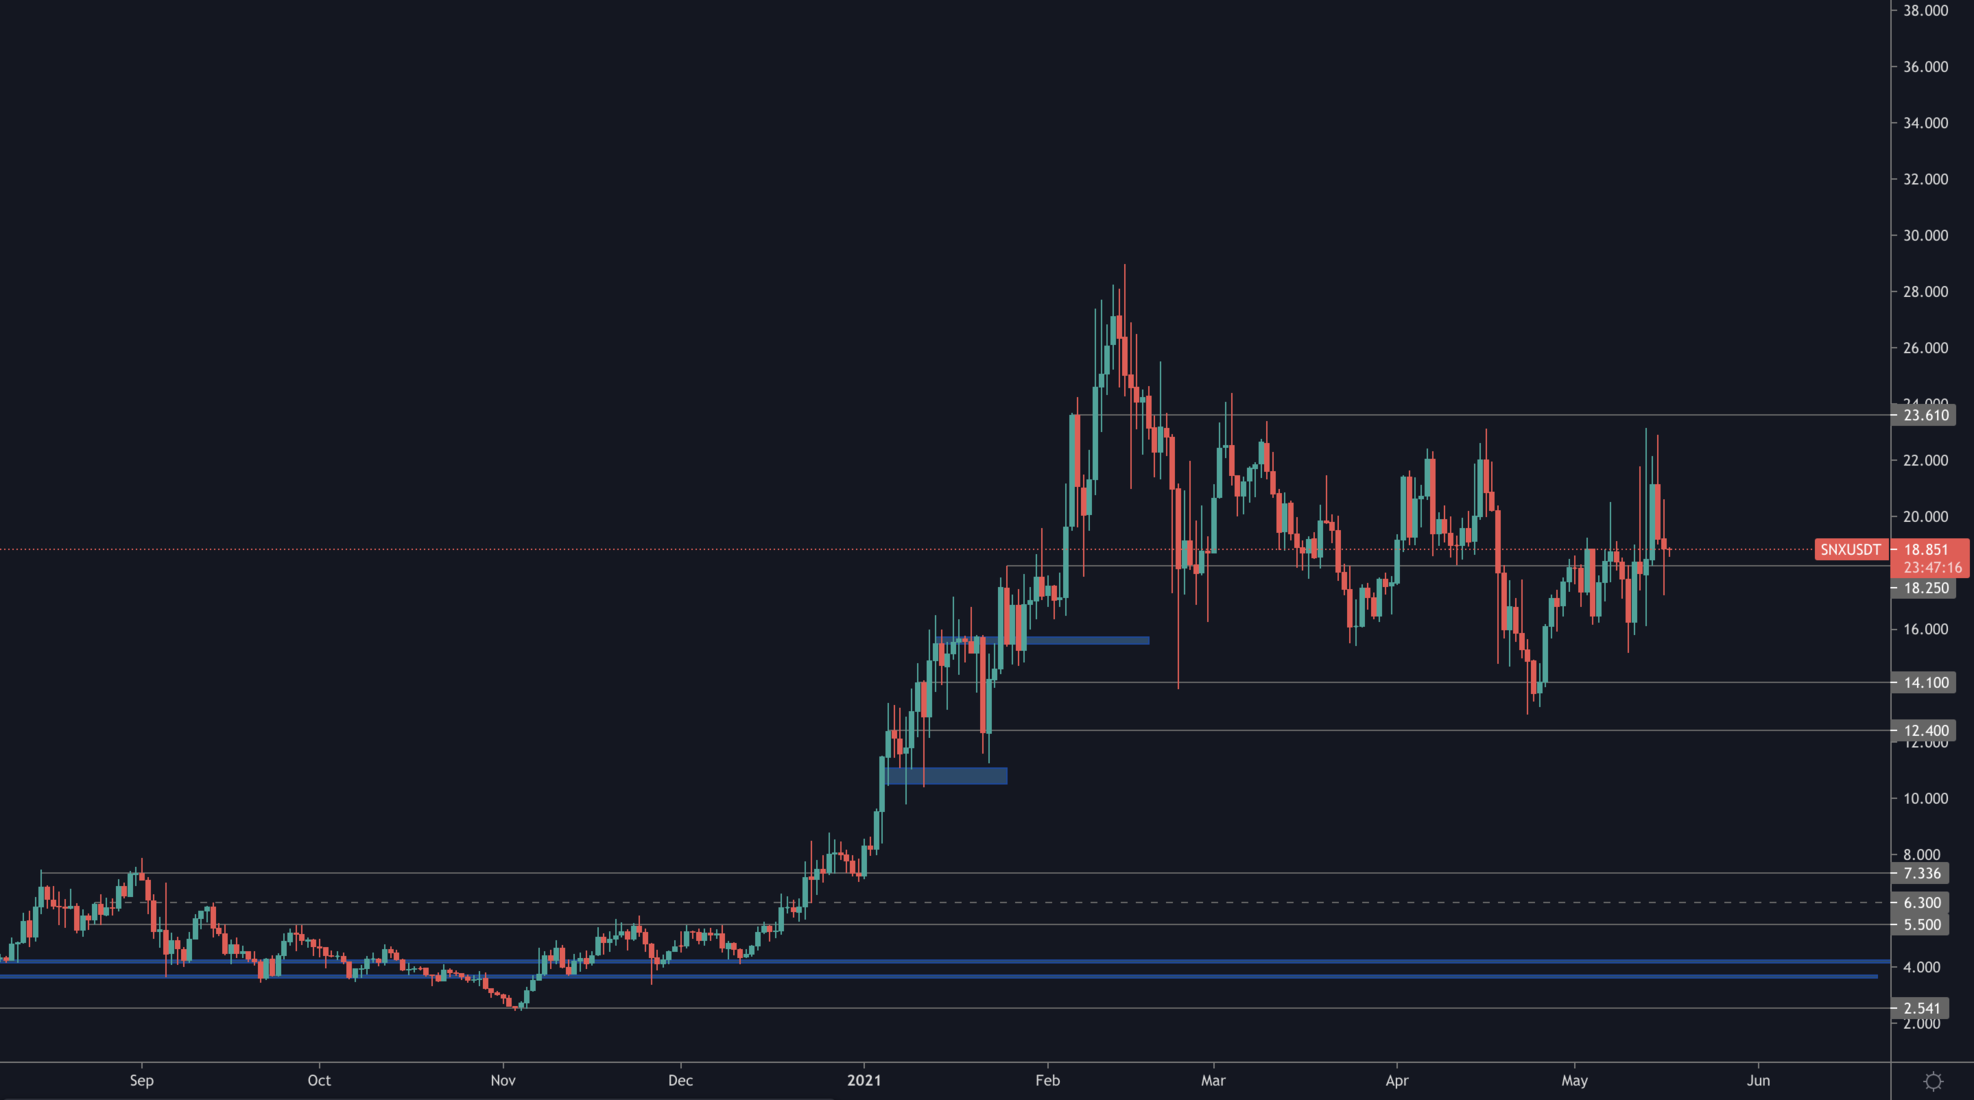
The volumes of demand on certain DeFi tokens (SNX & AAVE included) rose quite significantly last week which communicates that the bottom is most likely in for these two assets and they are ready for further price discovery. AAVE has done so and SNX is lagging behind.
RUNE
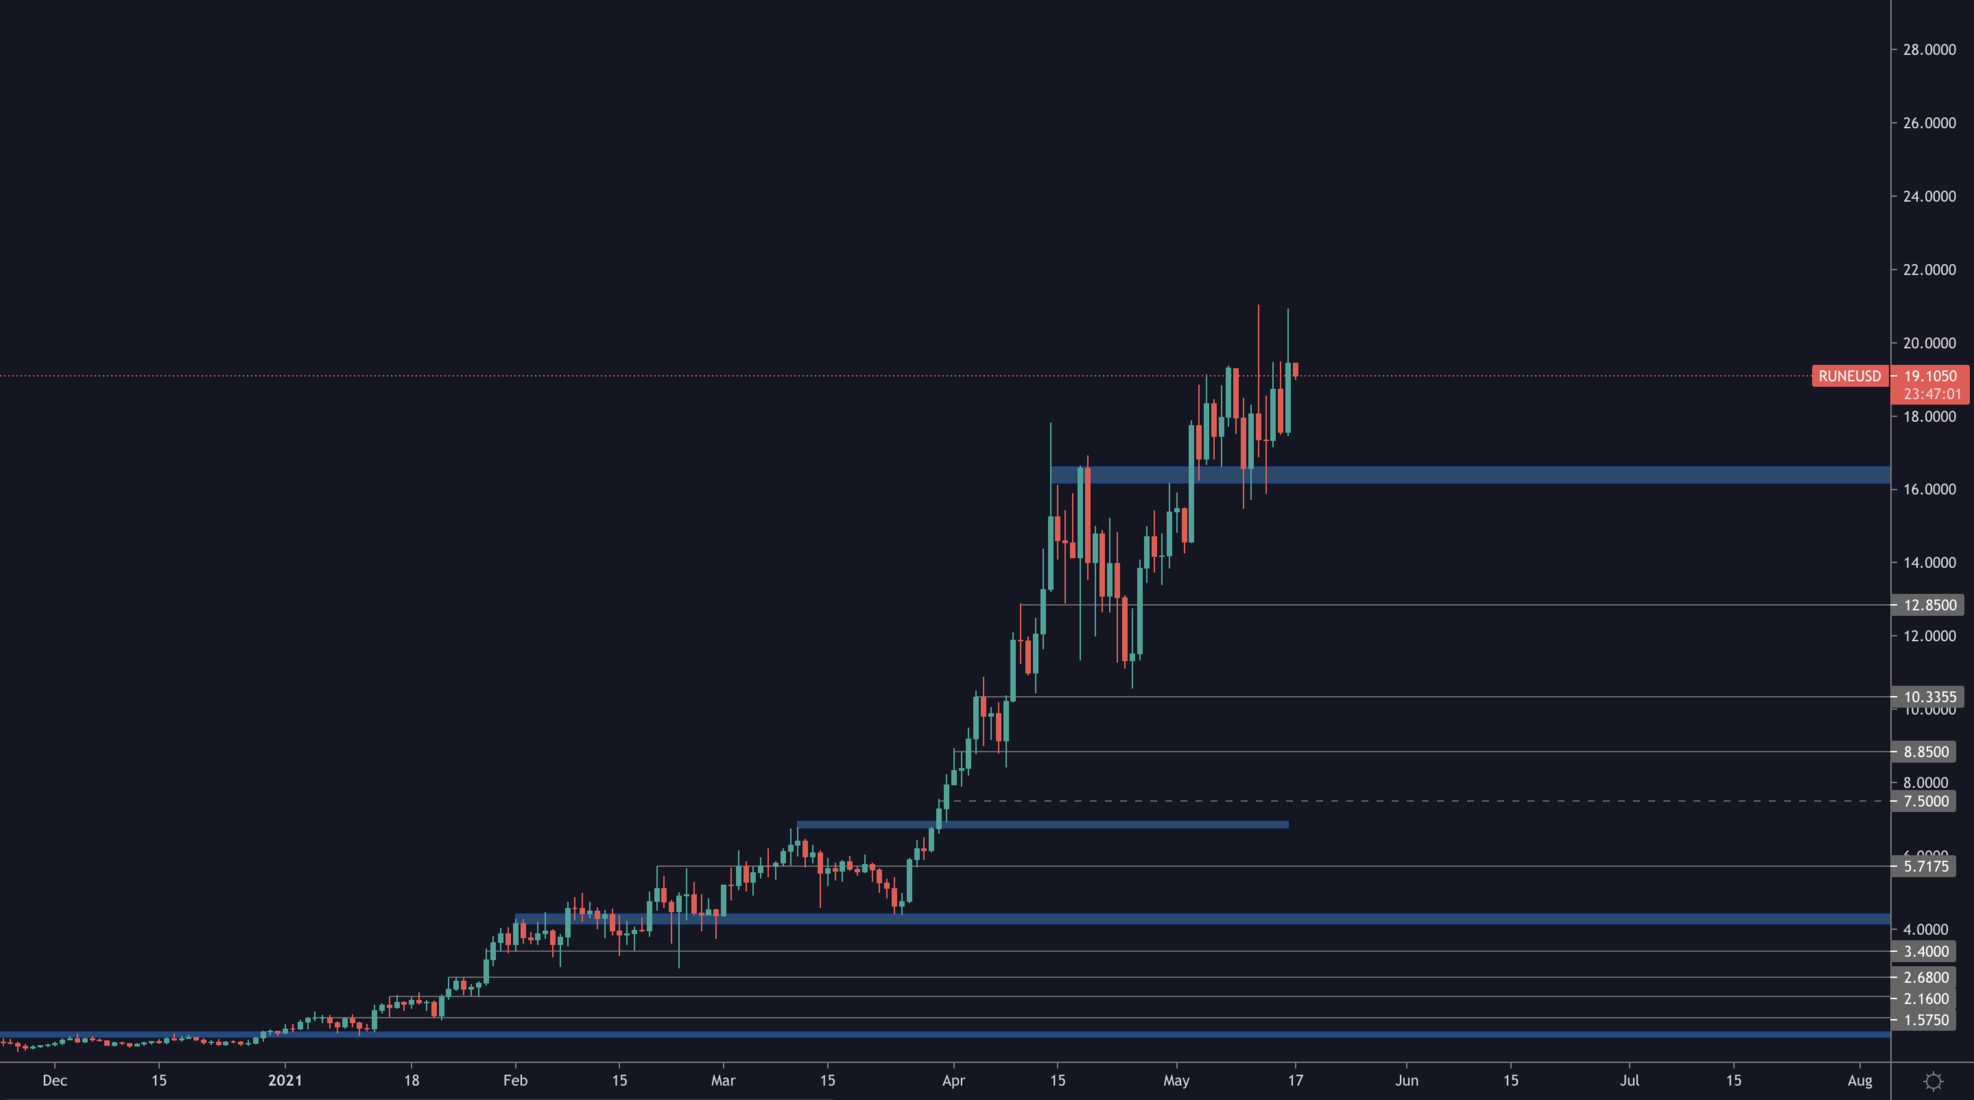
A common mistake is to over-complicate technical analysis and decision-making, therefore we simplify the process as much as possible which has led us to great outcomes in the past.
RUNE above $16.50 is bullish and signals further upside continuation. Right now, RUNE is very close to support but it likely won't stay as near over the next few weeks.
XRP
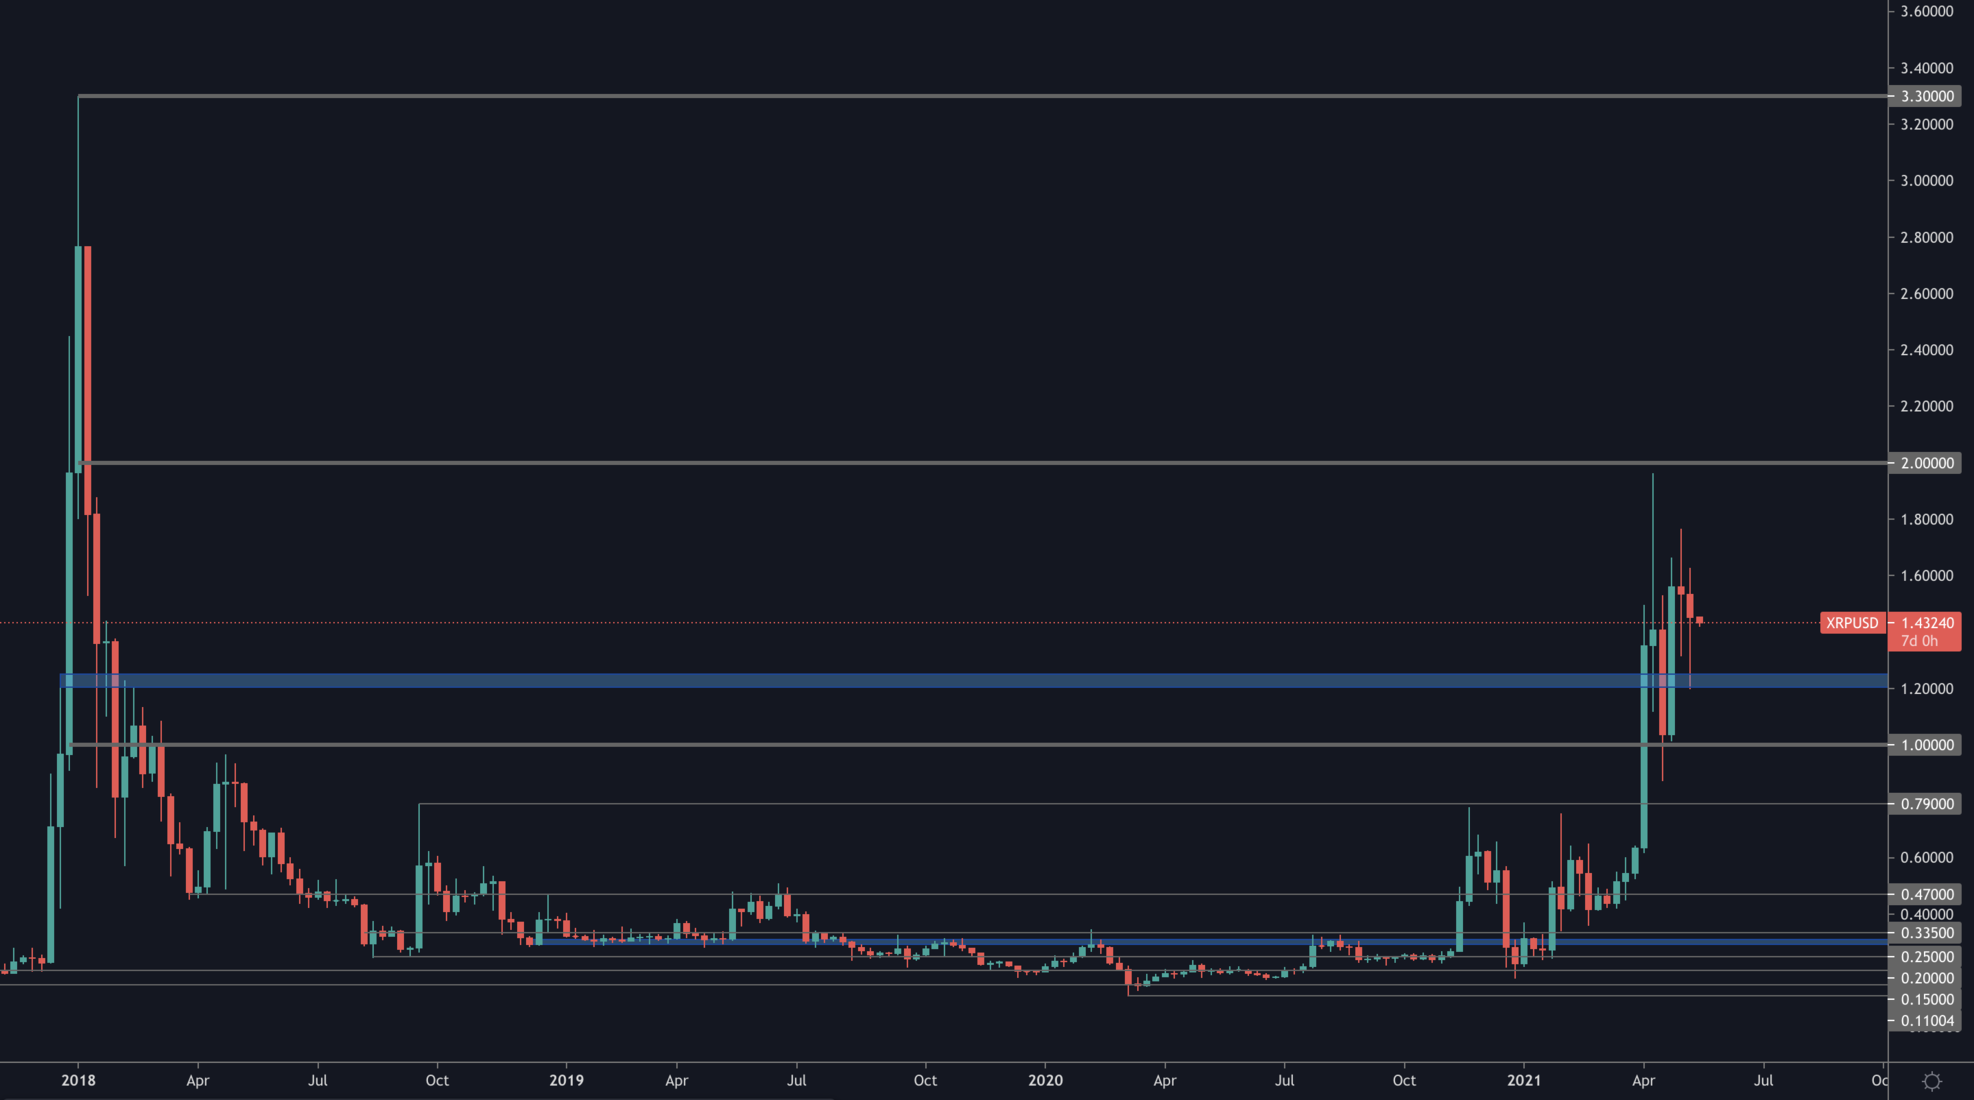
XRP has a bullish market structure with higher highs and higher lows as well as having held $1.25. This indicates that the next level is likely to be $2 for the first time in 1,225 days.
FTT
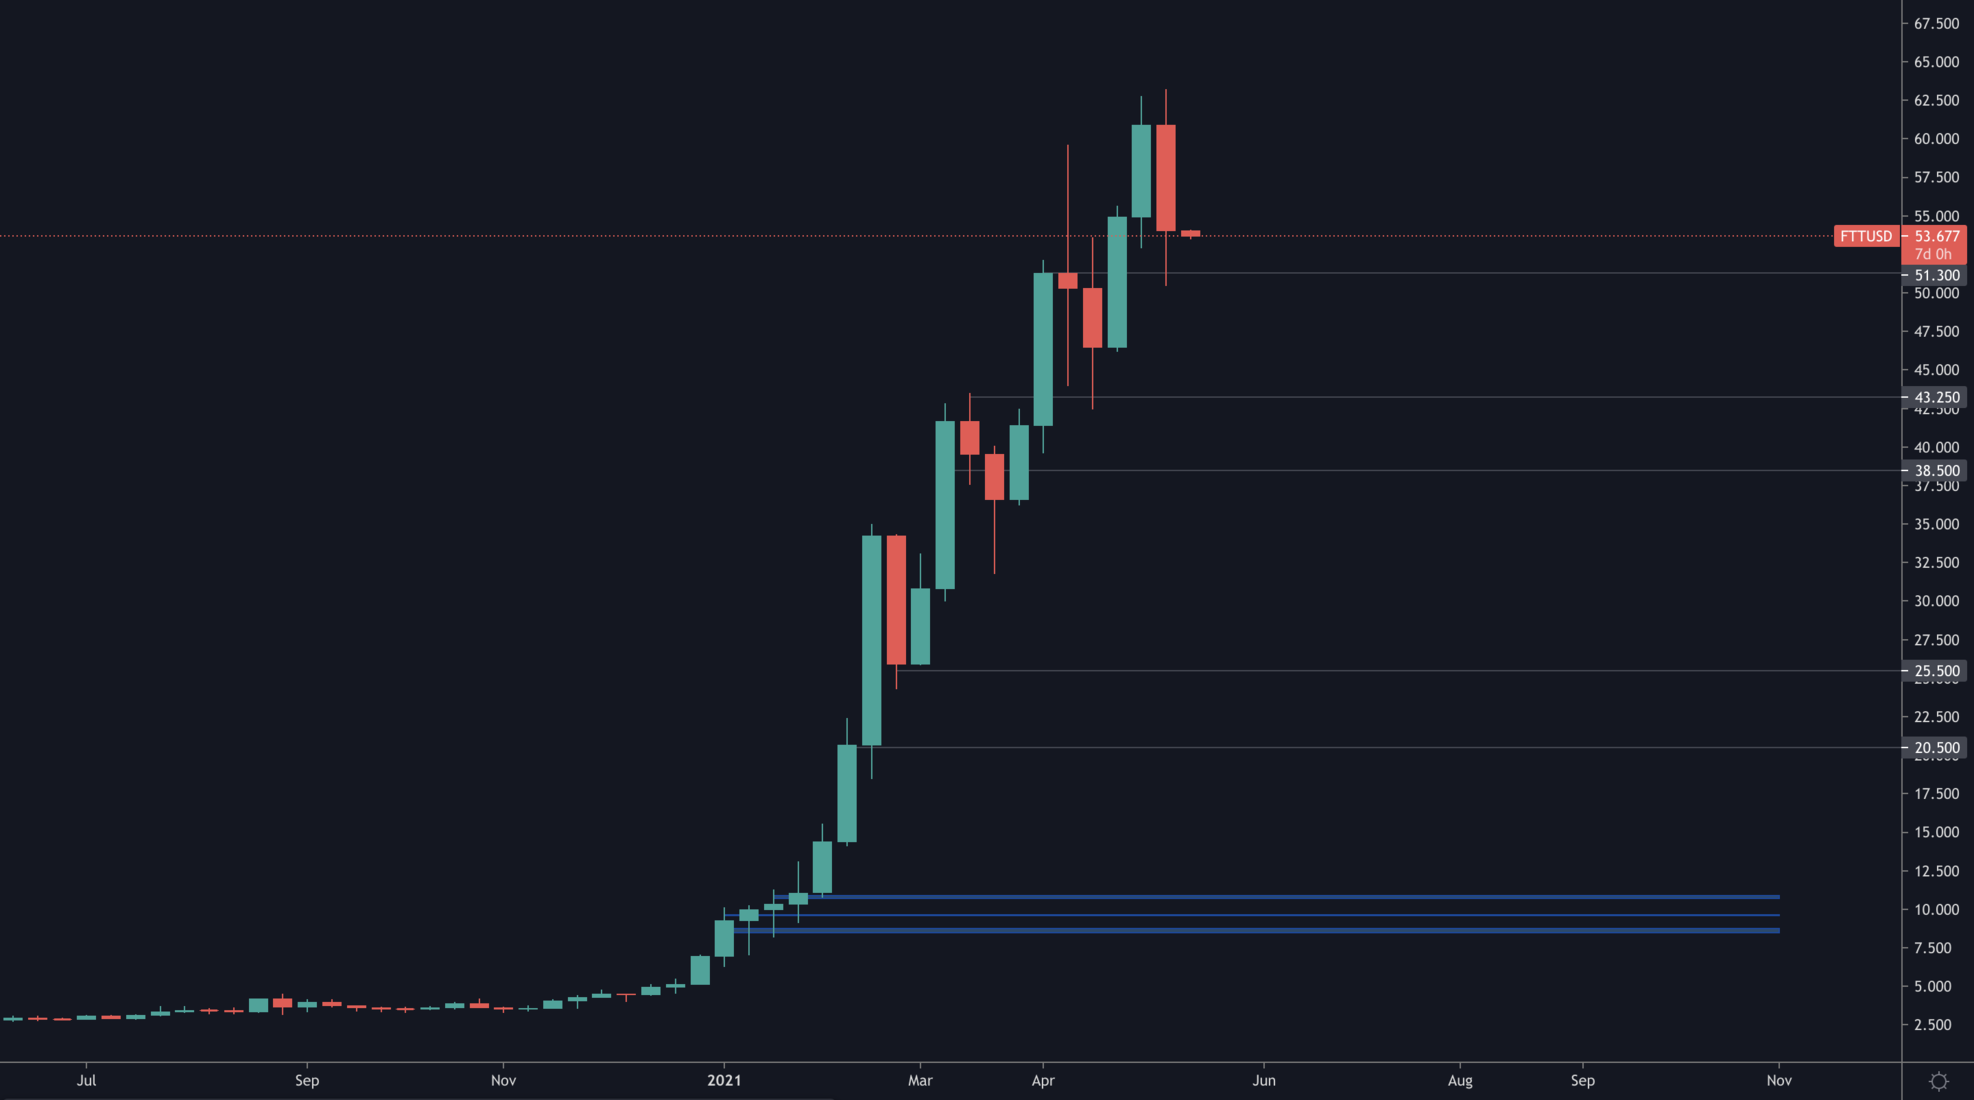
FTT is in a very clear uptrend with consistent higher highs and higher lows. As long as this market structure is holding, FTT would be in a bullish position.
SOL
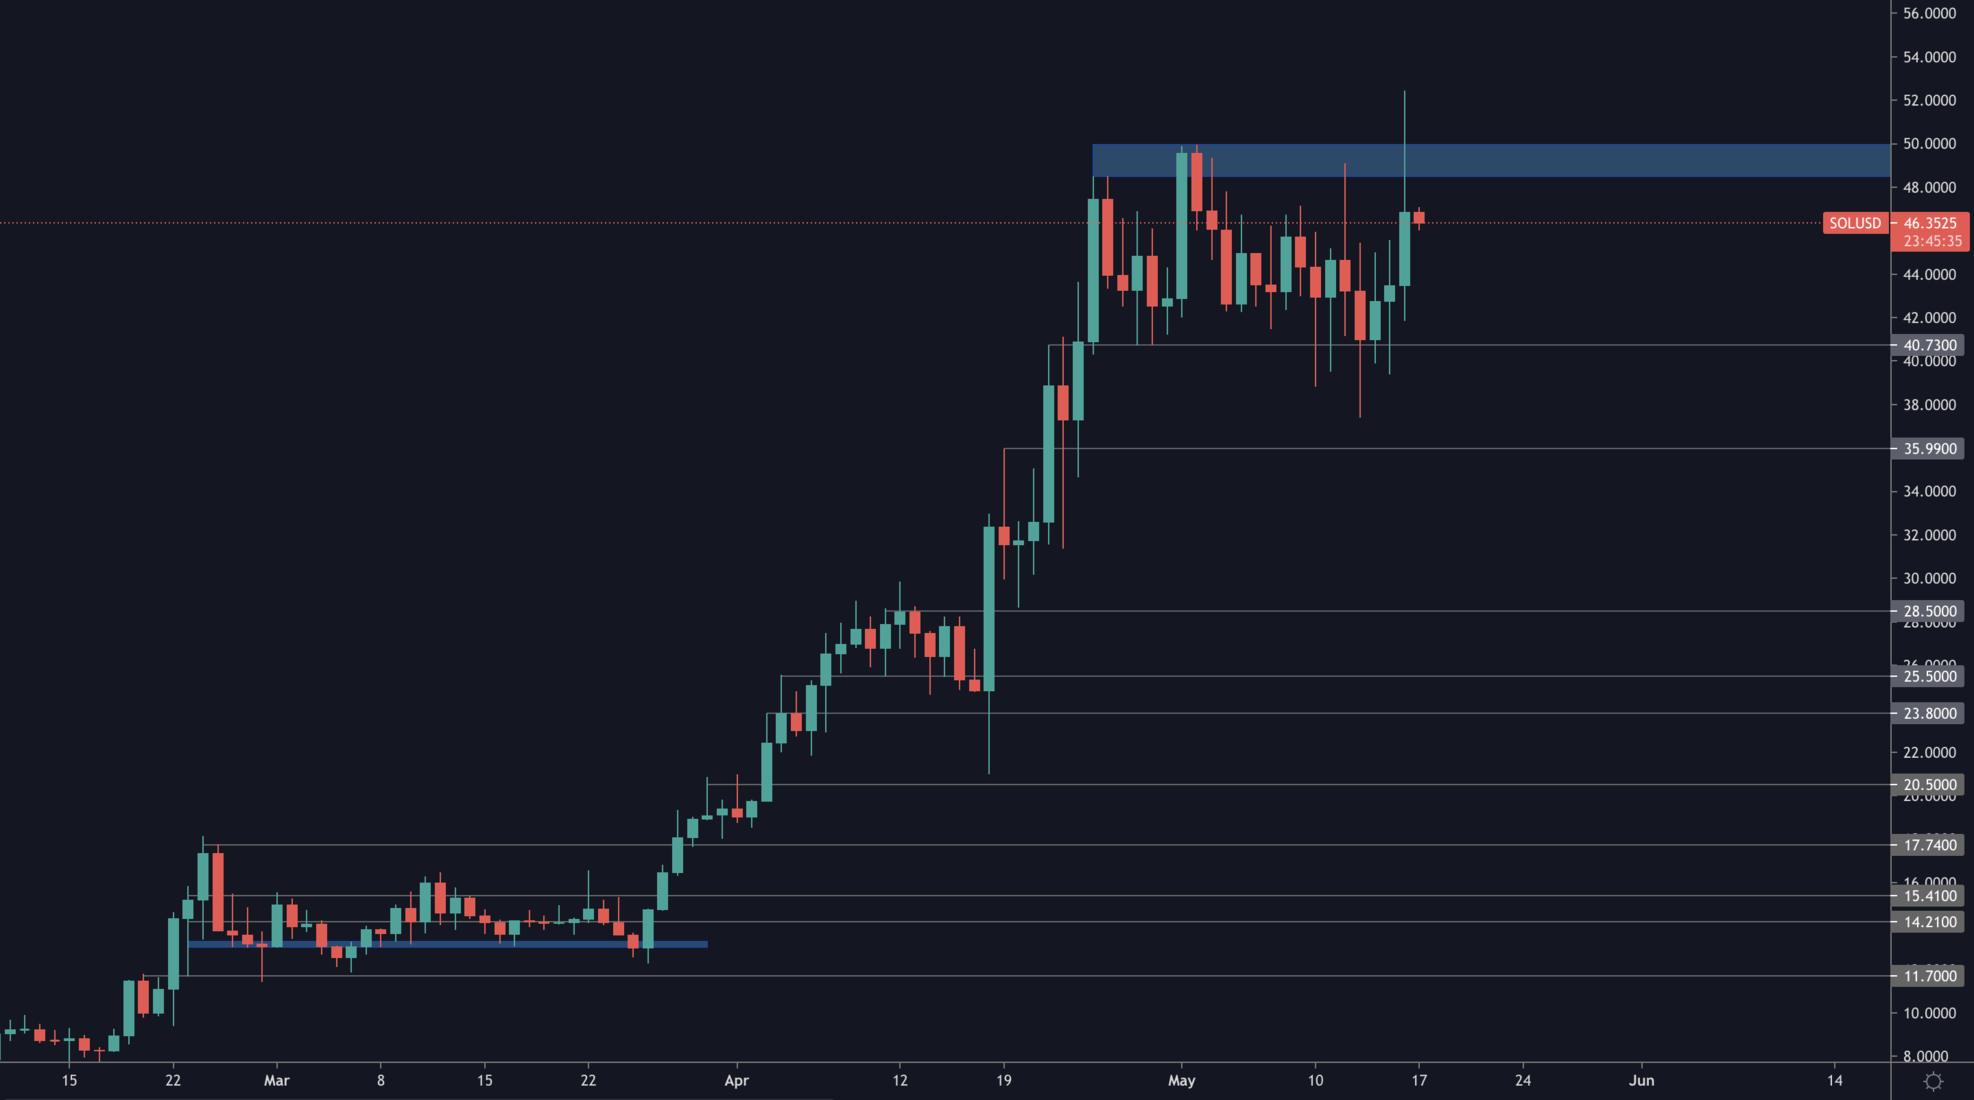
SOL found support and demand at $40.75 and retested $49 as support. The next step required is turning $49 from resistance into support, which would introduce new all-time highs on SOL.
SRM
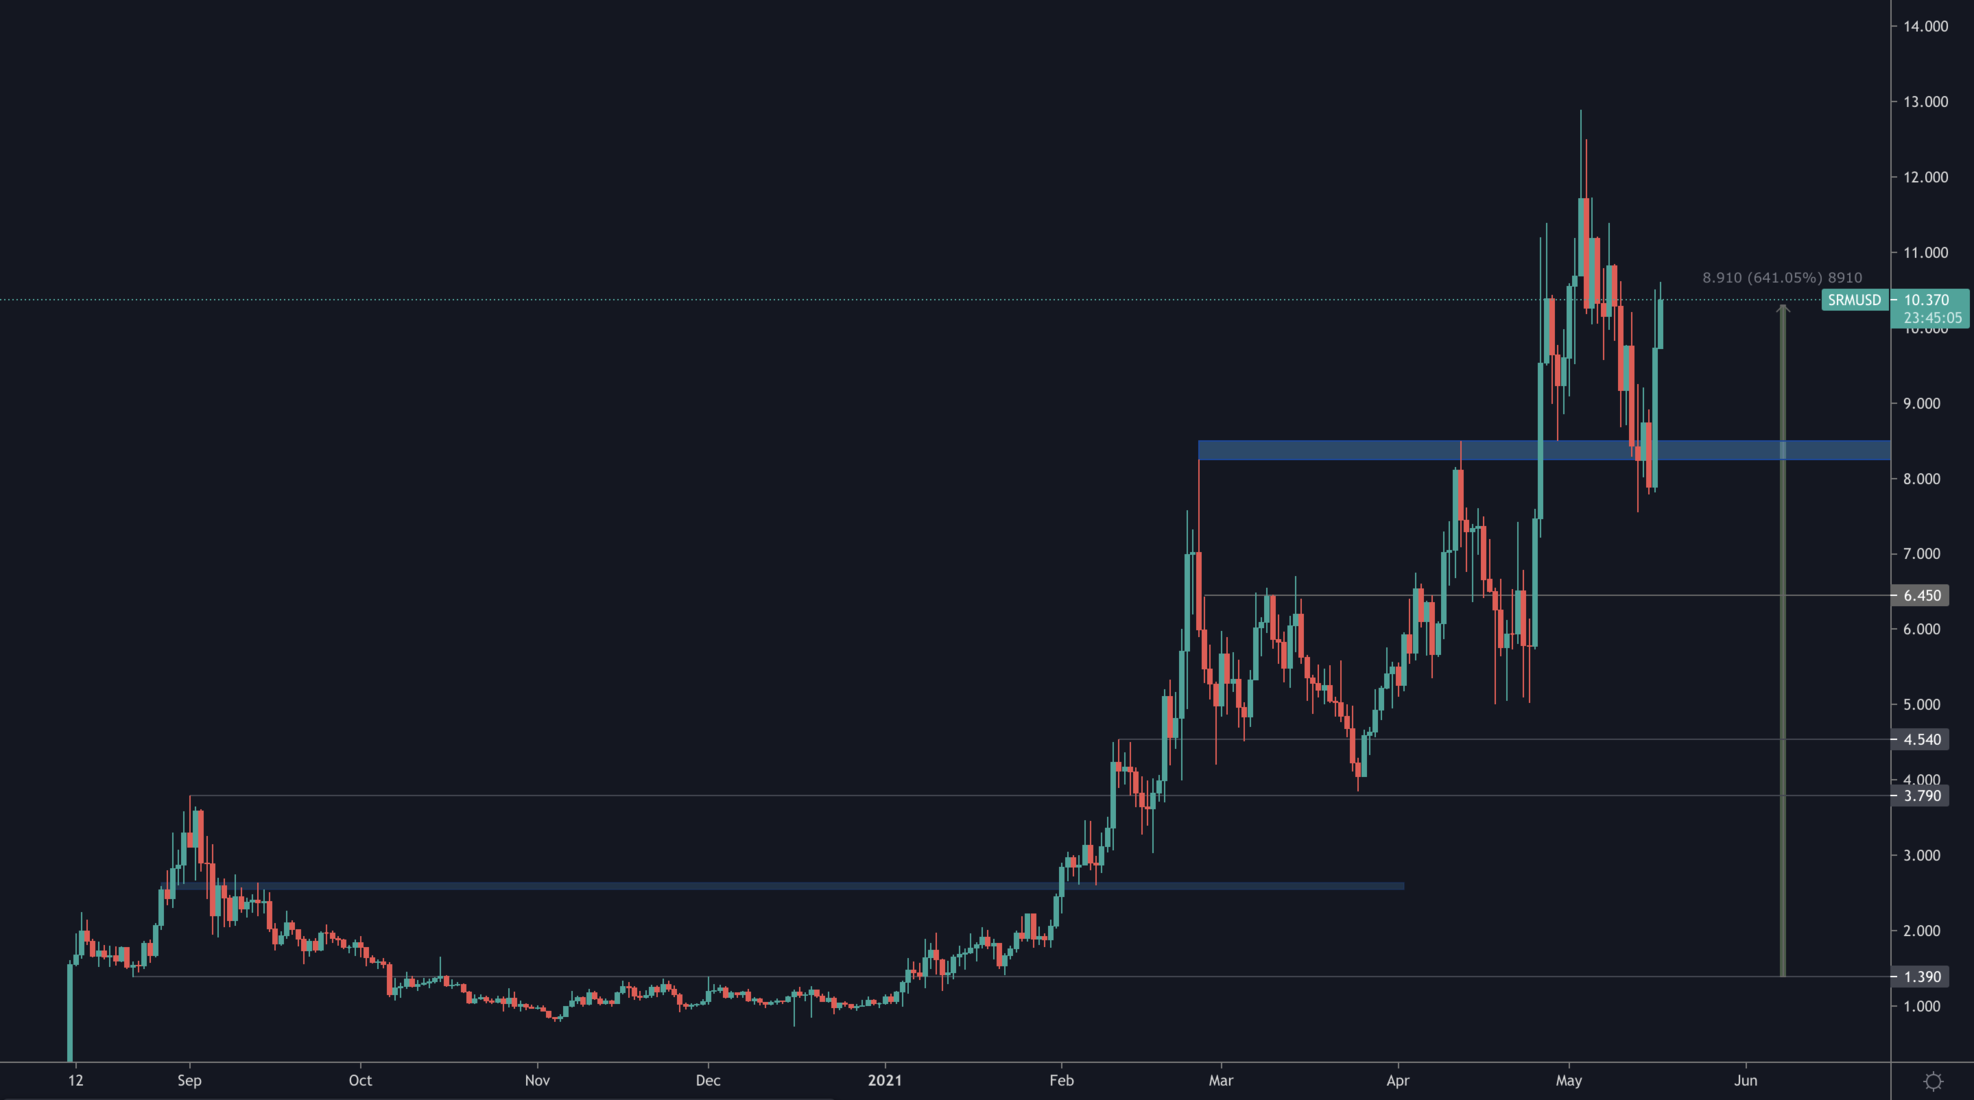
SRM found support at $8.50 and has since had a +23% day. Market structure remains intact and bullish with the higher highs and higher lows.
RAY
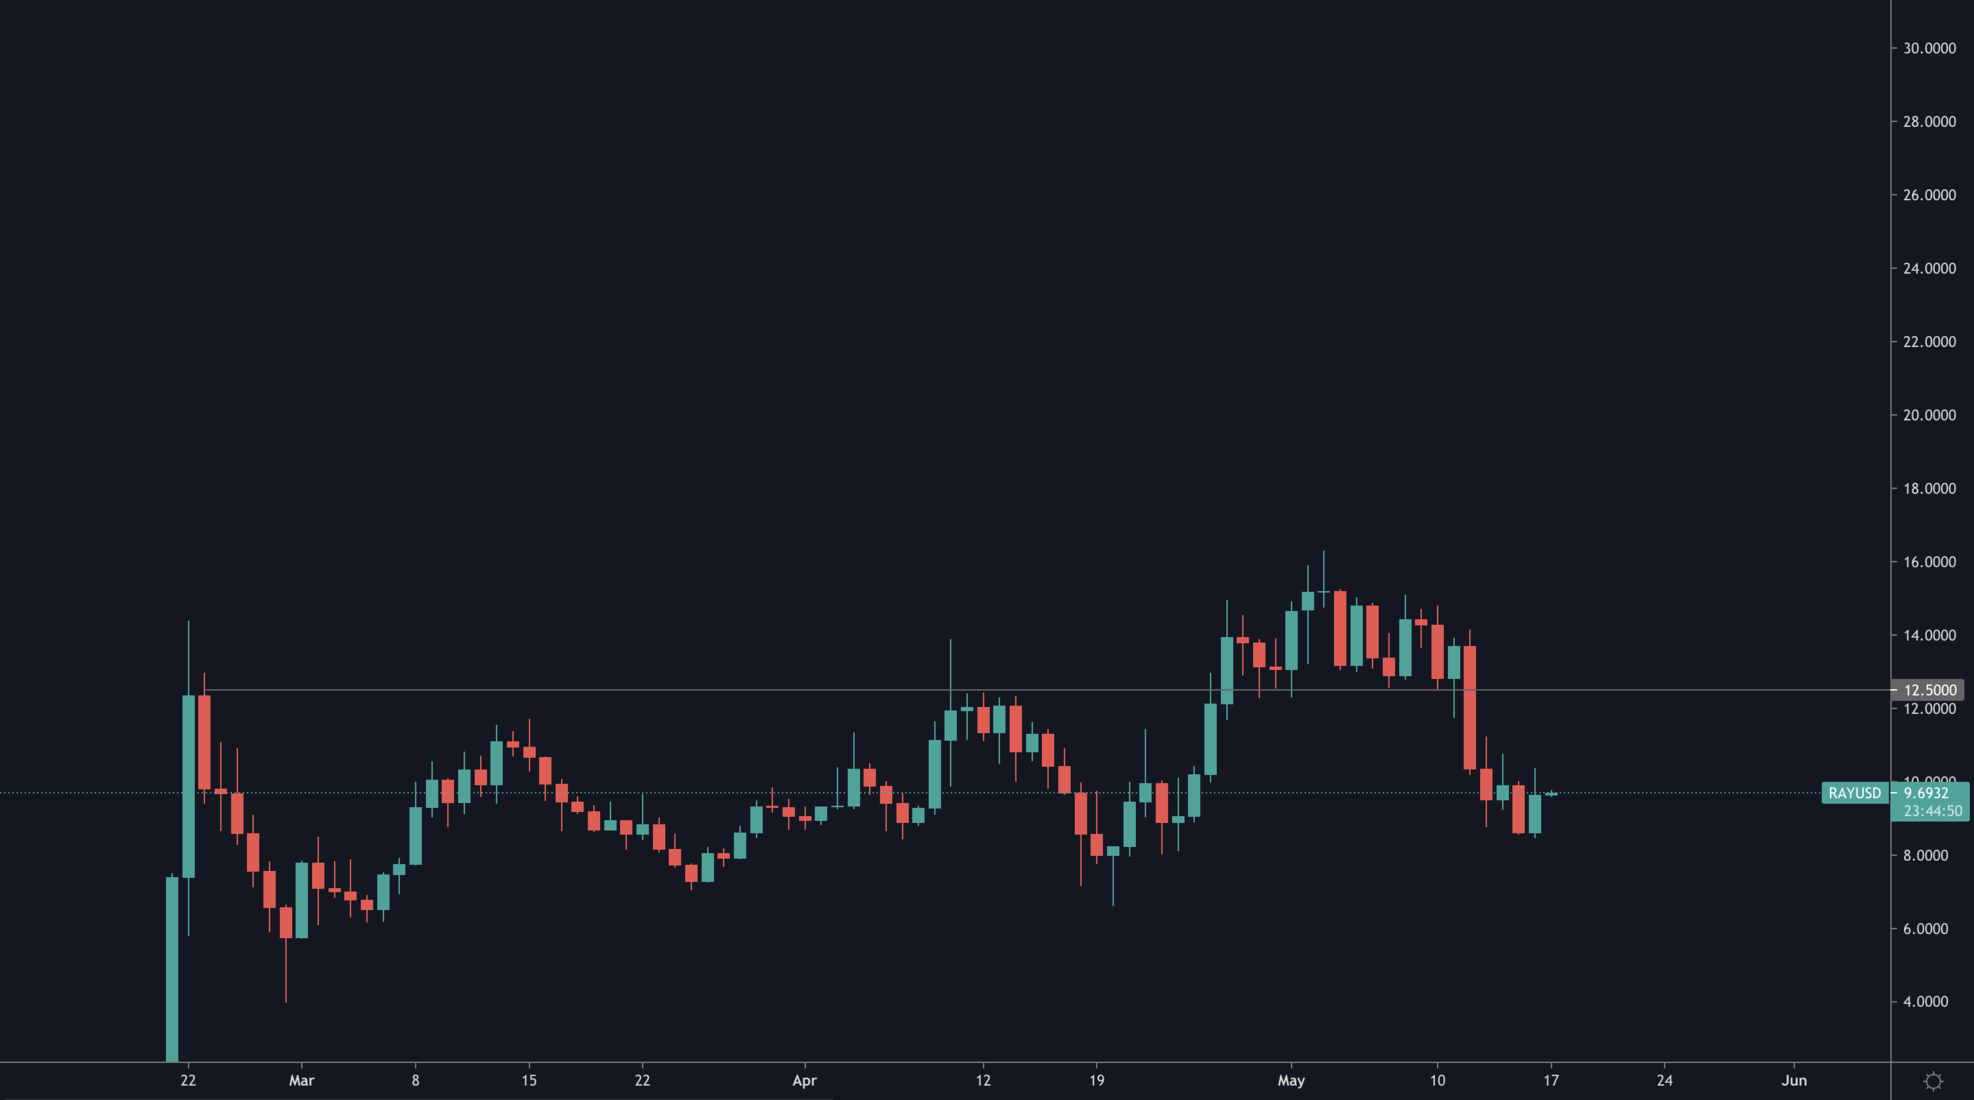
RAY closed a daily candle under $12.50 during the week. With SOL & SRM rallying, RAY would likely join, however we cannot state that RAY is bullish until $12.50 is reclaimed on the daily timeframe.
Recommended from Cryptonary


