Log in

🎄 Cryptonary Christmas Sale! 50% OFF. Save $500 Now Only ⏰ : 0d 23h 13m 9s

Market Analysis

Weekly Technicals Pro - Volume 58

Updated: Aug 31, 2024
Published: May 24, 2021
0
Share:

The current sentiment is Extreme Fear 10 the last time we saw this level was during the March 2020 crash - which in hindsight was a unique opportunity. Extreme levels, fear or greed, do not signal a bottom but they do signal a buying/selling opportunity which tends to pay off over time.

Post Feature Image

TLDR

  • Is this the end of the Bull Market? No
  • What is this? Depends on your perspective/timeframe, we view it as a large opportunity
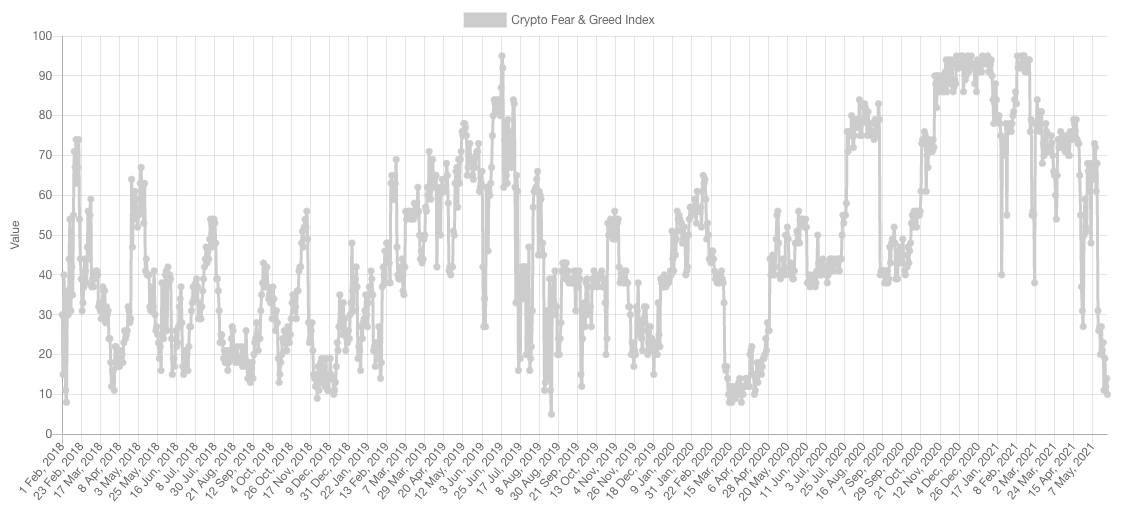
Market Sentiment

aligncenter size-full wp-image-101217

Market Indexes

When in doubt, zoom out.
Nothing says Zoom Out like the weekly timeframe on crypto indices.

Total Market Cap

aligncenter size-full wp-image-101233

The Total Market Cap broke $1.70T and headed towards $1.35T.

If the index breaks $1.35T on the weekly timeframe, then it would head back near $1T which we don't believe is probable. A reclaim of $1.7T would signal a bottom has been set.

To clarify, there can be intra-week wicks under $1.35T without invalidating the setup. The weekly candle closures are what matter.

Altcoins Market Cap

aligncenter size-full wp-image-101235

Much more substantial correction on the Alts MCap and that is frankly fair given the amount of vapourware and dog coins released and counted as part of this index with more weighing than the previous one.

Anything between [$500B-$800B] is a price we consider as a very large opportunity for new entries on fundamentally-sound assets.

BTC

aligncenter size-full wp-image-101211

Bitcoin broke under the $40,000 area of support and tested $30,000.

The weekly candle closure occurred under $40,000 which means that level is now resistance and BTC will likely range between those two levels for a few weeks before breaking one of them - our bet is on an eventual breakout of $40,000 and now a break of the $30,000 level of support (weekly timeframe).

ETH

aligncenter size-full wp-image-101215

ETH has very recently broken out of its 2017 high of $1,430 and entered in official price discovery, thinking a new bear market has begun is quite premature.

Despite ETH having seen a -60% from peak to trough, from a technical perspective it is retesting the previous high as support. It could go as low as $1,500 and remain very bullish in the mid/long-term. Though we don't think $1,500 is probable.

DOT

aligncenter size-full wp-image-101213

No asset was immune to the dip, DOT included. DOT saw a -70% correction from absolute top to absolute bottom. We'll need to see a change in market structure (i.e. turn resistances back into support - with the first one being $19.40). The level that we'd worry about if we saw a break of is $15.

SNX

aligncenter size-full wp-image-101227

SNX, after changing its market structure had another drive down which led it just under $10 where buyers stepped in. We'll need to see a reclaim of $14.10 on the daily timeframe for a swift recovery.

RUNE

aligncenter size-full wp-image-101225

Given its very larger-than-average rally, RUNE also saw a larger-than-average correction of -73% from peak to trough. This is a pure technical analysis report and hence fundamentals are not covered despite their importance. Technically, RUNE set a lower low which change the market structure. For that to change, RUNE would need to reclaim $12.85 on the weekly timeframe as that would signals the end of the downtrend. Sharp corrections of this magnitude don't recover immediately, so a few weeks of indecision is probable.

FTT

aligncenter size-full wp-image-101219

Seeing this chart alone would make us think crypto is entering a bear market but we know a single altcoin cannot determine that, rather the indices + BTC/ETH do. Given the magnitude of the correction, relative to the rally, would state that FTT is likely to see a test of $20.50 over the next few weeks before beginning a recovery alongside the rest of the market.

SOL

aligncenter size-full wp-image-101229

Market-wide correction sent SOL down by -67% but every time there was a relief rally, SOL advanced substantially in price which shows large demand. Given the correction, retail money is now scared and therefore SOL Hype Season is on hold until further notice. The only assets we're still holding from this ecosystem are SOL & SRM.

SRM

aligncenter size-full wp-image-101231

Very large correction but SRM is now retesting the $3.79 all-time high breakout once again. That key level would need to hold or else SRM would enter further devaluation towards $2.50 and possibly $1.39 - conditional on $3.79 holding/breaking.

RAY

aligncenter size-full wp-image-101221

We reduced our exposure by 50% on RAY as soon as there was a daily candle closure under $12.50 and our final invalidation was a weekly closure under $5.75 which occurred and we now own 0 RAY. That capital (on which we took a loss on), we rotated and invested into ETH for a bit more holdings.

XRP

aligncenter size-full wp-image-101237

XRP needs to see $0.79 hold on the weekly timeframe or else it may correct towards $0.45. For a recovery, a reclaim of $1 is required.

Get started for free

Create your free account or log in to read the full article.

By signing up, you agree to our Terms & Conditions
Recommended from Cryptonary
Market Pulse: Bitcoin's Security Under Debate
Market Pulse
Market Pulse: Bitcoin's Security Un...Speculation around quantum computing threats to Bitcoin is ramping up, shaking confidence just as ri...
2 min read
Dec 19, 2025
AMA with Adam & Abror: 18th december
PRO
Livestreams
AMA with Adam & Abror: 18th decembe...In this conversation, Abror and Adam discuss the recent inflation data and its impact on the market,...
1 min read
Dec 19, 2025
Market Pulse: Inflation Data is Out!
PRO
Market Pulse
Market Pulse: Inflation Data is Out...Inflation came in well below expectations, shifting focus from price pressures to the labour market....
4 min read
Dec 18, 2025