Save 23% ($351) & Get a Free 1-1 Call with our Team ⏰ : 0d 2h 59m 43s

Market Sentiment
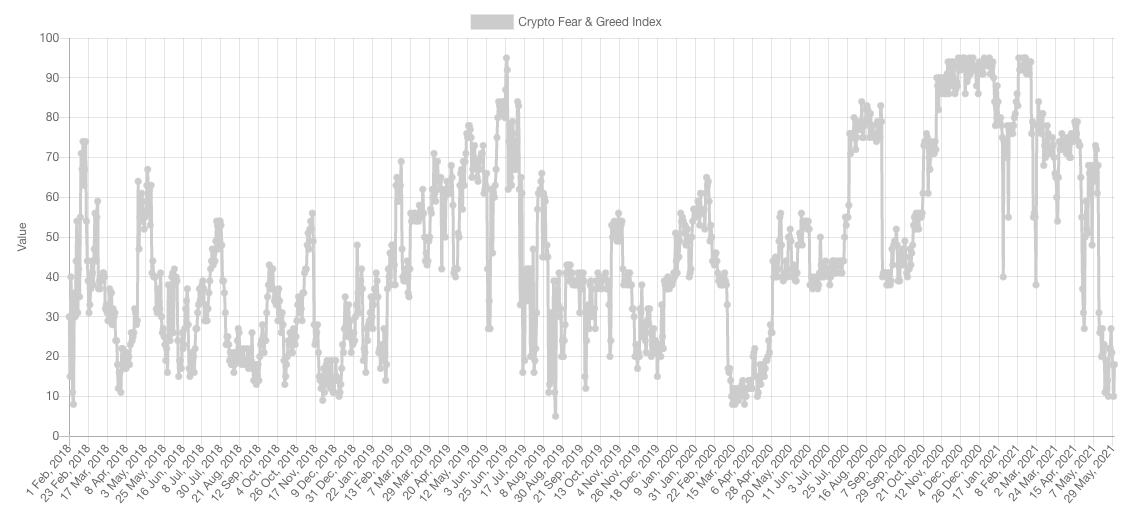
- Nov/Dec 2018 Capitulation BTC fell to $3,200
- March 2020 Crash when BTC fell to $4,000
In hindsight, buying Extreme Fear has been quite profitable for patient market entrants.
Market Indexes
Total Market Cap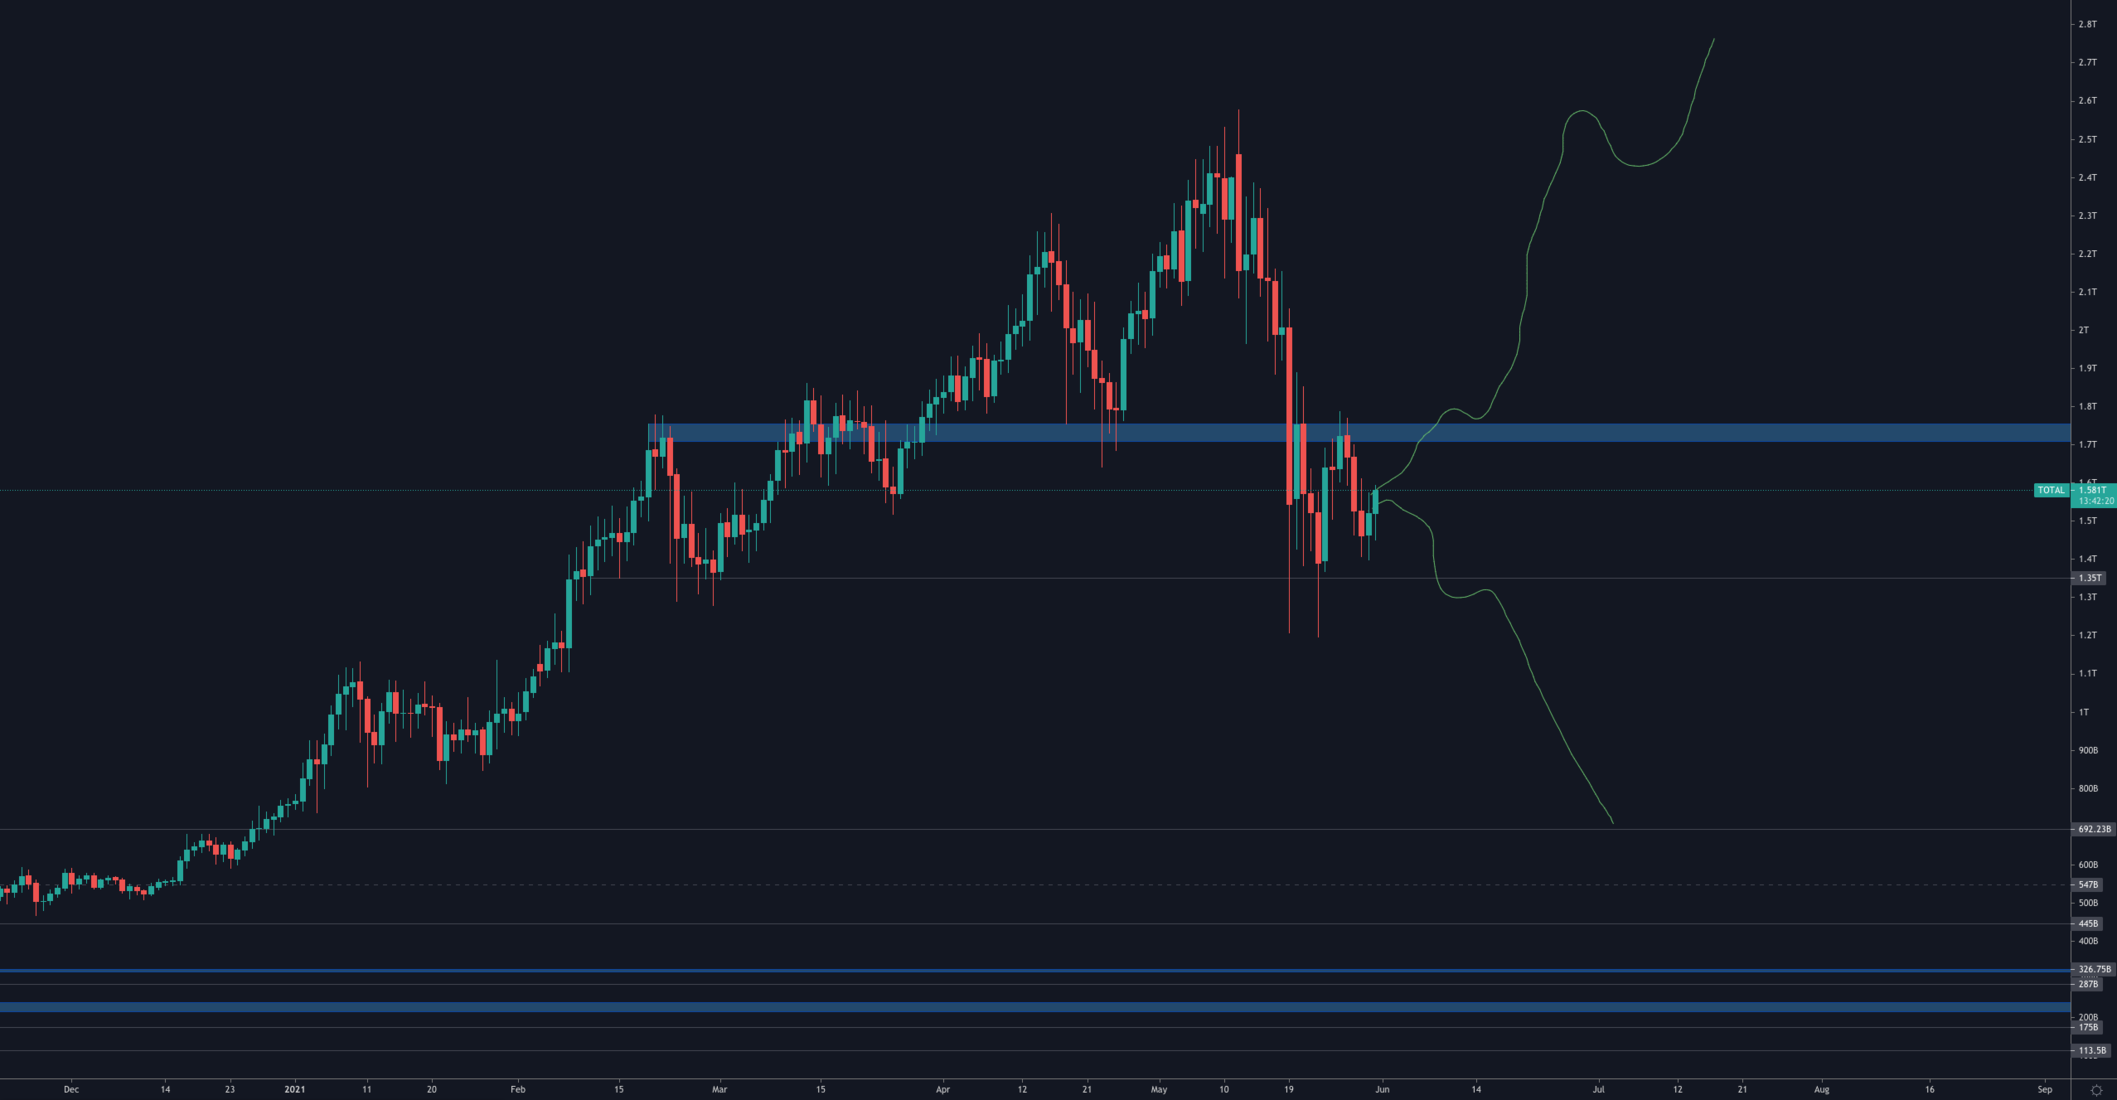
The Total MCap has two potential routes:
- Reclaim $1.7T and rise back towards ATH & beyond
- Break $1.35T and test the 2017 highs near $800B
Given the level of fear we're witnessing, in addition to unchanged fundamentals, our bet is the former scenario would play out.
Altcoins Market Cap
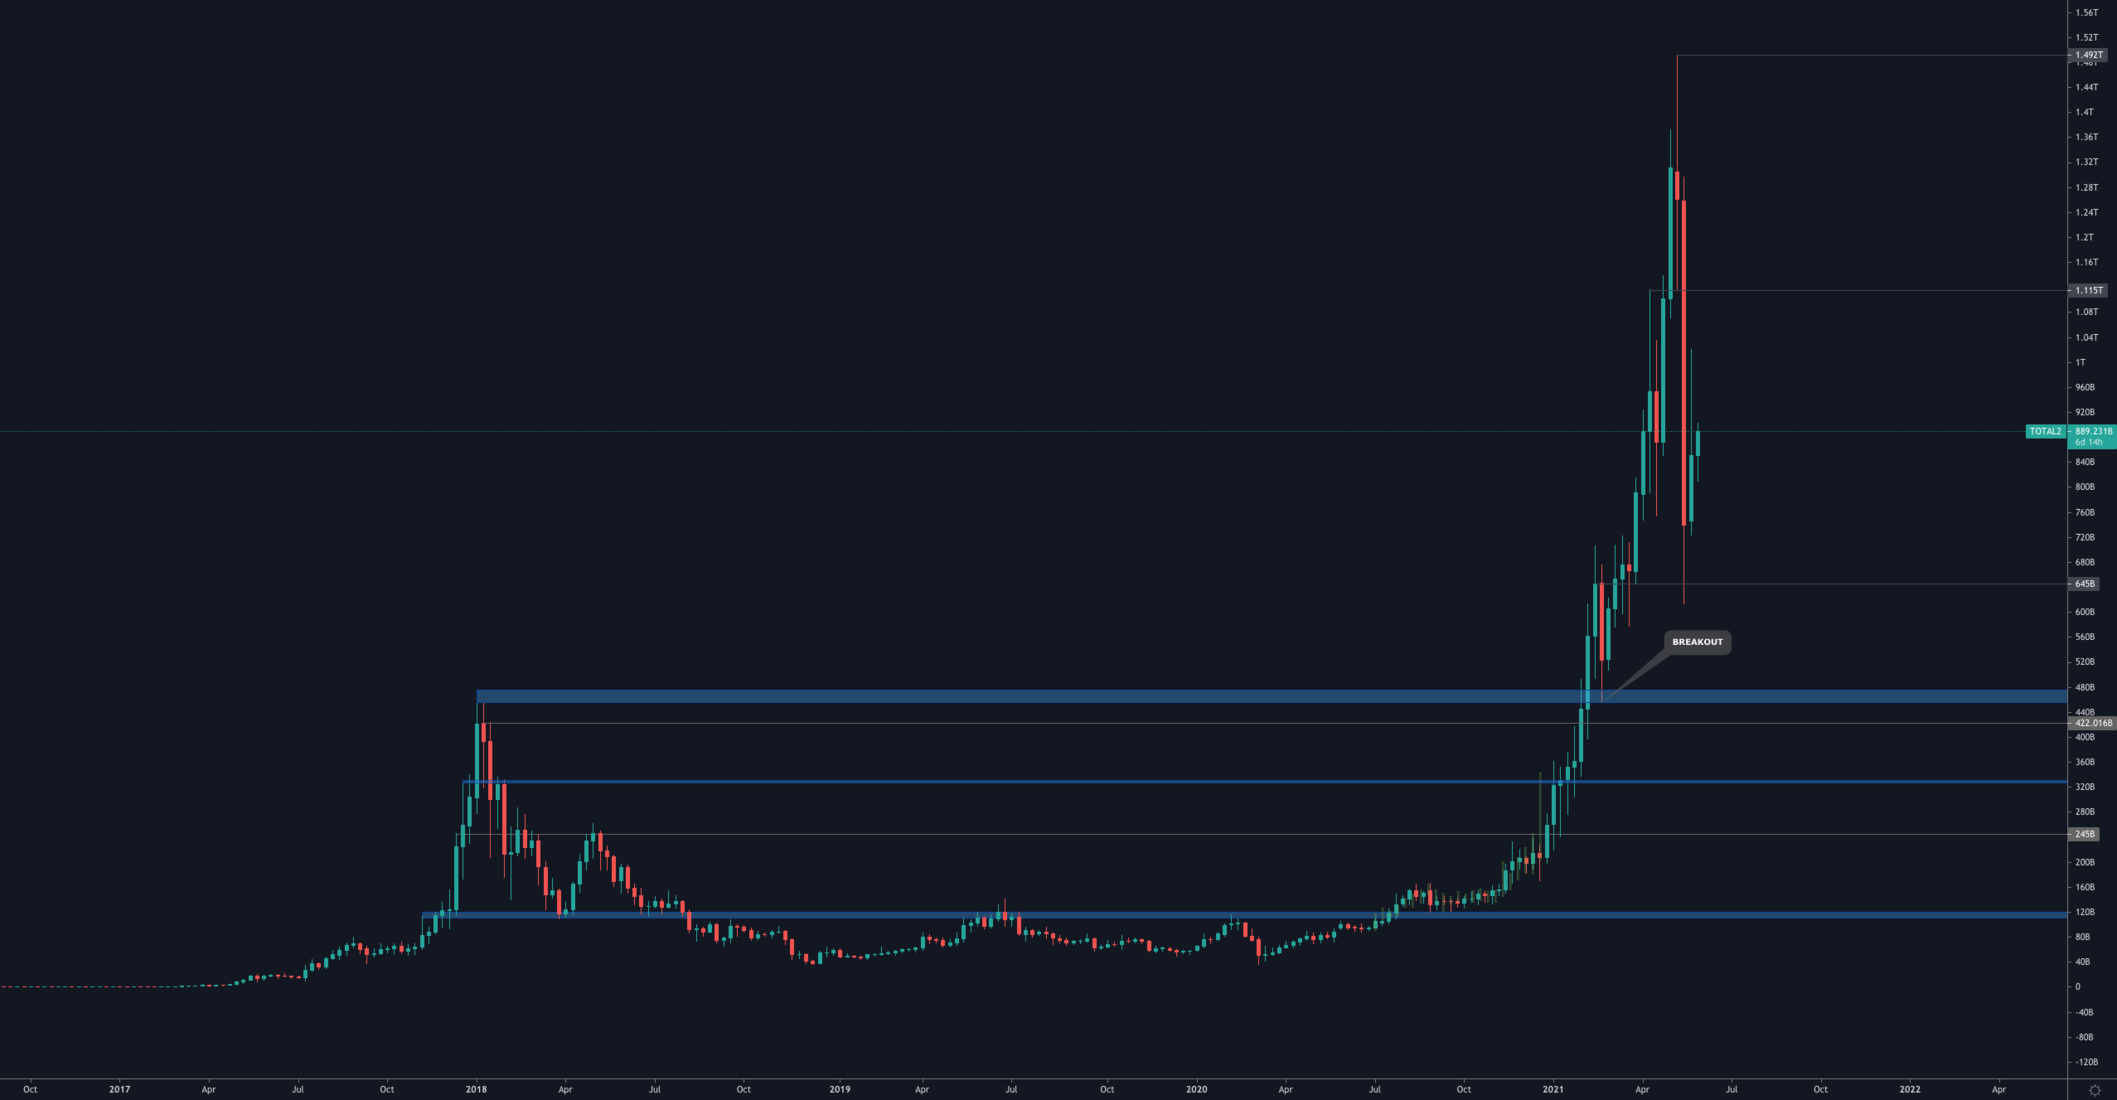
Throughout this recent rally, the Alts MCap has set key levels along the way which we've plotted on the chart. Price tested $645B and found good demand lying there which has boosted prices and on a weekly timeline we expect the next level, $1.115T to be hit next. Once that's done, it becomes a matter of whether demand is strong enough to reclaim it or not.
Bitcoin
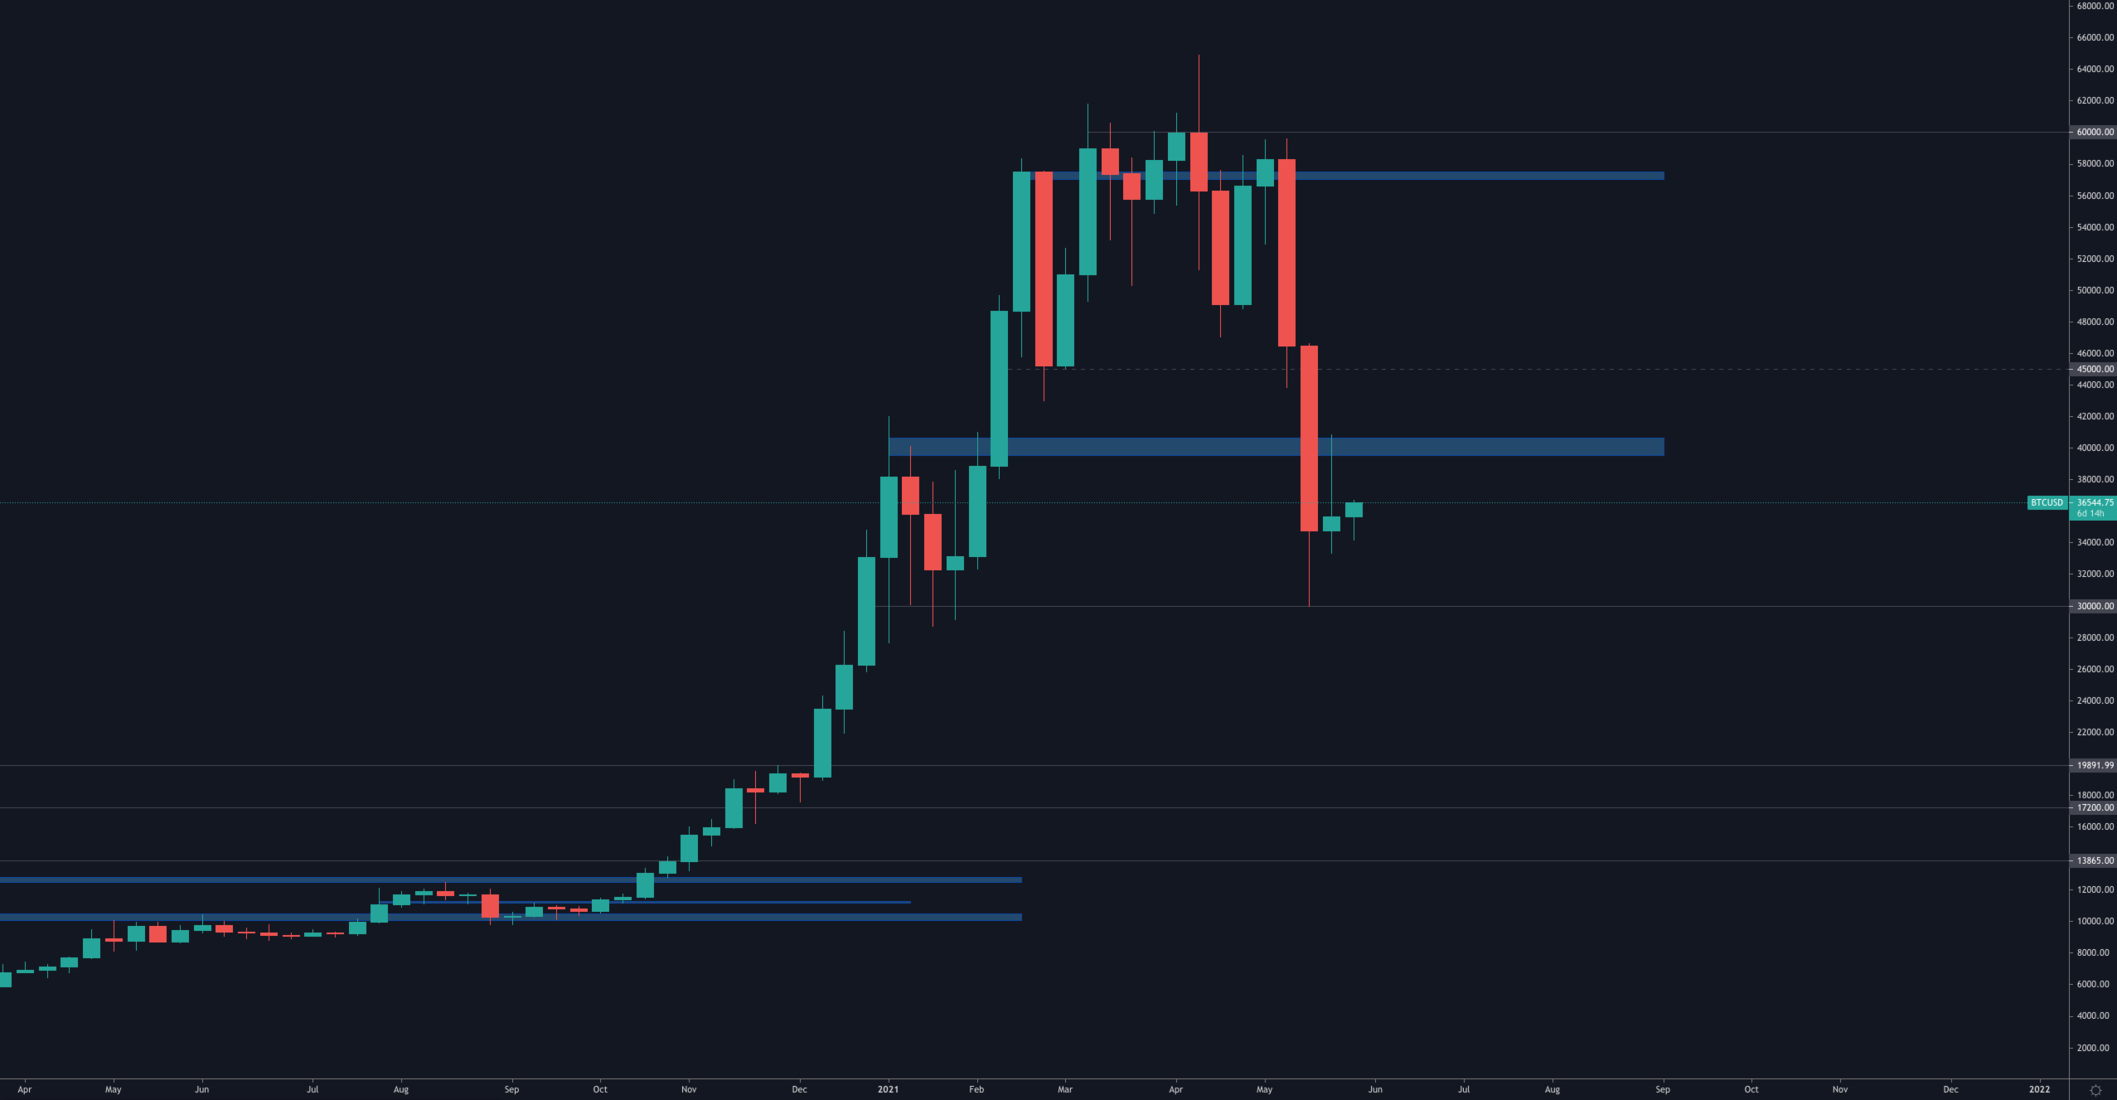
Bitcoin's weekly chart is showing indecision on the latest candle closure. $40,000 acted as resistance and sellers stepped in, while $30,000 held quite precisely and demand was strong. Let's dive deeper into the daily timeframe.
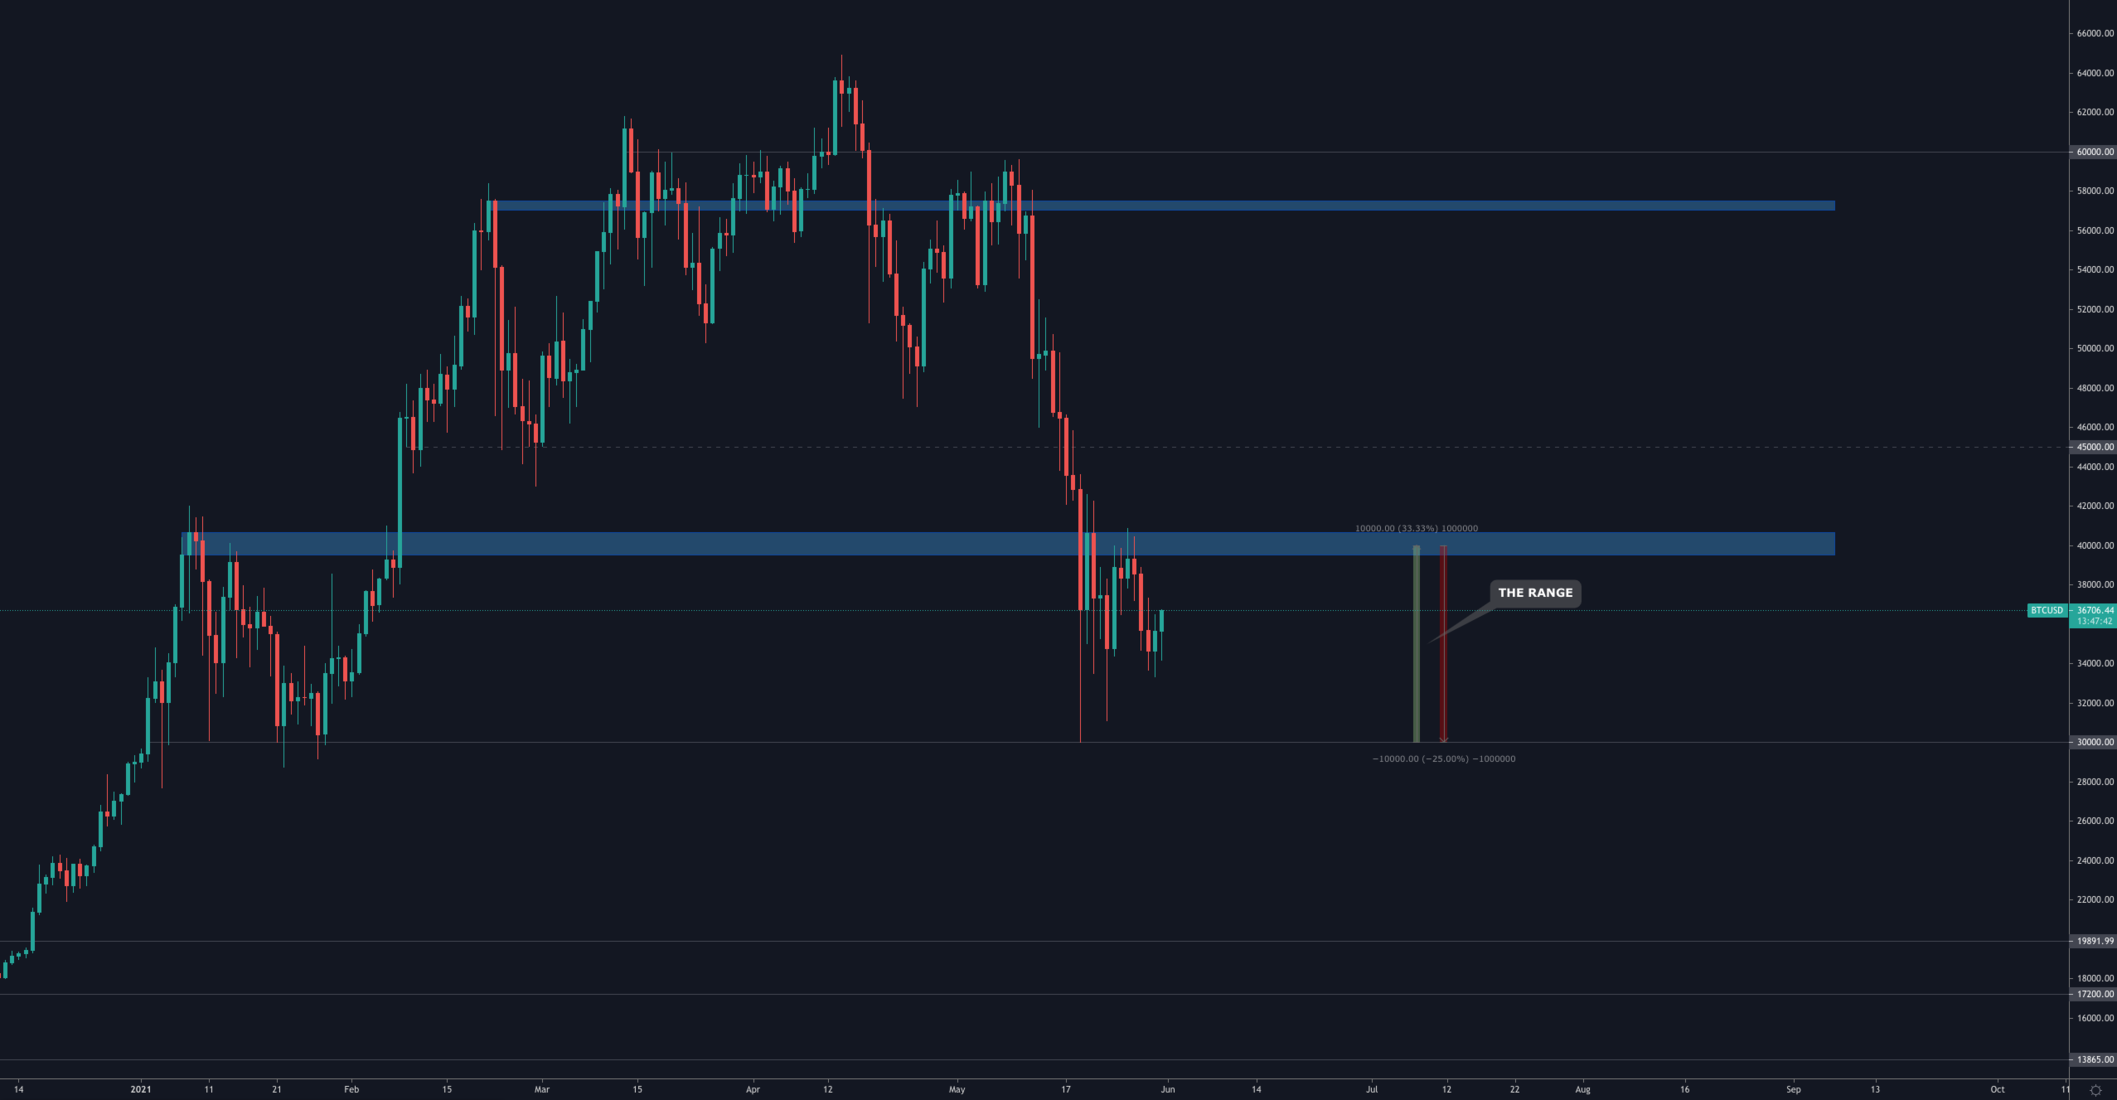
Bitcoin's price action is now range bound between $30,000 & $40,000. This si a direct reflection of what we are seeing on the Total MCap with $1.35T and $1.7T. The breakouts would coincide and our bet that after a lengthy/boring consolidation, an upside breakout would take place.
Ether
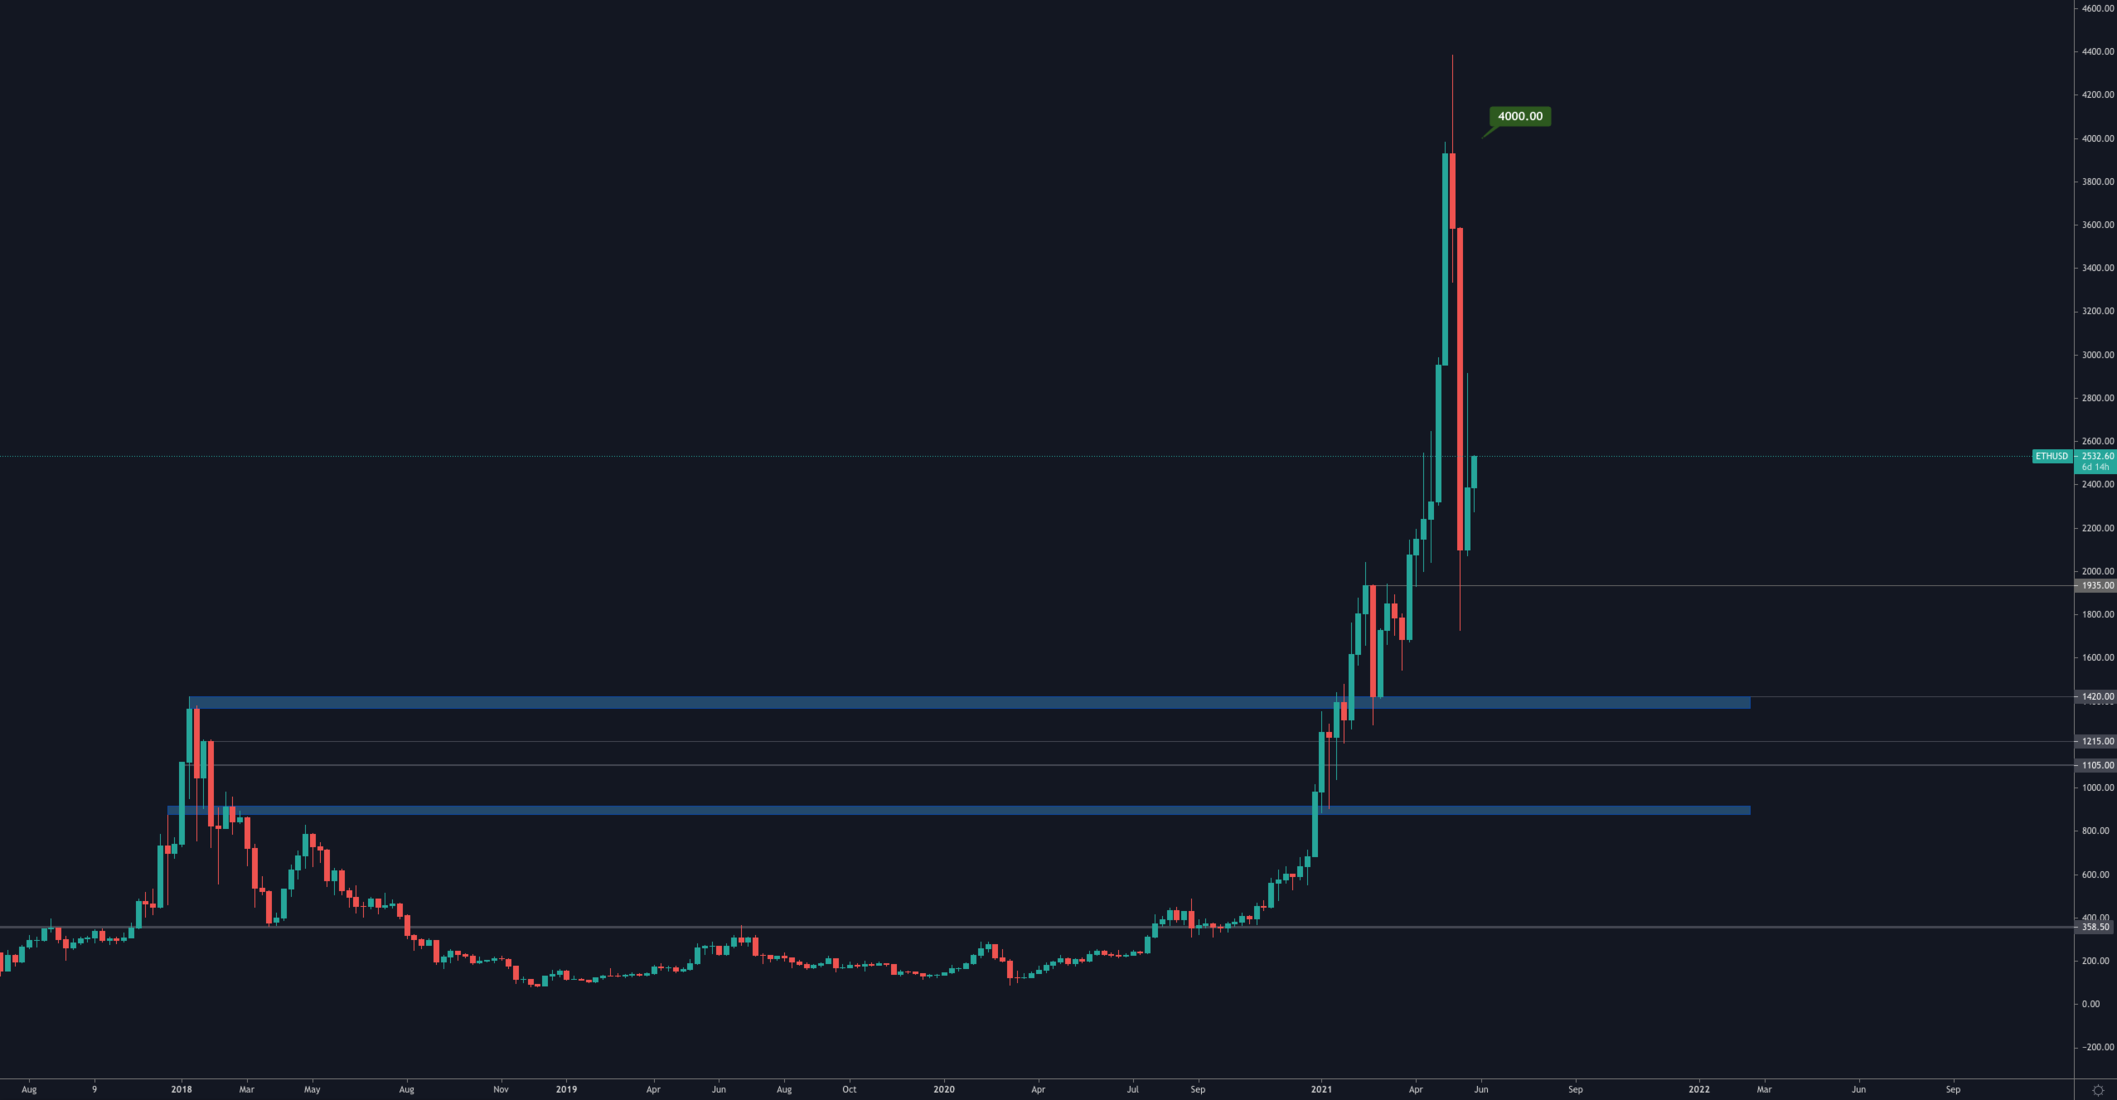
Despite the severe magnitude of the correction, ETH is still holding a bullish market structure as it has only tested a previous high without breaking the Higher Highs/Higher Lows structure. We expect a full recovery to take place on ETH, which will take multiple weeks and won't be very swift, recoveries never are.
DOT
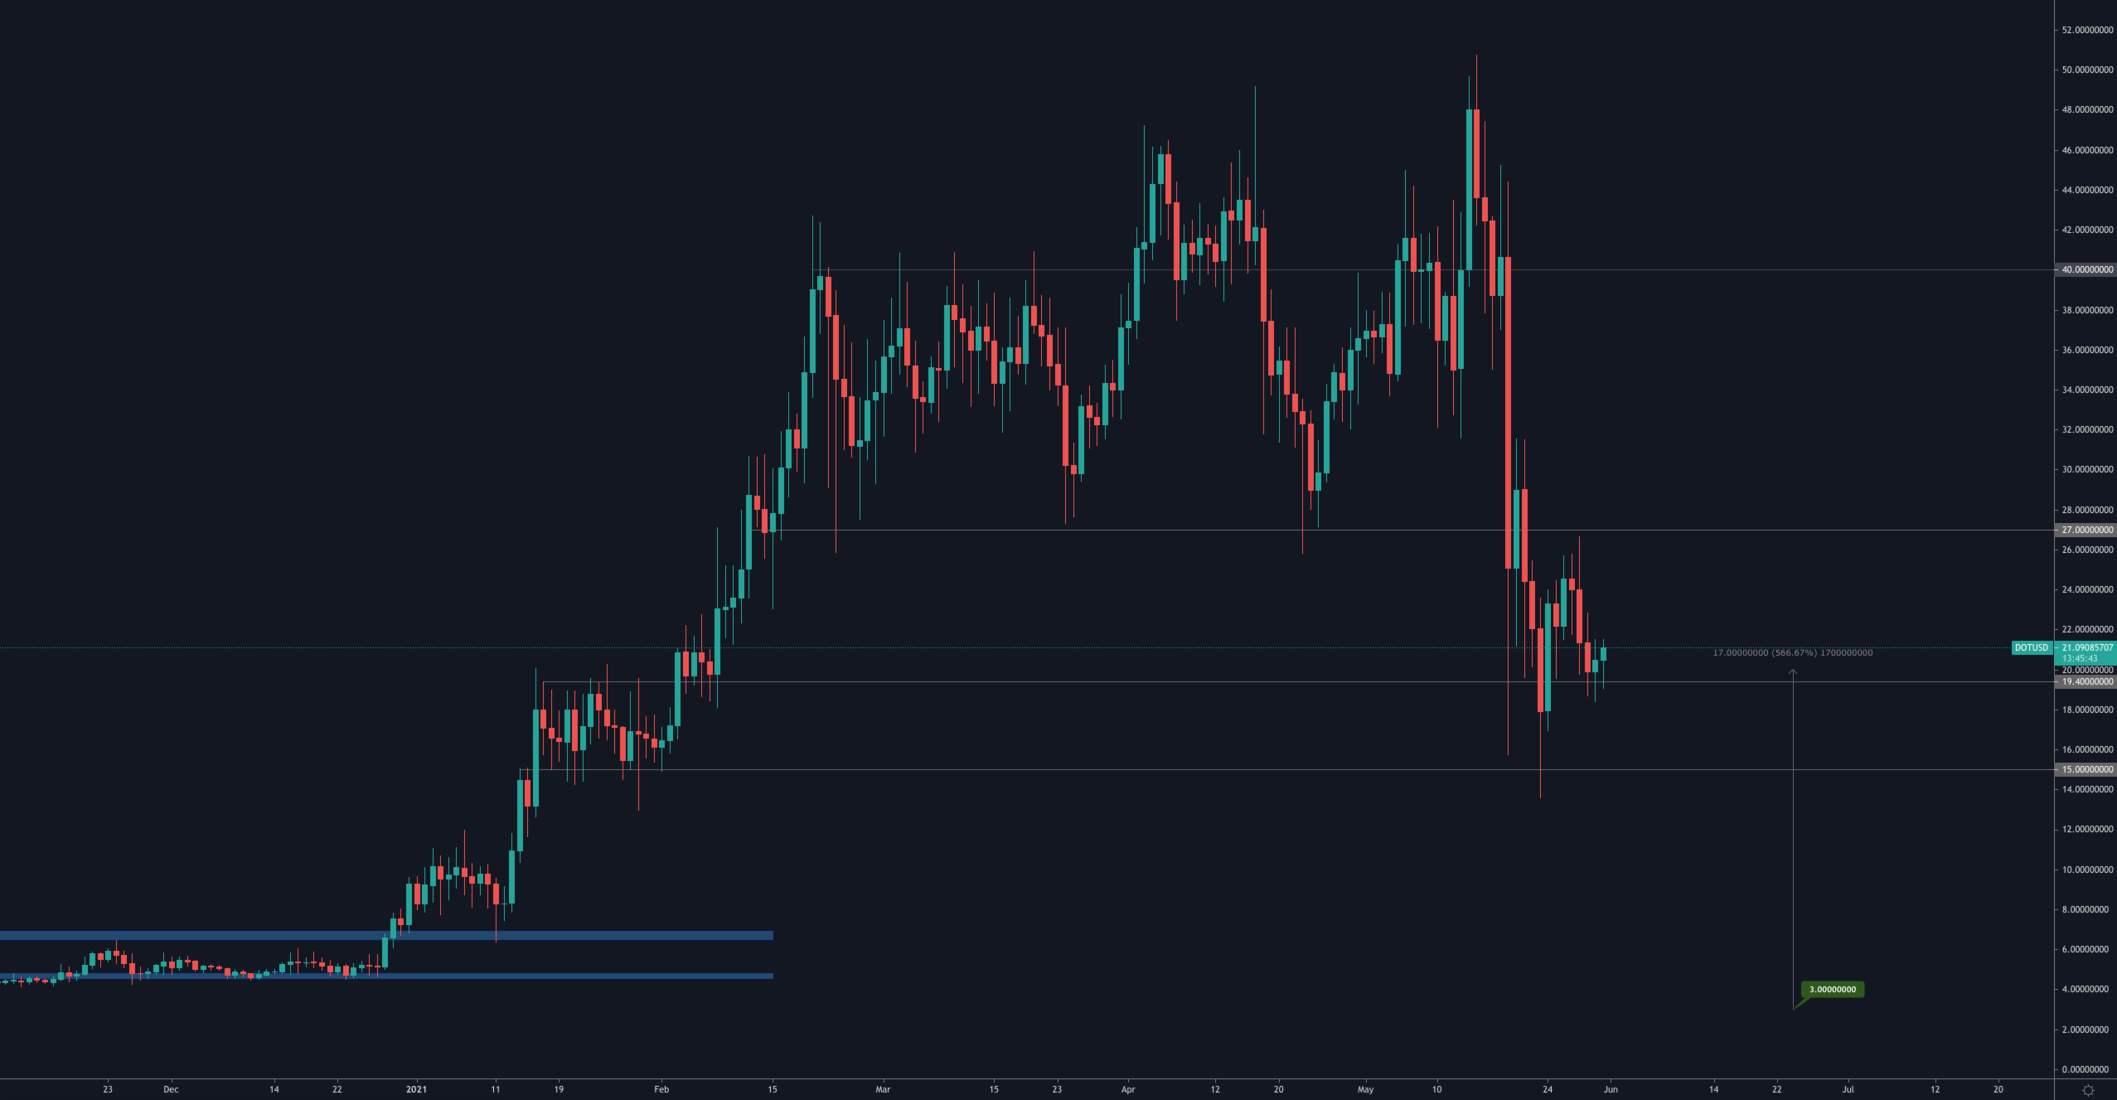
Through the correction, DOT tested $15 before reclaiming $19.40. Now the aforementioned level has been reclaimed and is being tested as support on the daily timeframe. From a pure technical perspective, this calls for $27 to be tested next with invalidation by daily closure under $19.40.
SNX
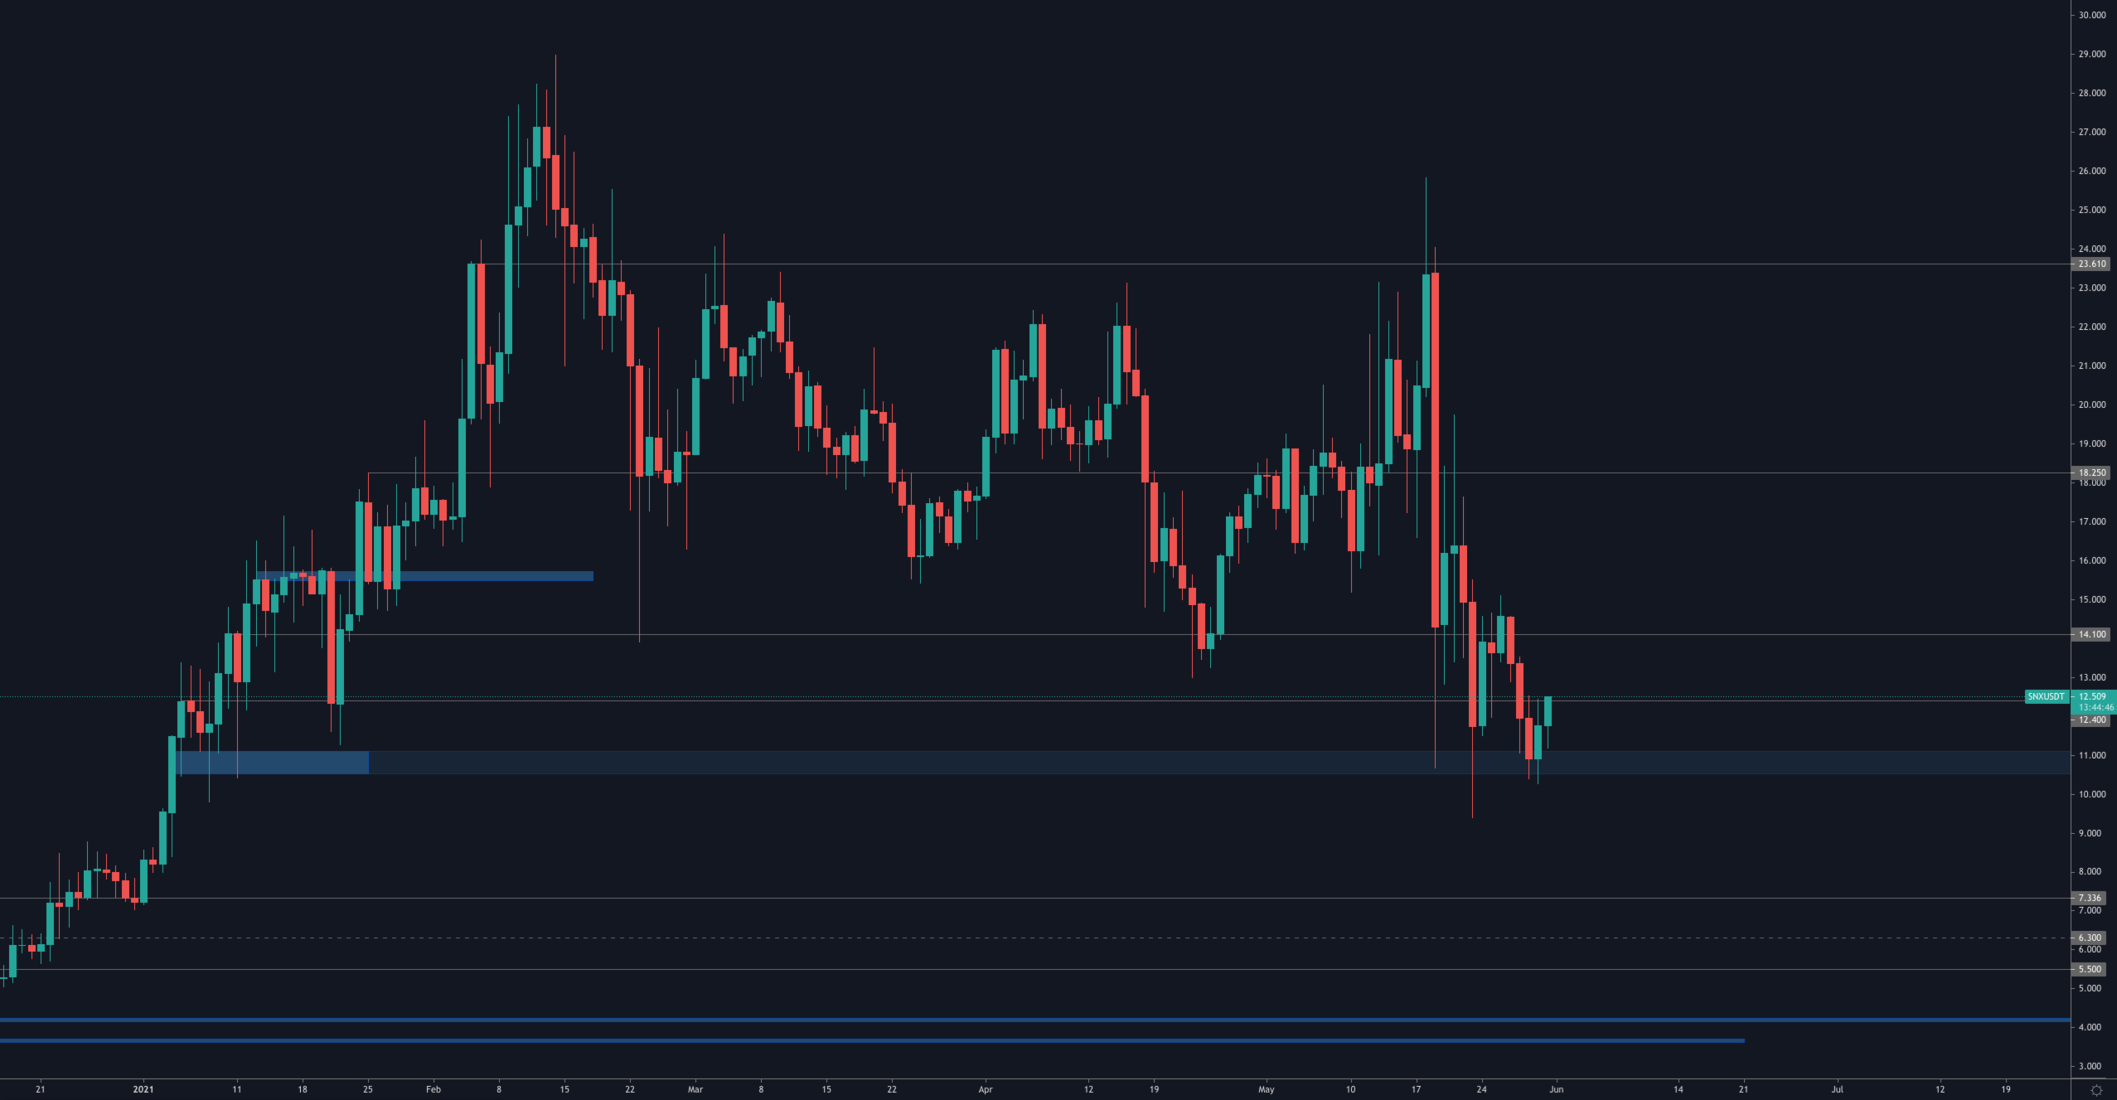
Like many other Altcoins, SNX is at the edge of a level where if it breaks, there's another -30% downside. For SNX that level is ~$10.50, which also happens to coincide with the psychological level of $10. On shorter timeframes, SNX seems geared for a leg to the upside which would help it reclaim $12.40 on the daily timeframe.
RUNE
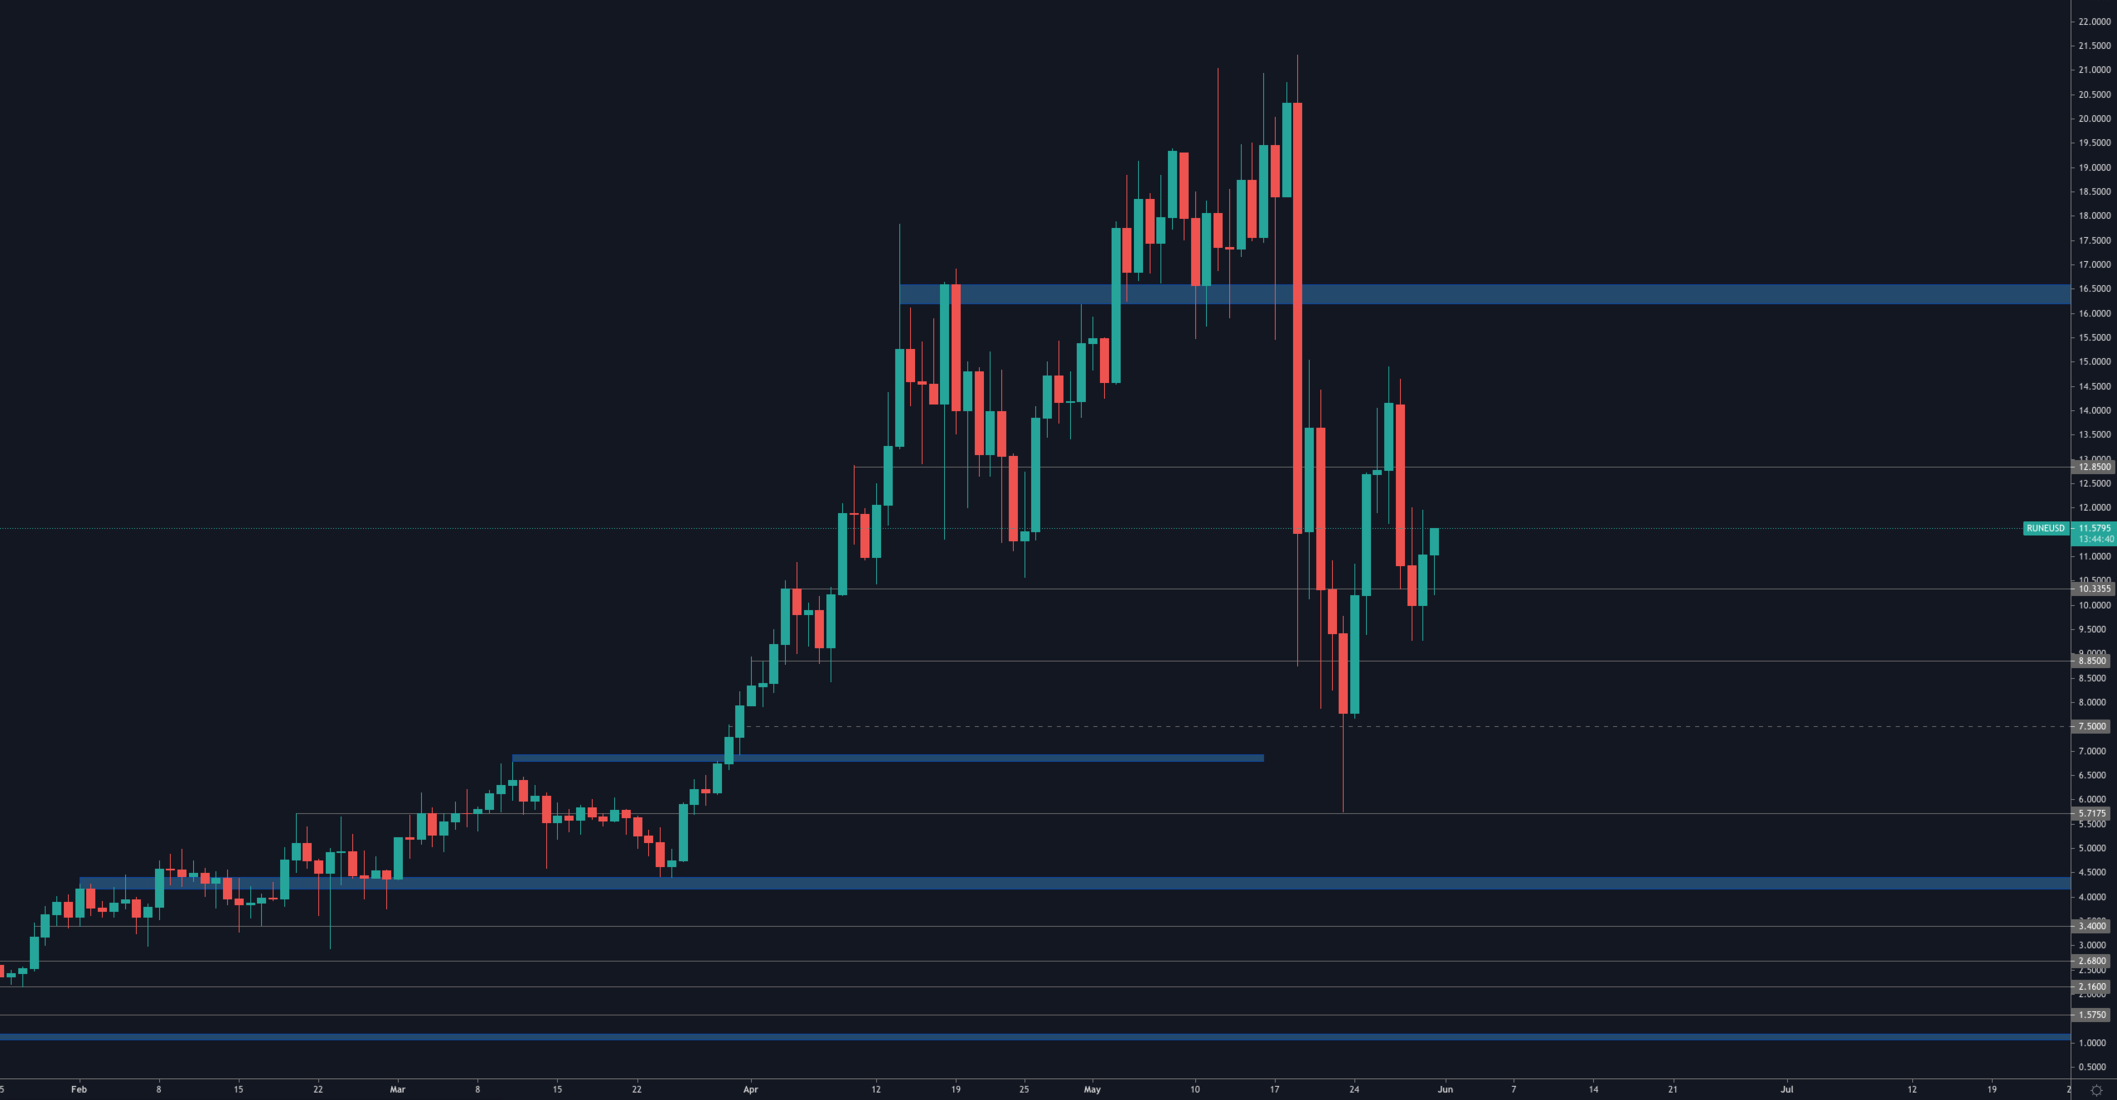
Buyers have been stepping in quite strongly into RUNE on even the smallest BTC bounces - this is a show of demand, which signals that the quickest recovery may be seen on RUNE. The level of main interest has been ~$10 and price has flipped it into support once again which means the next upcoming level is likely to be $12.85. The latter is where price recently failed but if it is able to reclaim it, then $16.50 would be next. Conversely, if $10 were to break, then another test of $8.85 would be on the cards.
FTT
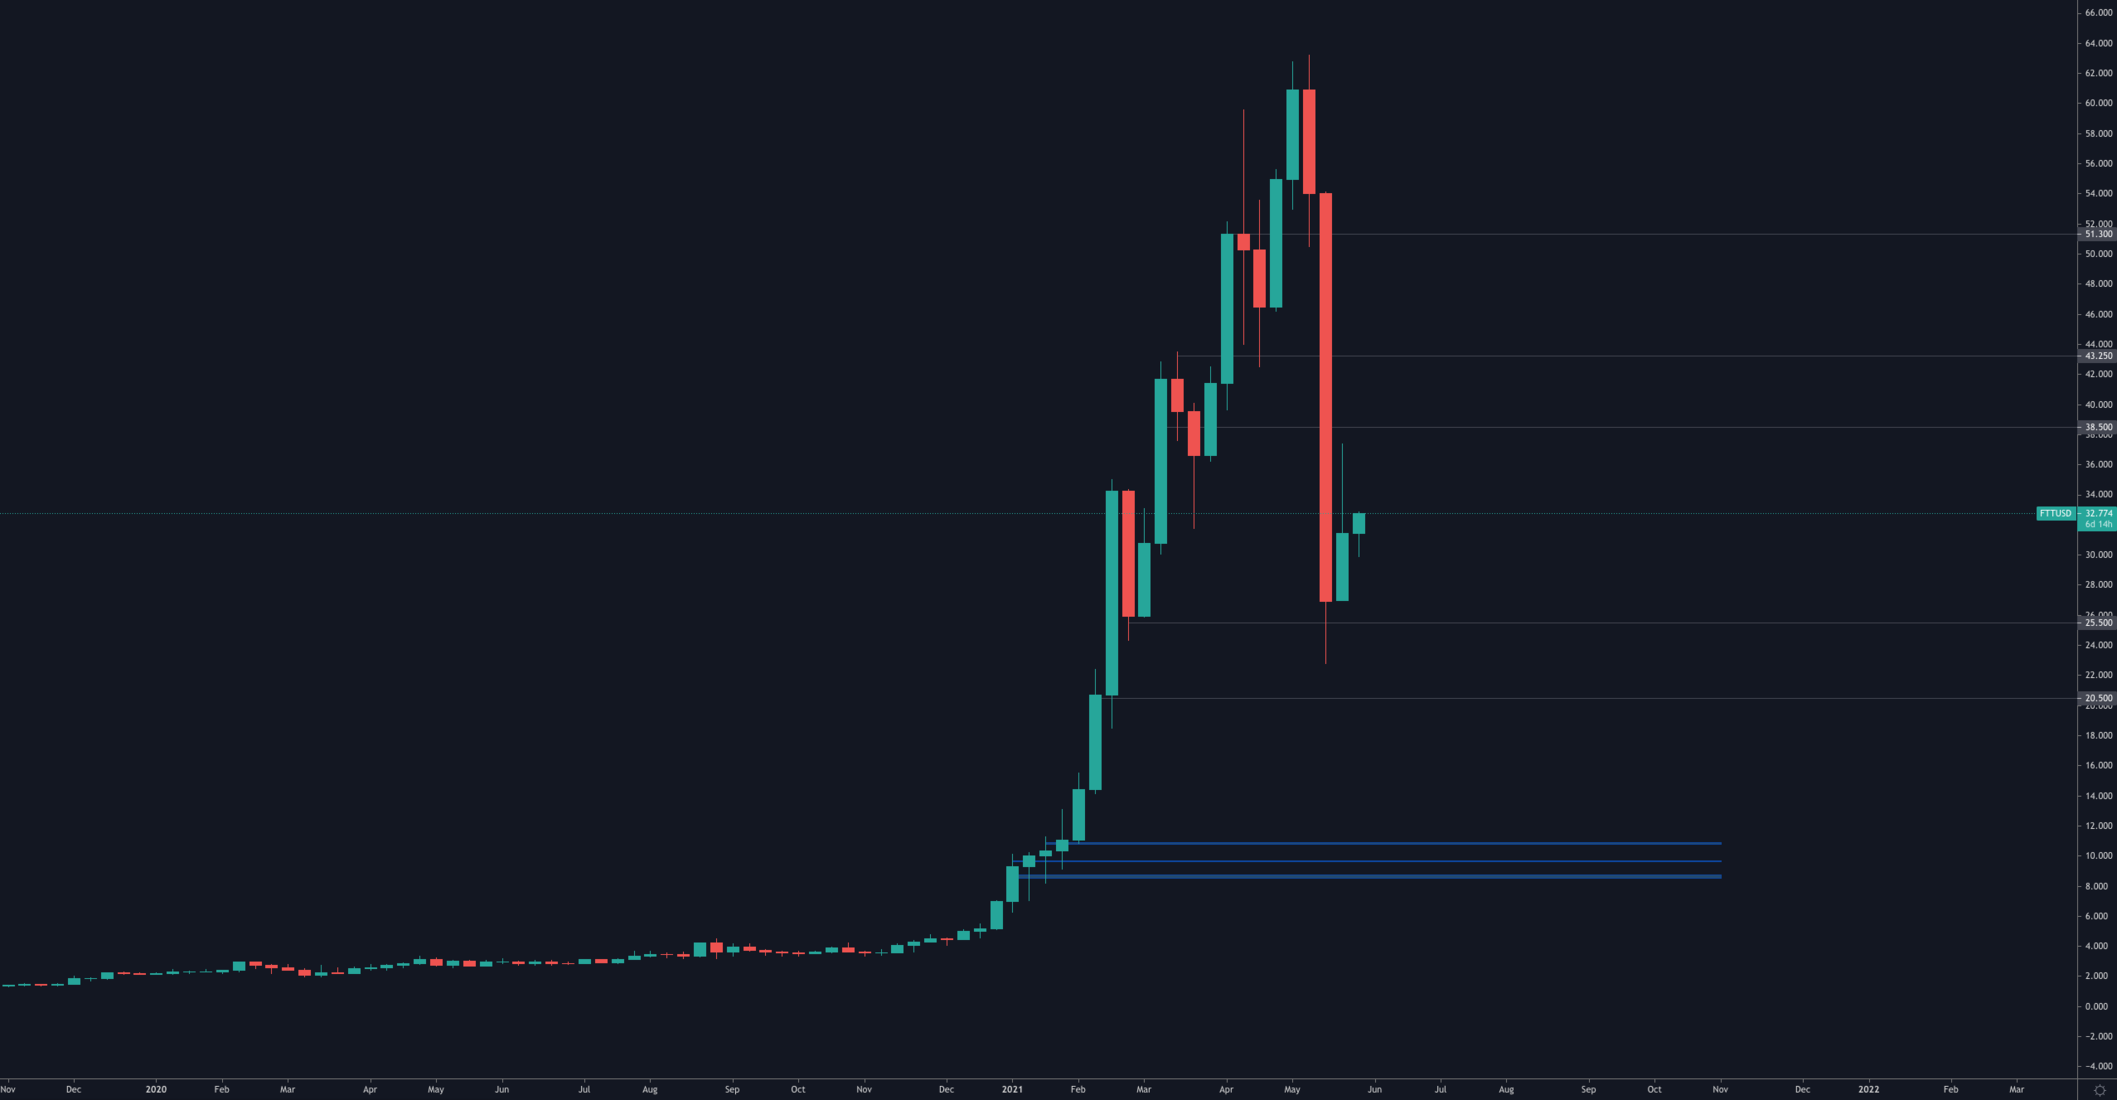
FTT's weekly chart does not look pretty by any means. However, if the top were to be in (which we speculate is not the case), $25 is the area that offers the largest bounce and the first bounce tends to be the largest. We speculate in a few weeks time, FTT would test $43 once again.
SOL
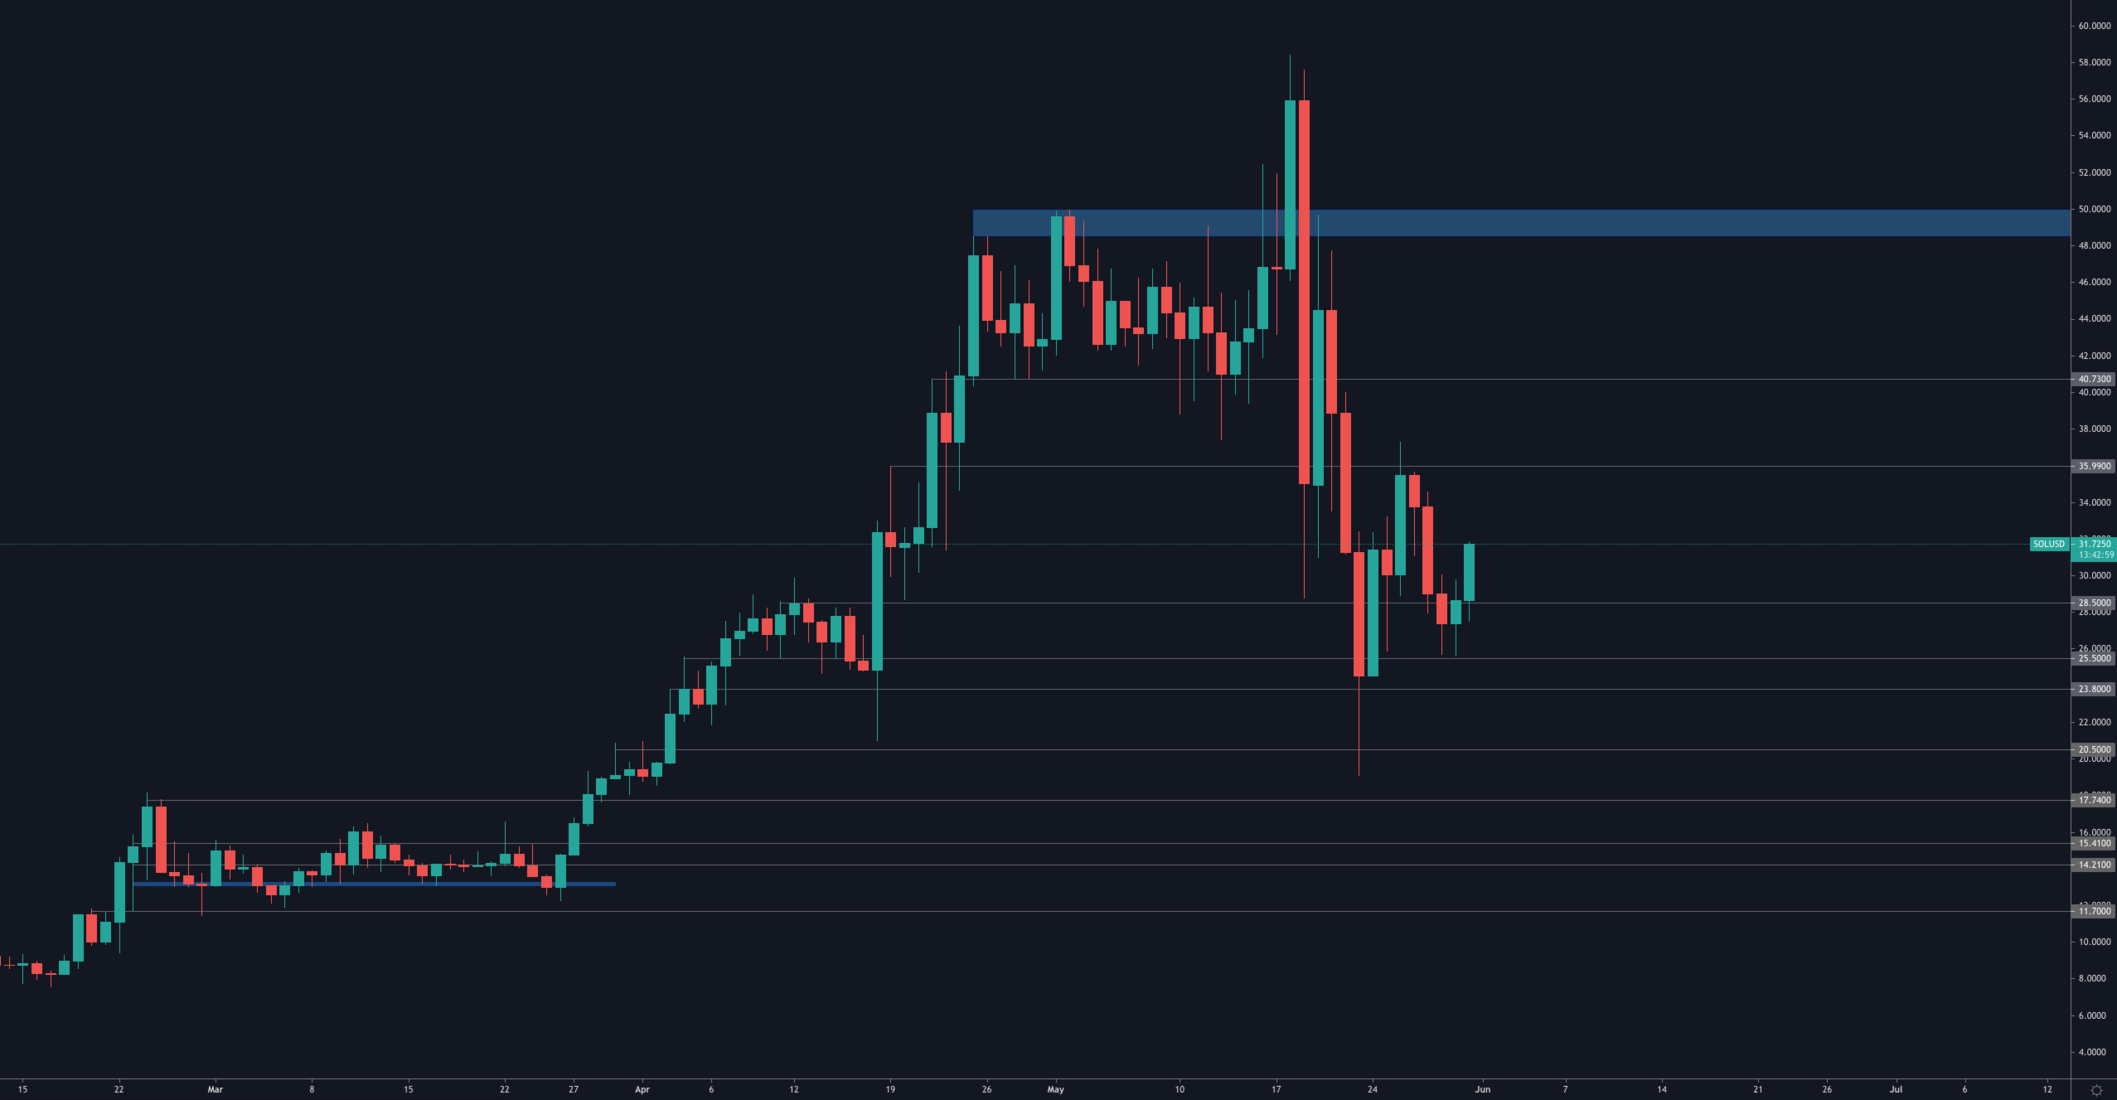
SOL has turned $28.50 from resistance into support which states that there are high odds of an upcoming test of $36.
SRM
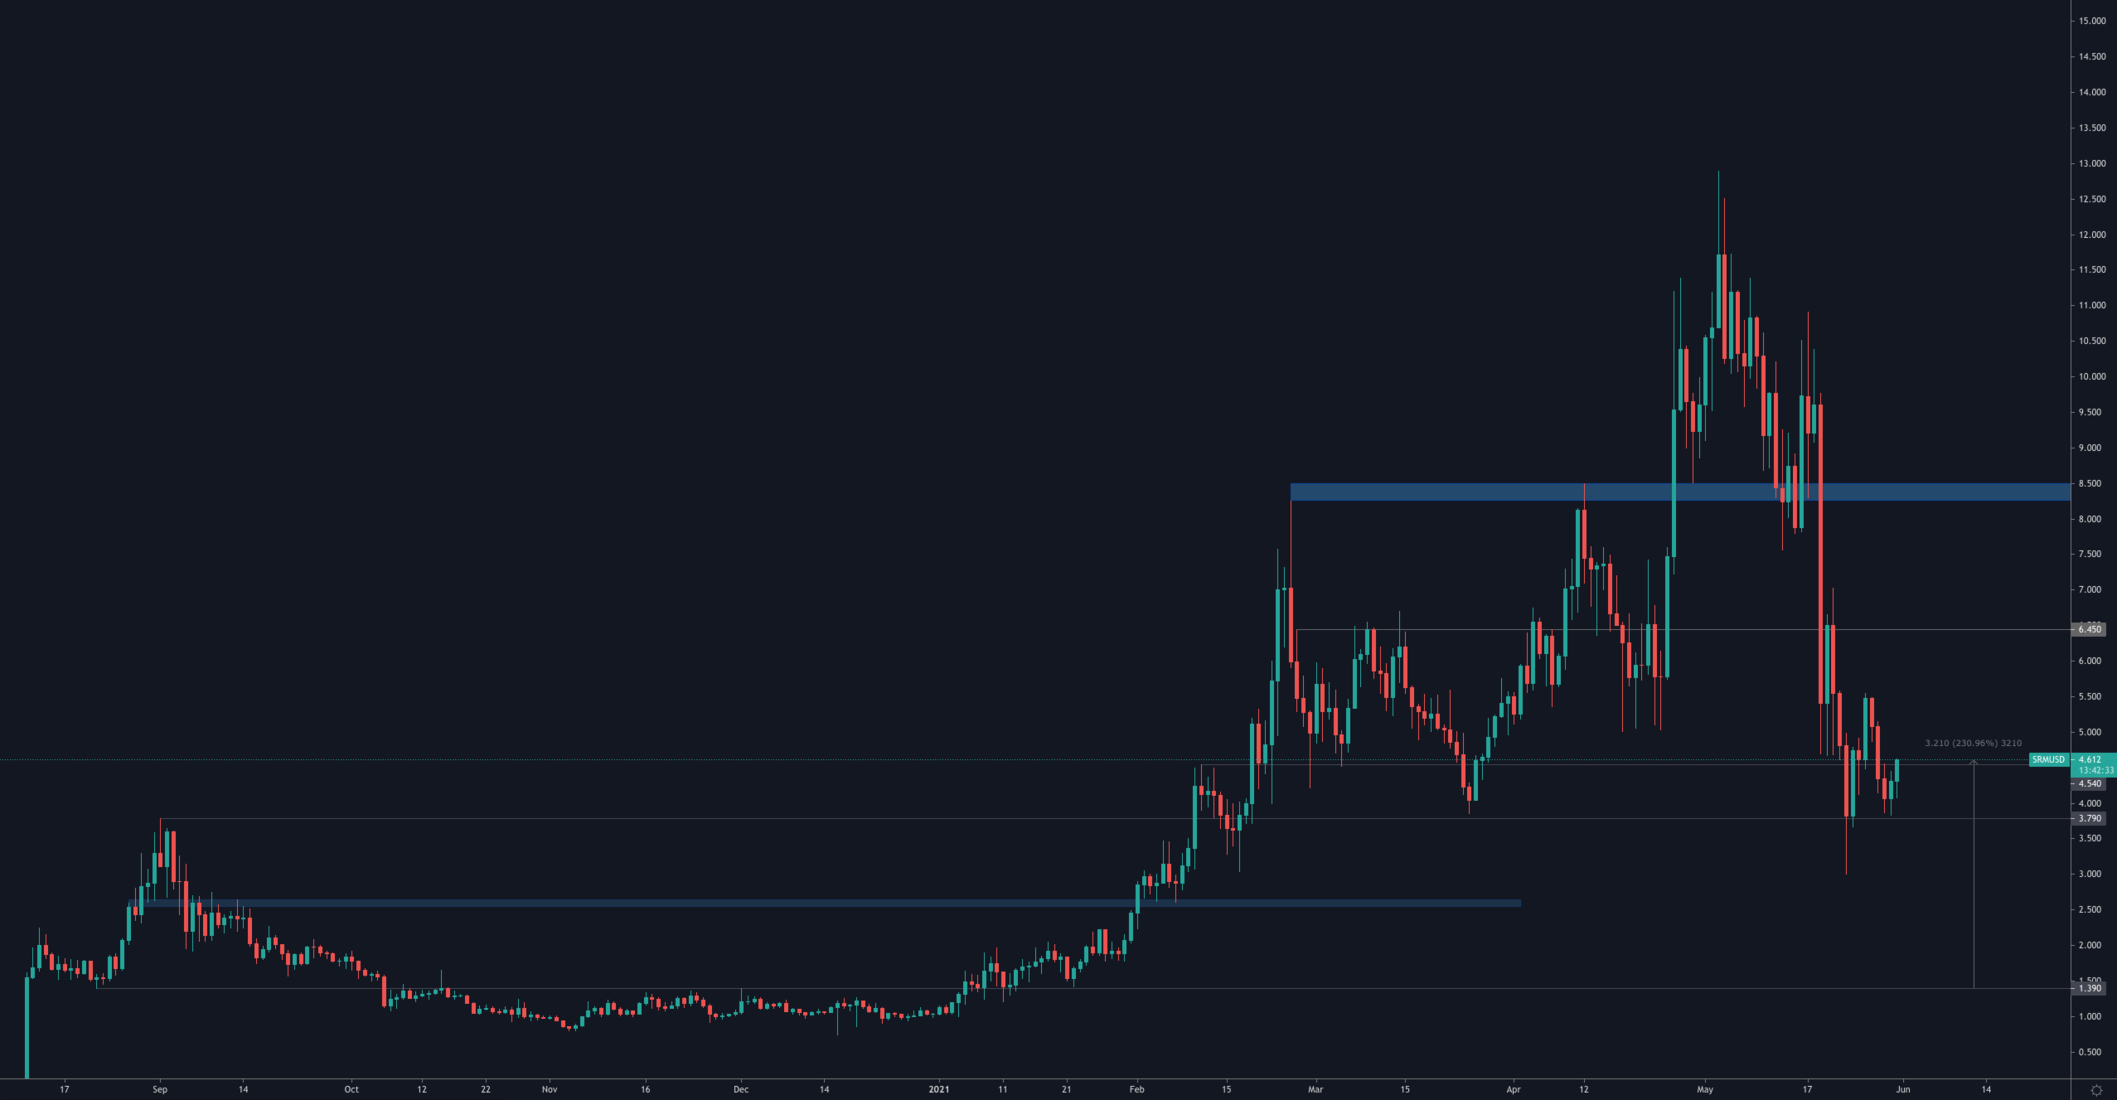
SRM truly is playing with fire, that fire is $3.79. This was the high set during the 2020 DeFi summer and should be the line in the sand that SRM respects. Thus far, a reclaim of $4.50 seems on the cards for today which sets the stage for a run towards $6.50.
Disclaimer: NOT FINANCIAL NOR INVESTMENT ADVICE. Only you are responsible for any capital-related decisions you make and only you are accountable for the results.
Recommended from Cryptonary


