Save 23% ($351) & Get a Free 1-1 Call with our Team ⏰ : 0d 2h 59m 43s

Market Sentiment
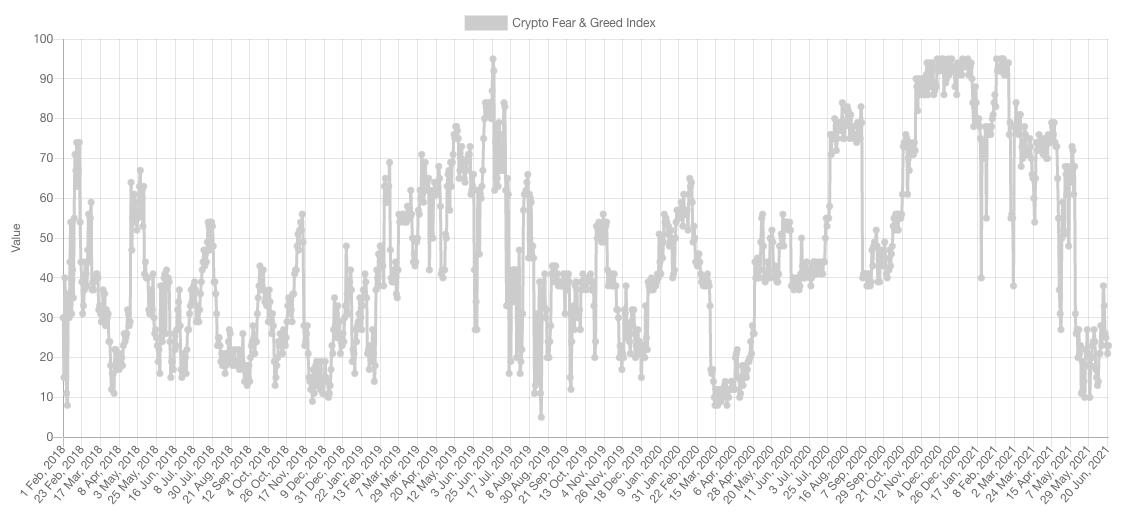
- The Nov/Dec 2018 BTC break to ~$3,000
- The Mar 2020 Black Swan
- Now
Market Indexes
Total Market Capitalisation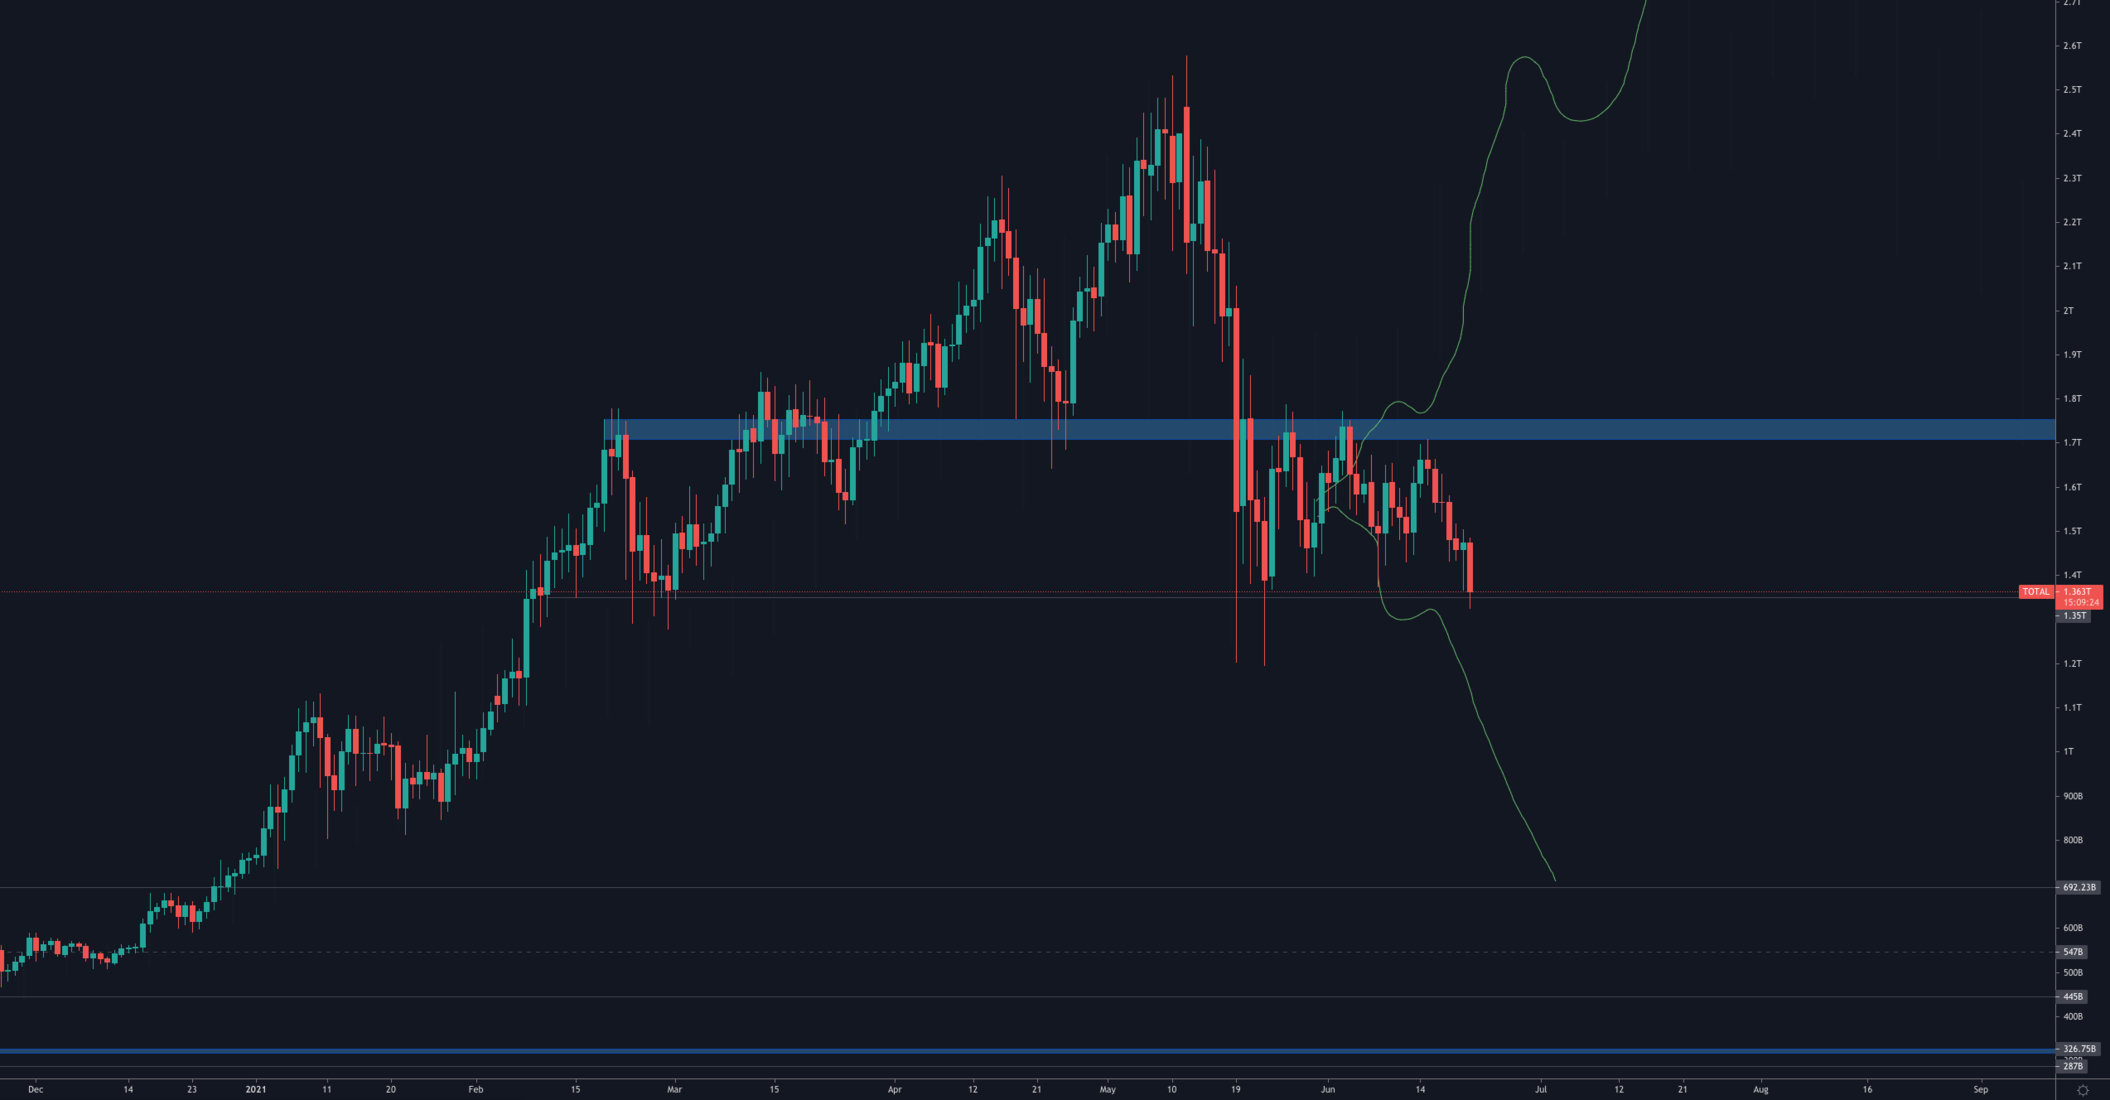
Today, the Total MCap is retesting the range low at $1.35T for the second time. This now represents an extreme high R:R long opportunity (applicable to fundamentally-sound assets only) because the invalidation is extremely close while the potential reward if prices bottom here is very large. The market is in a do or die situation right now where either prices bottom here and re-rally towards the upper end of the range at $1.7T or support breaks (i.e. daily closure under $1.35T) and the crypto market heads back to a valuation of sub-$1 Trillion.
Altcoins Market Cap
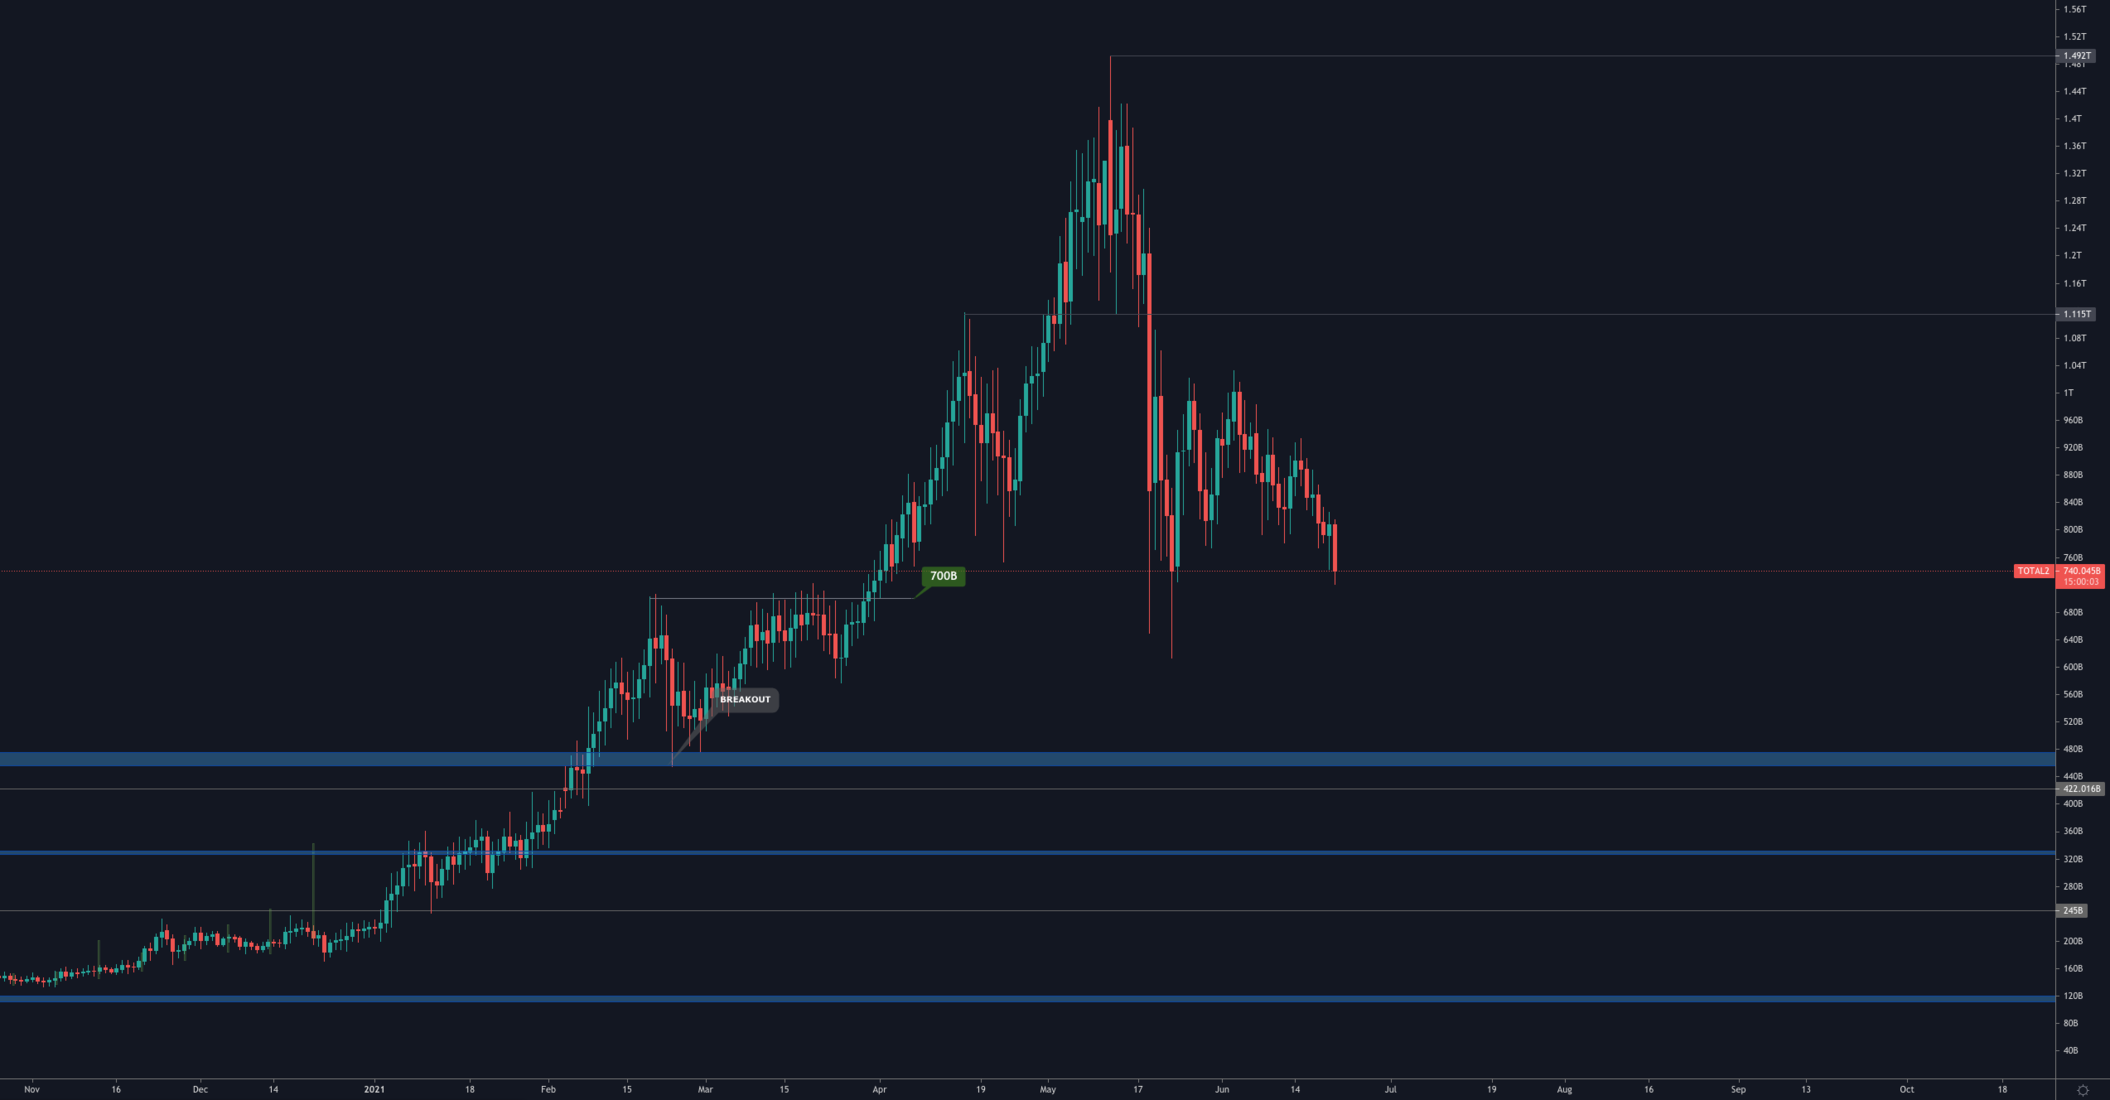
The Alts MCap is similarly retesting the previous lows at $700B, as support, a closure under would lead back to $450B which represents the high set in 2017.
Bitcoin
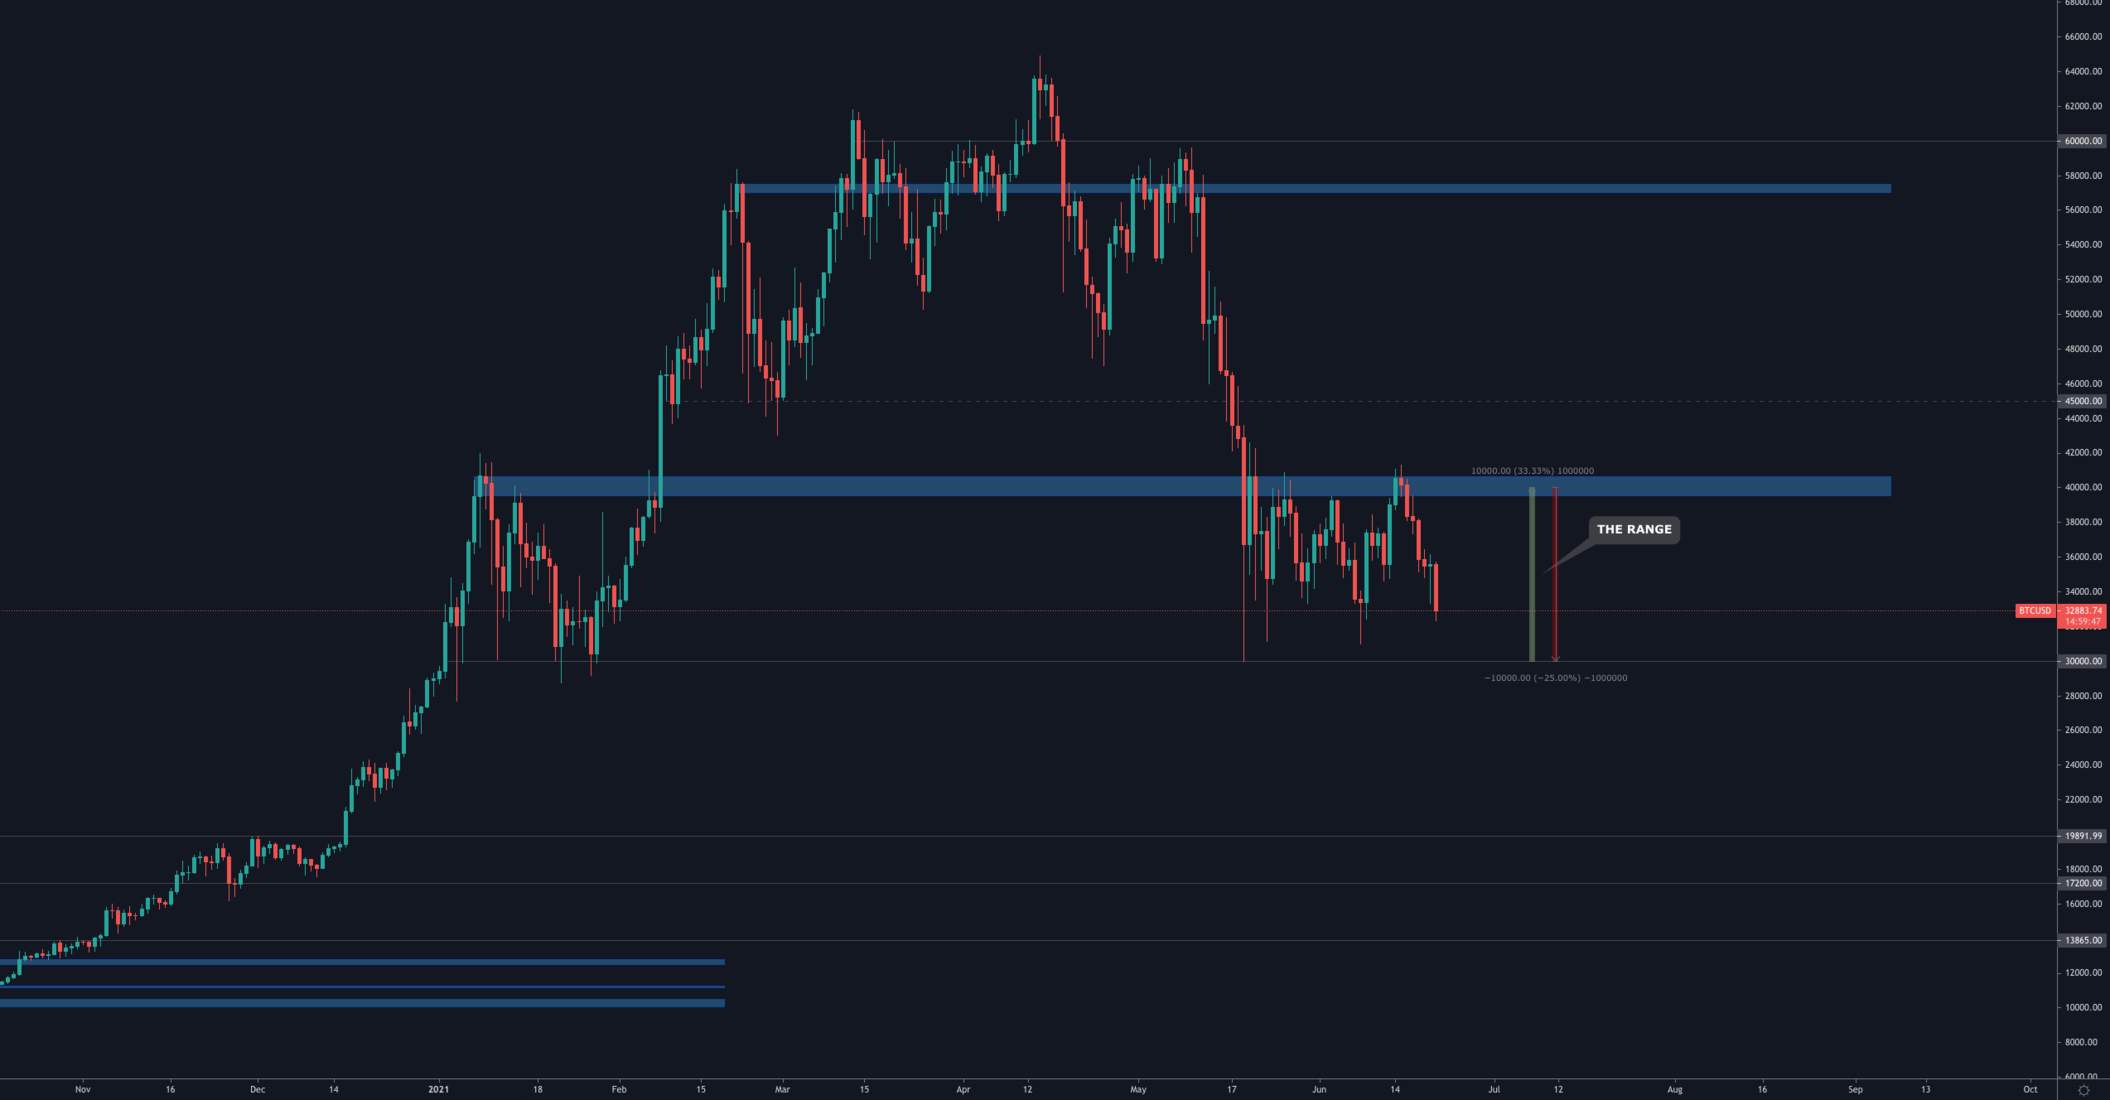
Bitcoin's price remains stuck in the same [$30,000-$40,000] range. As explained two days ago in Discord Pro, the mining stop and further FUD coming out from China would likely push prices back towards the range low (i.e. $30,000). Bitcoin still has some further room before the range low is hit which will probably happen since China woke up and chose violence towards crypto in terms of bans.
Ether
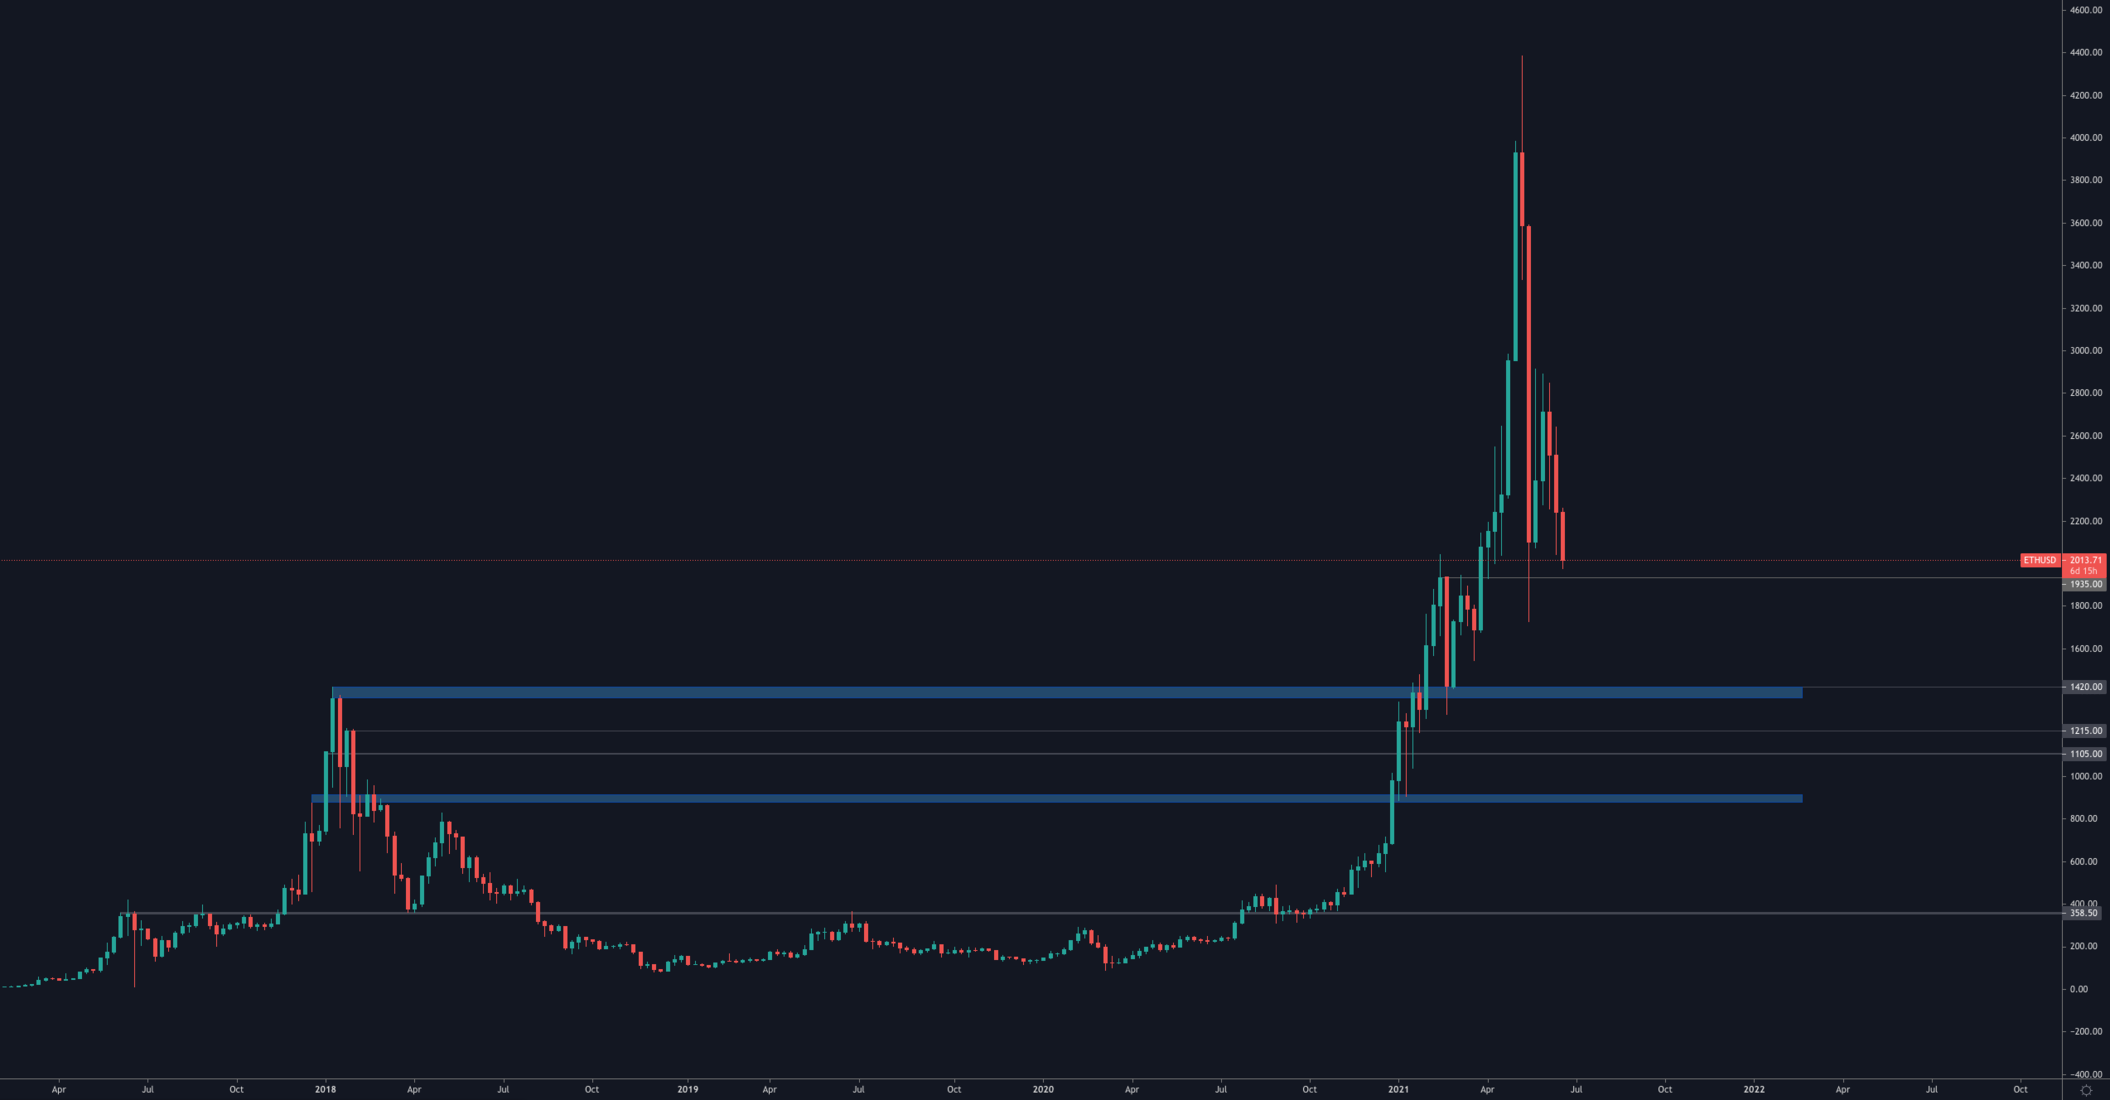
ETH's price action is once again testing $1,935 as support. If lost and not enough demand is provided at these prices, then $1,420 would be next in line (the term "if" is important to pay attention to). Support holding however, can lead back towards $2,500 & $3,200.
RUNE
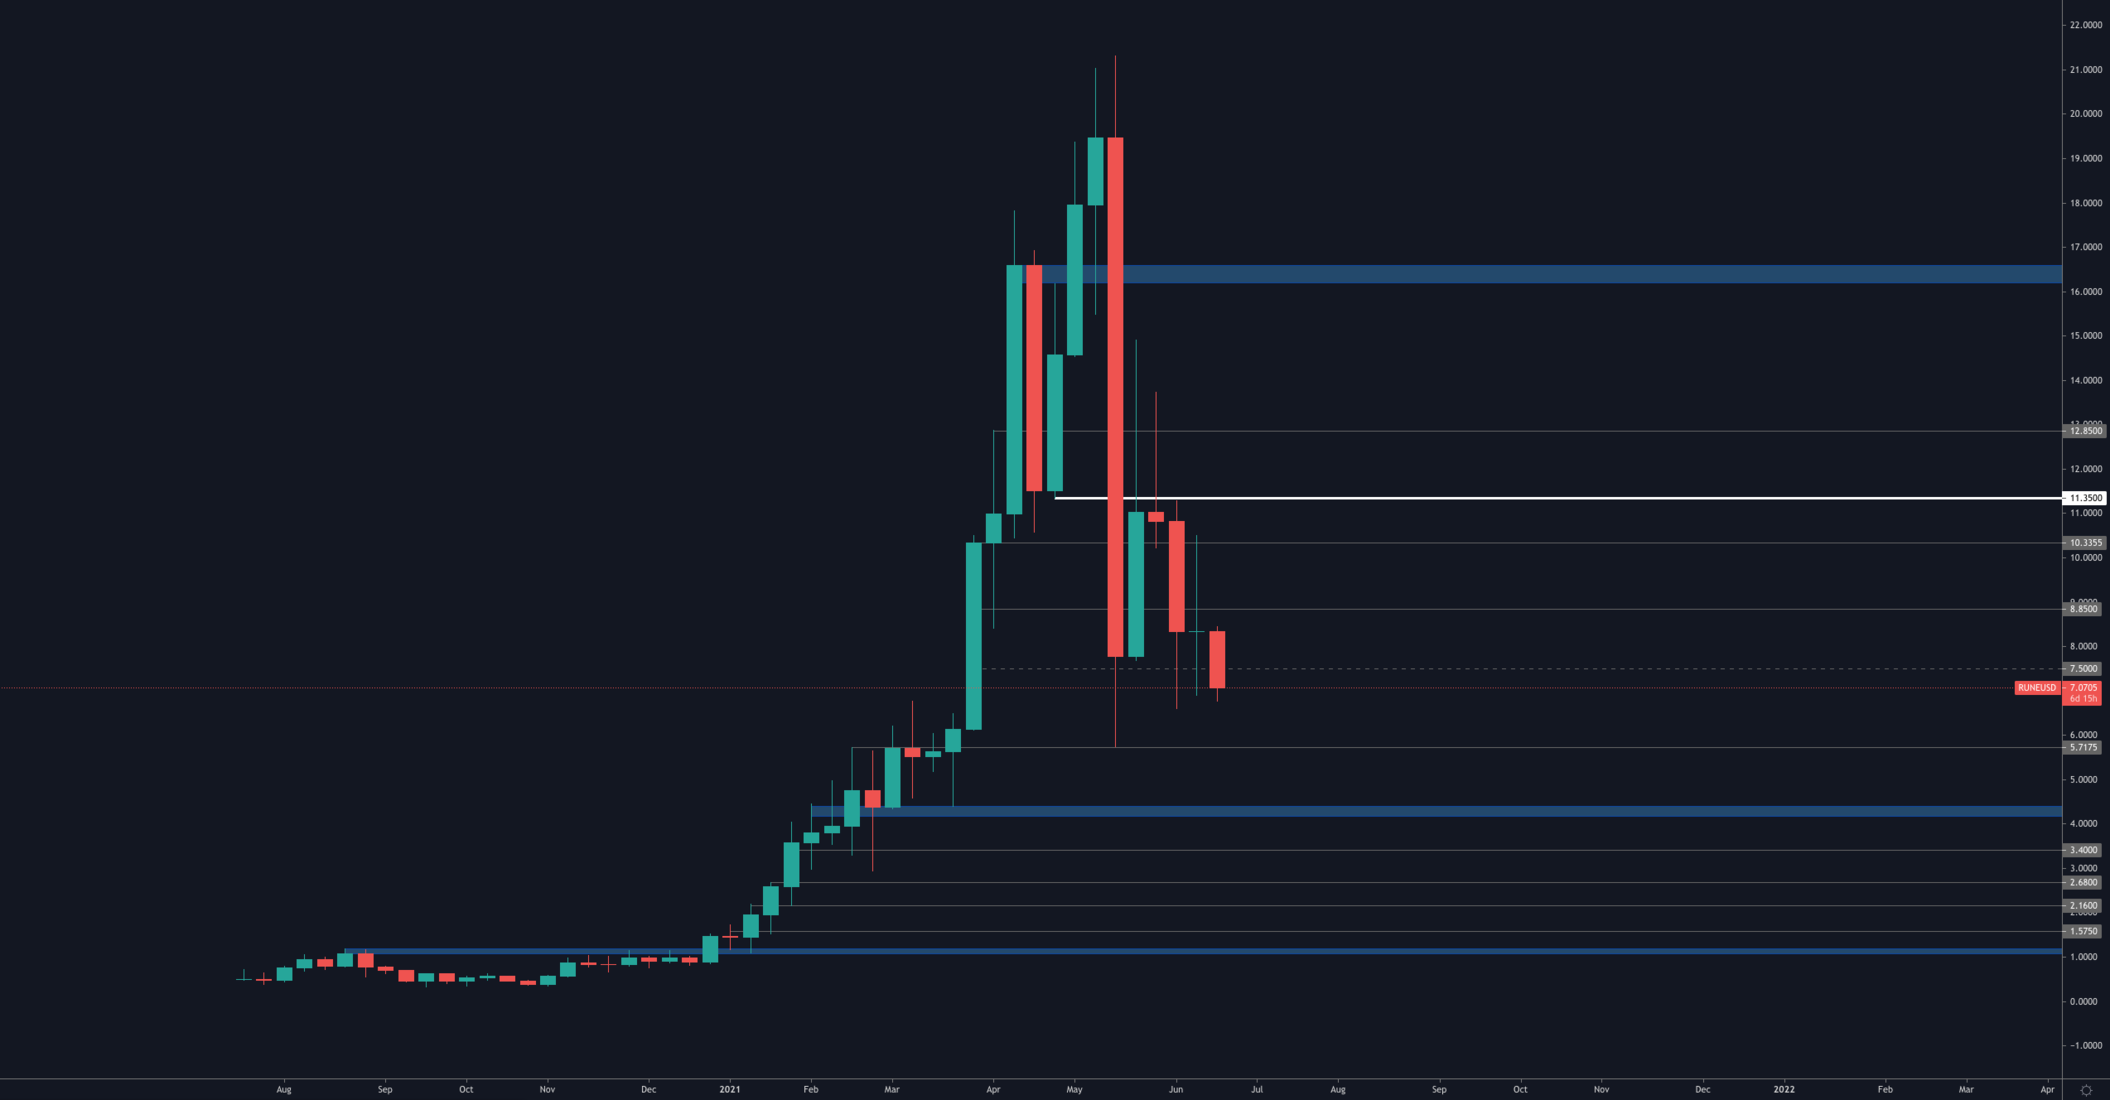
RUNE has a central (irony) issue to solve in terms of price and that is: reclaim $11.50 on the weekly timeframe.
Why is it important? This is the level where price has been struggling with sellers in recent weeks and where the market structure changes.
From a daily timeframe perspective, RUNE still is on track for a test of $5.75.
SNX
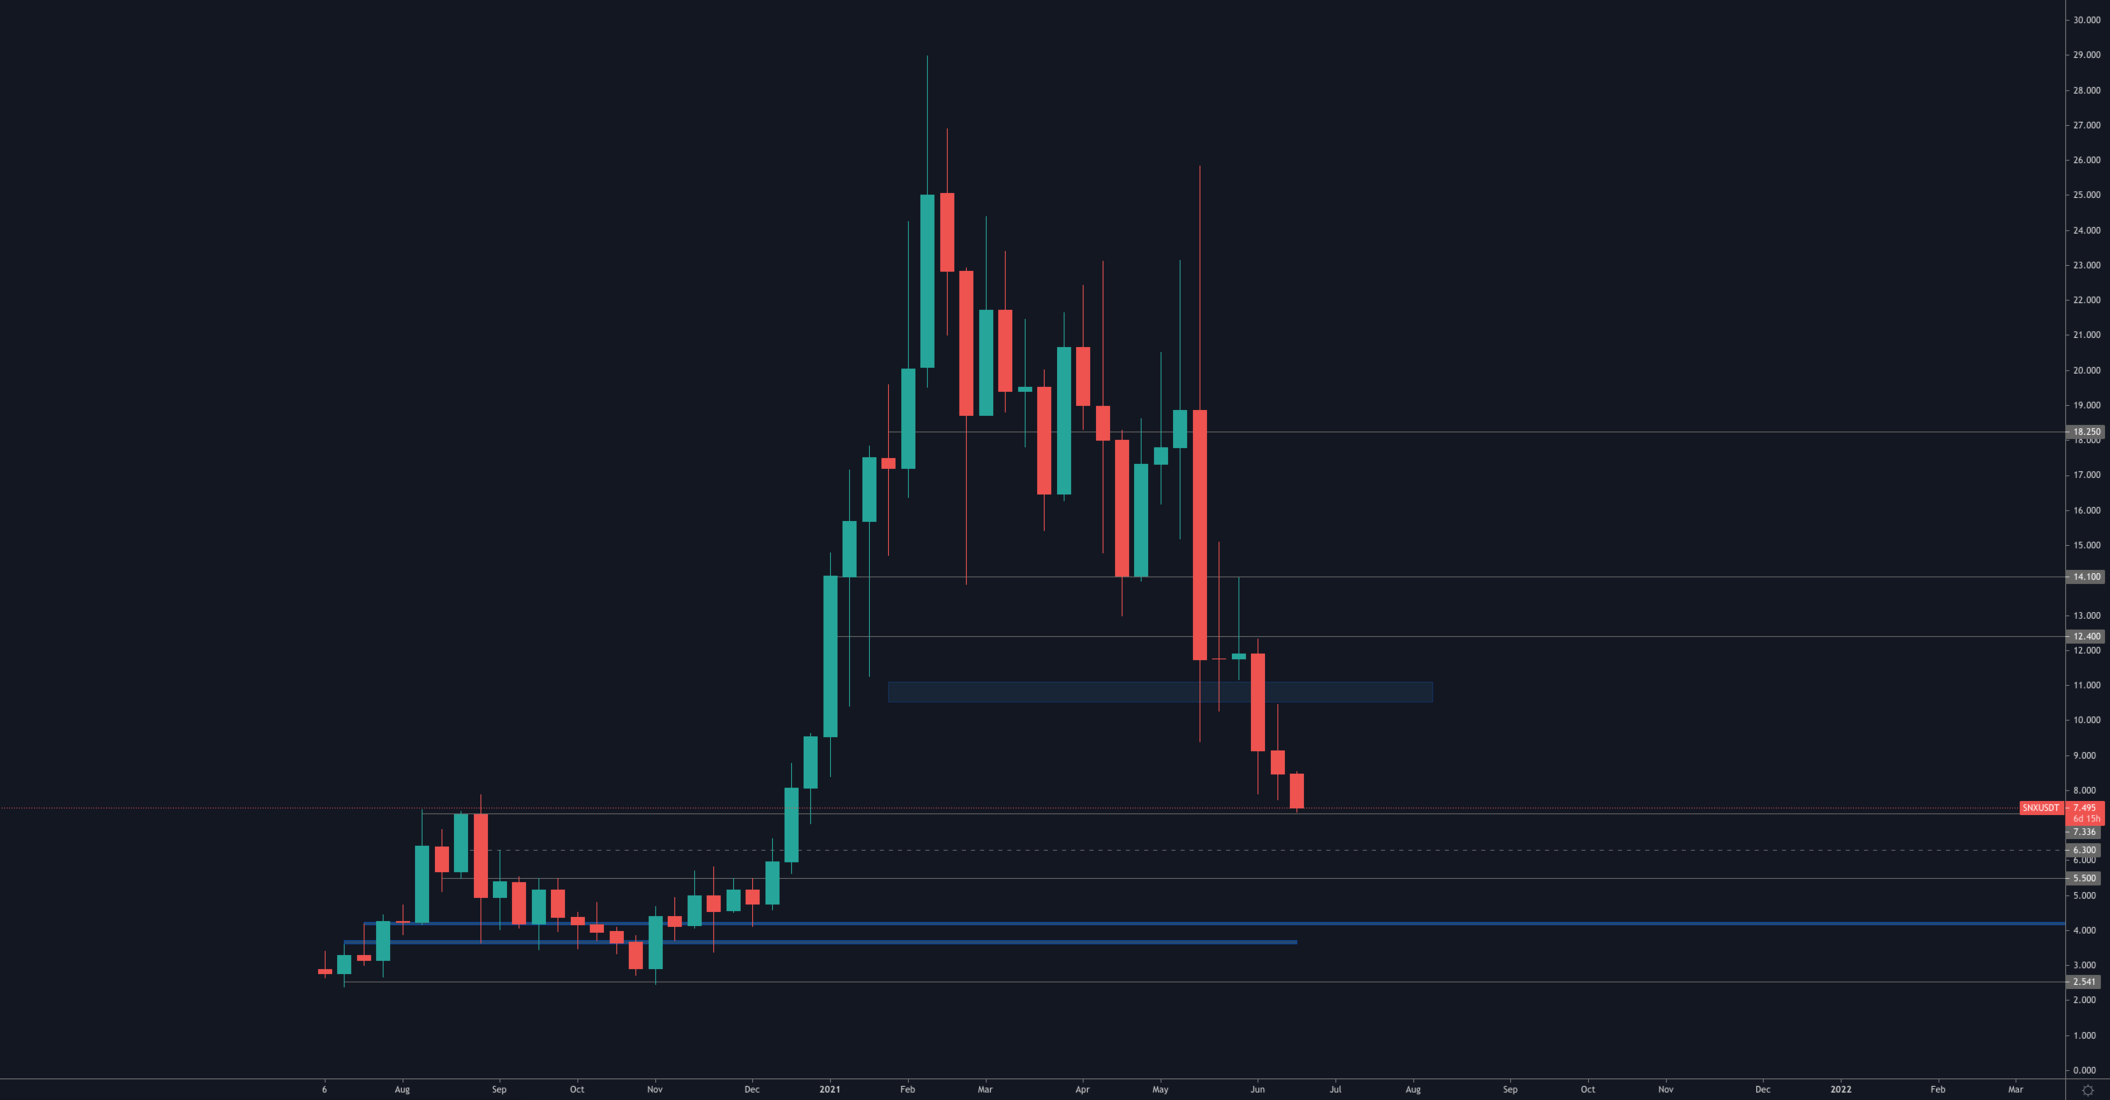
SNX has arrived to its support level of $7.50. This is the high set during the 2020 DeFi summer - we personally entered into SNX during the DeFi winter as price was correcting. Unless $7.50 is lost on the daily timeframe, SNX will probably see a reaction/bounce soon.
DOT
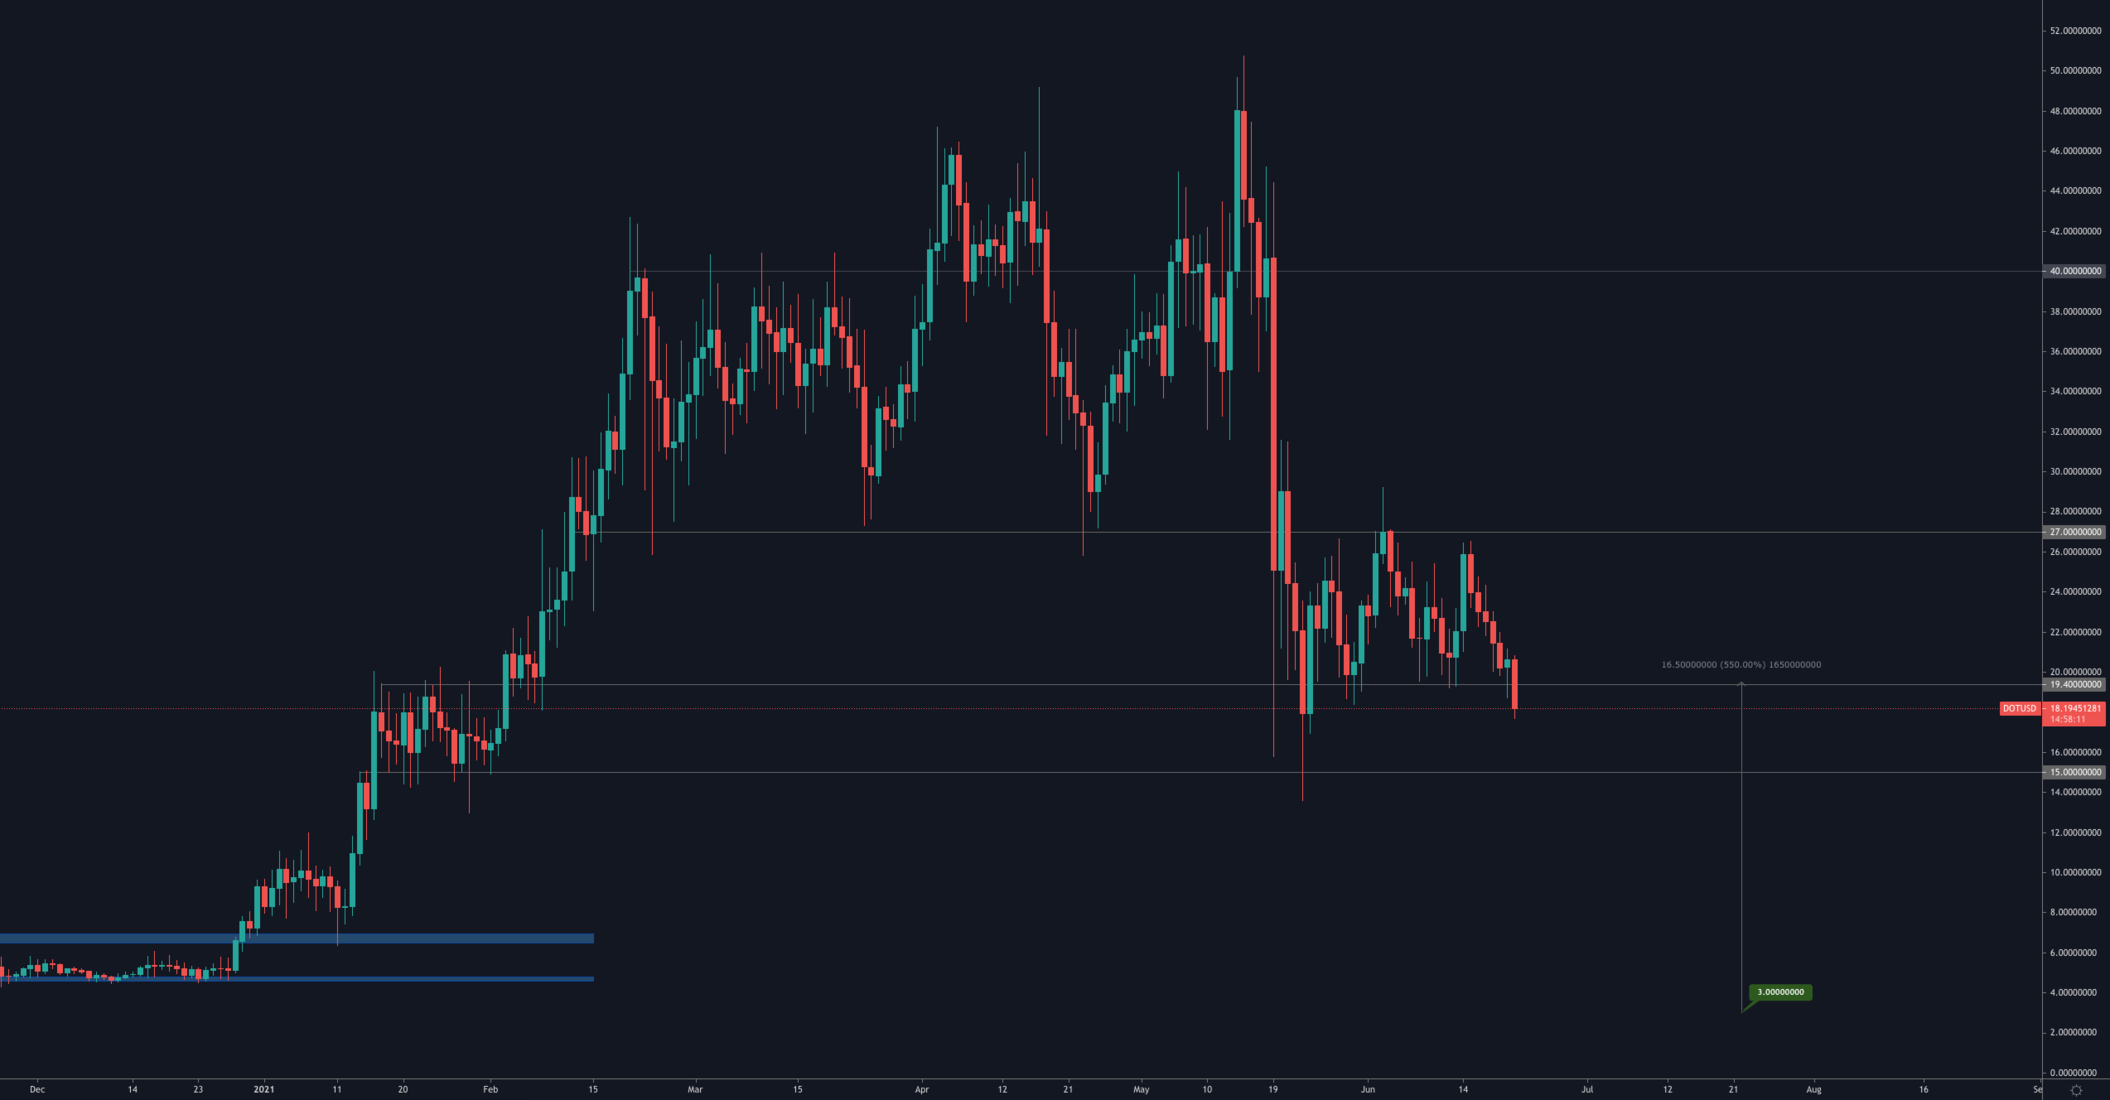
On the daily timeframe, DOT has not broken $19.40 on a closure basis but that does seem plausible today. If the latter occurs, then a test of $15 would be next. Conversely, if price manages to pullback up and close the daily candle above $19.40 then $27 would be next. Pivotal day for DOT.
SOL
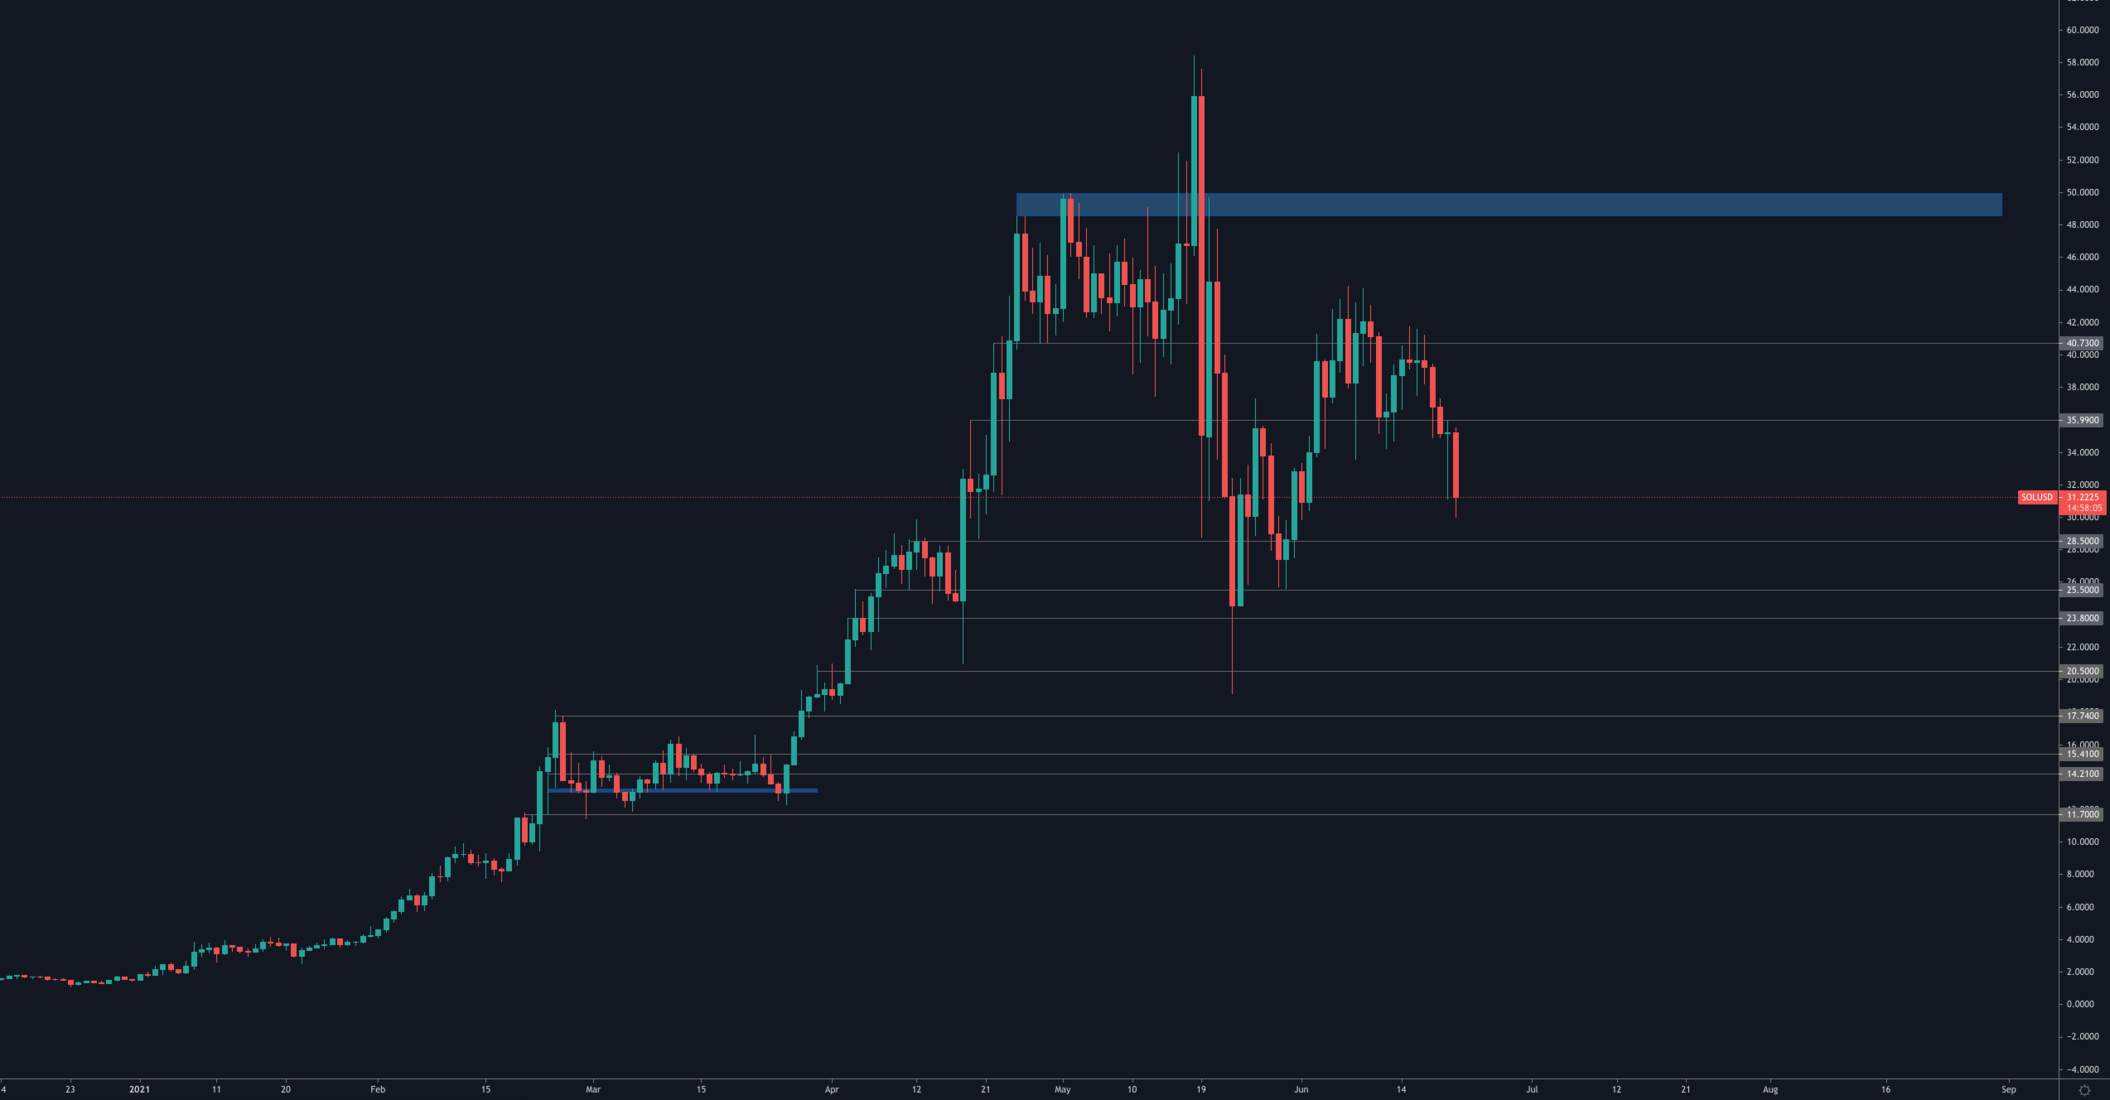
As stated yesterday, a daily closure under $36 would lead towards $29 quasi-directly and that is taking place now. $29 should provide at least temporary support, whether it ends up being a dead-cat bounce or a bottom-setting bounce will entirely depend on the volume and how strong it is. Shallow volumes would mean that it is a dead-cat bounce.
SRM
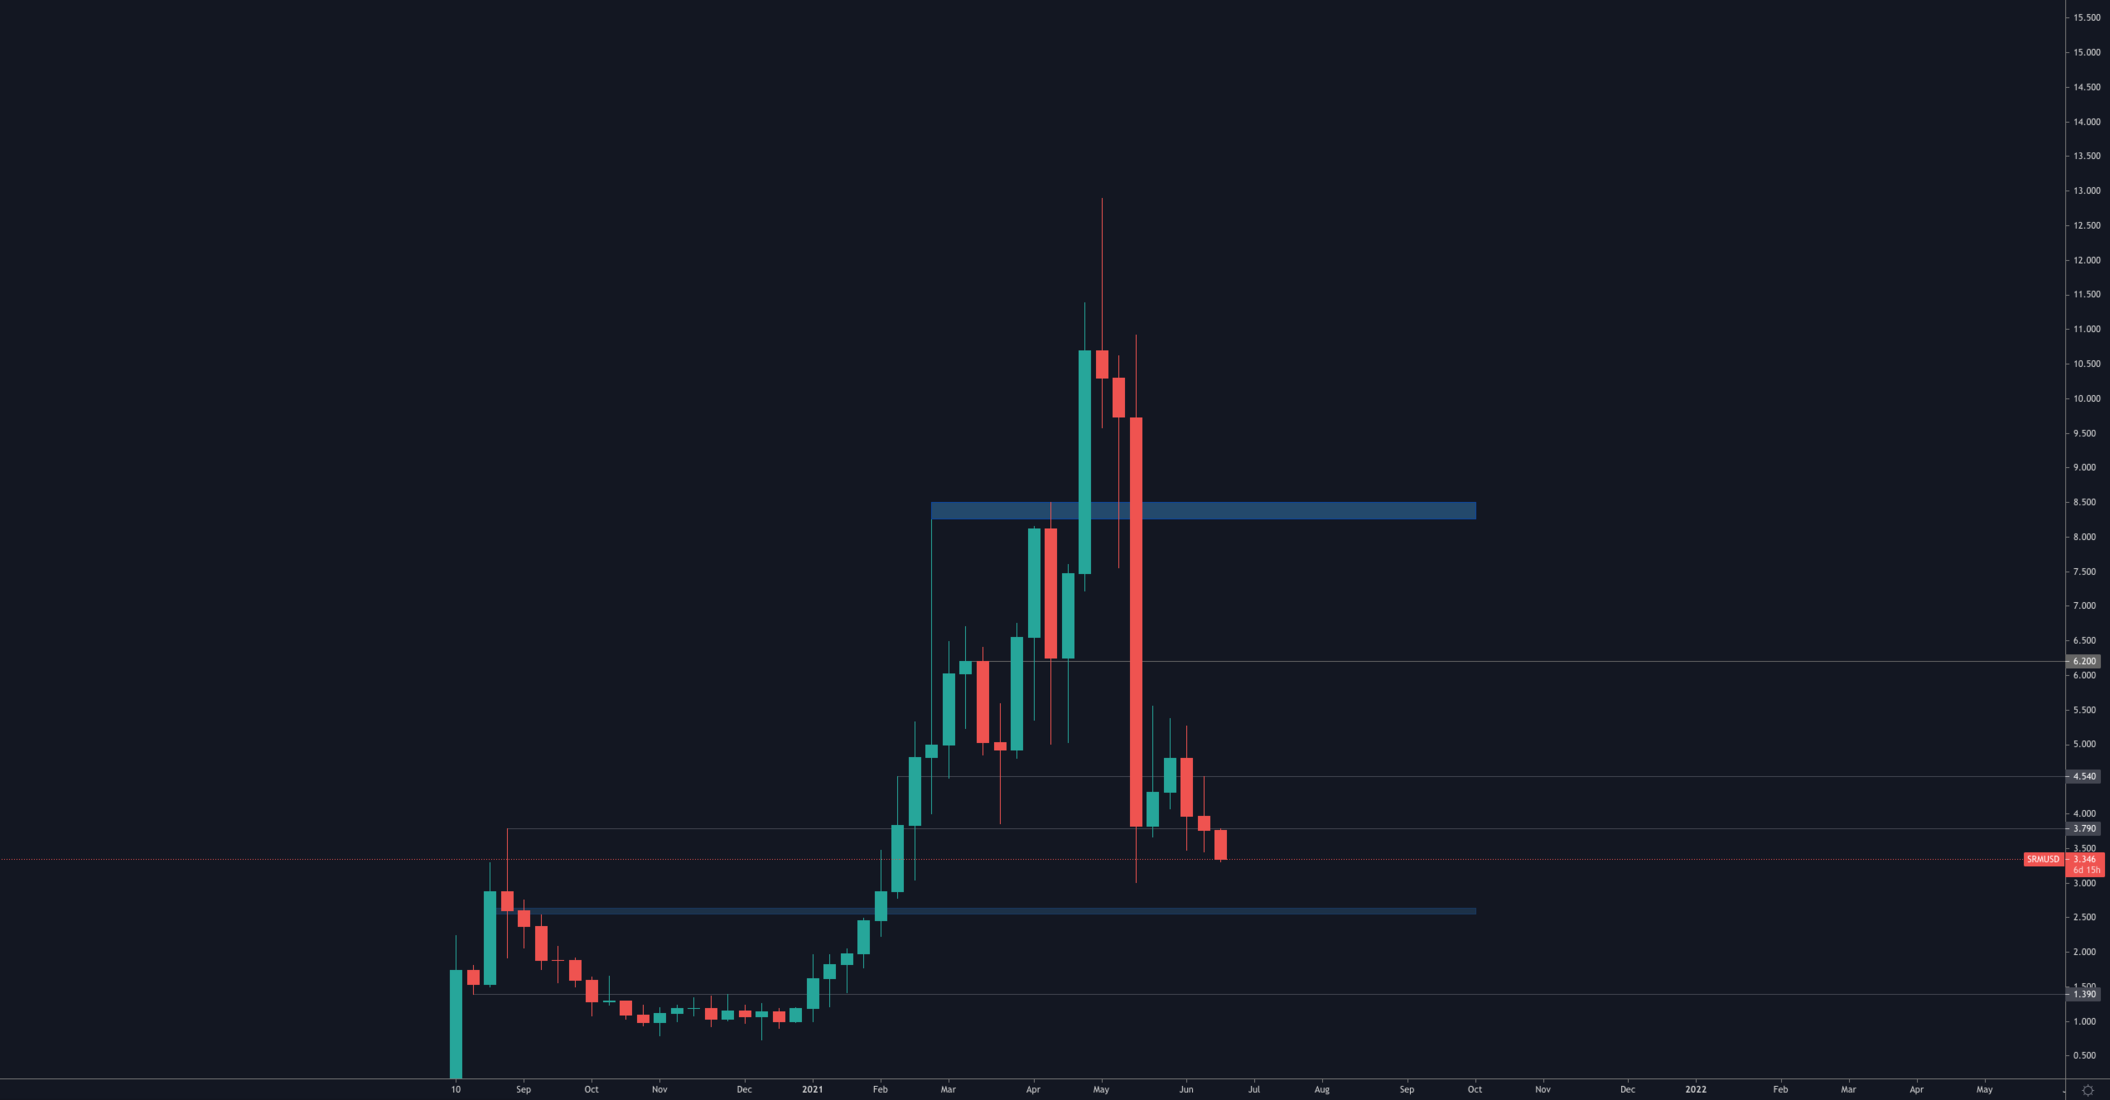
SRM sellers overpowered buyers at $3.79 and that is definitely not a bullish look for SRM. In fact, this indicates a test of $2.50 to be on the horizon. Each individual has a different risk tolerance and timeline and hence each individuals should plan according to their preferences.
FTT
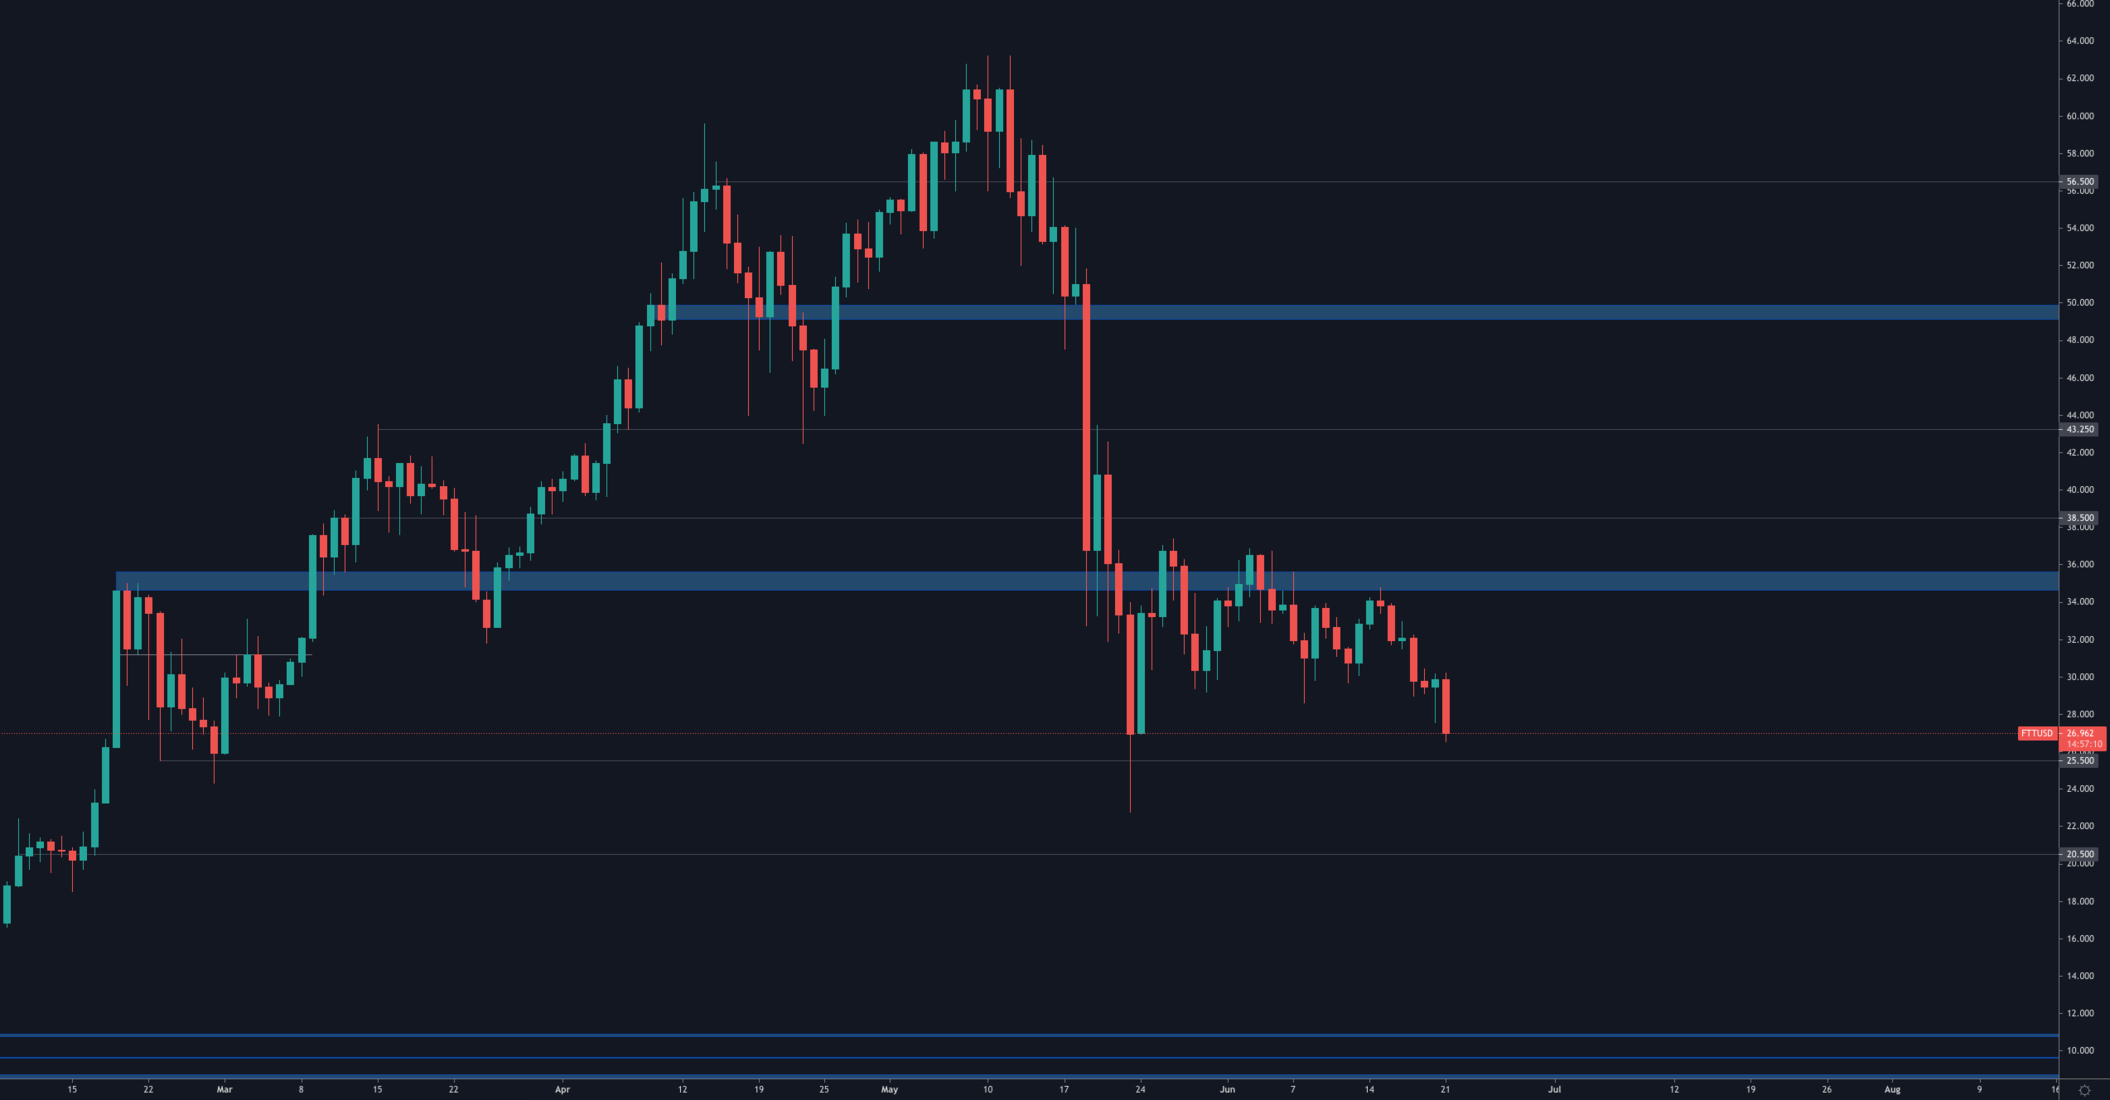
As stated in previous versions of Weekly Technicals, FTT's inability to cross $35 communicated that another test of $25 would be next and that is what we are witnessing now.
XRP
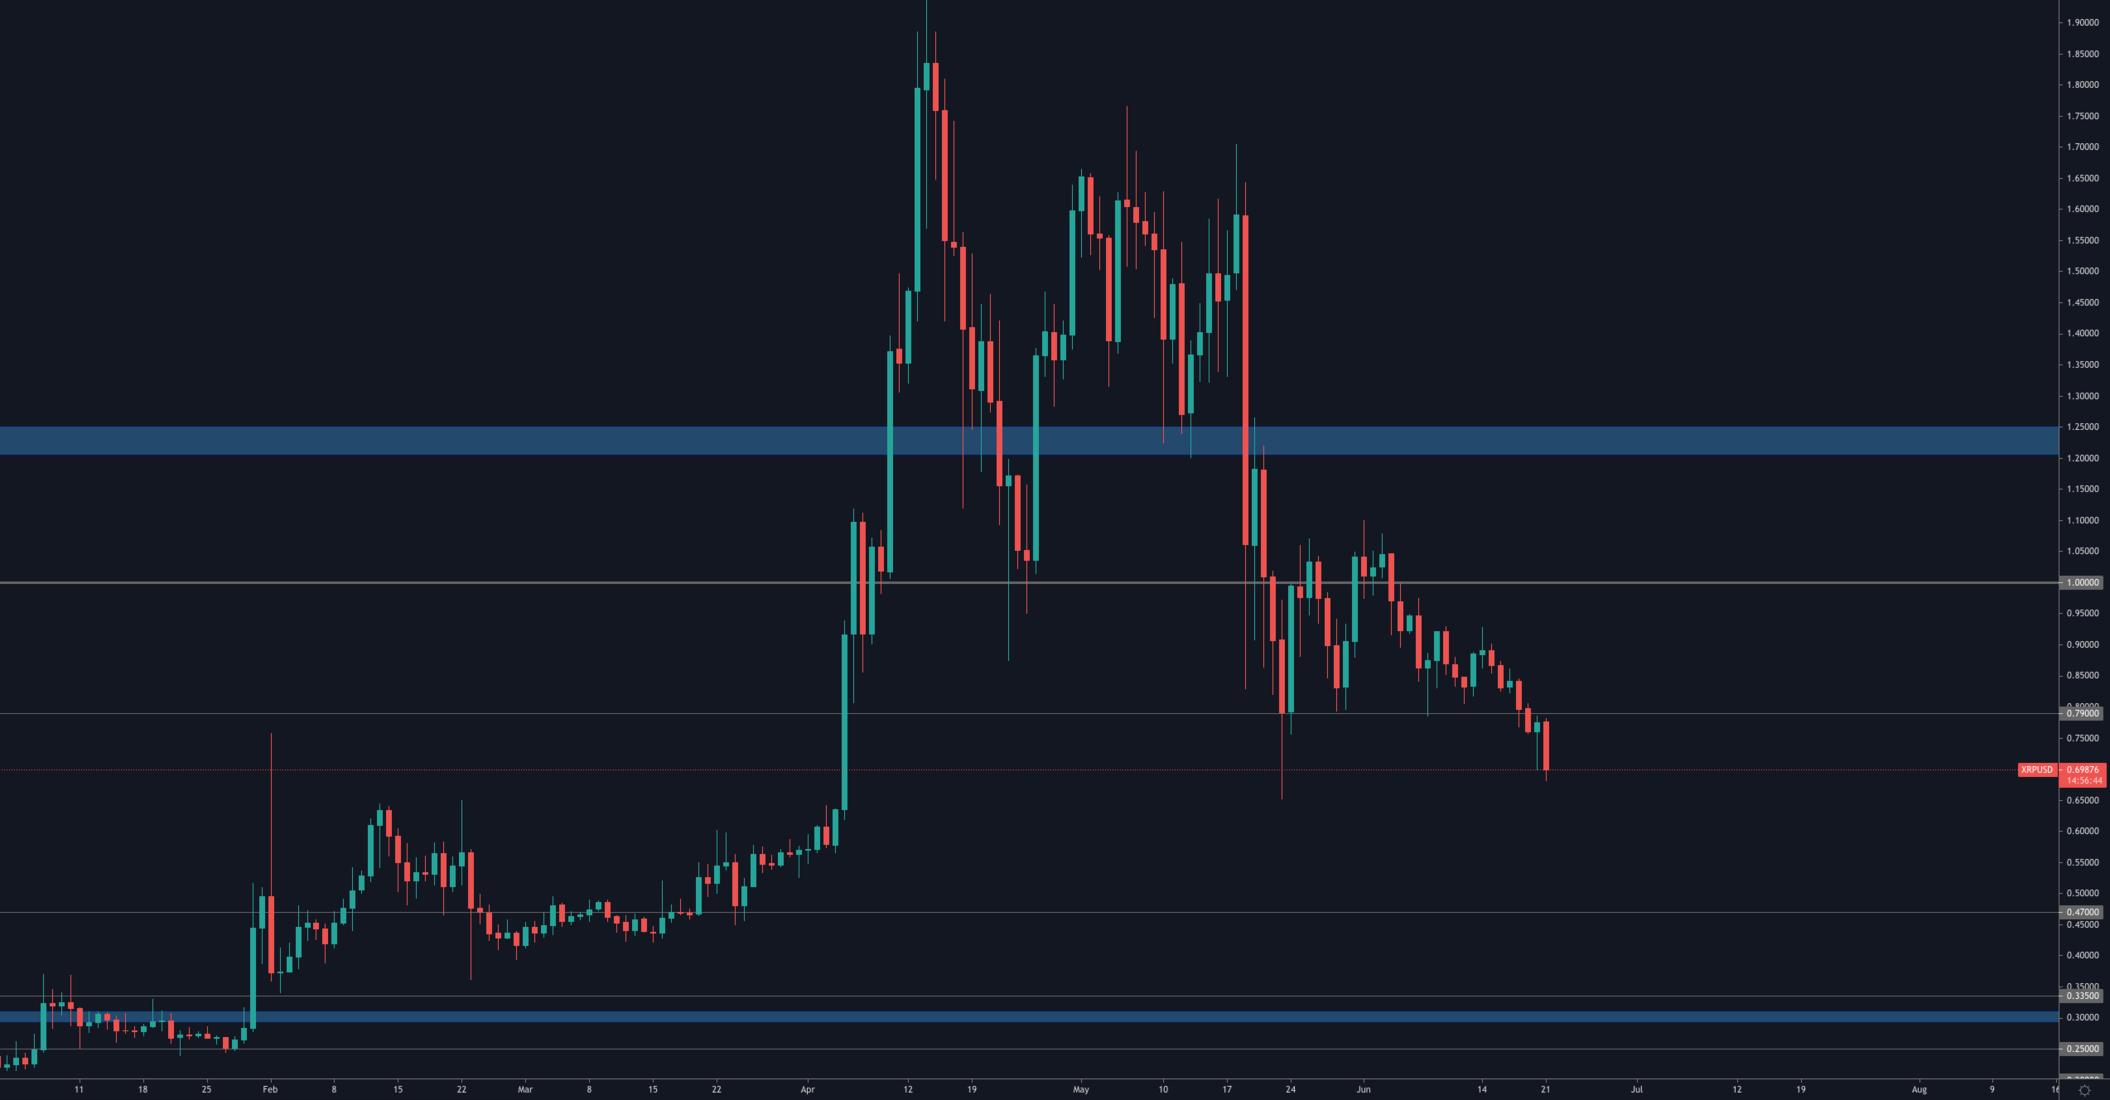
XRP broke the [$0.79-$1] range on the 19th of June and chose a direction leading towards further downside which is rather steep going towards $0.47.
Disclaimer: THIS IS NOT FINANCIAL OR INVESTMENT ADVICE. Only you are responsible for any capital-related decisions you make and only you are accountable for the results.
Recommended from Cryptonary


