Save 23% ($351) & Get a Free 1-1 Call with our Team ⏰ : 0d 2h 59m 43s
Weekly Technicals Pro - Volume 63
Market sentiment has been overly bearish. According to the Fear & Greed Index it is at Extreme Fear. As stated last week, the only time this index spent multiple weeks at such levels was during the 2018 end of year crash when Bitcoin bottomed at $3,200 and during the Black Swan event of March 2020, both of which were large buying opportunities.

Market Sentiment
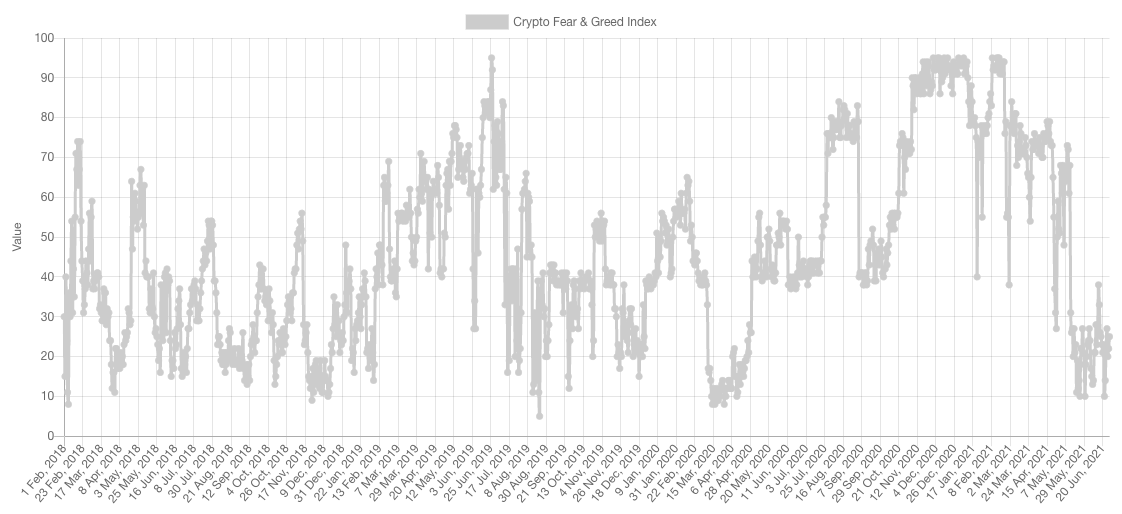
What we are noticing across social media is an increased amount of people calling this correction a bear market, mainly insinuating another 2/3 years filled with downside like 2018. While the steepness of the correction may be somewhat similar, the length will likely be drastically different simply because of the accelerated pace of the market where cycles are happening over shorter spans of time.
Market Indexes
Total Market Cap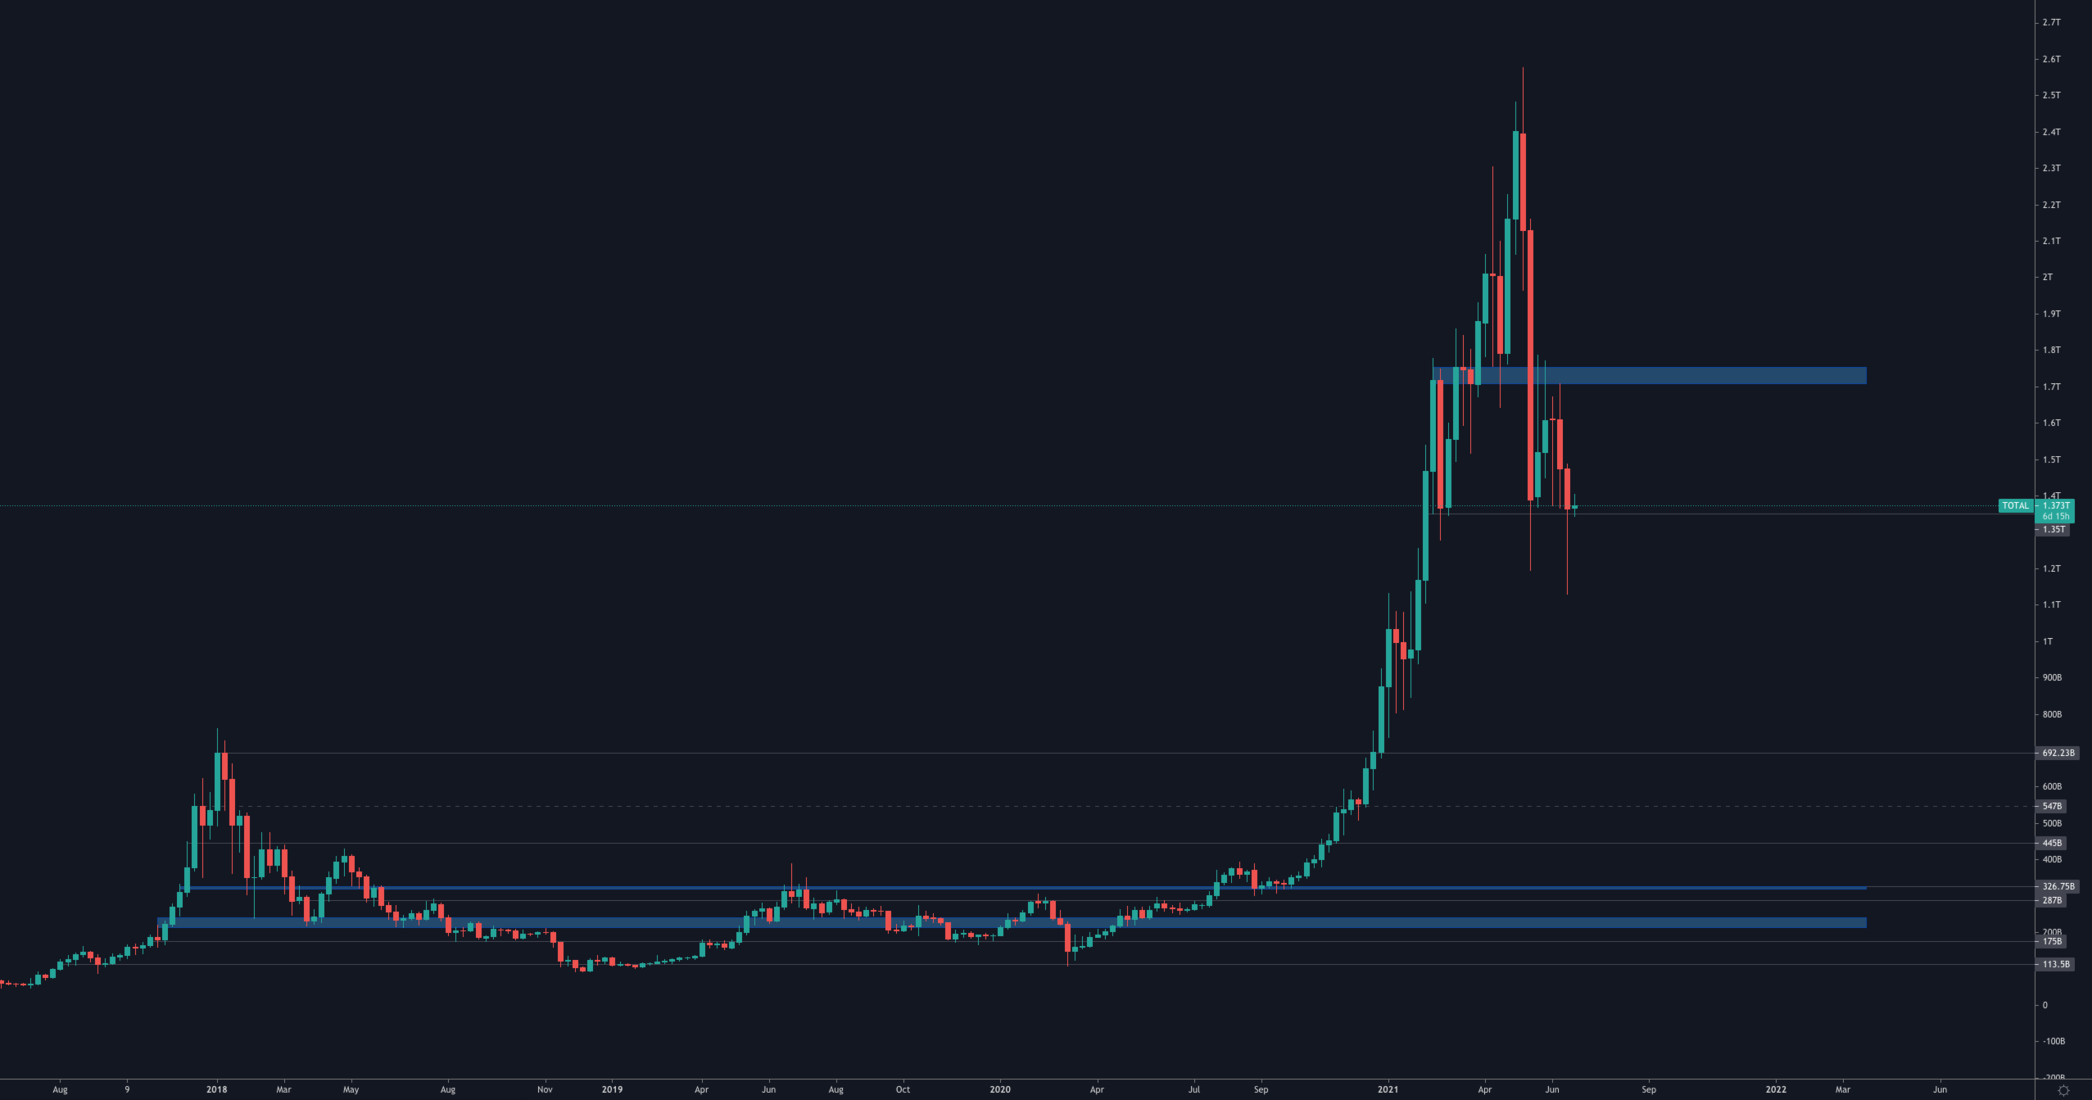
Saved by the bell. On the last day before the weekly candle closure, the market picked up pace and the Total MCap closed above the $1.35T level of support. This keeps it in the same [$1.35T-$1.7T] range with potential to reach the upper bound over the coming weeks.
Altcoins Market Cap
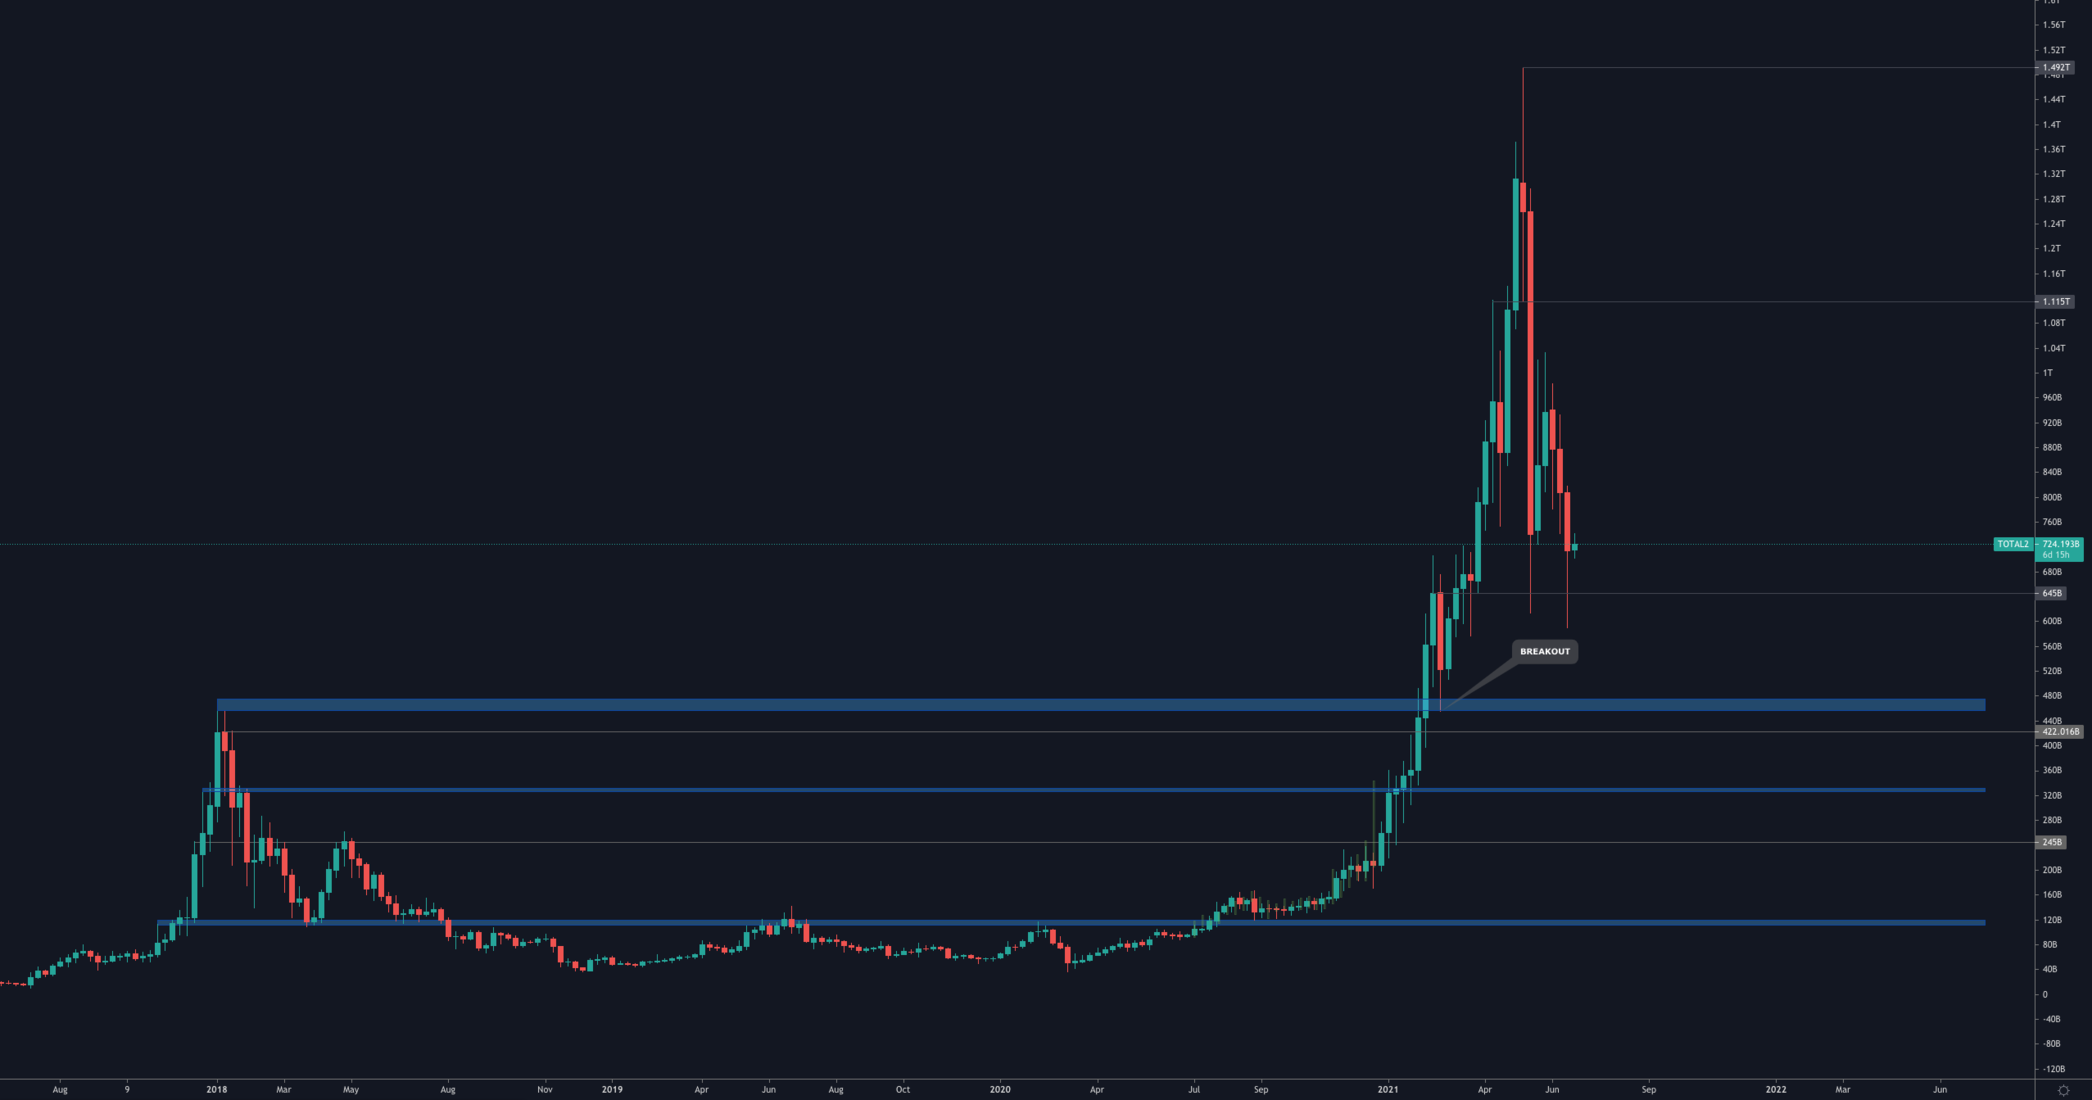
The same statement can be re-said about the Alts MCap as price managed to close above the previous highs and $645B which sets the stage for a test of $1.115T once again.
Bitcoin
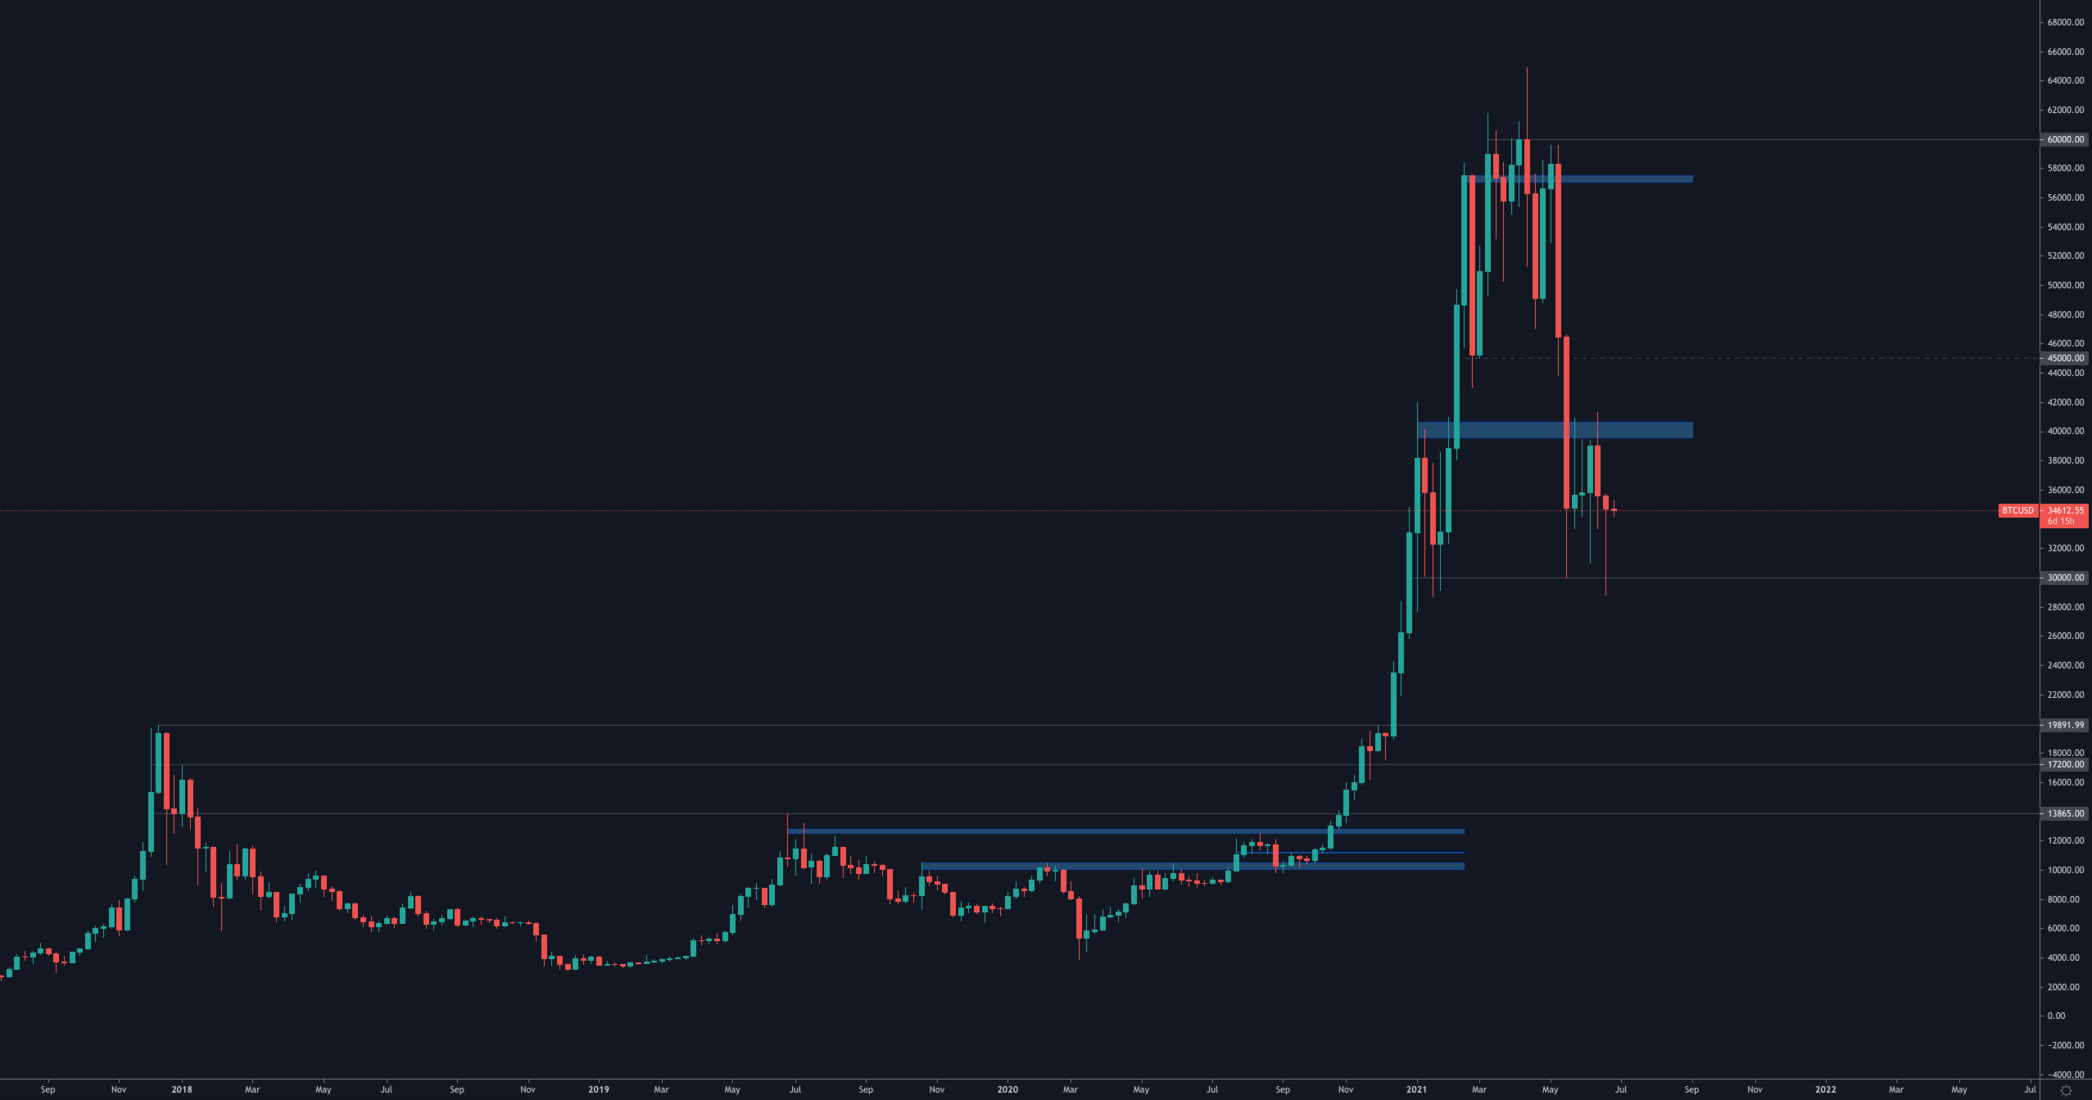
Another test of range lows (i.e. $30,000) where demand picked up and caused a bullish hammer weekly candle closure. The latter is a bullish candlestick formation as it signals demand and communicates a potential test of the upper bound at $40,000.
Ether
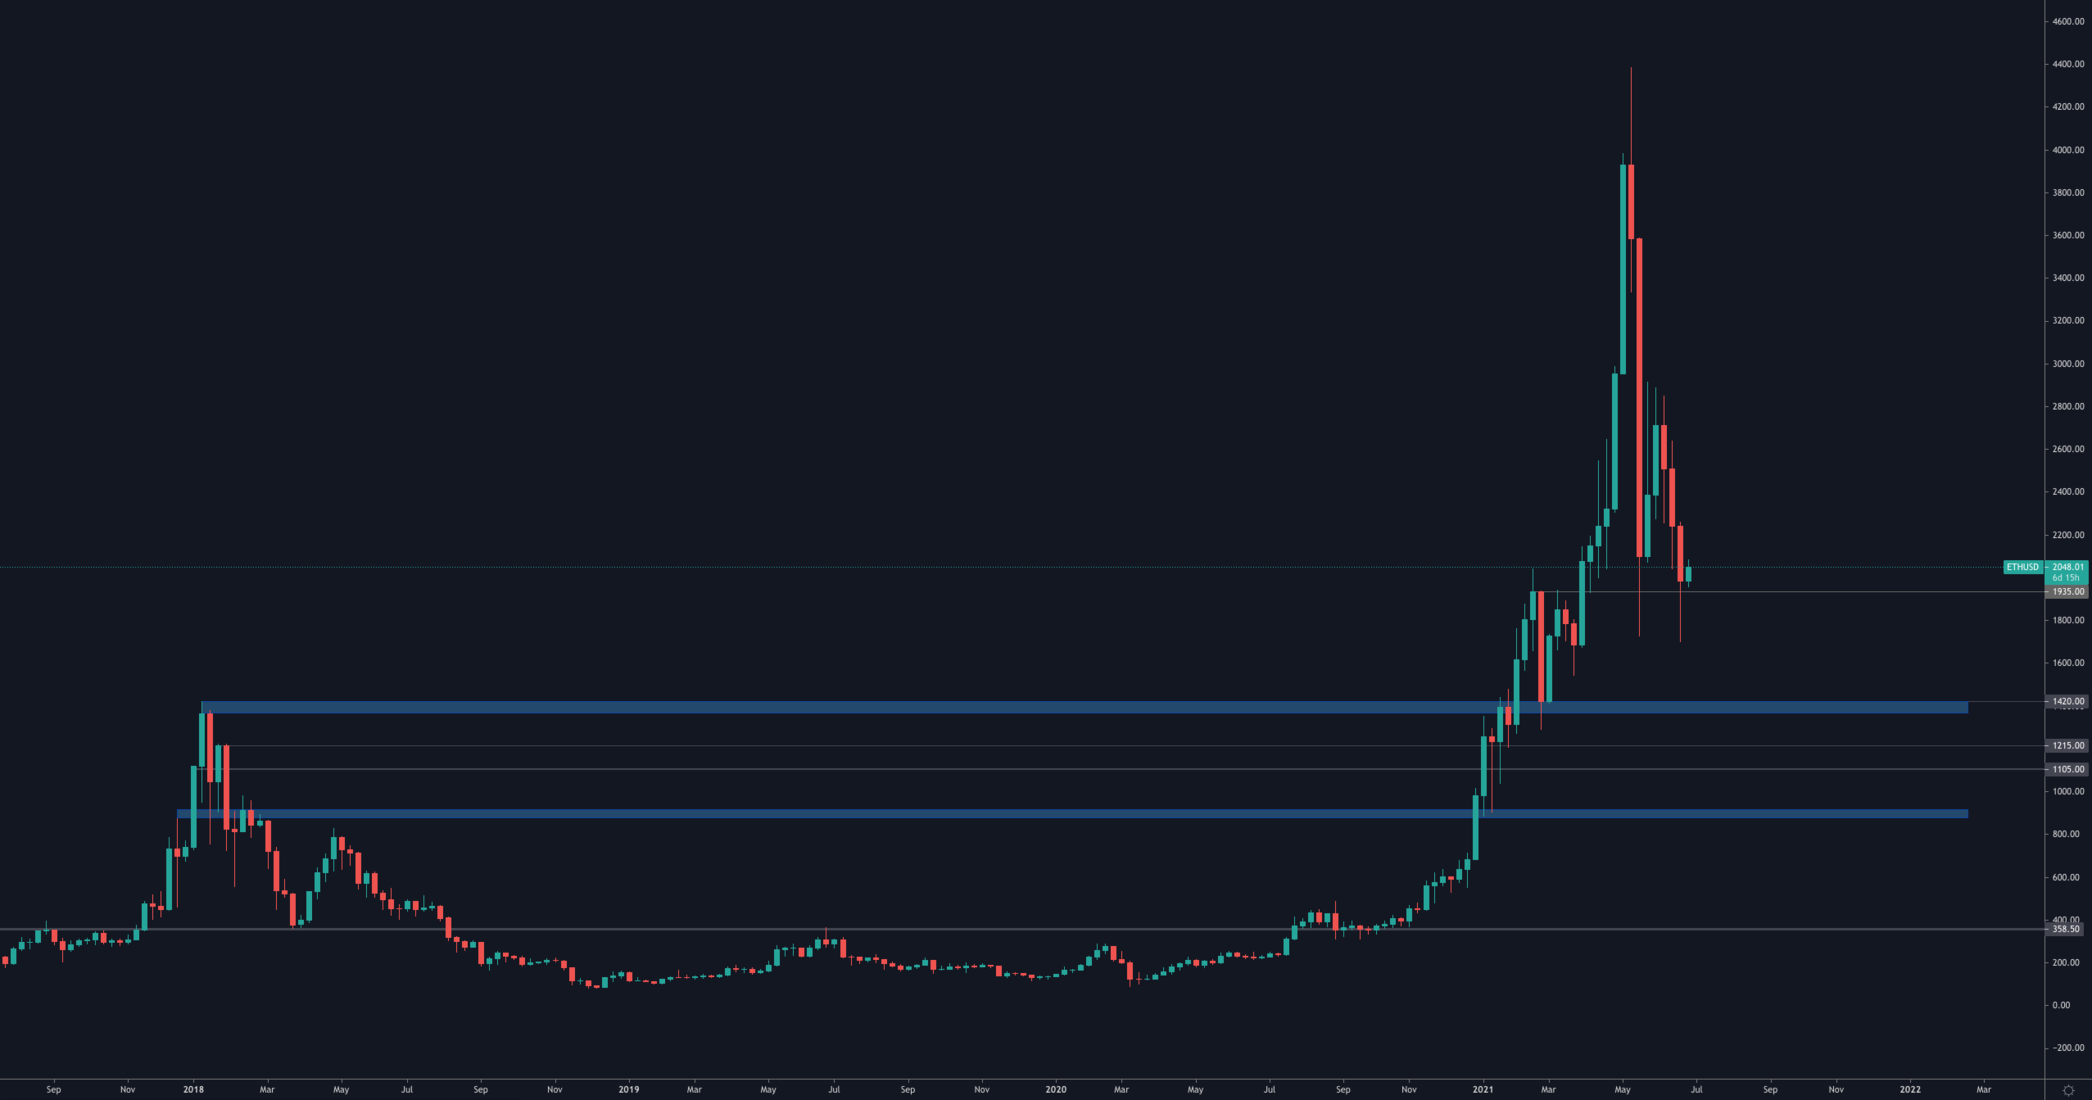
Ether's price action set a new lower low on both an absolute and candle closure basis. Nonetheless, price maintained the $1,935 level of support which was built by the first rally's top after the breakout from 2017 highs.
DOT
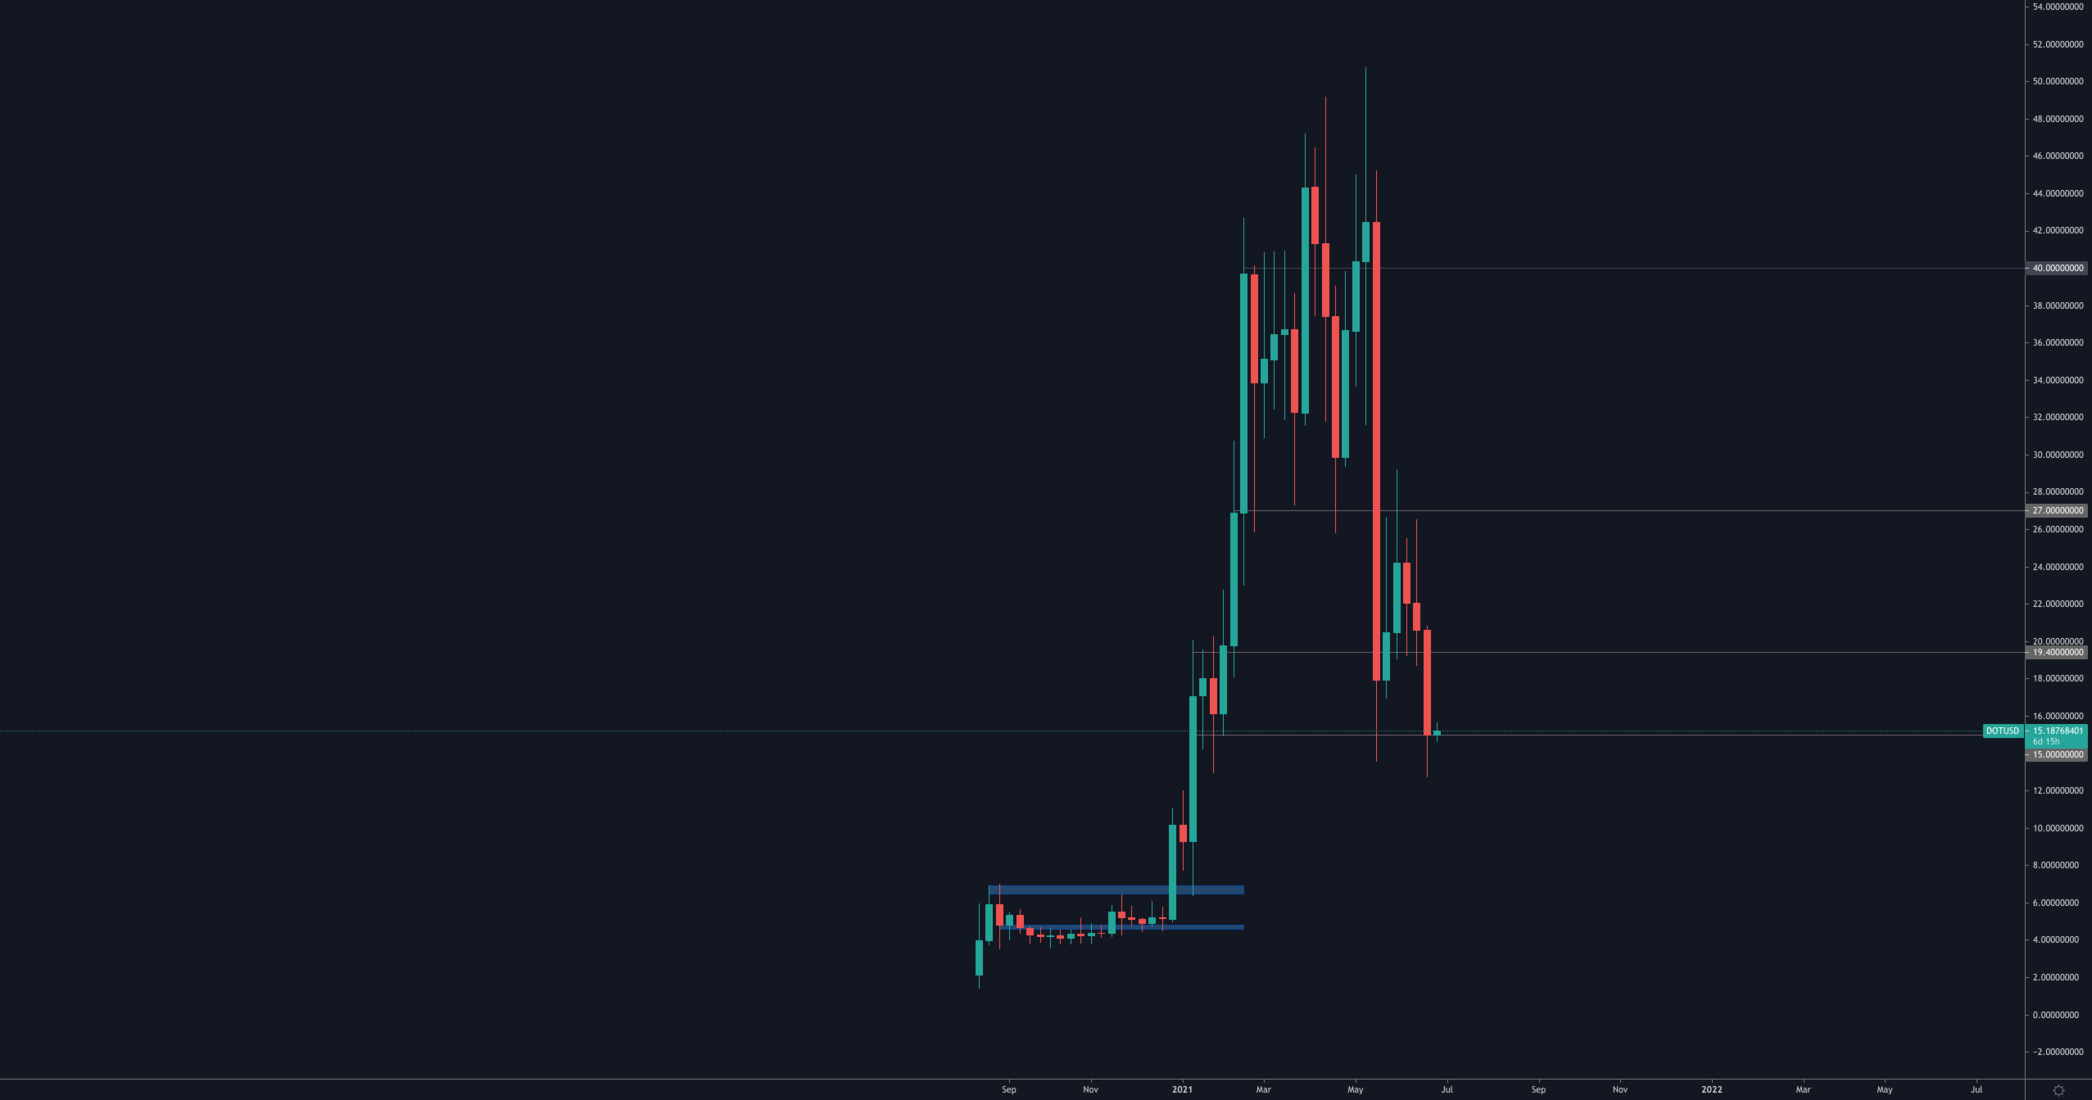
Another crypto-asset saved by the bell with a weekly candle closure above support - in this case $15. DOT must hold that level because otherwise it opens up the door to single digit DOT (i.e. sub-$10). There is still uncertainty around DOT because while it did close above support it also did create a lower low and hence this uncertainty ends either by a reclaim of $19.40 which would lead towards $27 and higher or through a break of $15 which would bring forward sub-$10 prices.
SNX
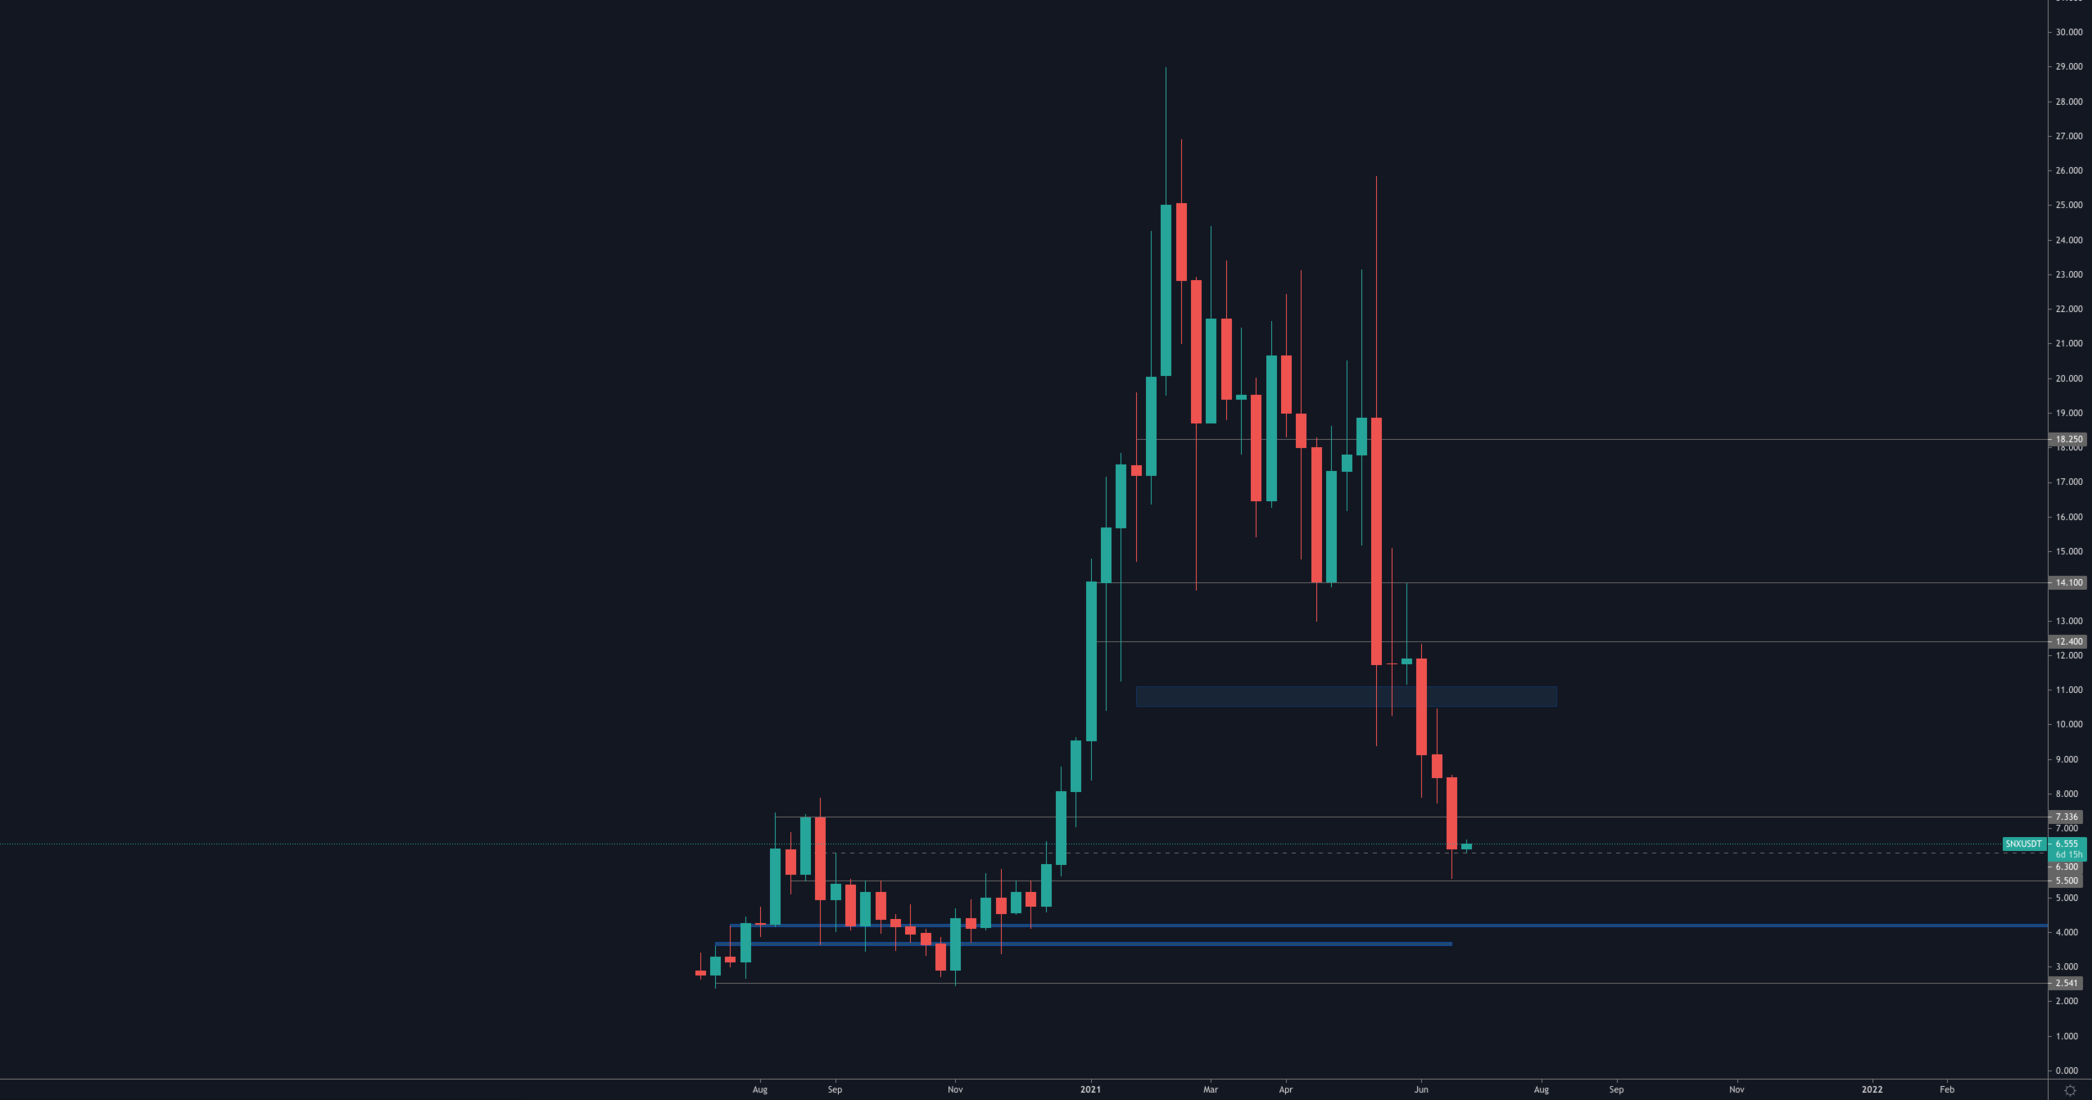
SNX is one of the few assets that were not saved by the bell because it was unable to reclaim $7.50 on the weekly timeframe which represents the high set during the 2020 DeFi summer. This means SNX will remain stuck between [$5.50-$7.50] for the time being.
RUNE
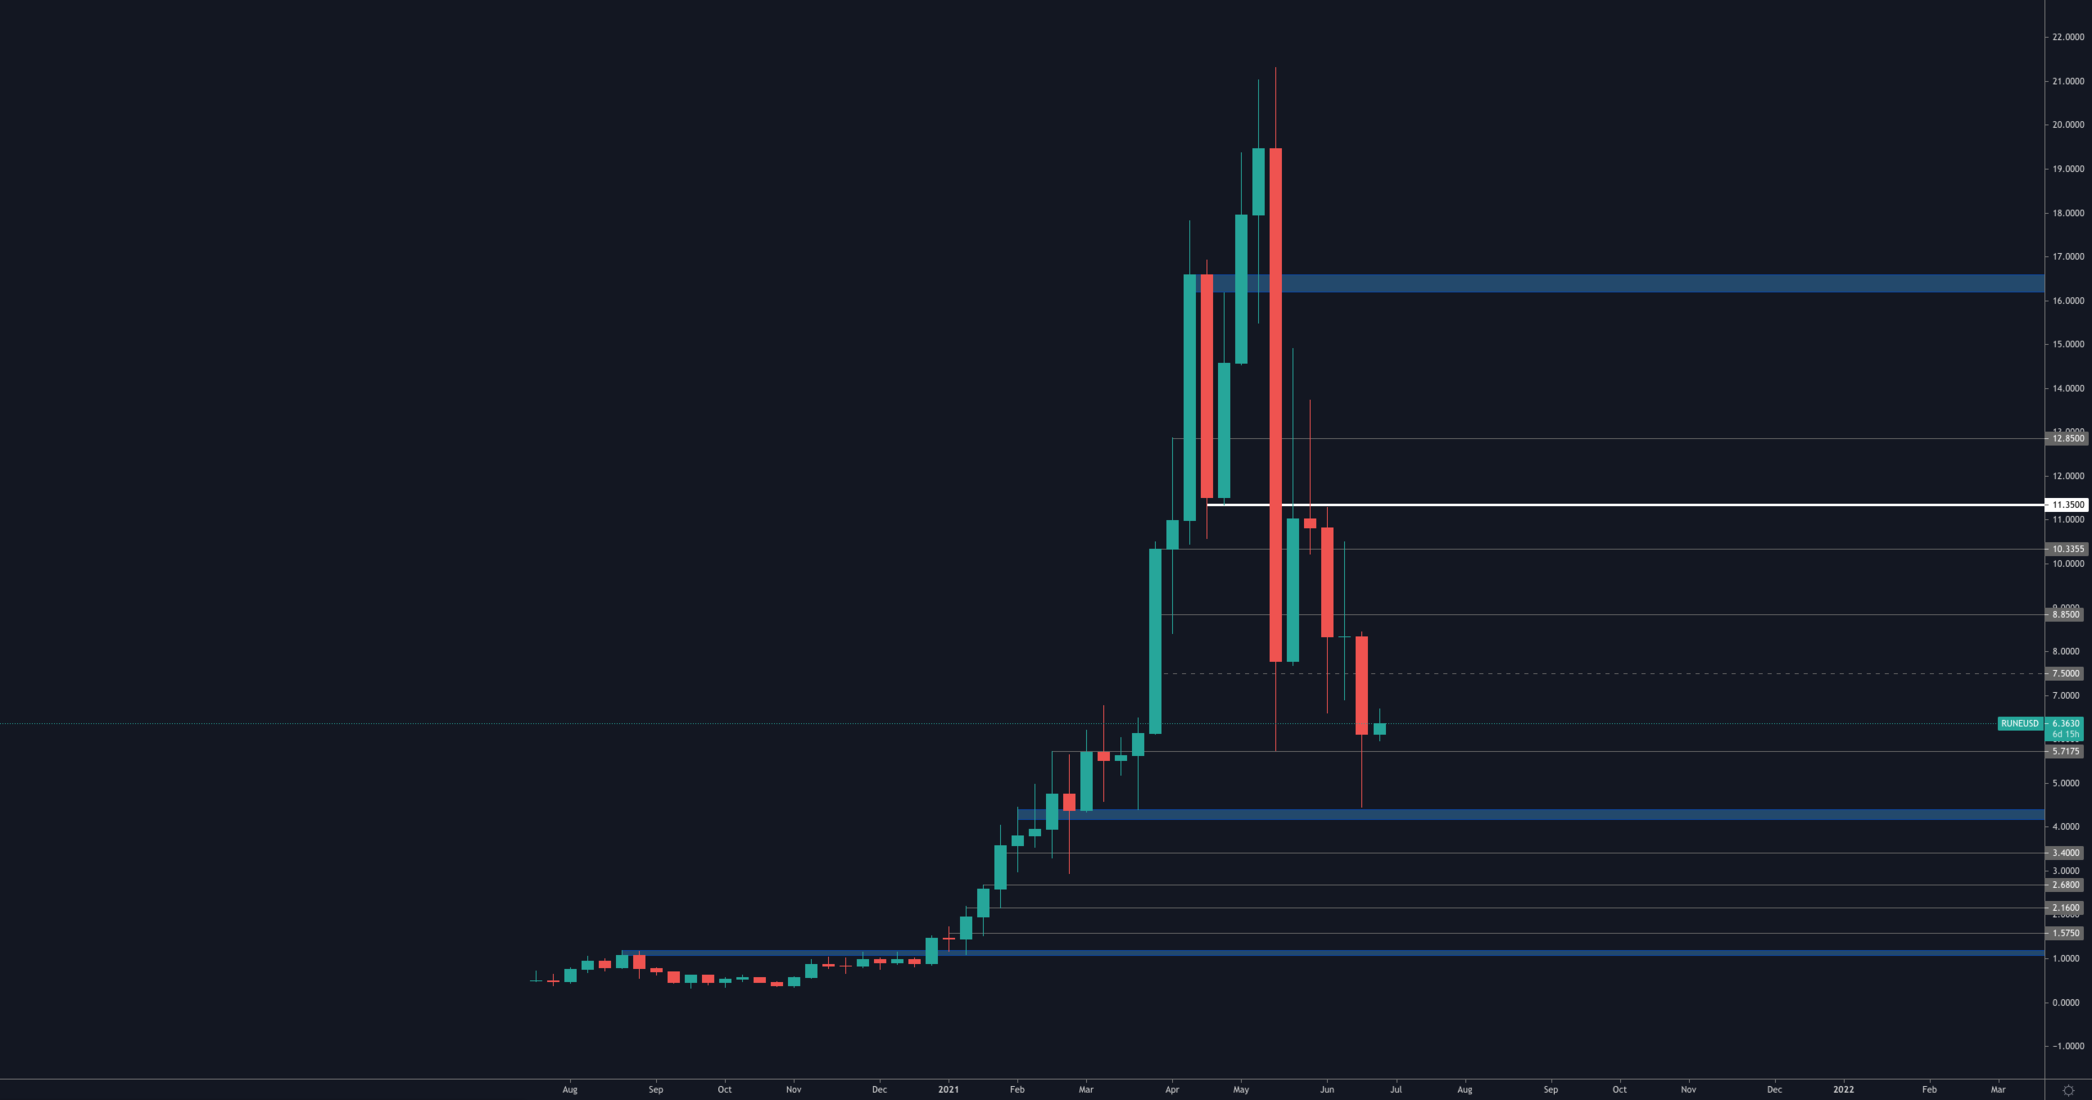
Reasonable weekly closure above $5.75 (better than SNX's closure), however we must not the lower lows and this will likely induce a few boring months of ranging sideways price action before a reclaim of $11.50 on the weekly timeframe (thick white line) which would represent the end of this bearish market structure.
SOL
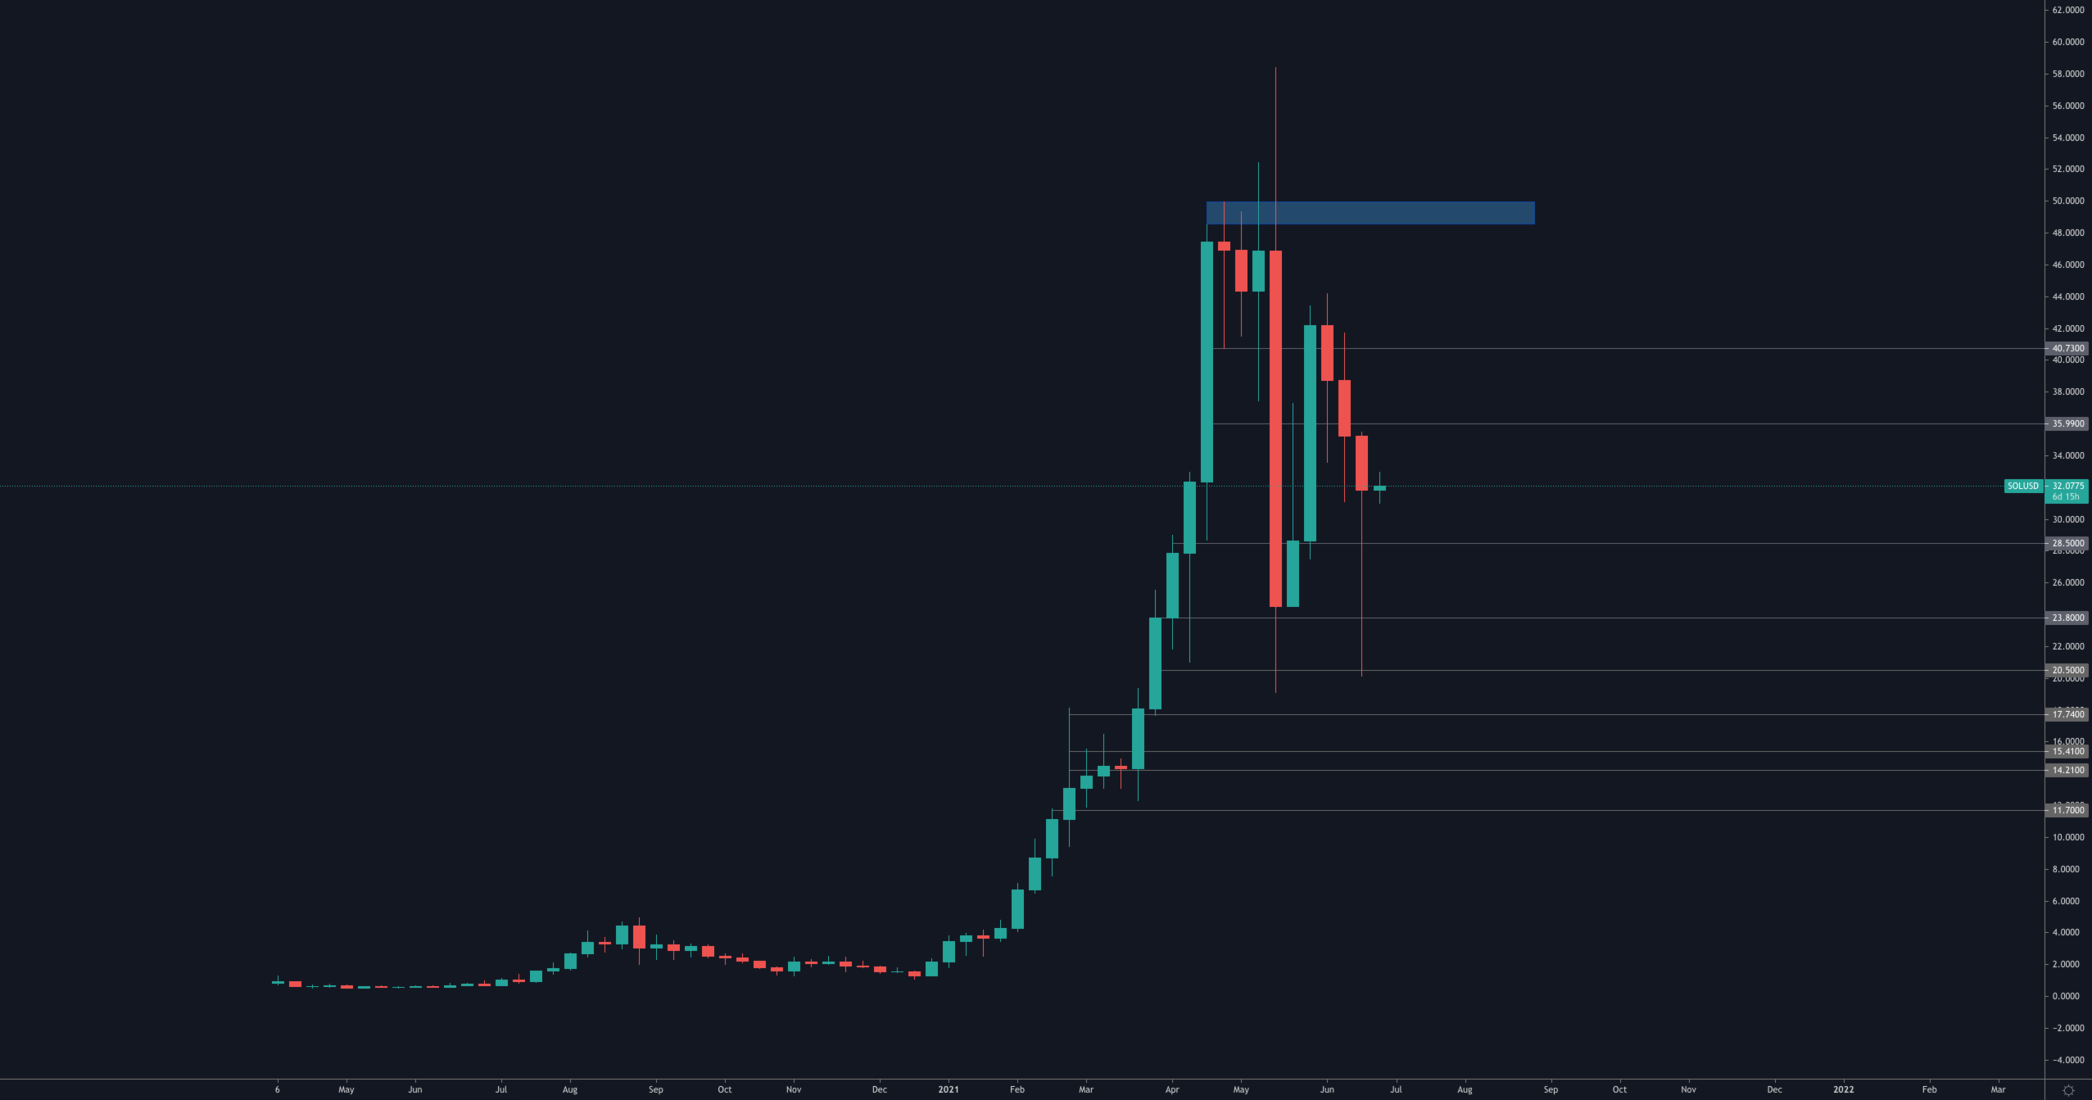
SOL has the most bullish weekly candle closure amongst all assets covered in this version of Weekly Technicals Pro. The large downside wick is a sign of demand and SOL was able to close well above the $28.50 support. Additionally, SOL did not create a lower low, neither on an absolute basis nor on a weekly candle closure one.
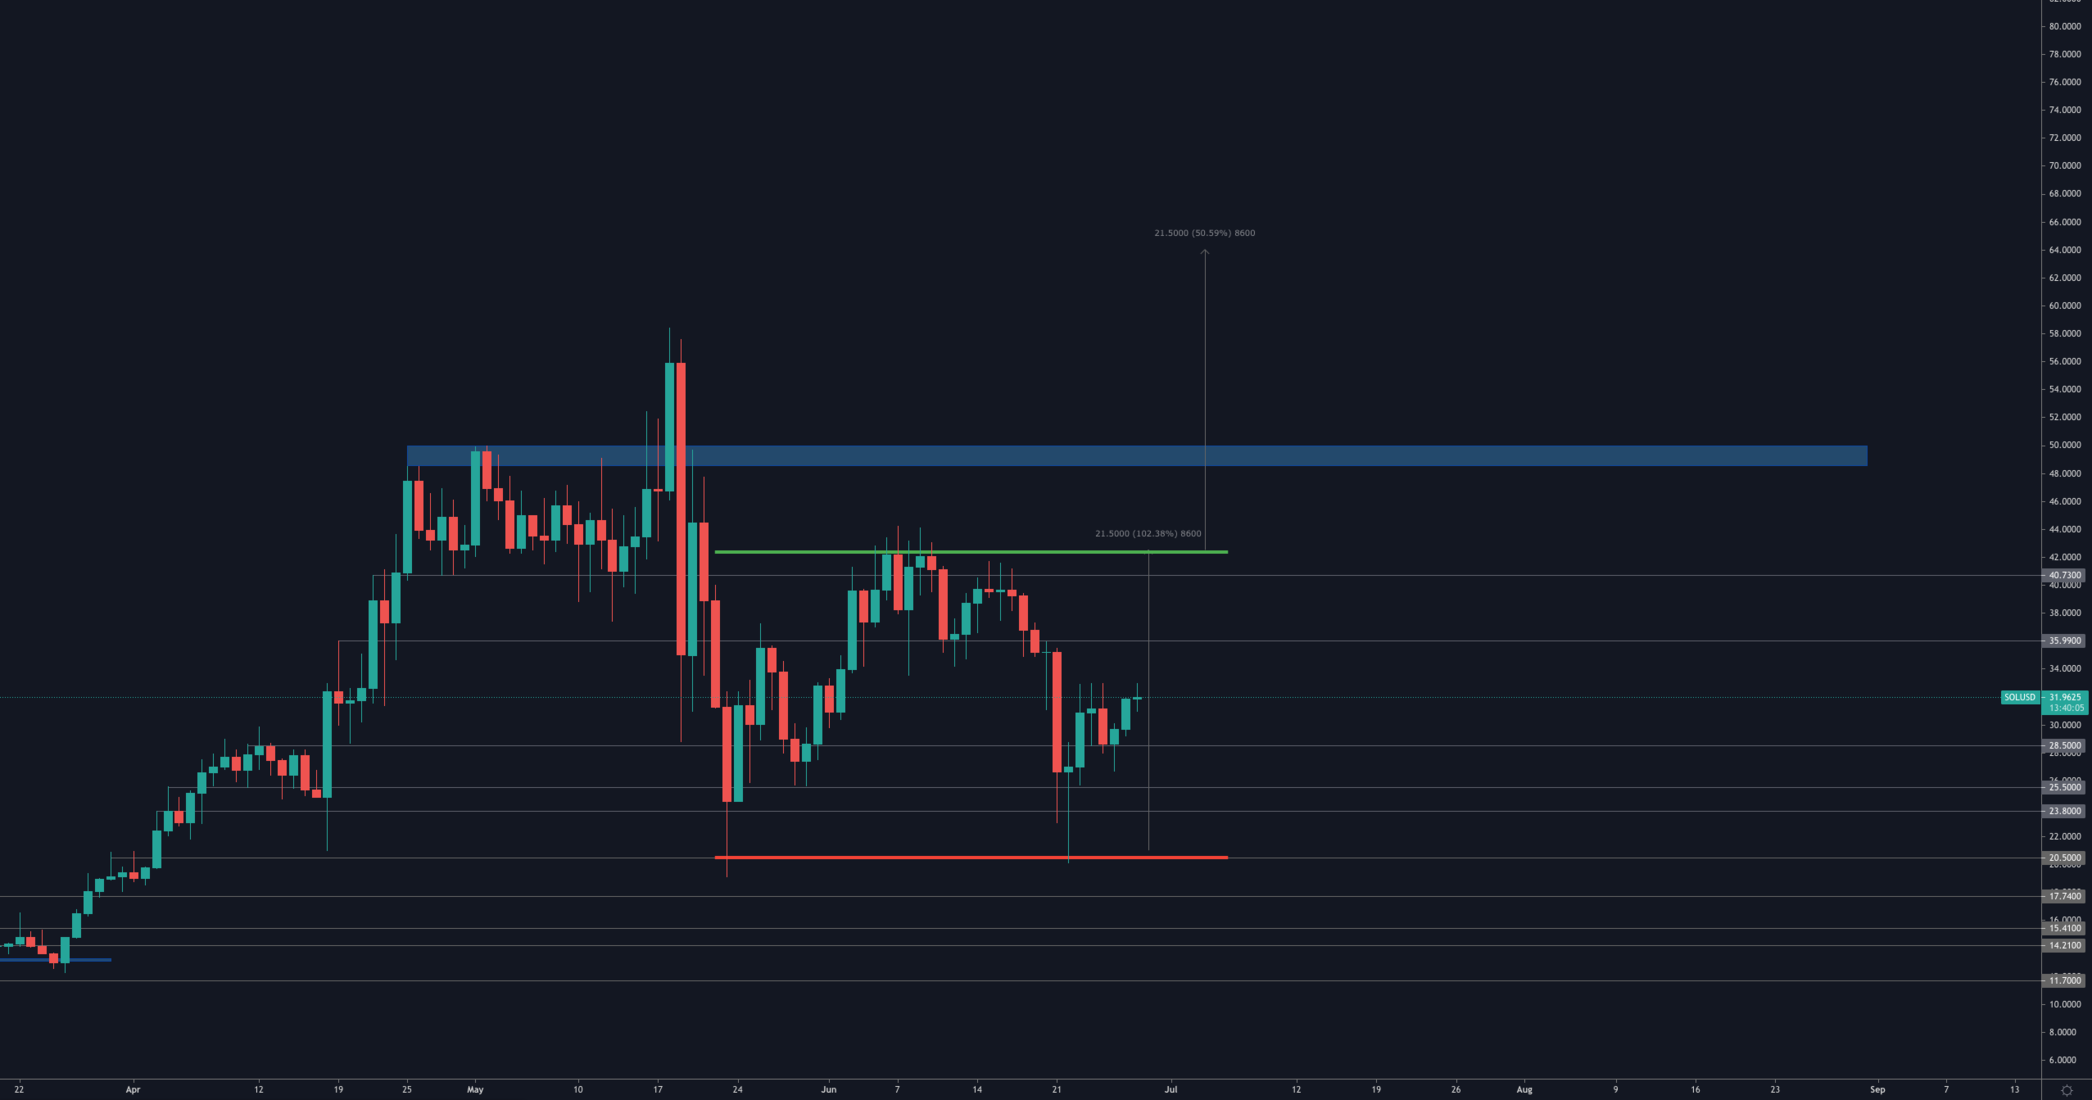
If SOL manages to close above $42.50 on the daily timeframe, it would confirm the breakout from a double bottom formation, leading it towards $64.
SRM
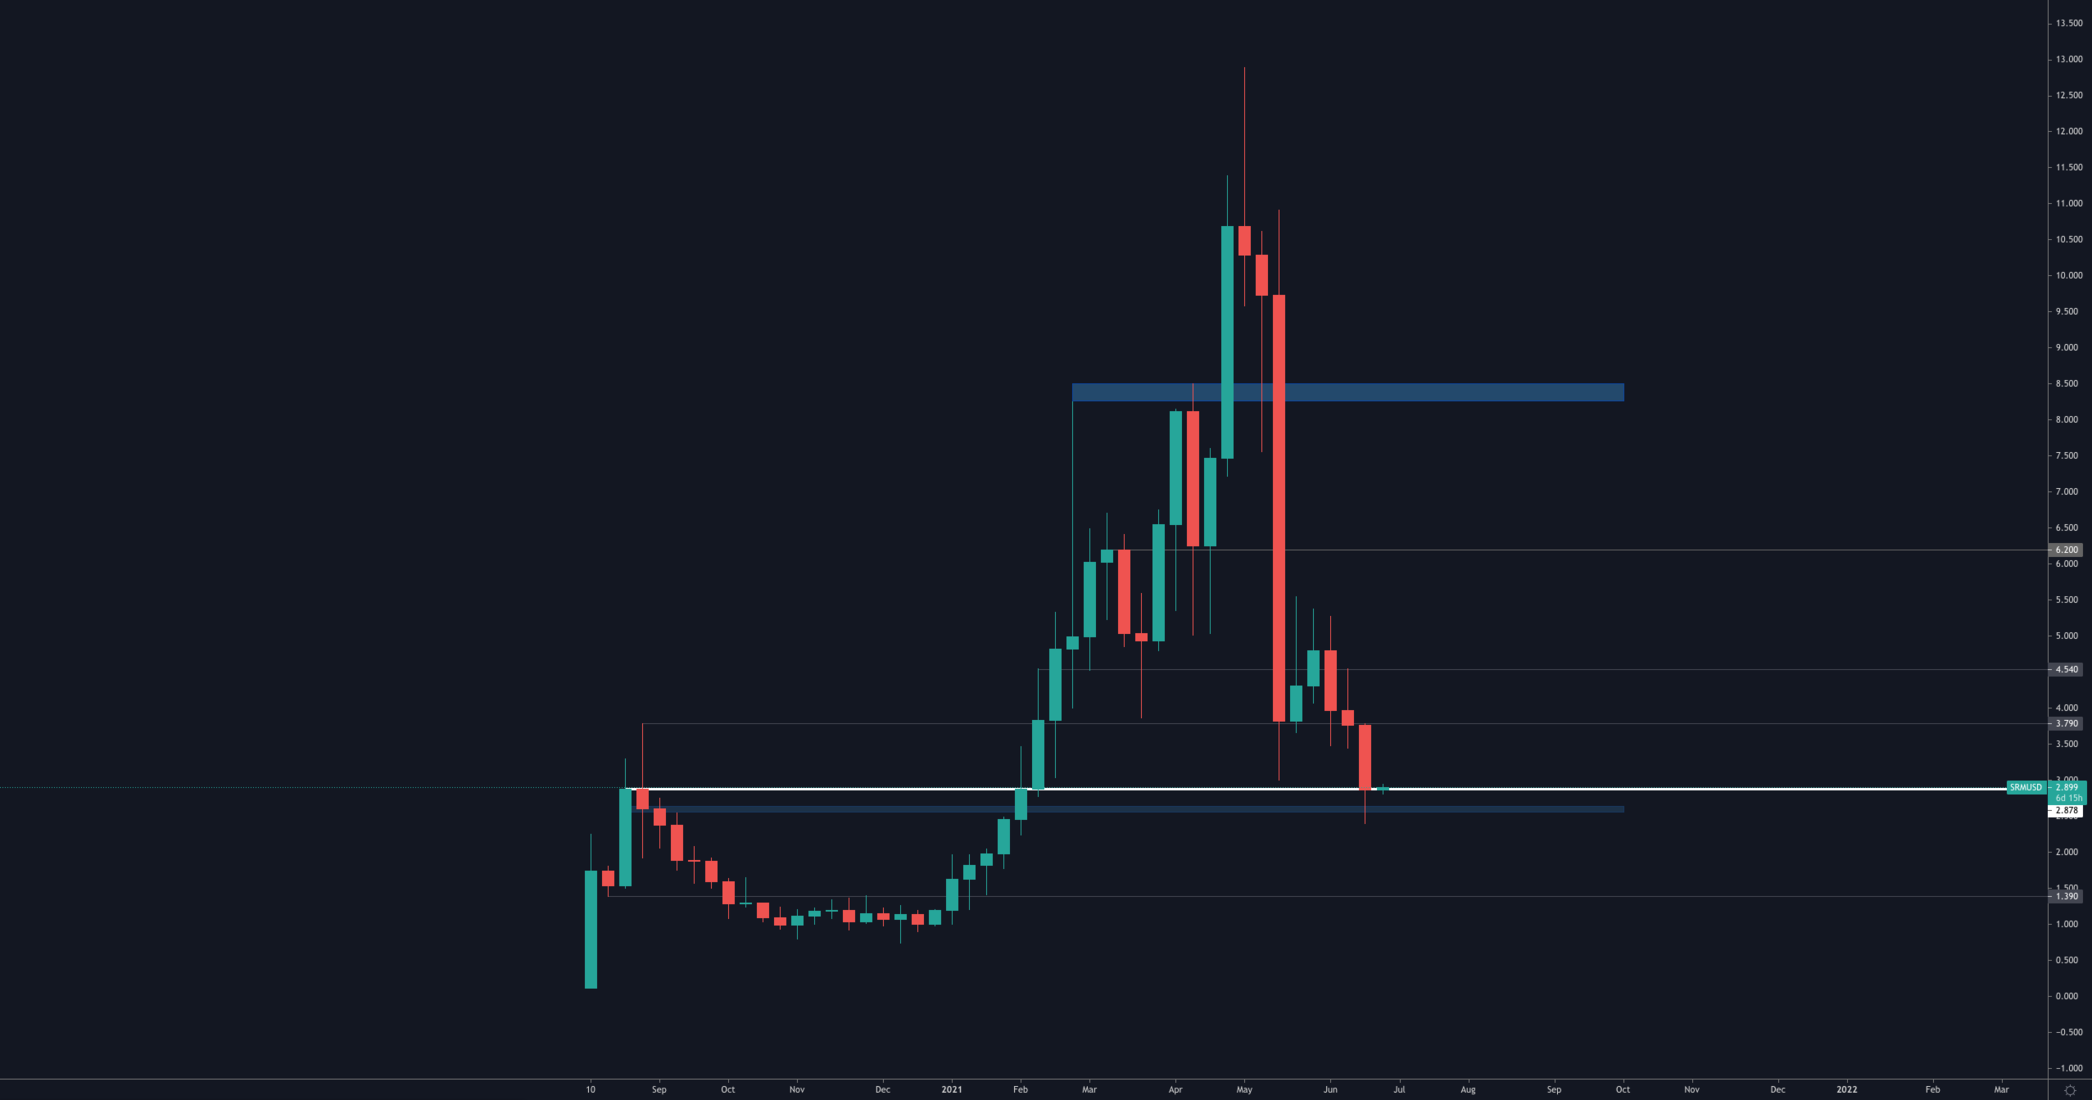
On the weekly timeframe, SRM's price action is somewhat acceptable given the fact that it is testing previous rally's weekly high. Nonetheless, on the daily timeframe, as stated in Discord, SRM is in a very bad spot and it must reclaim $3.79 for any sort of further upside. Hanging around $2.50 can quickly lead towards $1.40.
FTT
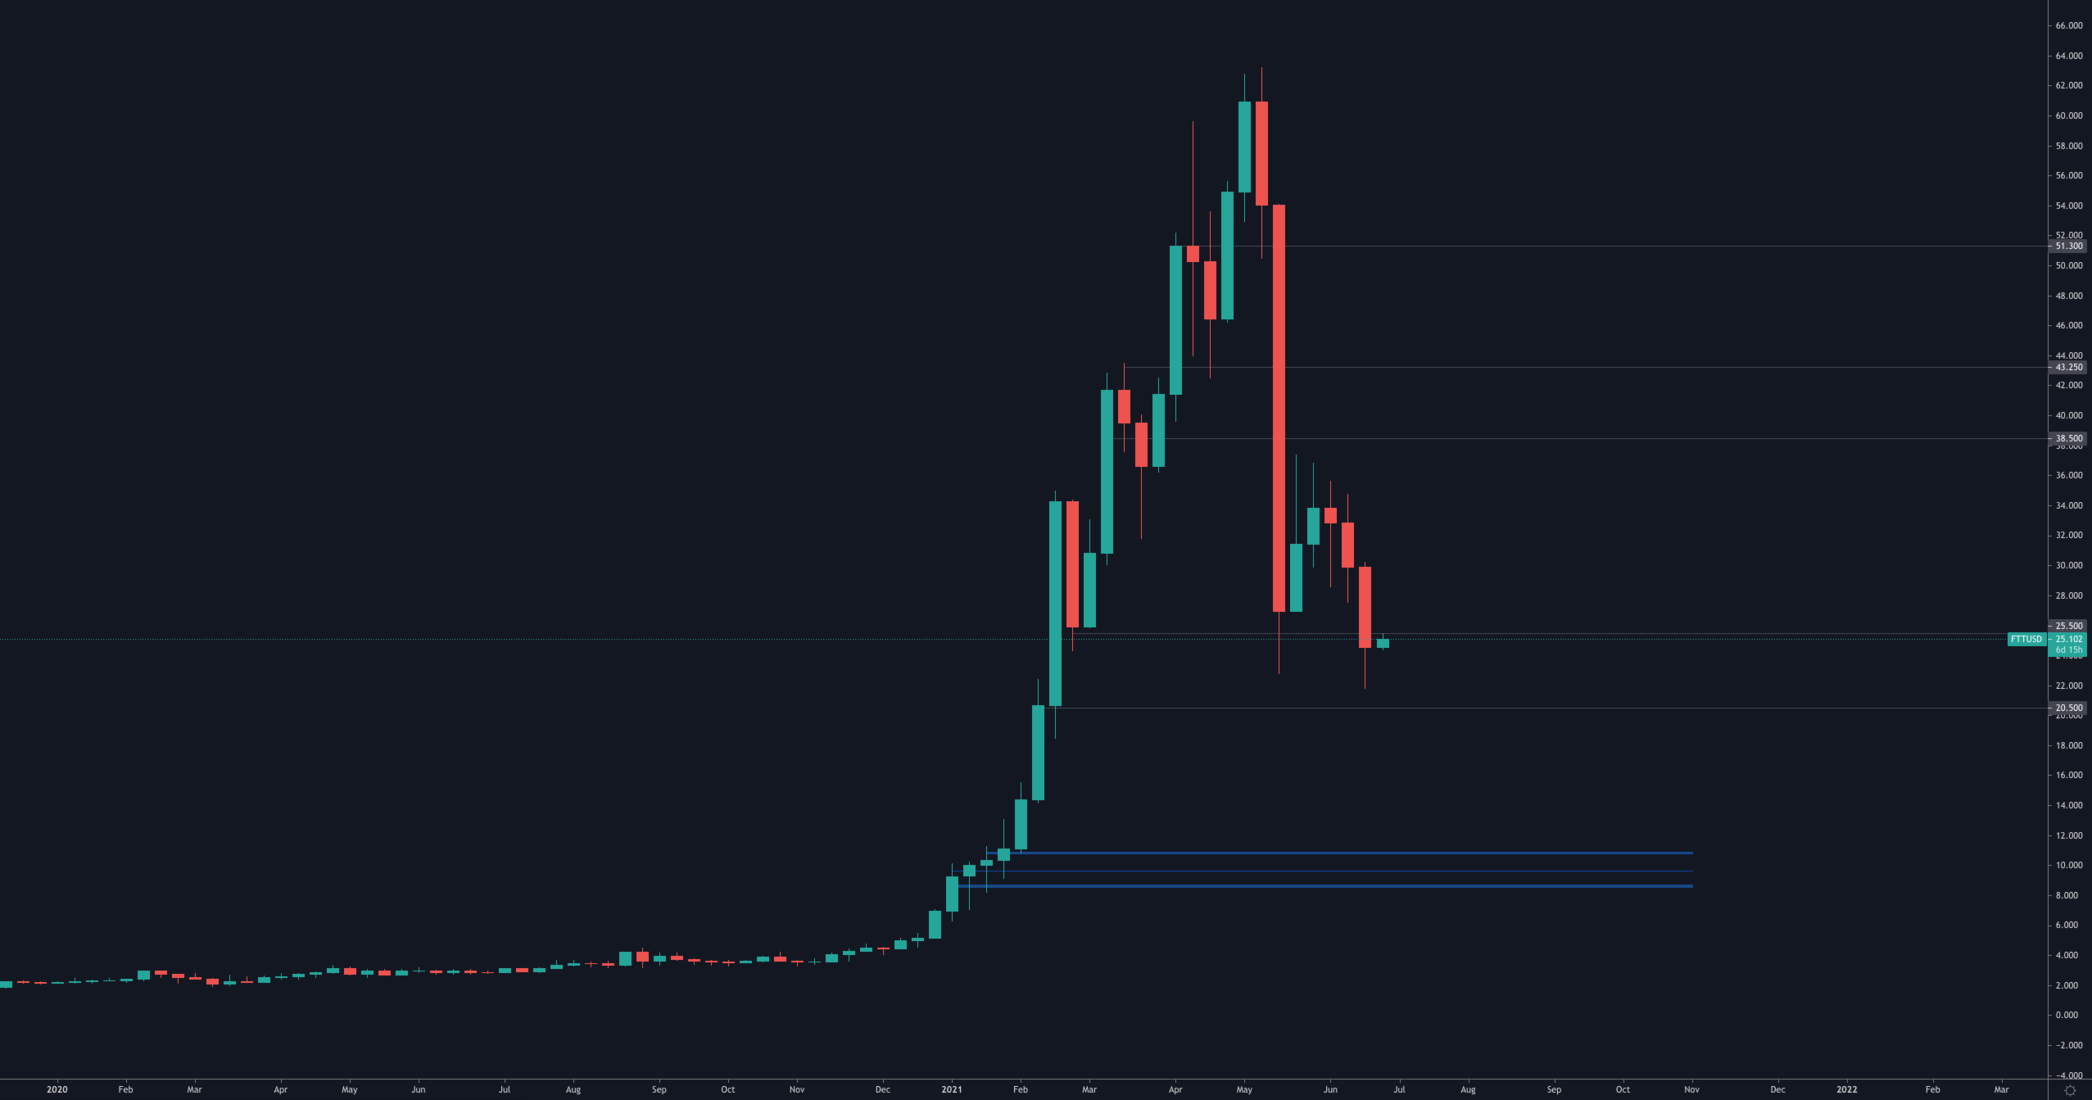
Another asset that was not saved by the bell as the weekly candle created a new low and closed under resistance which means FTT has the stage set for it to test $20.50. However, we must keep in mind that the ultimate decision is BTC's.
MINA
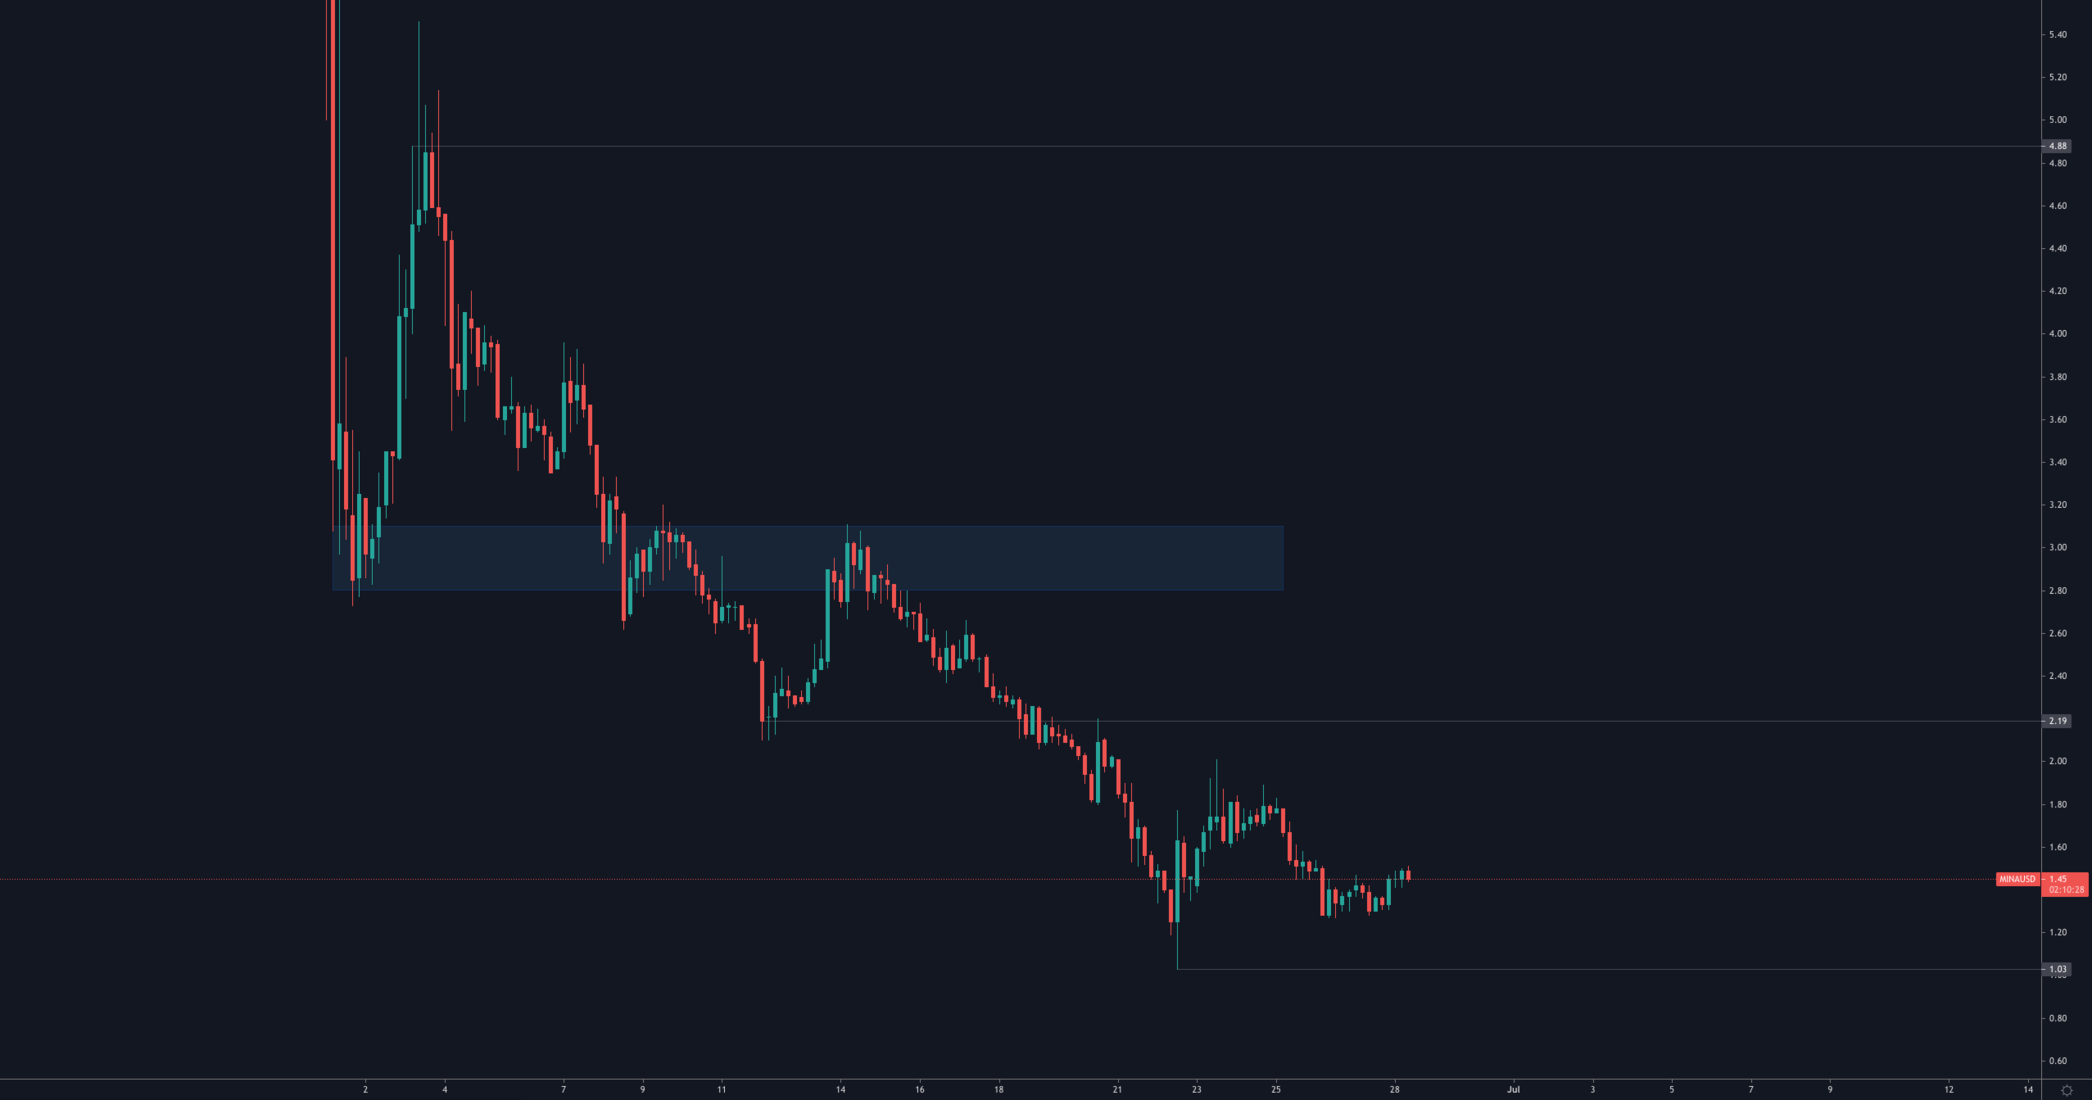
MINA's downside movements are starting to slow down after large volumes appeared near $1. This communicates that a bottom is likely near which would be followed by a boring sideways range for a few weeks (or even months) which represents an accumulation phase.
Disclaimer: NOT FINANCIAL NOR INVESTMENT ADVICE. Only you are responsible for any capital-related decisions you make and only you are accountable for the results.
Recommended from Cryptonary


