Save 23% ($351) & Get a Free 1-1 Call with our Team ⏰ : 0d 2h 59m 44s
Weekly Technicals Pro - Volume 66
This period of time is the longest that the market has spent cluttered near Extreme Fear in the last three and a half years. As stated in former version of Weekly Technicals, the only two other data points of clutters near low levels of fear were:

[embeddoc url="https://cryptonary.s3.eu-west-2.amazonaws.com/wp-content/uploads/2021/07/Weekly-Technicals-Pro-Volume-66.pdf"]
Market Sentiment
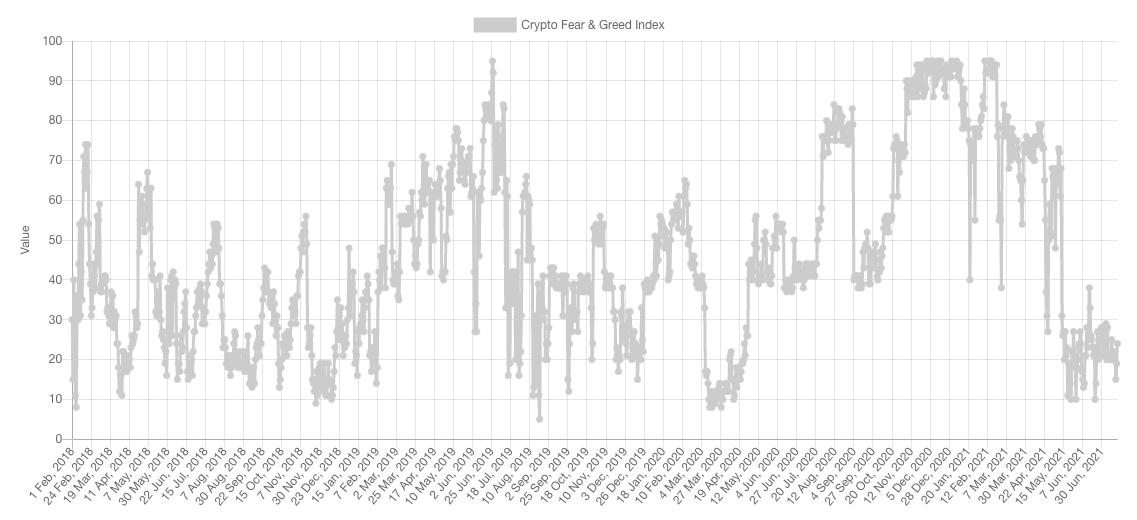
- The Nov/Dec 2018 Crash
- The 2020 Black Swan
Market Indexes
Total Market Cap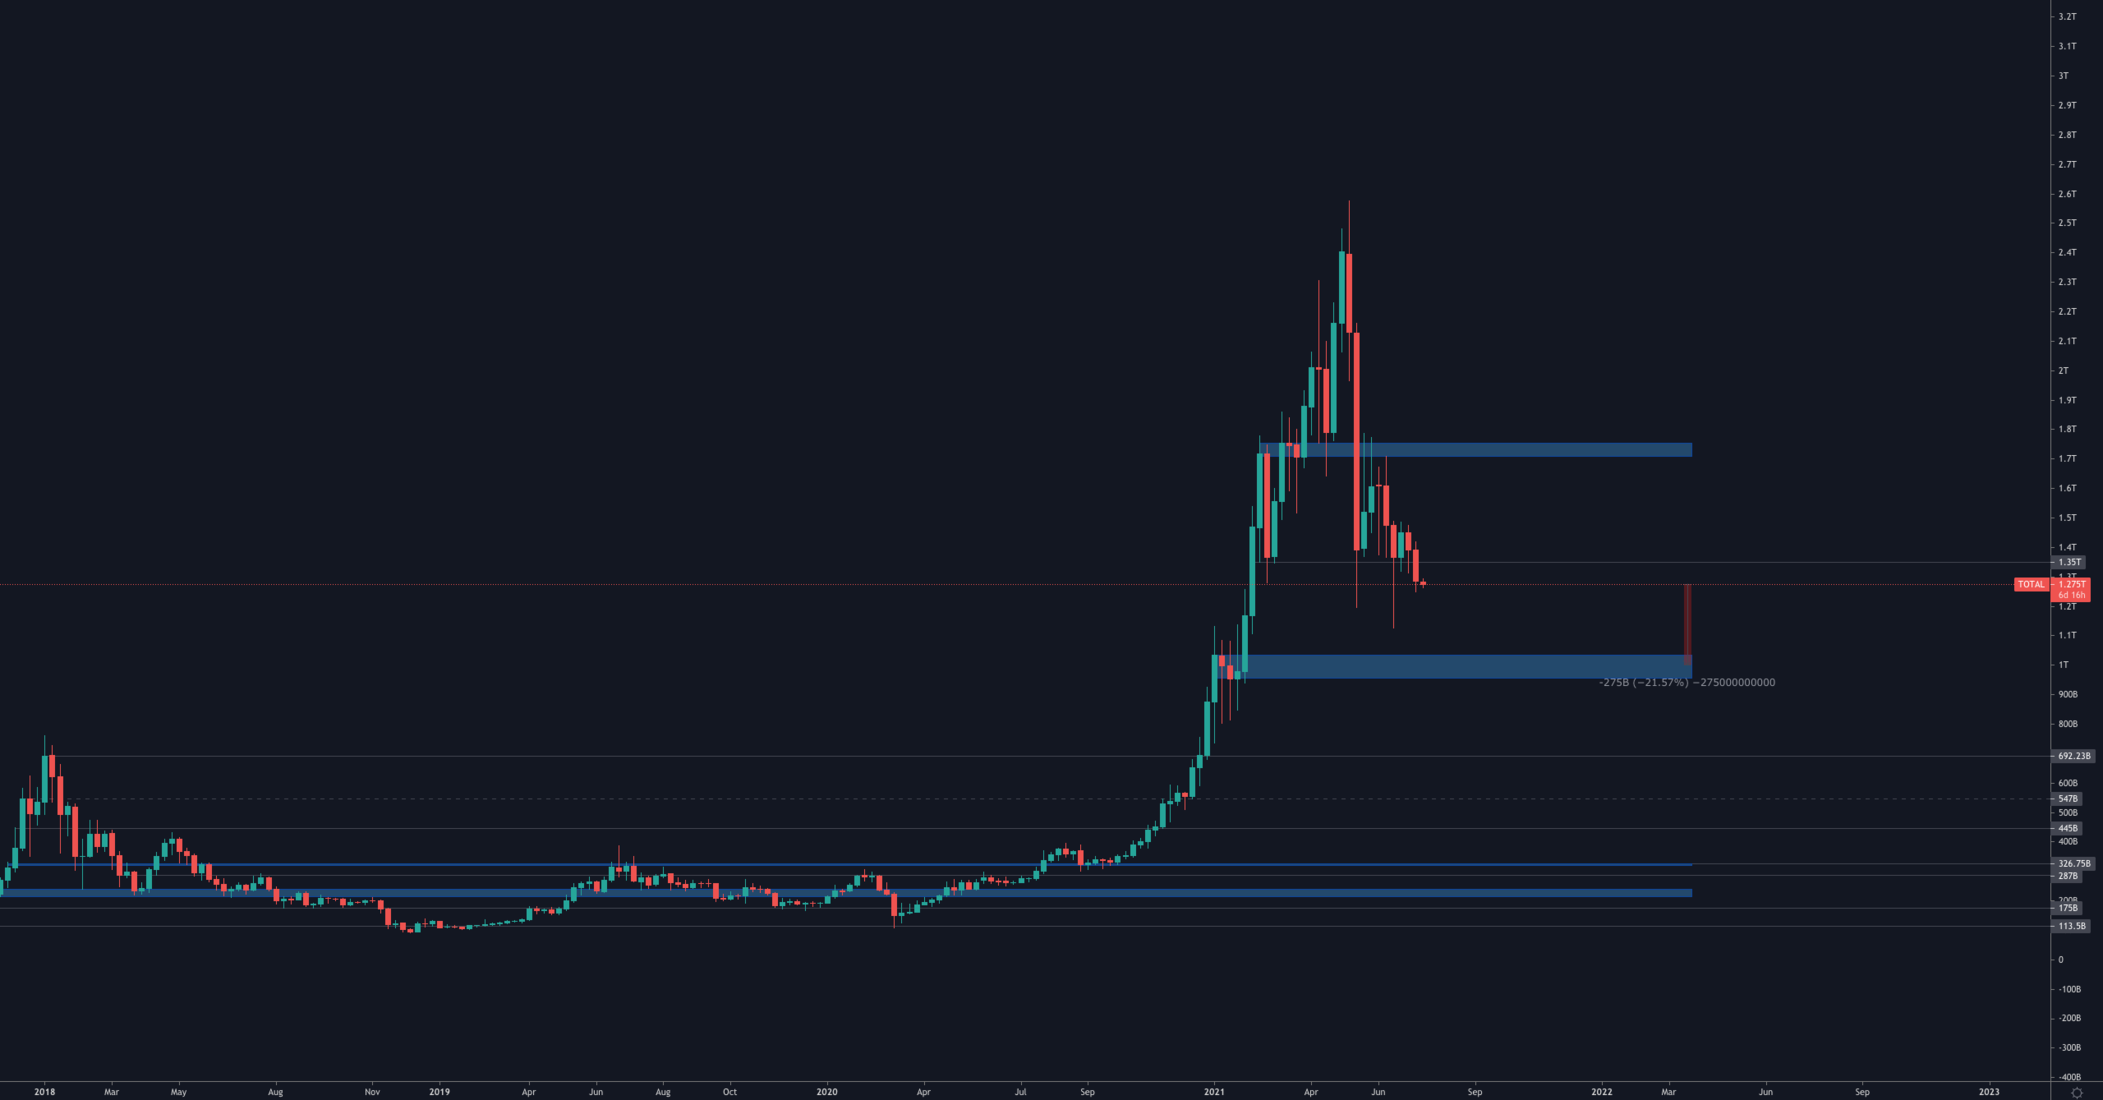
Despite market sentiment communicating buying opportunity, a few charts have technicals that differ in opinion.
The Total MCap has closed a weekly candle under the $1.35T level of support. This is a bearish development and communicates that there are increased odds of the market falling another -20% while heading towards the psychological and technical key level: $1 Trillion.
Altcoins Market Cap

The Alts MCap has set a new weekly candle closure low but did not break support, unlike the Total MCap.
The contradicting opinions between indexes puts the market in a tough place to analyse. In such cases, one method is to take each chart for its own merit, analyse individually and then weigh the heavier side in terms of votes by chart.
The Alts MCap chart is near its $645B weekly support level.
Bitcoin
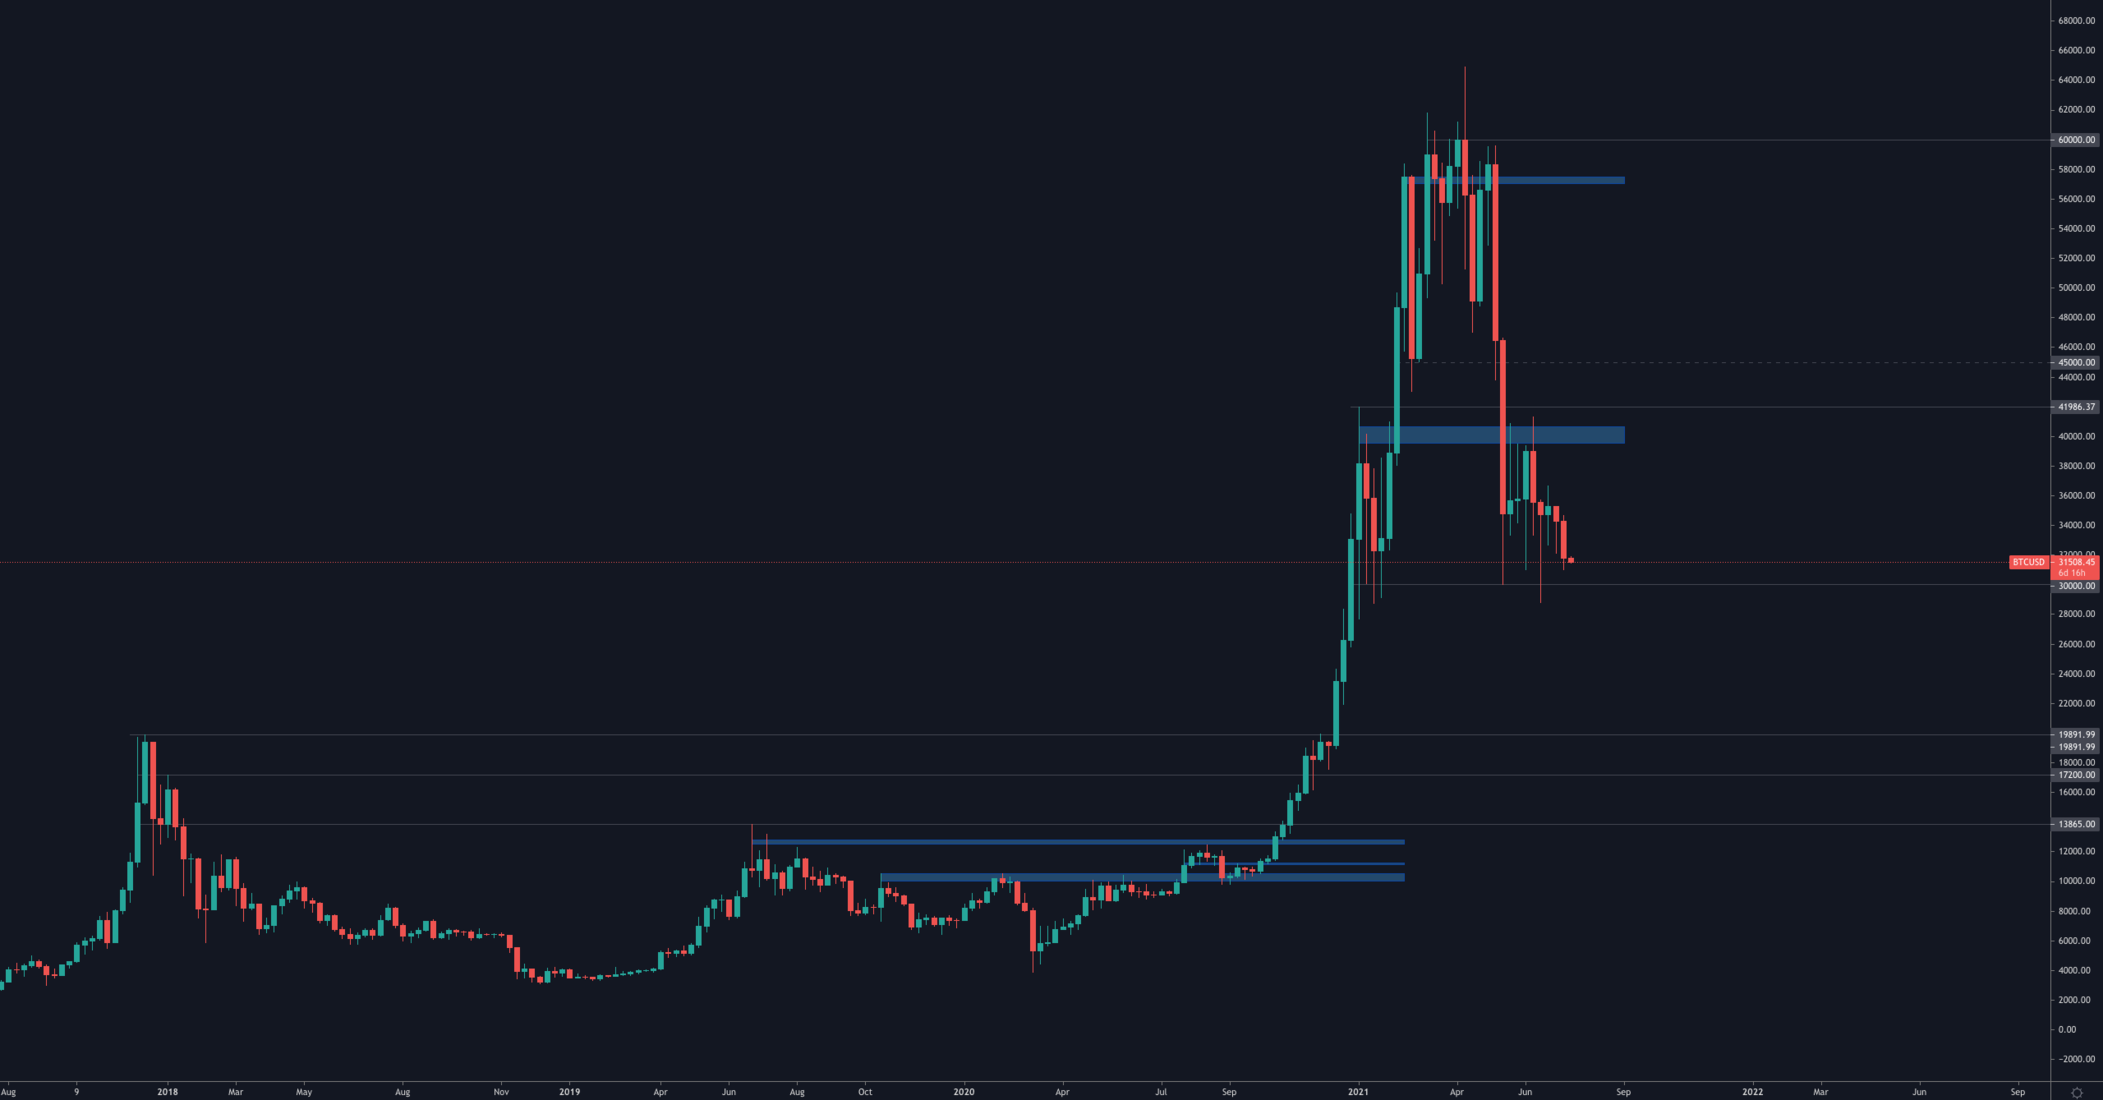
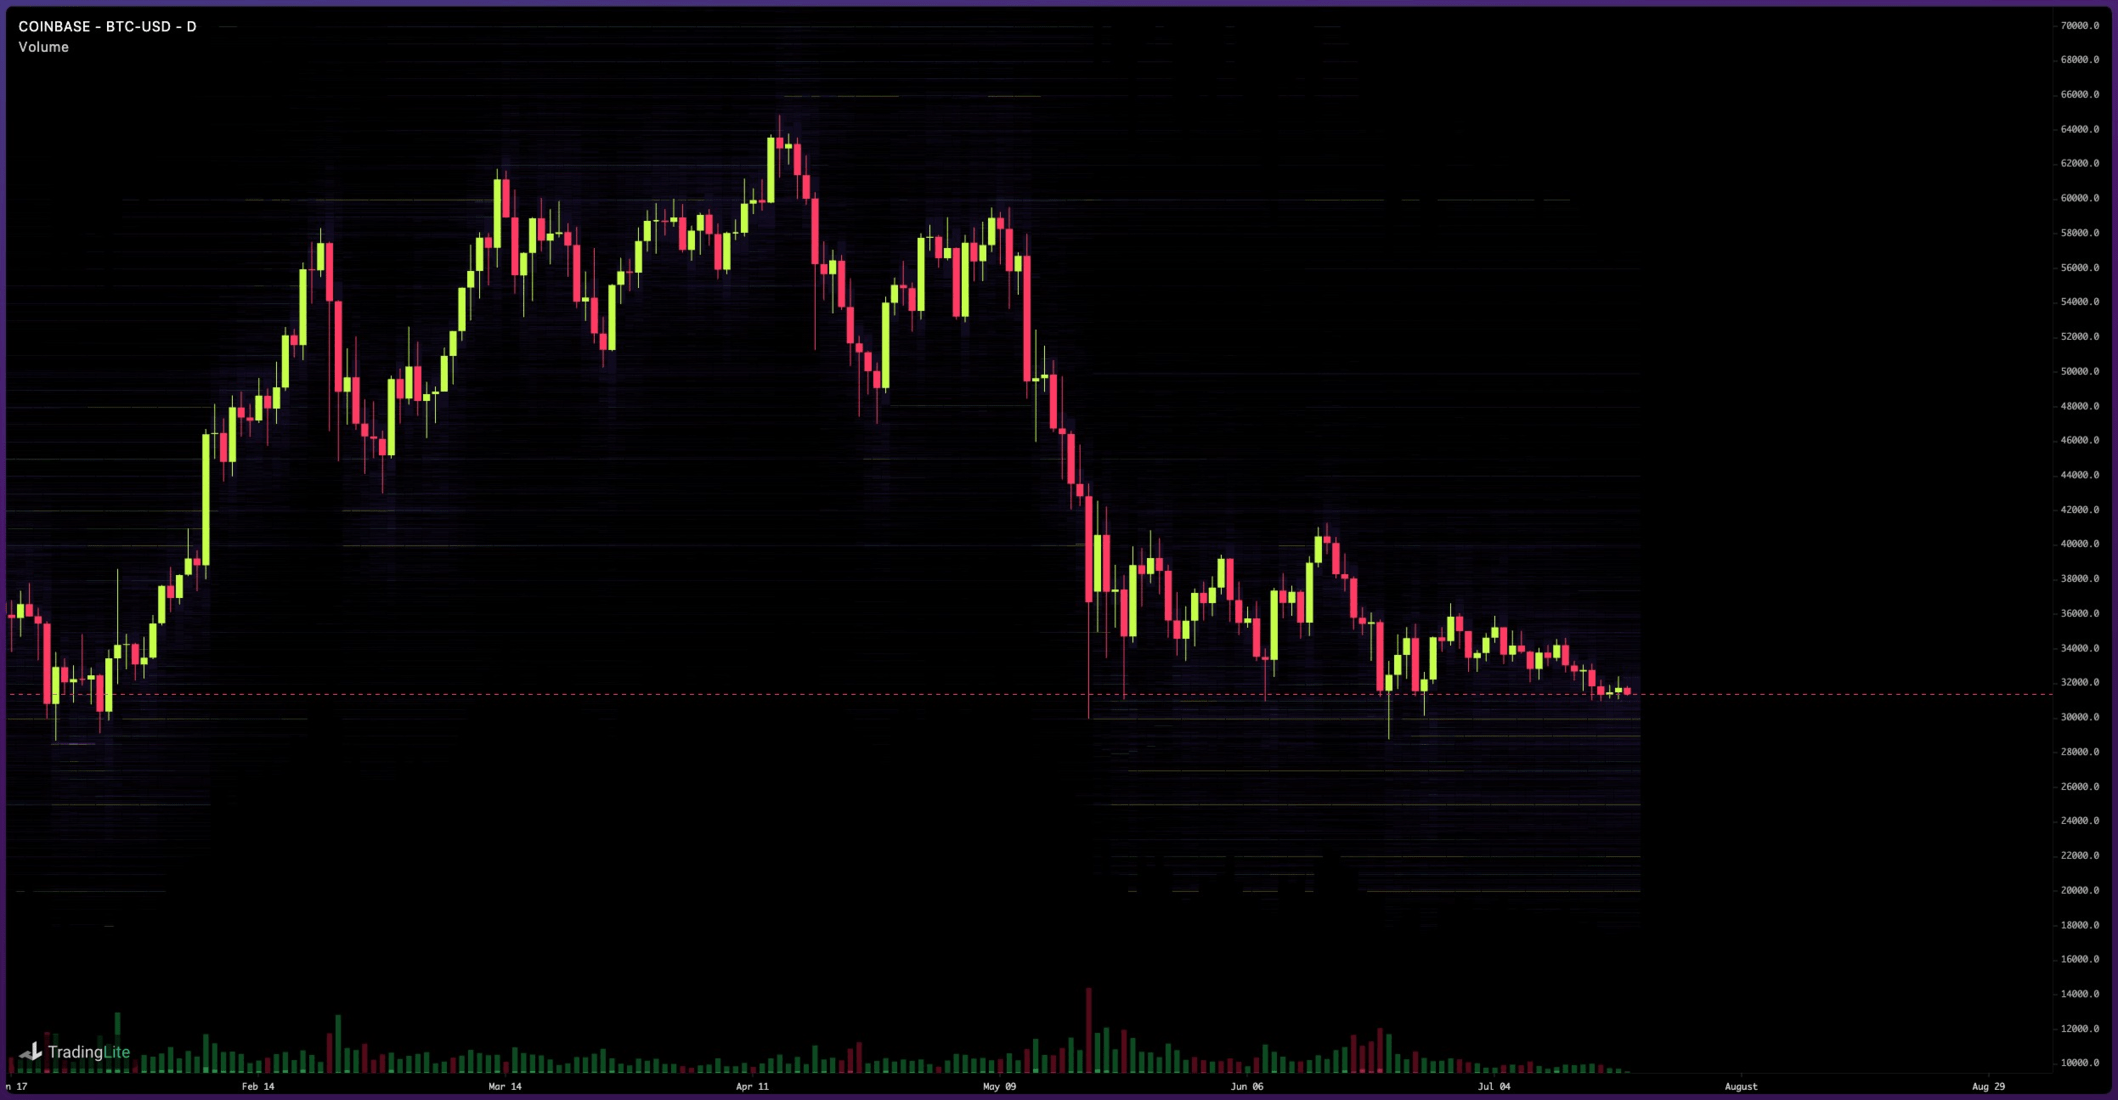
Bitcoin's price set a new weekly low which is being discussed broadly over social media, however we cannot ignore the common placing of wicks near $30,000 which represents the real level of interest. This is accentuated on the daily timeframe below.
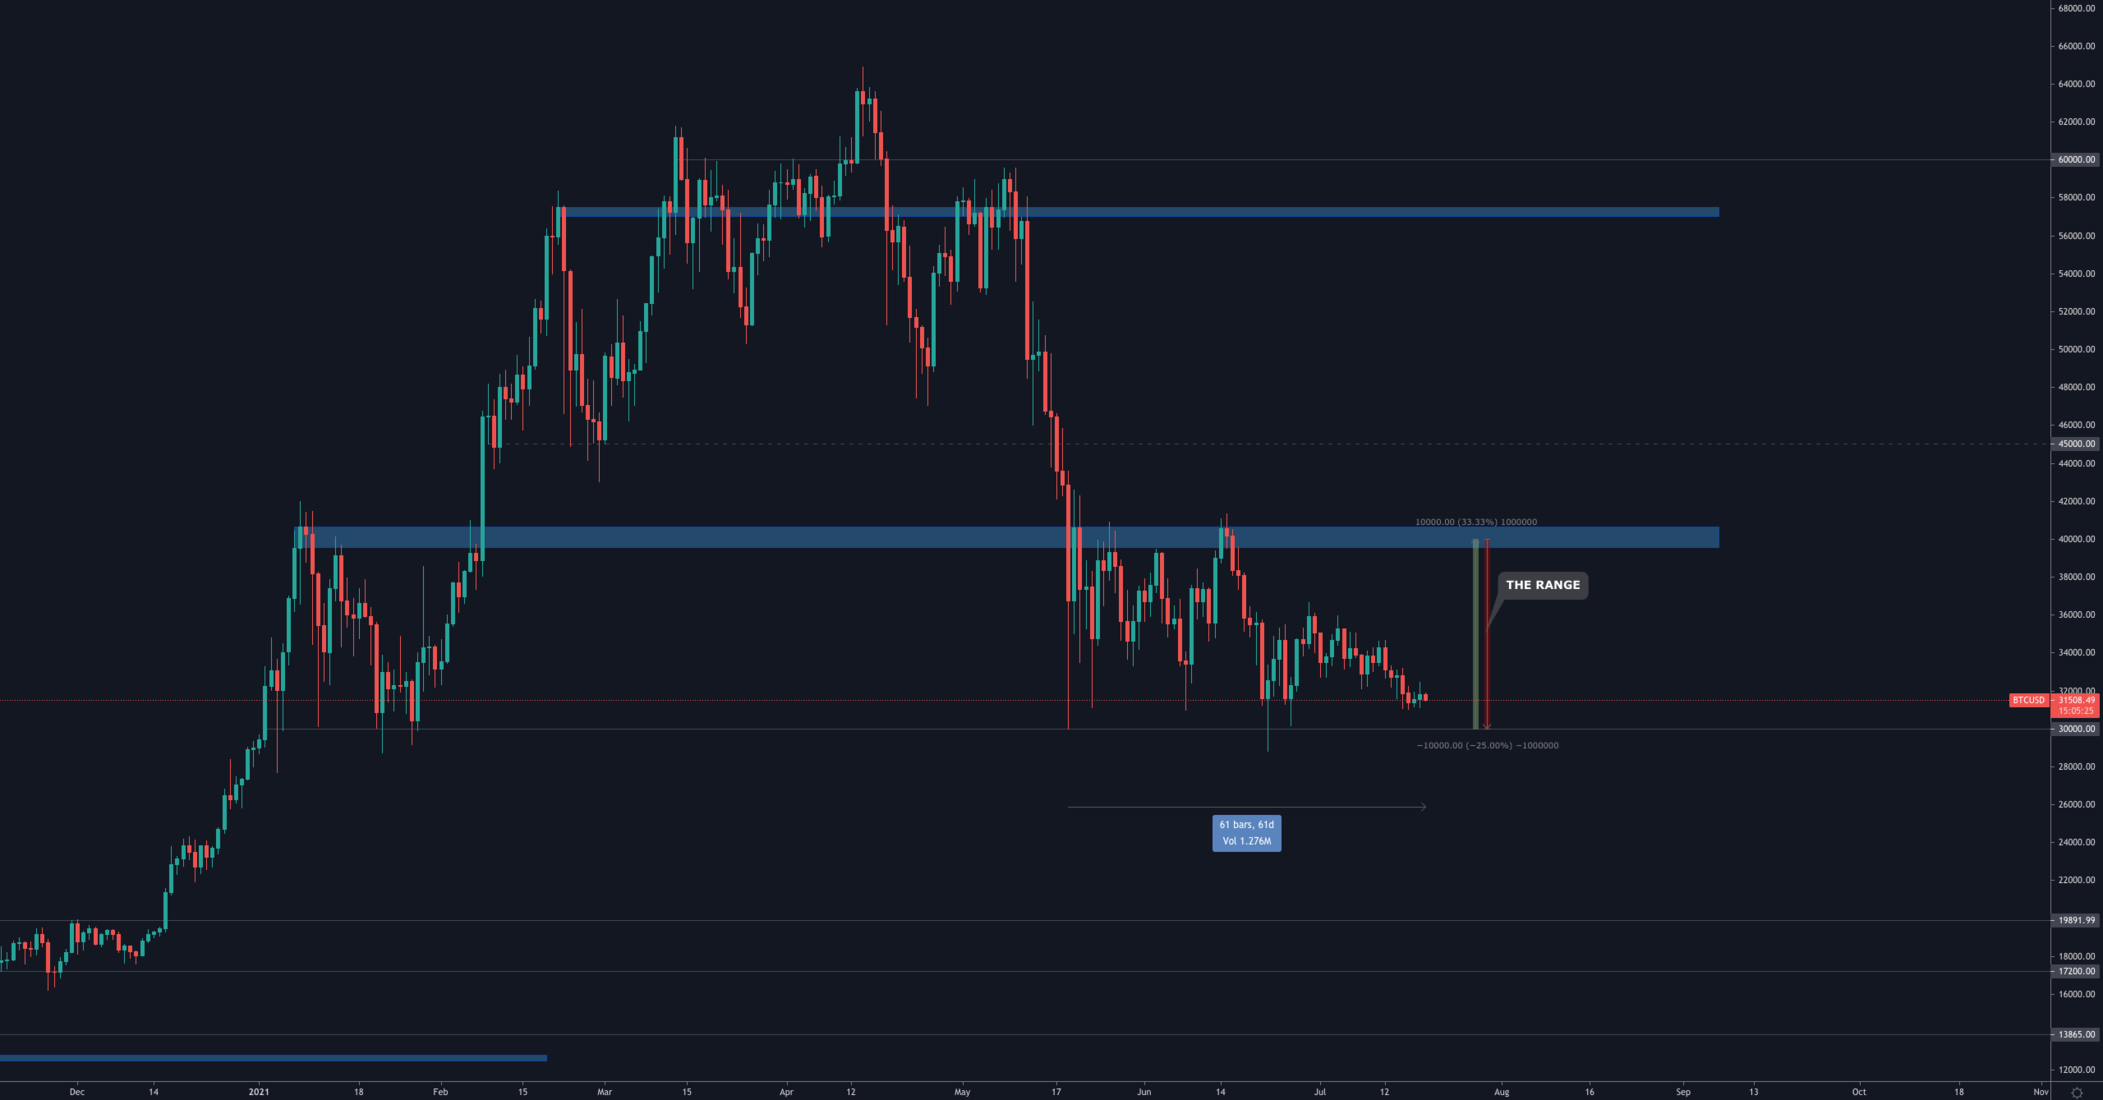
Bitcoin's price has been ranging for over two months in the same [$30,000-$40,000] range and we've not seen any break; bullish or bearish. Given the importance of Bitcoin's price moves for the entire market and the fact that it remains ranging, we cannot yet presume that highs odds of a breakdown would occur based on this chart. Nonetheless, should $30,000 break on the daily timeframe for BTC then a lot of liquidations may take place and push price down sharply in a violent move. We do believe such a move would likely be short-lived given the amount of resting orders awaiting such a move.
Ether
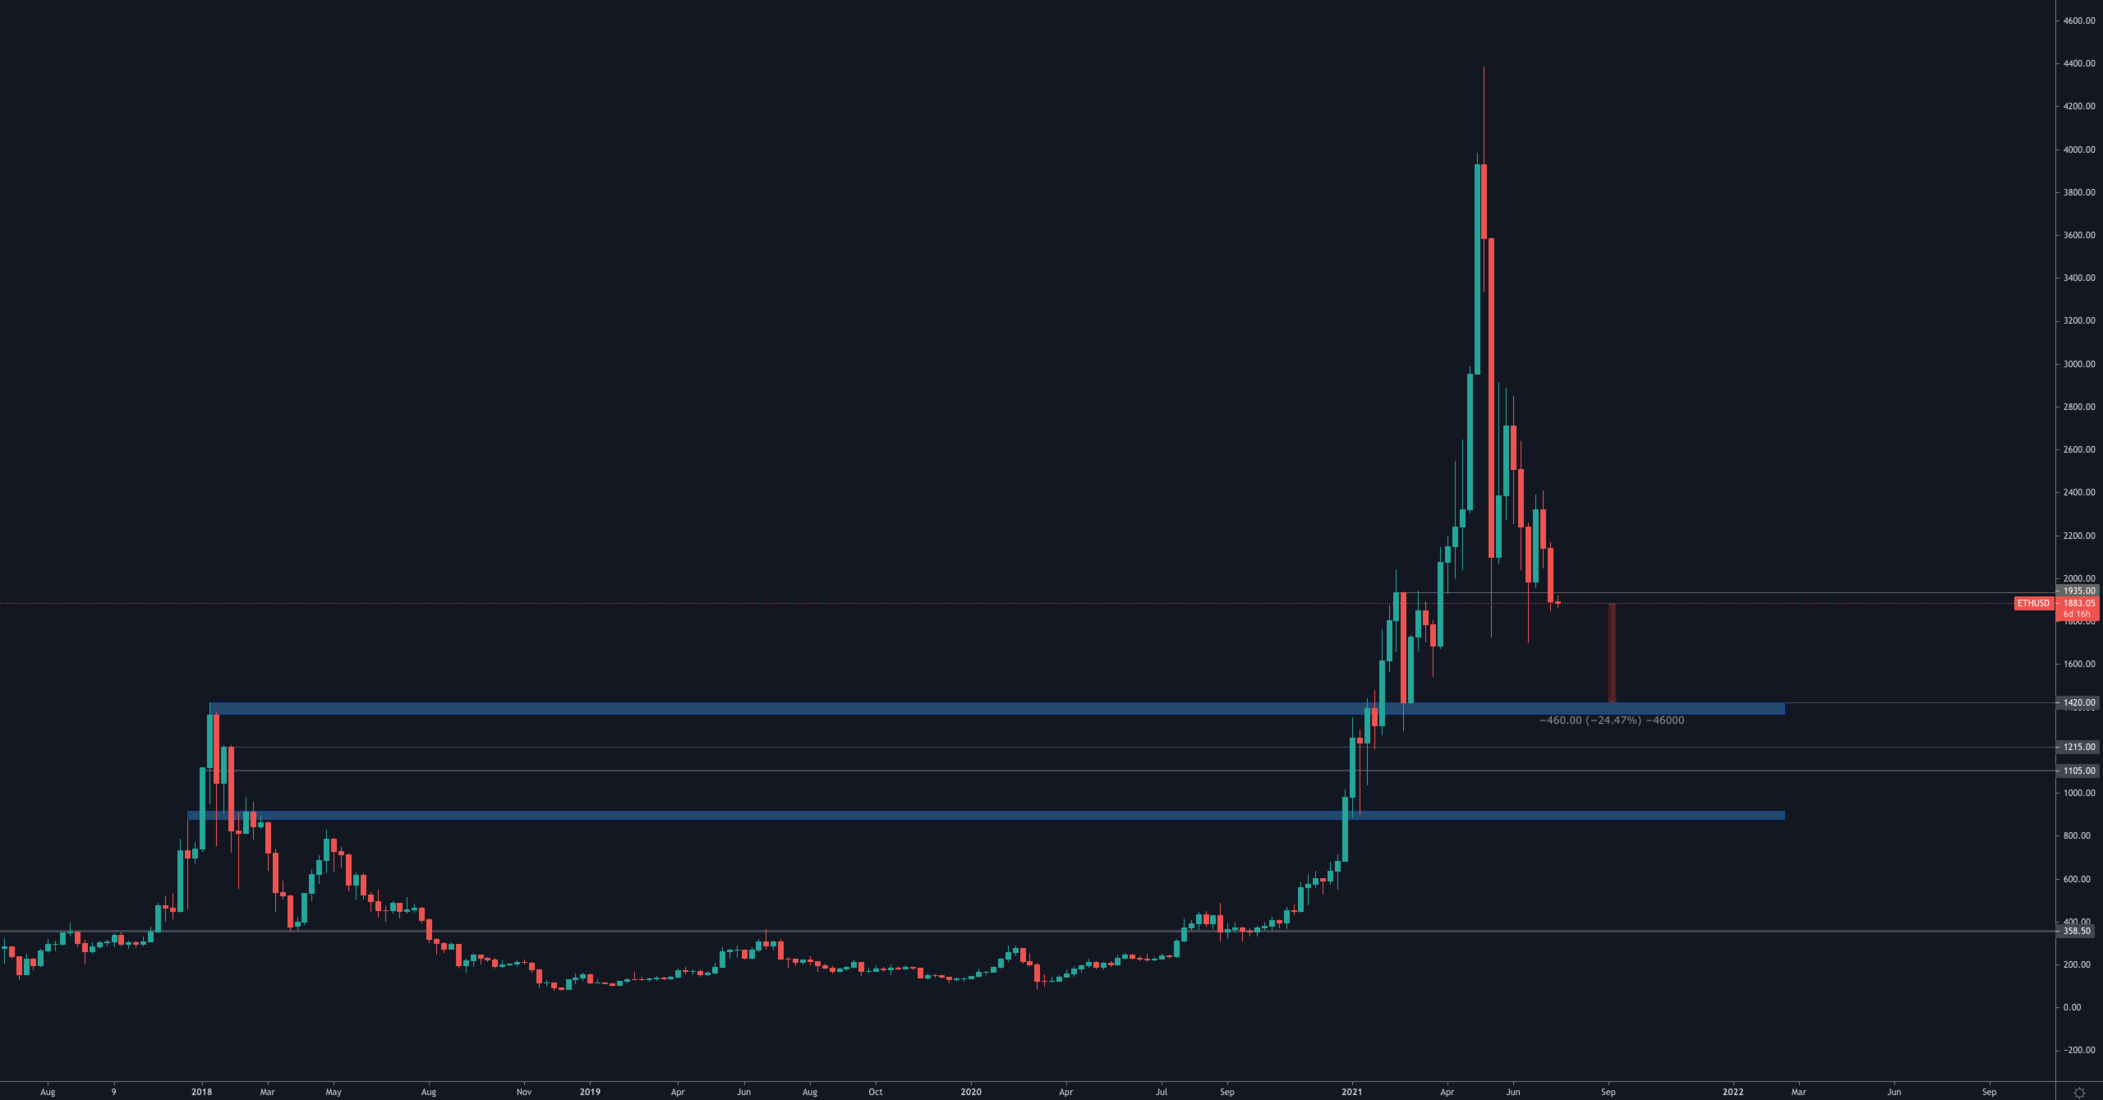
Unlike BTC, Ether's price action has seen a breakdown from weekly support (i.e. $1,935). This is coherent with the movement we're seeing on the Total Market Cap and calls for a test of $1,420 (increased odds).
We'd like to clarify that despite there being increased chances of further downside, we personally consider these rare opportunities as the fundamentals have not changed. In regards to ETH, they're in fact improving starting with August 4th and the implementation of EIP1559.
Another chart that we're monitoring closely is the ETH/BTC chart below.
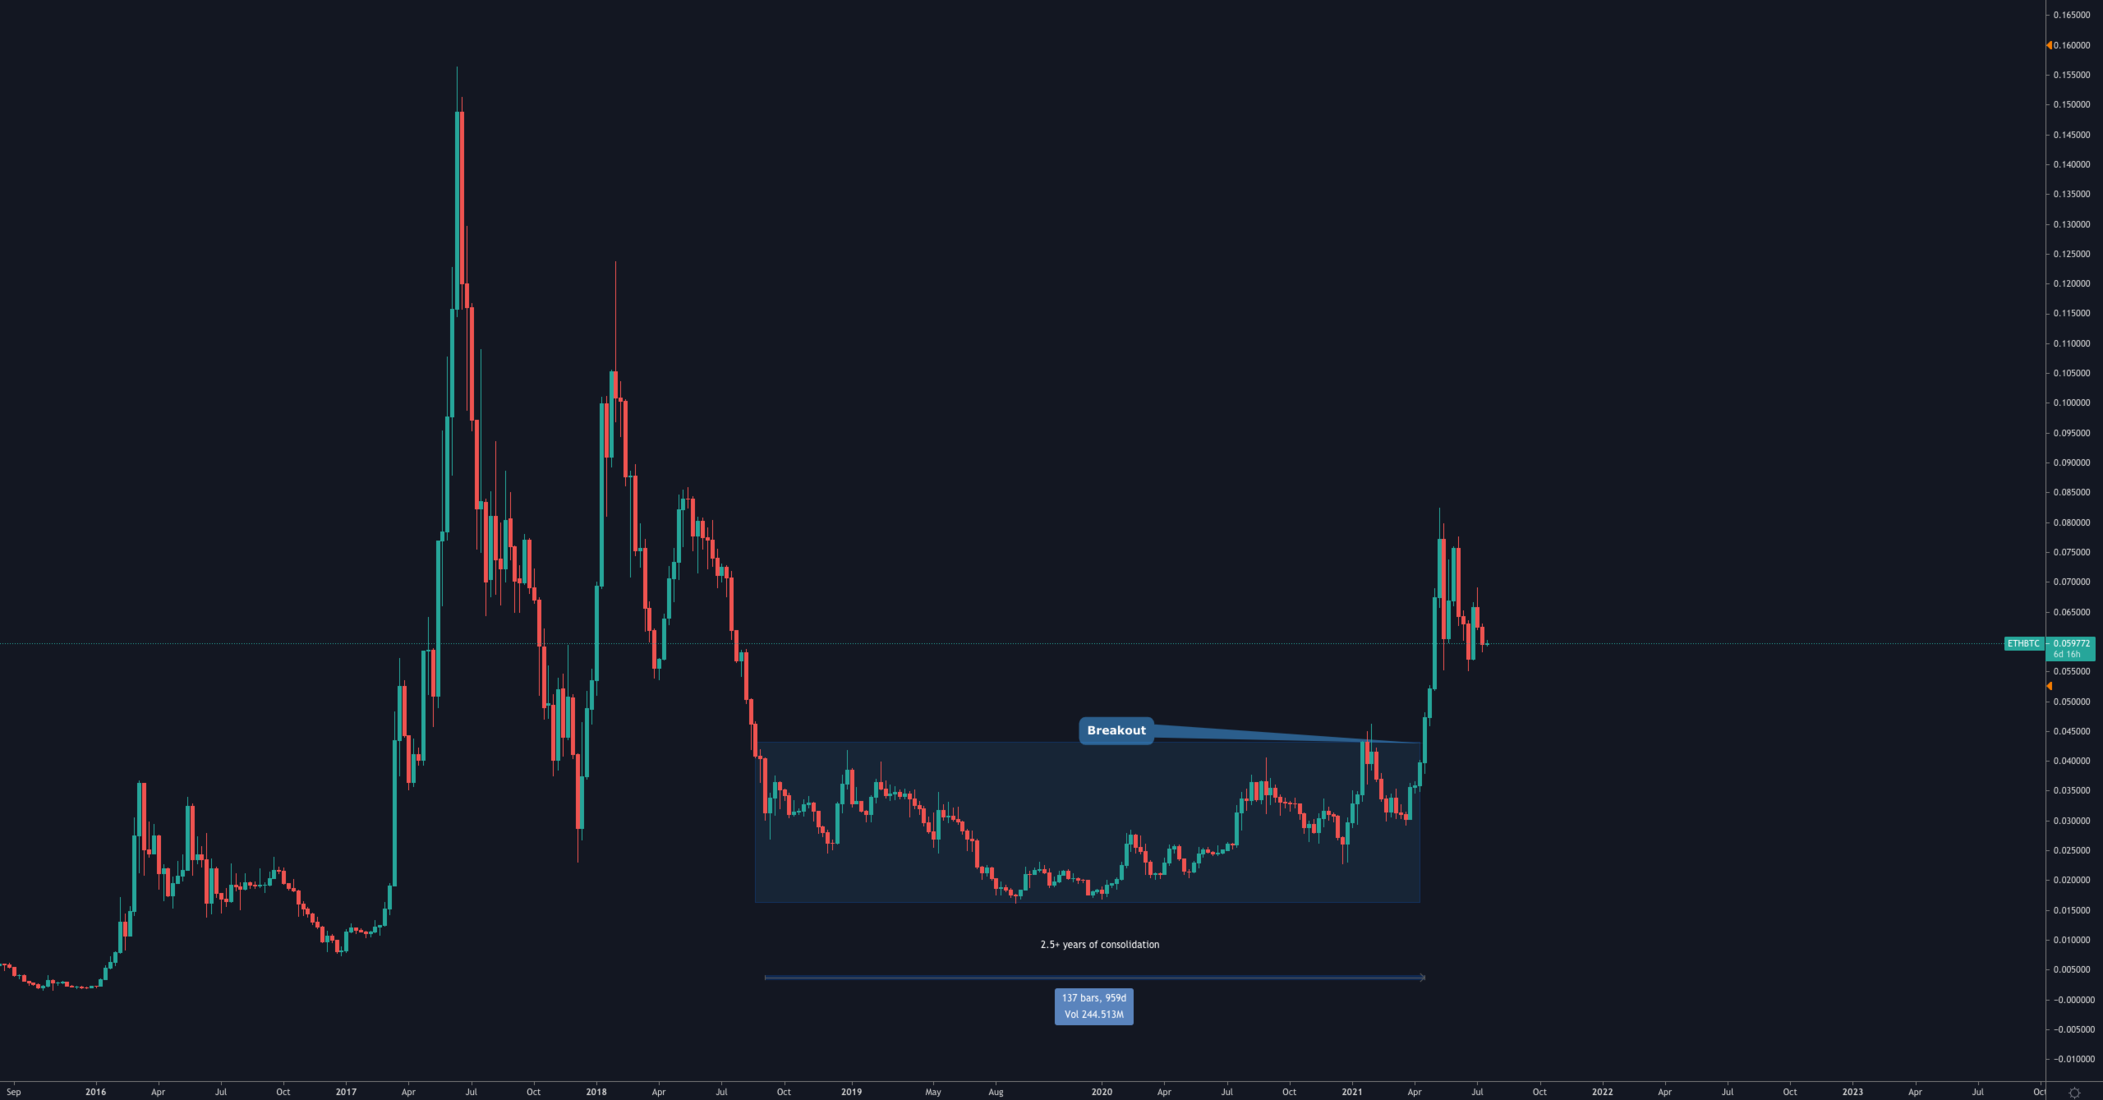
After a very lengthy consolidation spanning over two and a half years, ETH has finally broken out against BTC. While a test of 0.04 is always possible, this chart remains bullish due to the creation of higher highs and higher lows: textbook bullish market structure. When we combine the other metrics where revenue earned from Ethereum being 10x higher than that of Bitcoin for consistent periods of time, it only feels fair that ETH is on its way to flip BTC (in MCap) which would occur at the price of 0.16 BTC per ETH.
DOT
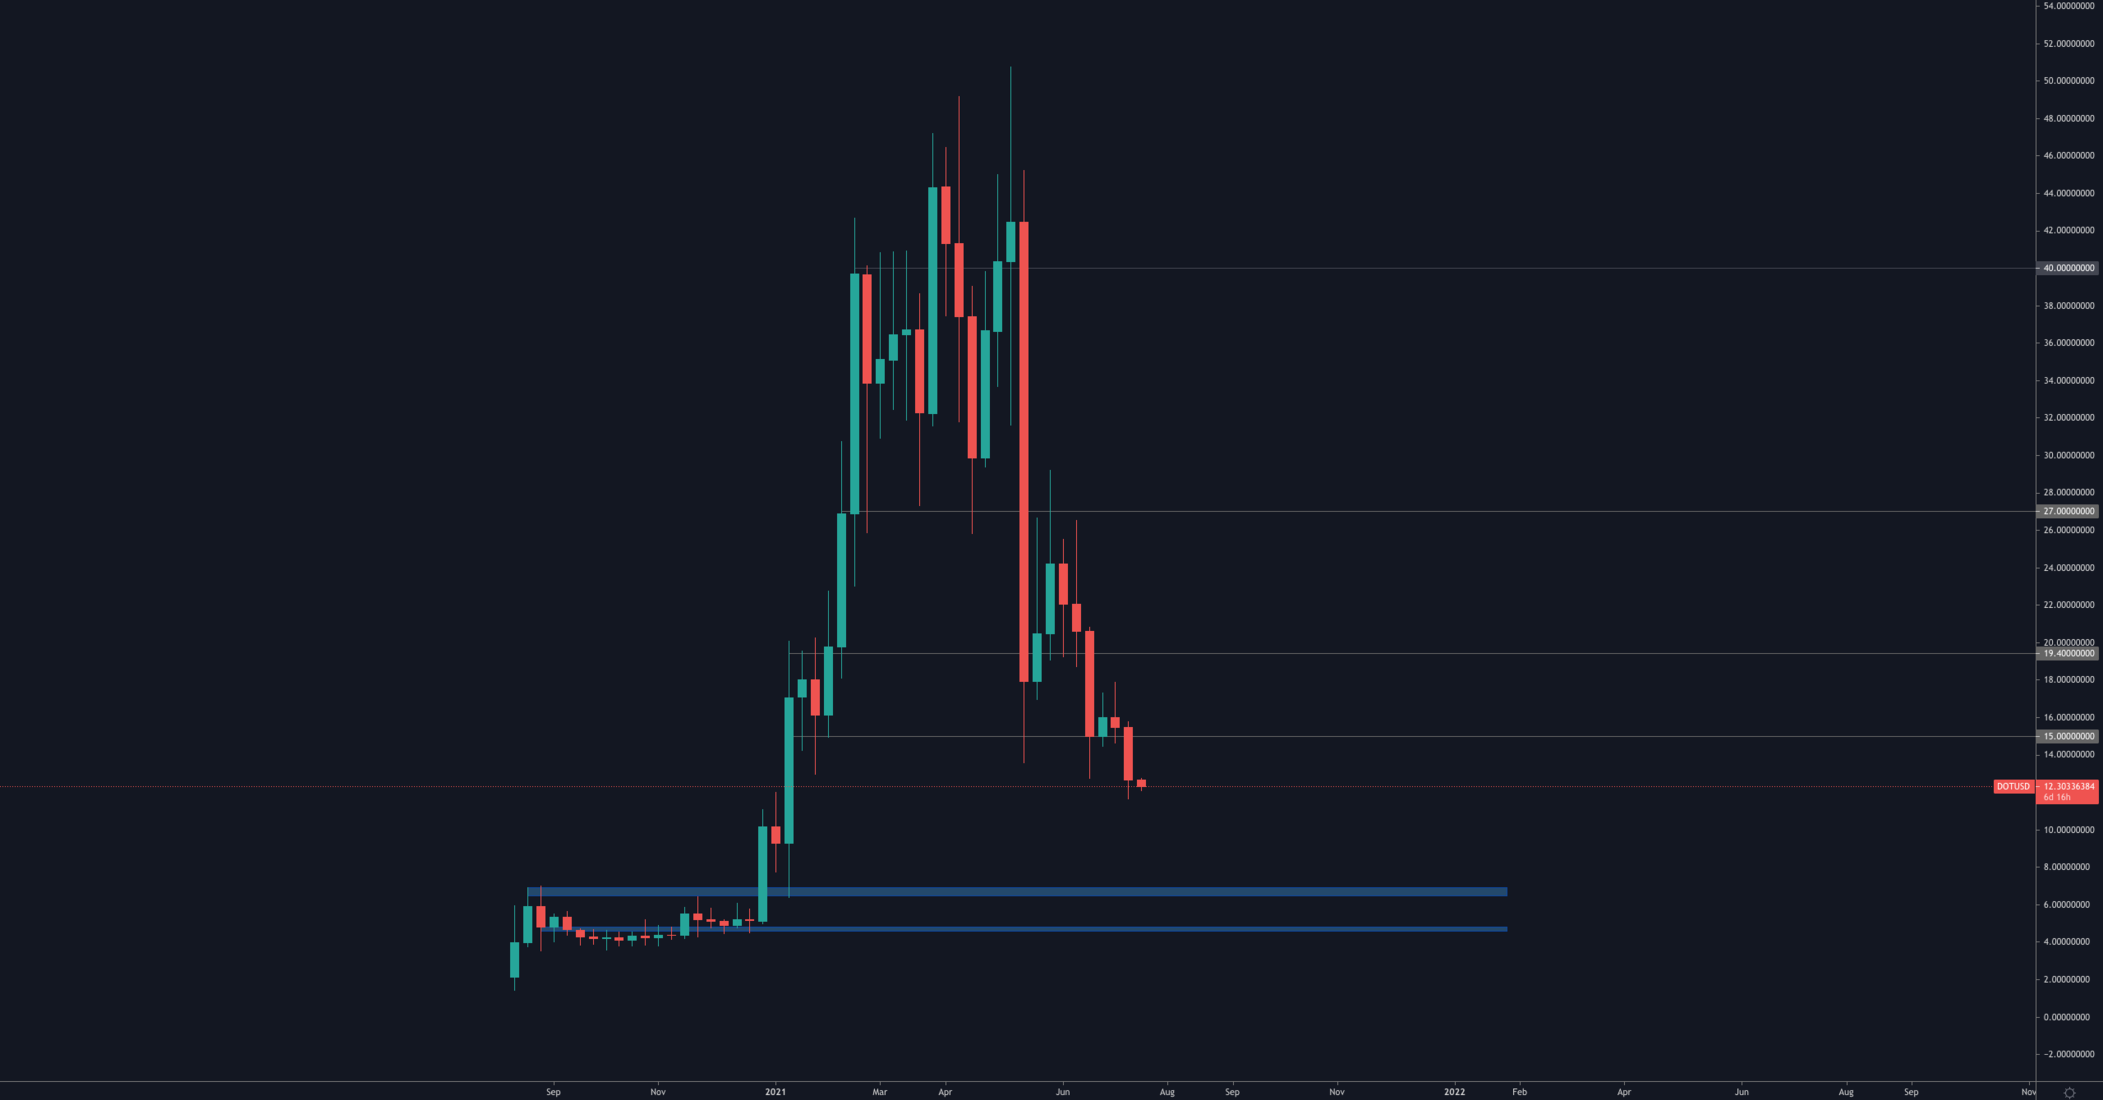
DOT's price broke down from a bear flag which we used to hedge our DOT position. The weekly timeframe also followed suit in that regard by breaking the $15 level of support. We remain hedged here.
SNX
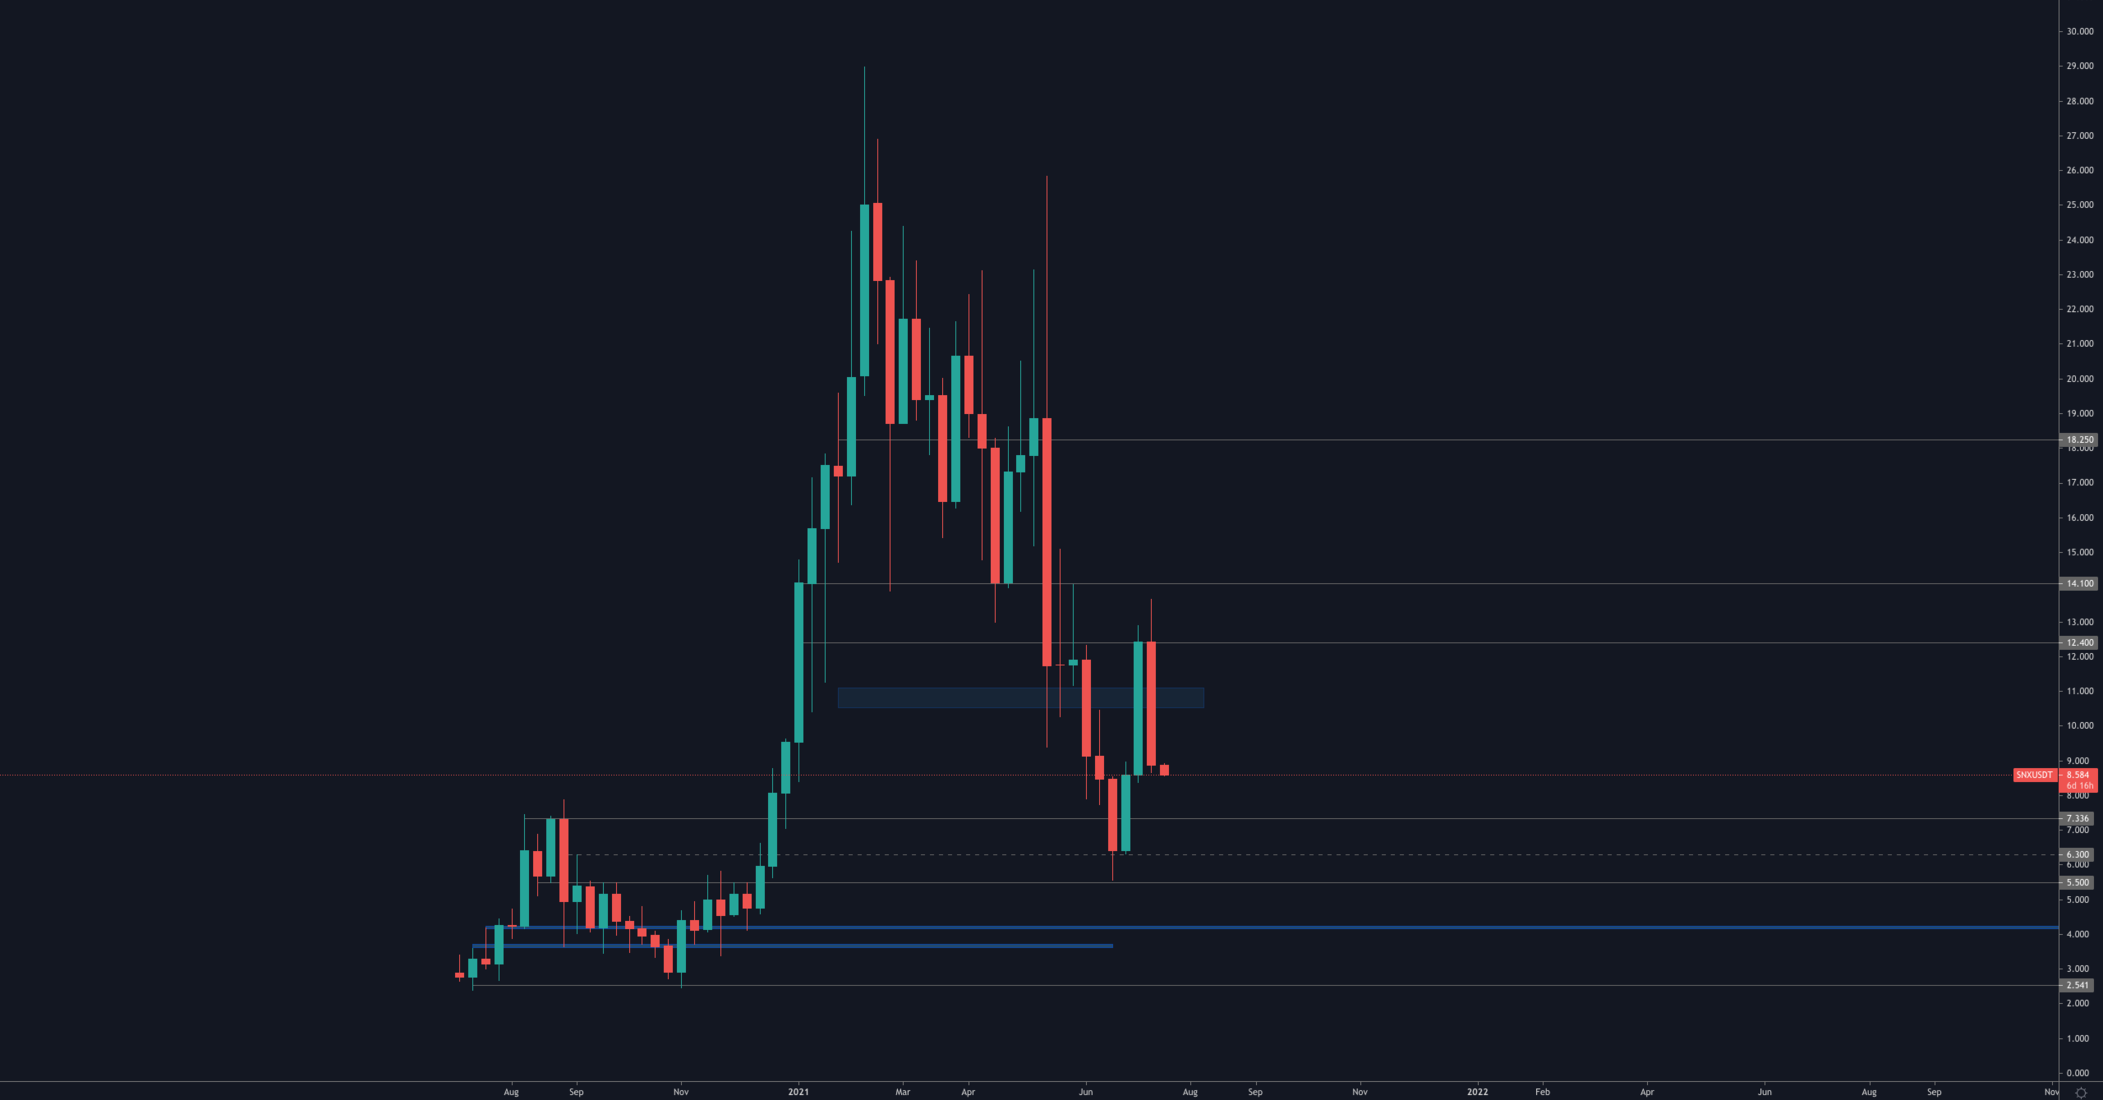
SNX was not able to hold on to the ~$11 liquidity area as support which immediately sent the message that the next level would be $7.50.
RUNE
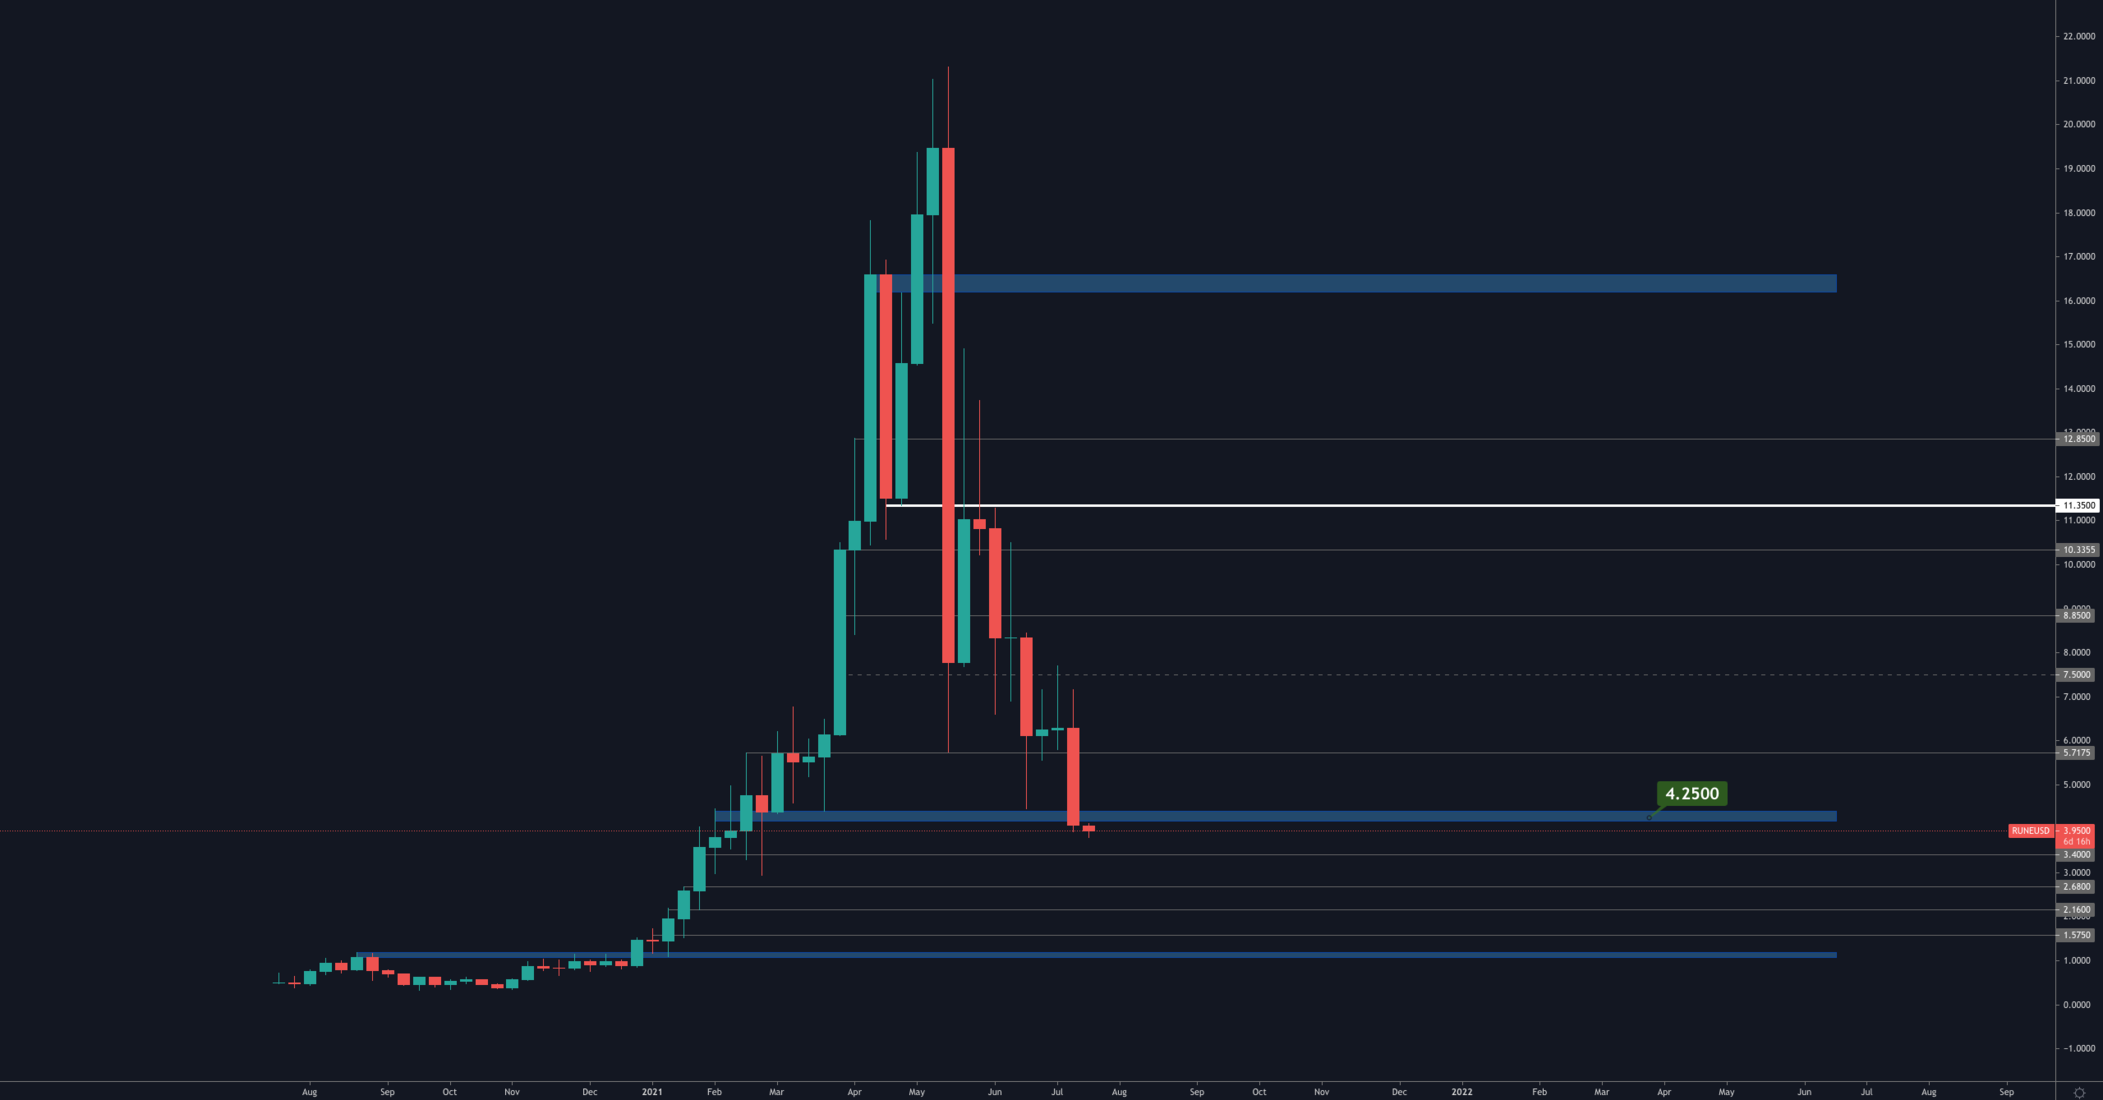
After a hack, RUNE's price took a larger than normal hit (relative to the market). This has now led to a weekly closure under $4 which will likely lead towards another -25% fall to $3.
SOL
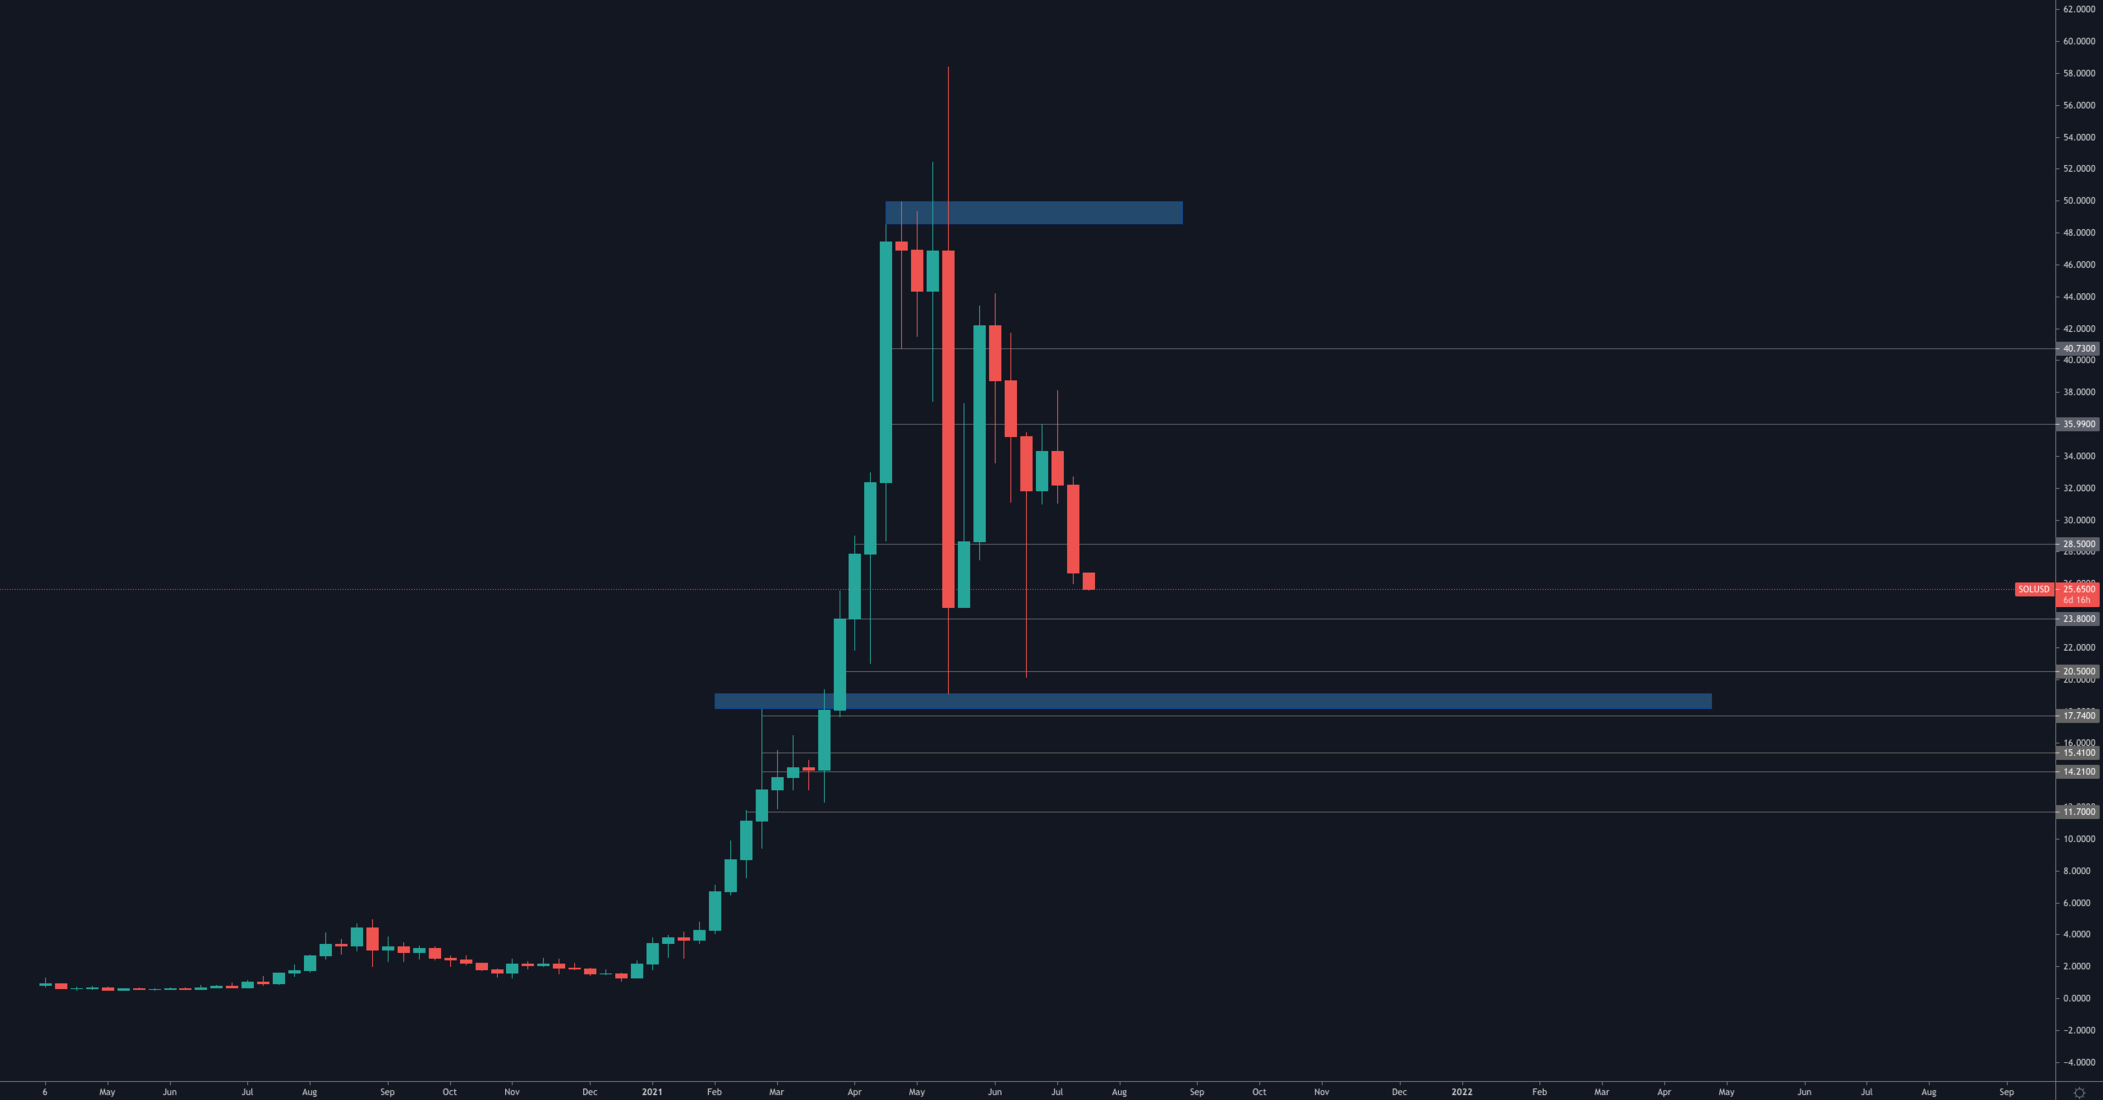
After a few weeks of high demand, SOL has begun exhibiting some weakness through a closure back under $36, followed by a daily bearish engulfing candle and now a weekly candle closure under $28.50. All of these factors communicate that SOL is likely to test low $20s once more.
SRM
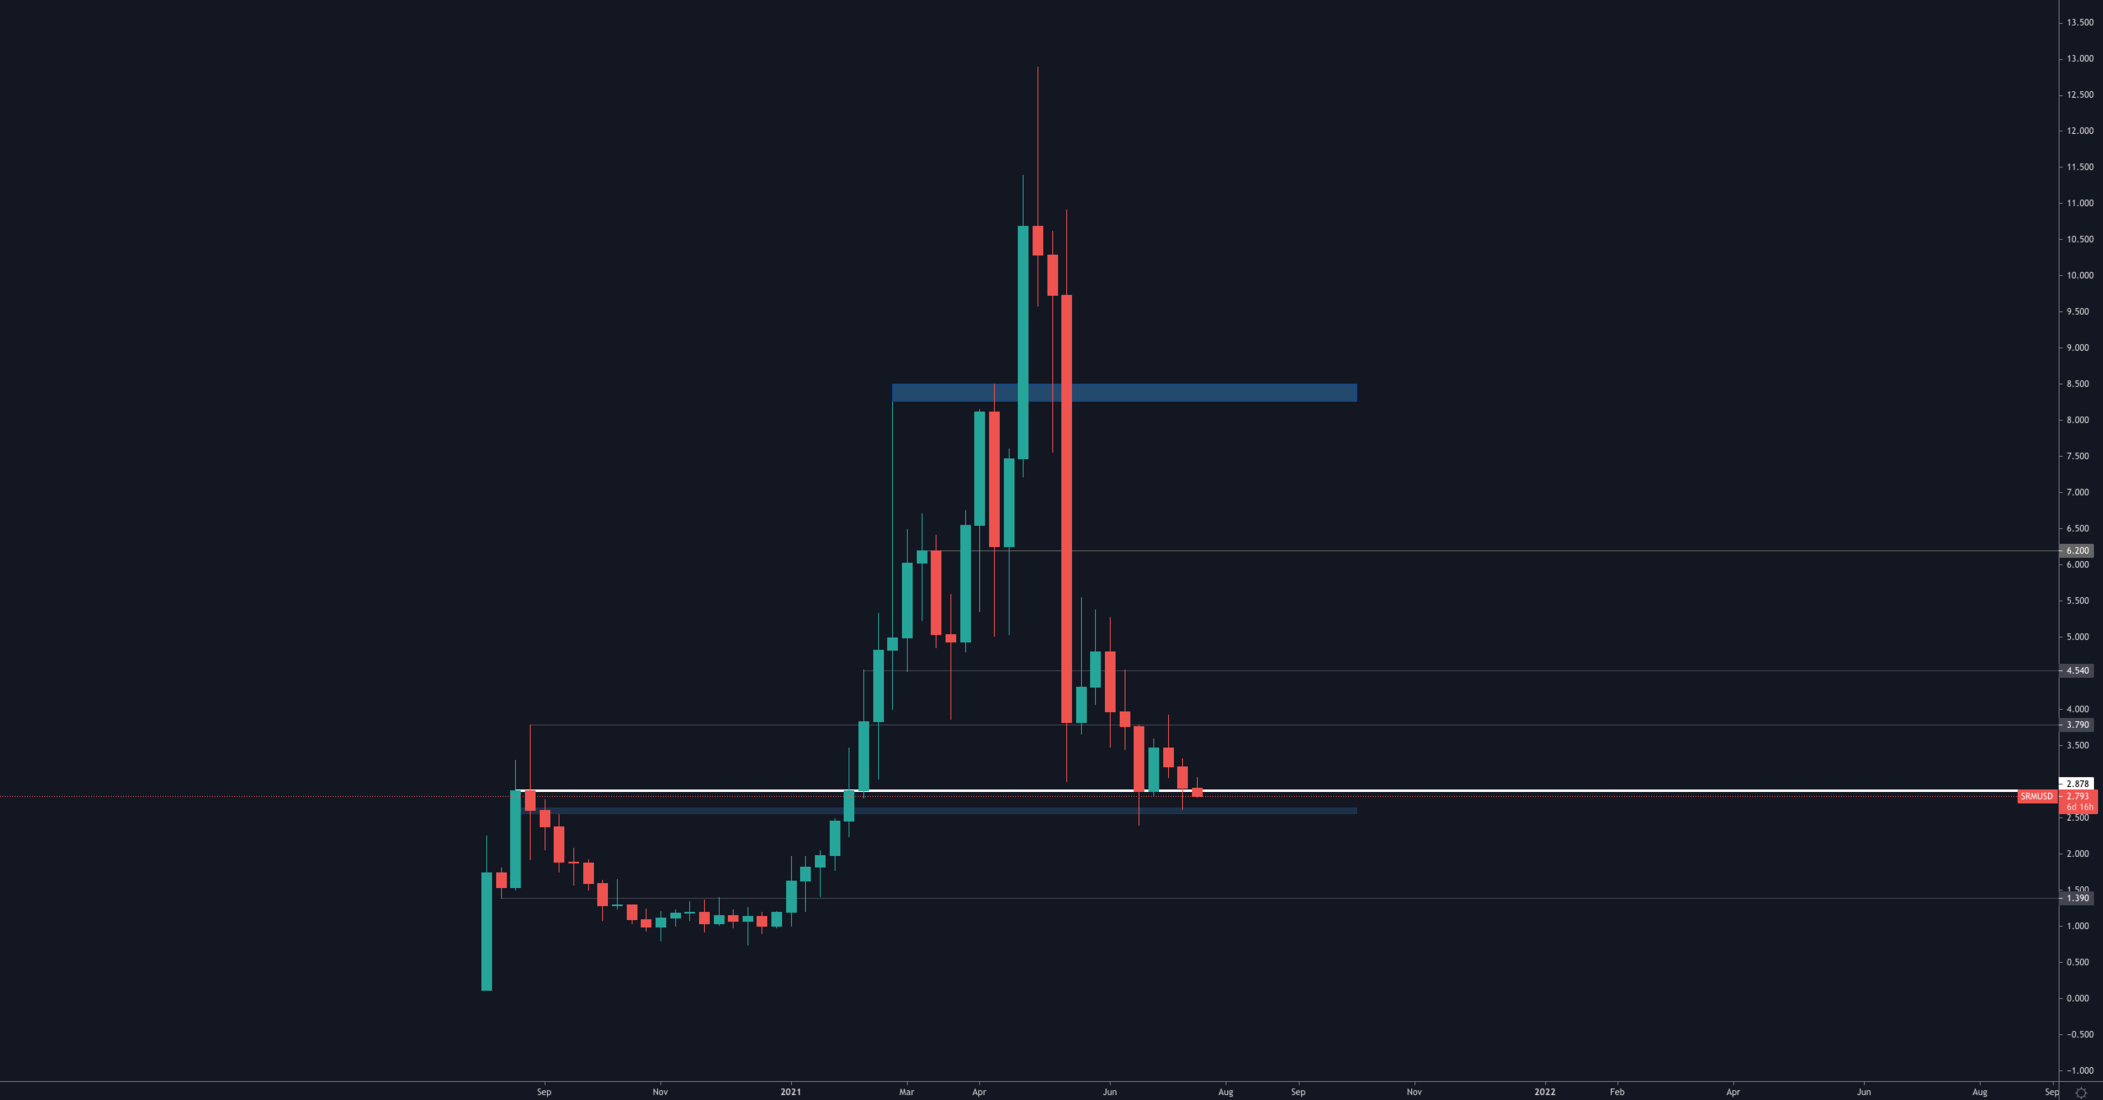
While SRM is holding support on the weekly timeframe, SRM must reclaim the $3.79 key level to exit the "death zone".
FTT
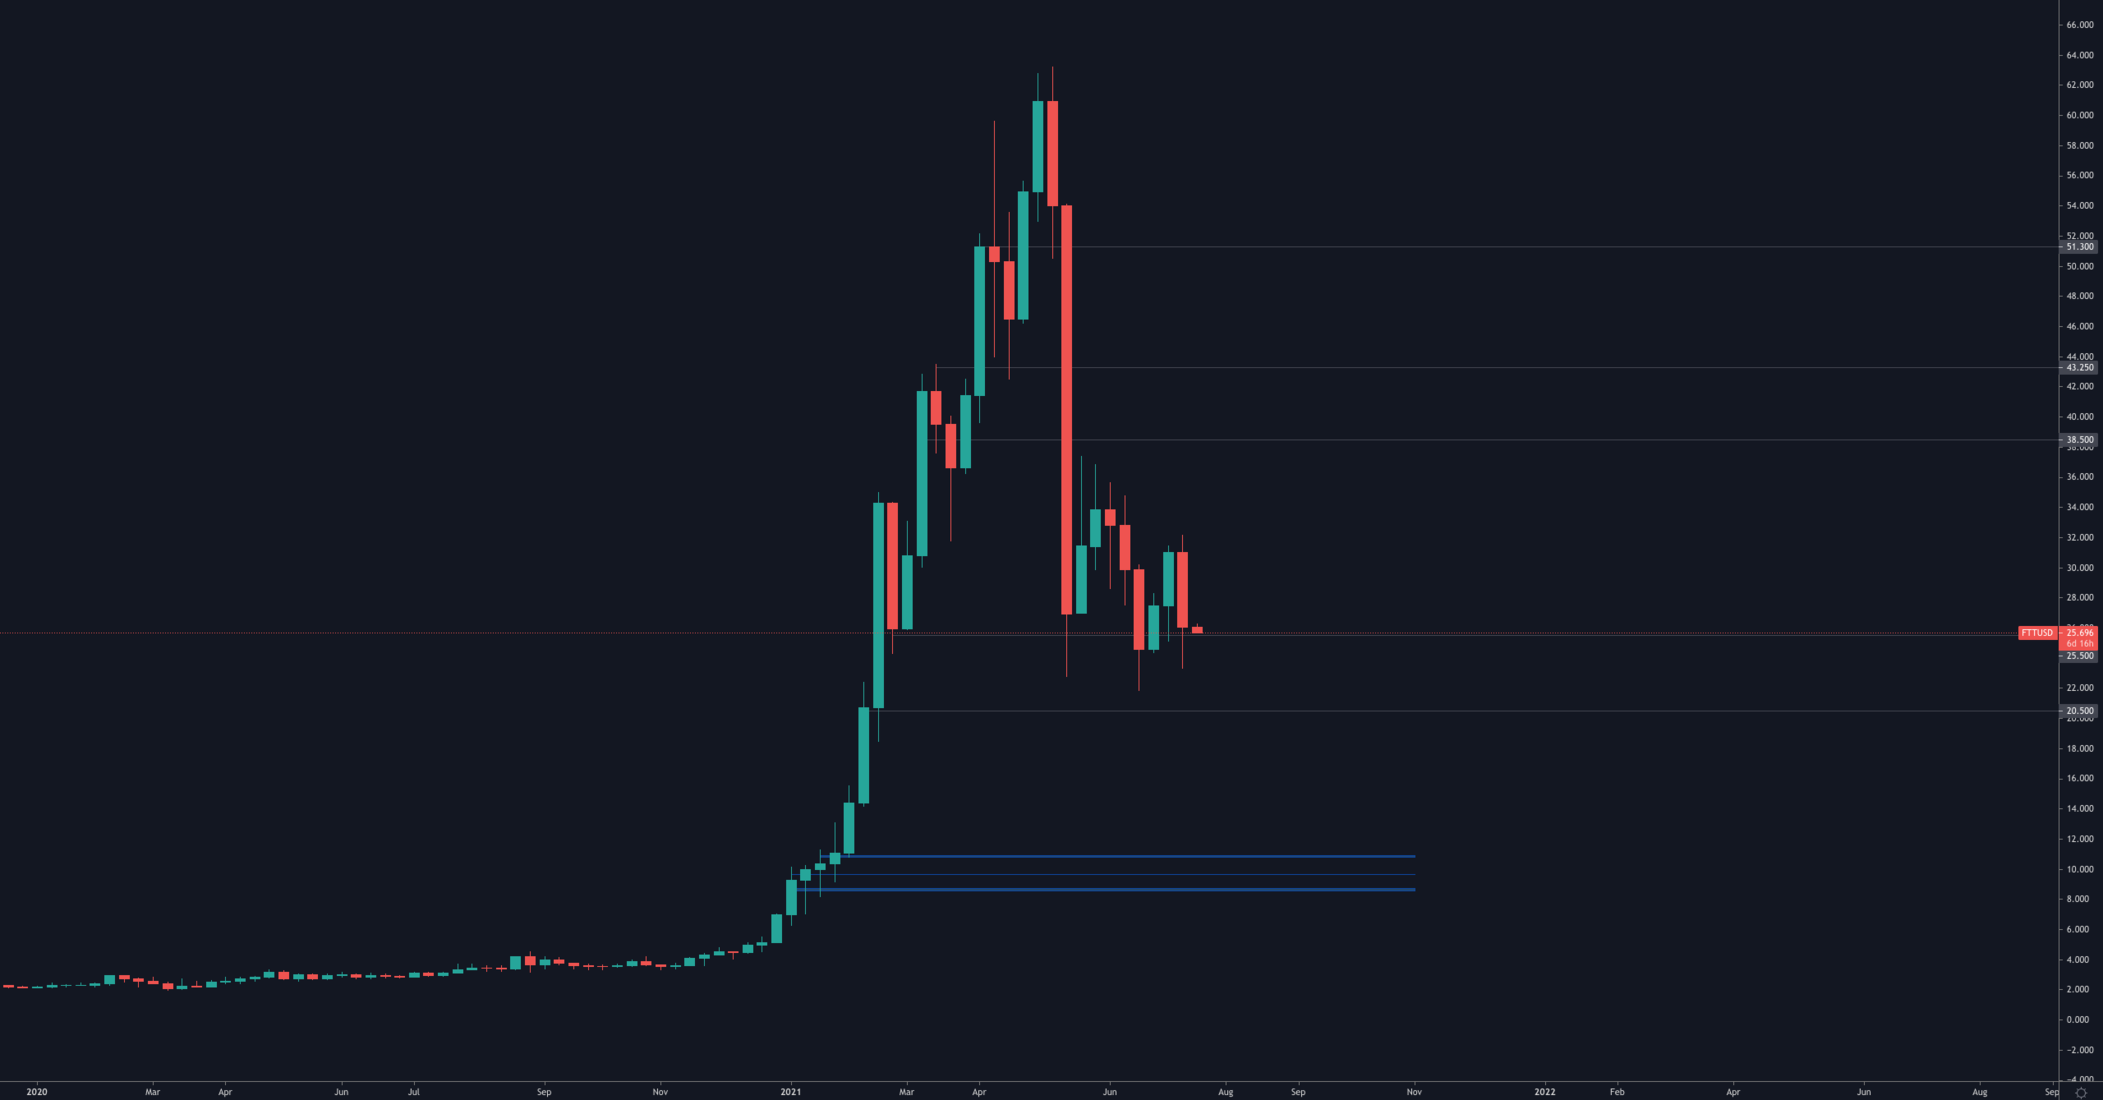
FTT is holding support at $25 which, from a technical perspective, maintains the same stage for a test of $35. However, that remains highly dependent on where BTC goes next.
Recommended from Cryptonary


