Save 23% ($351) & Get a Free 1-1 Call with our Team ⏰ : 0d 2h 59m 43s
Market Analysis
Weekly Technicals Pro - Volume 75
Sentiment is in the Neutral zone in the exact middle as market participants are uncertain about the next direction for the crypto market. When in Neutral zones, market sentiment does not affect prices in strong ways nor does it gives out warning signals like it does near extremes.

Market Sentiment
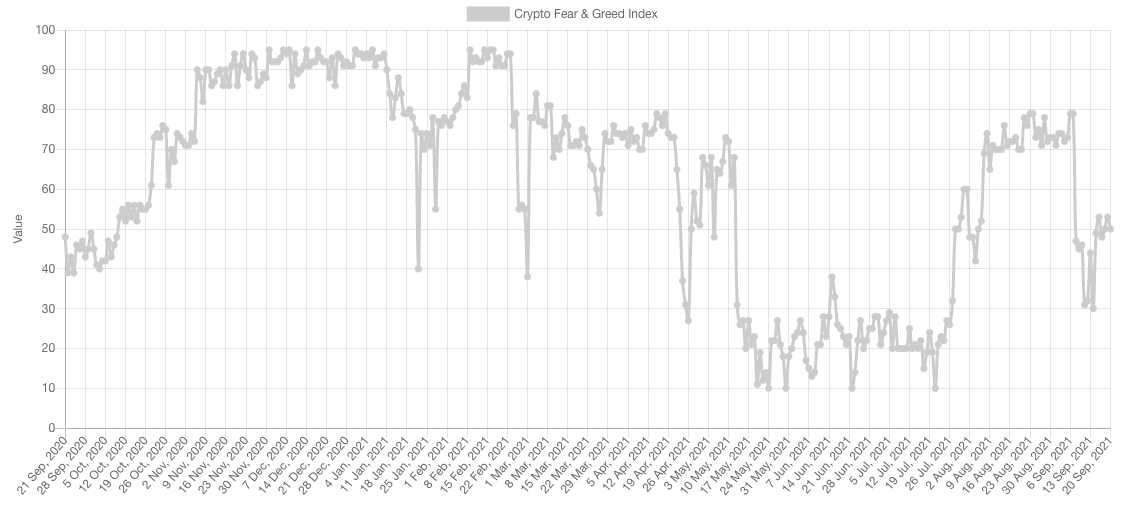
Market Indexes
Total Market Cap
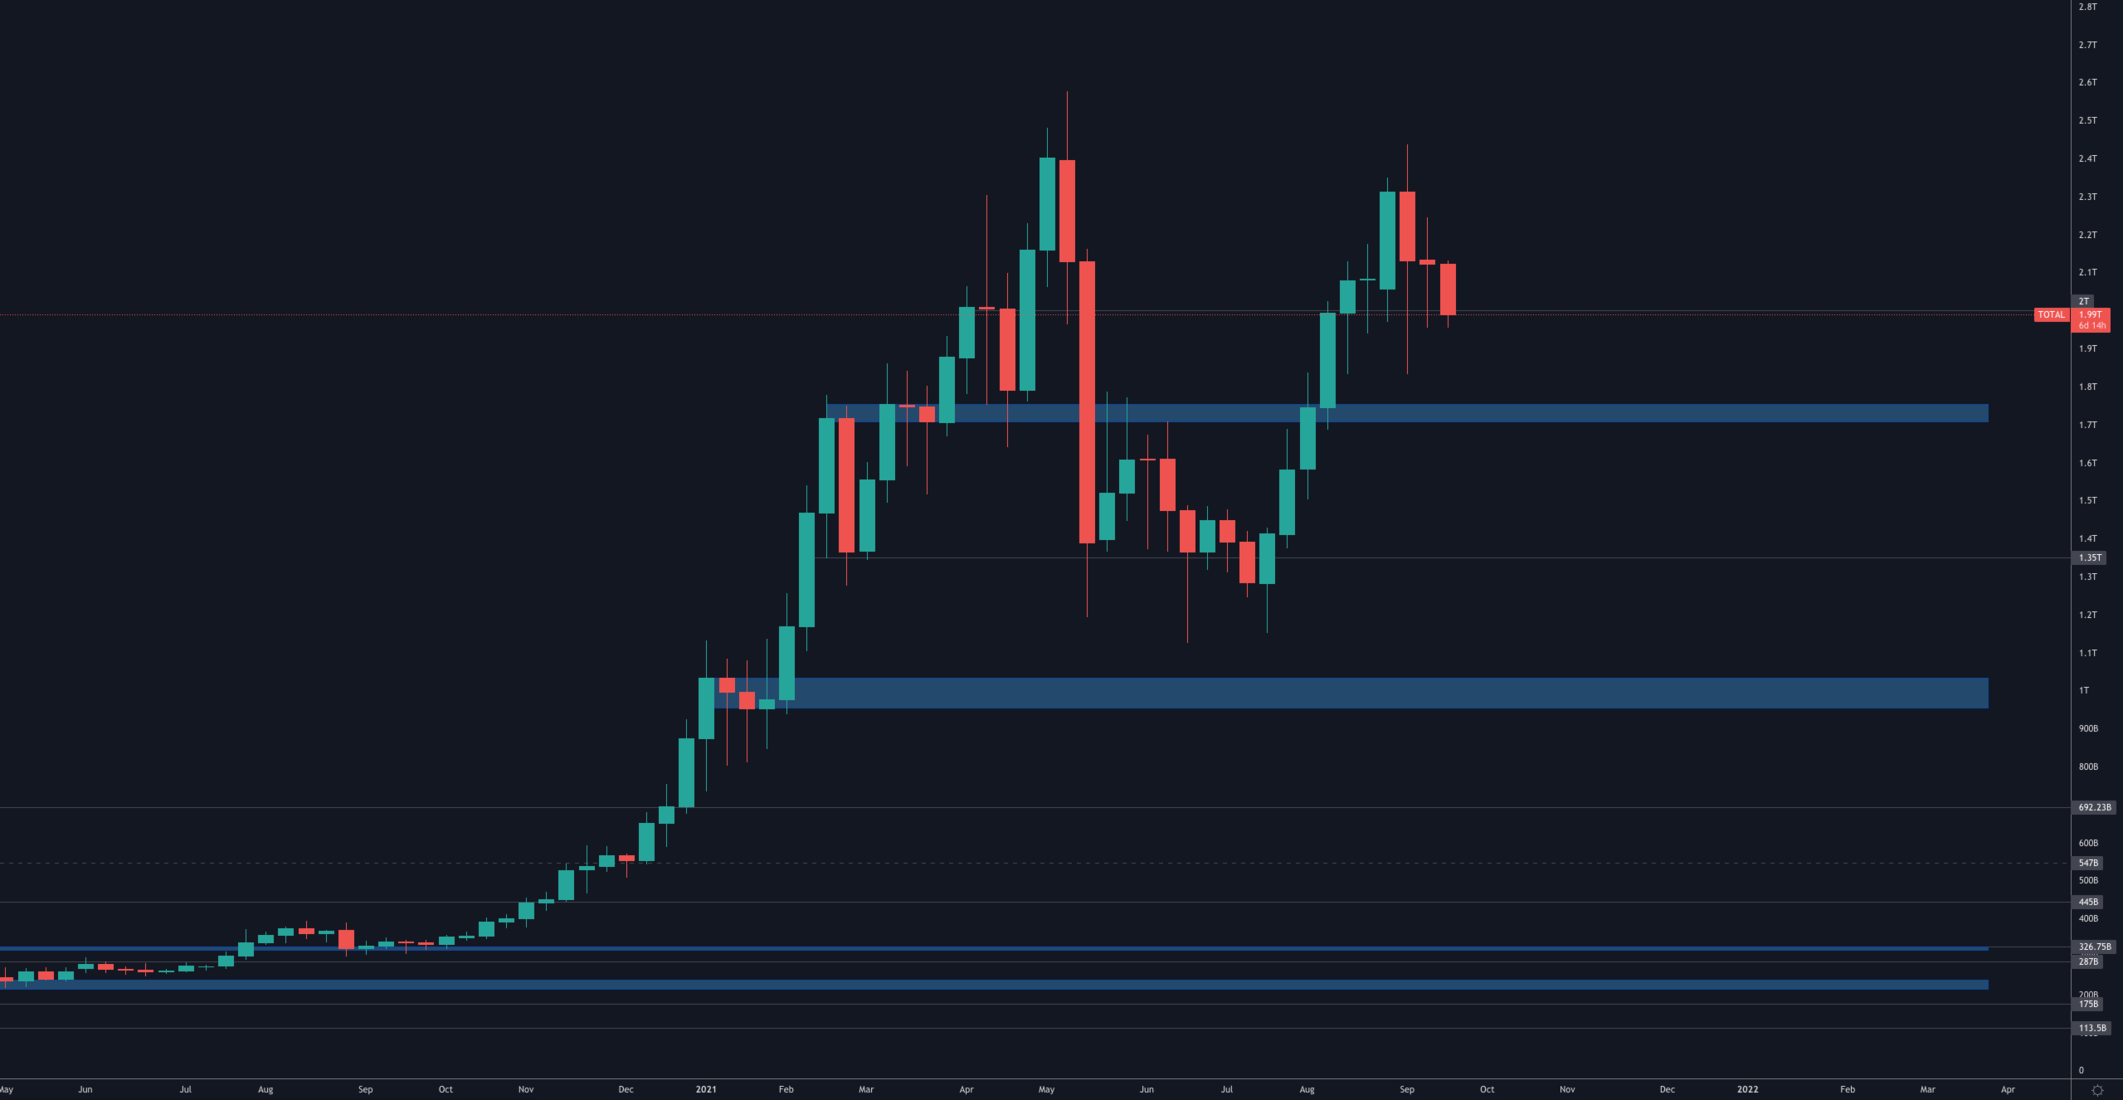
The Total MCap has...
Recommended from Cryptonary


PRO
Market Direction
11 min read
Mar 24, 2026

PRO
Market Updates
8 min read
Mar 23, 2026
PRO
Market Direction
13 min read
Mar 20, 2026
