Save 23% ($351) & Get a Free 1-1 Call with our Team ⏰ : 0d 2h 59m 44s

Disclaimer: Not financial nor investment advice. Any capital-related decisions you make are your full responsibility and only you are accountable for the results.
Market Sentiment
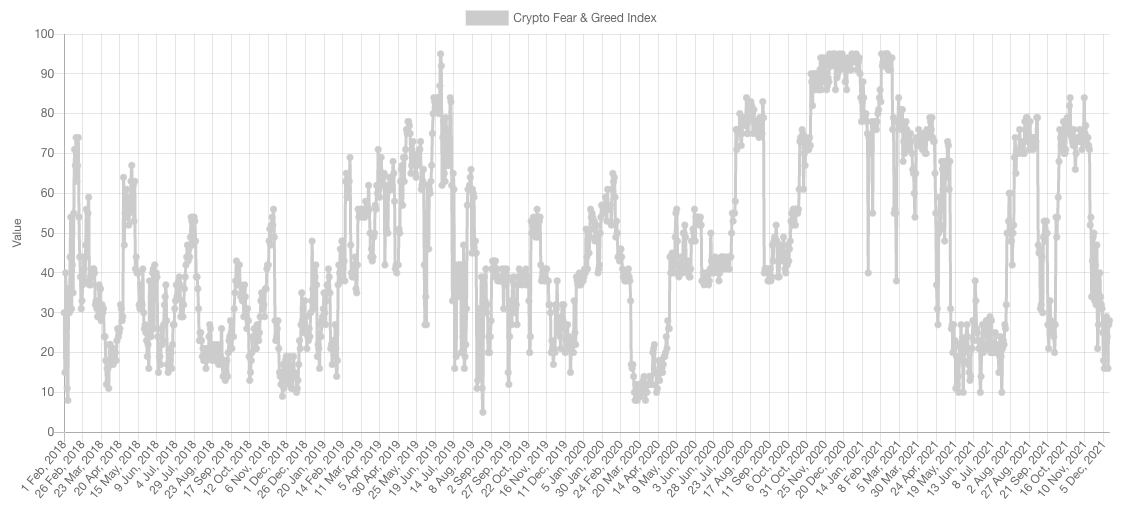
Sentiment remains in Fear without having gone to the extreme of the extremes we tend to see where bottoms form around the 10s. Of course, technical analysis cannot be performed on this index but based off history, further downside is not completely ruled out here.
Market Indexes
Total Market Cap
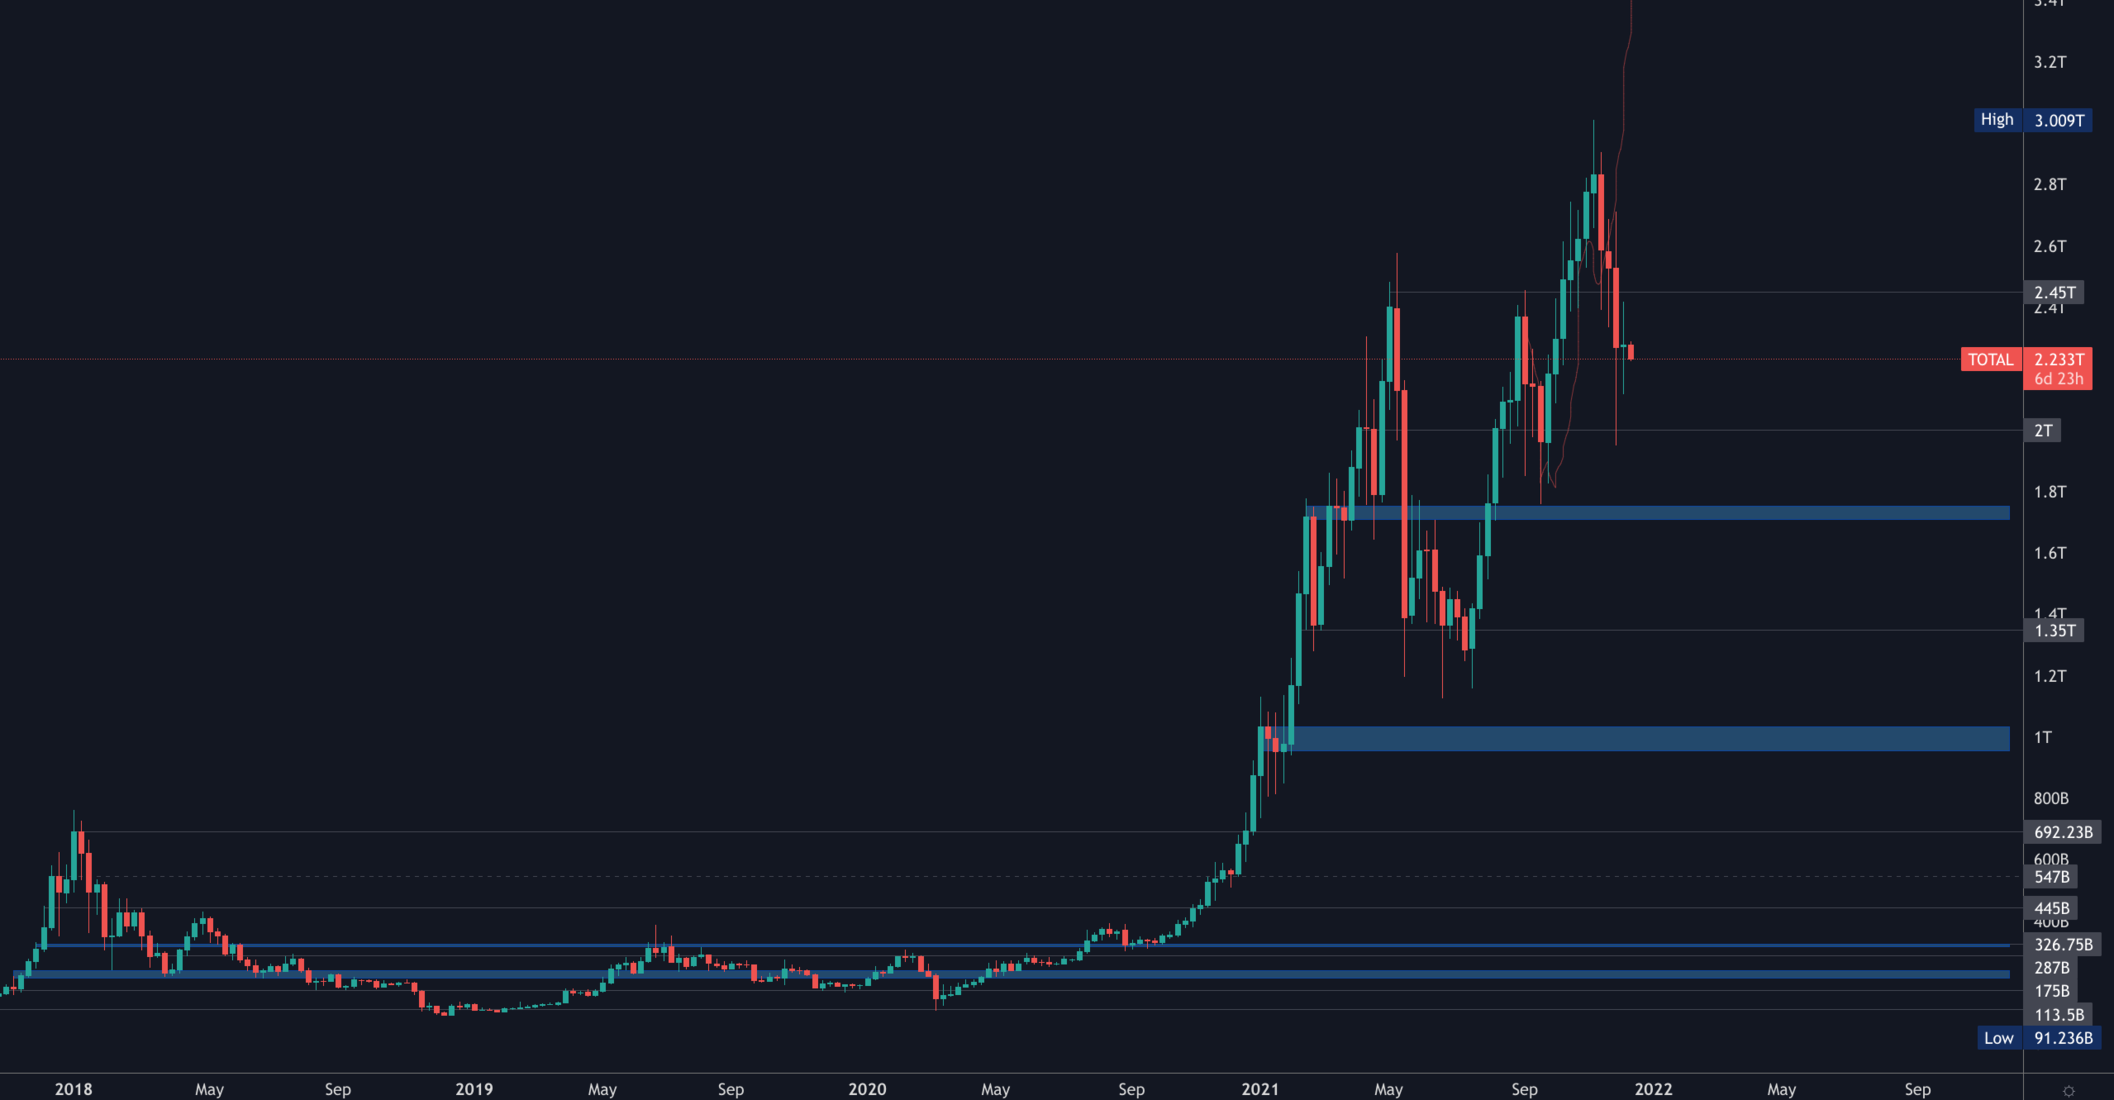
The Total MCap is back under $2.5T as shared next week which communicated that it has become resistance and the next logical step would be $2T once again.
Altcoins Market Cap
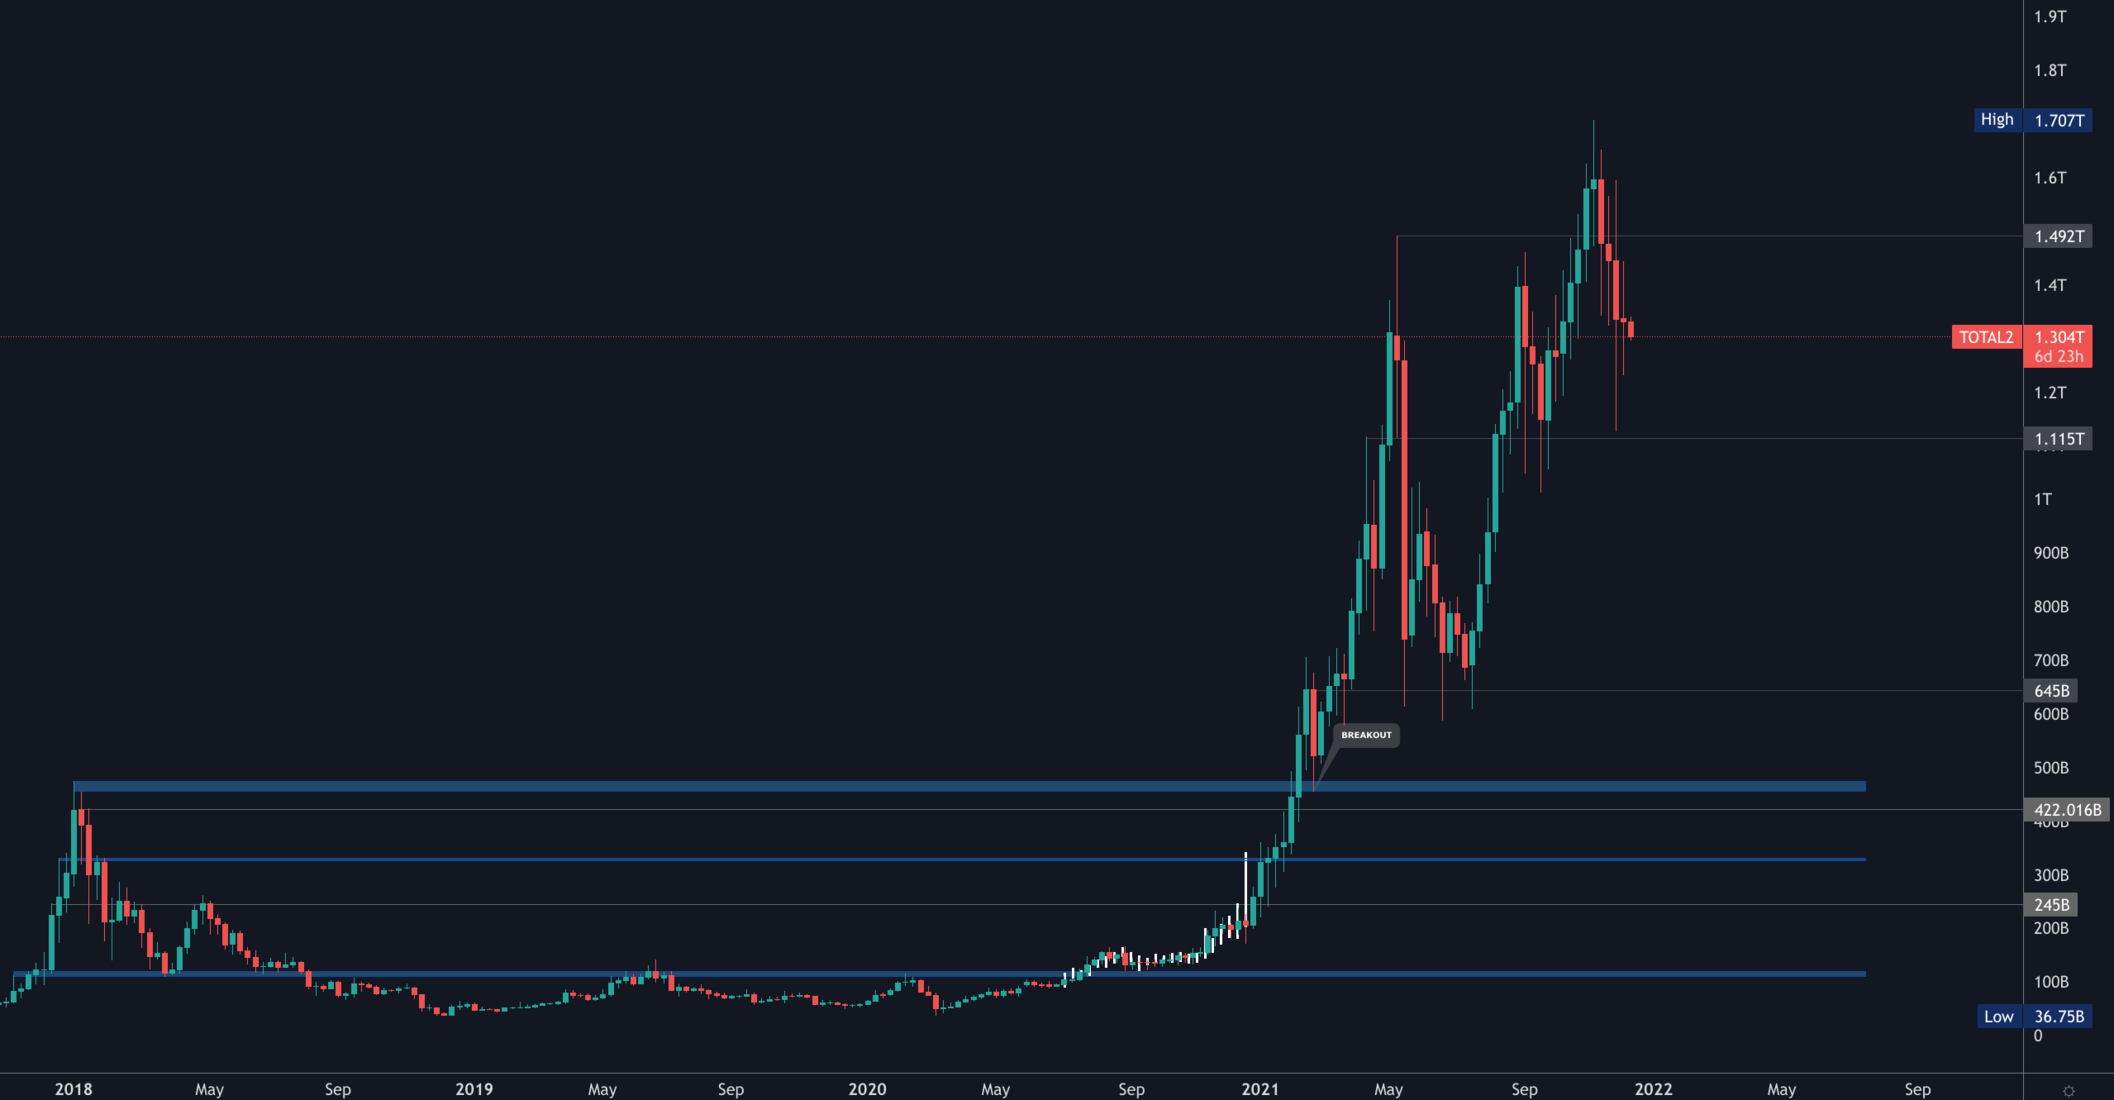
Alts MCap shares a similar image with a test of $1.115T now on the cards as well.
Bitcoin
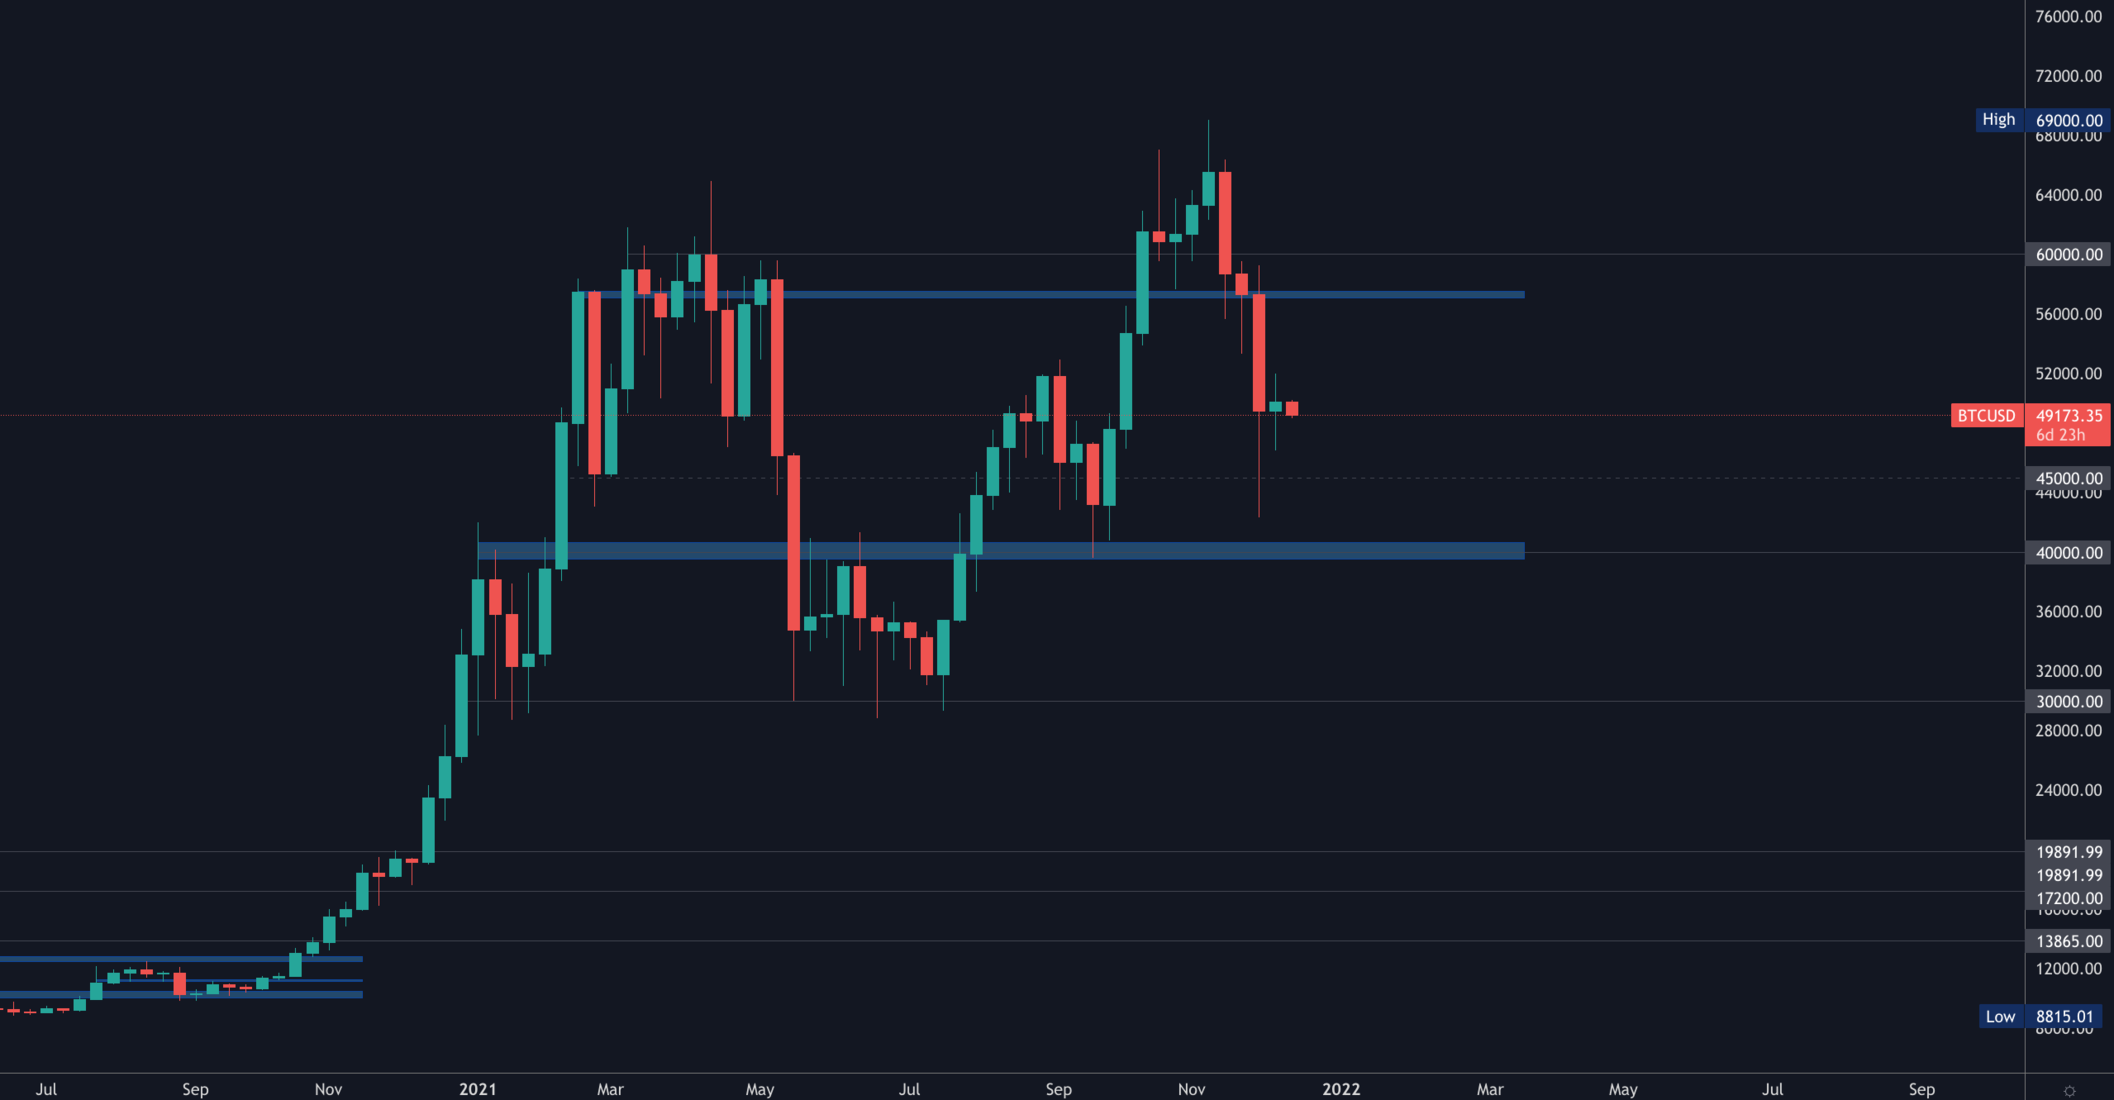
Bitcoin has $53,000 as resistance and unless that is crossed, a second test of $45,000 and $40,000 is possible in the upcoming weeks.
Ether
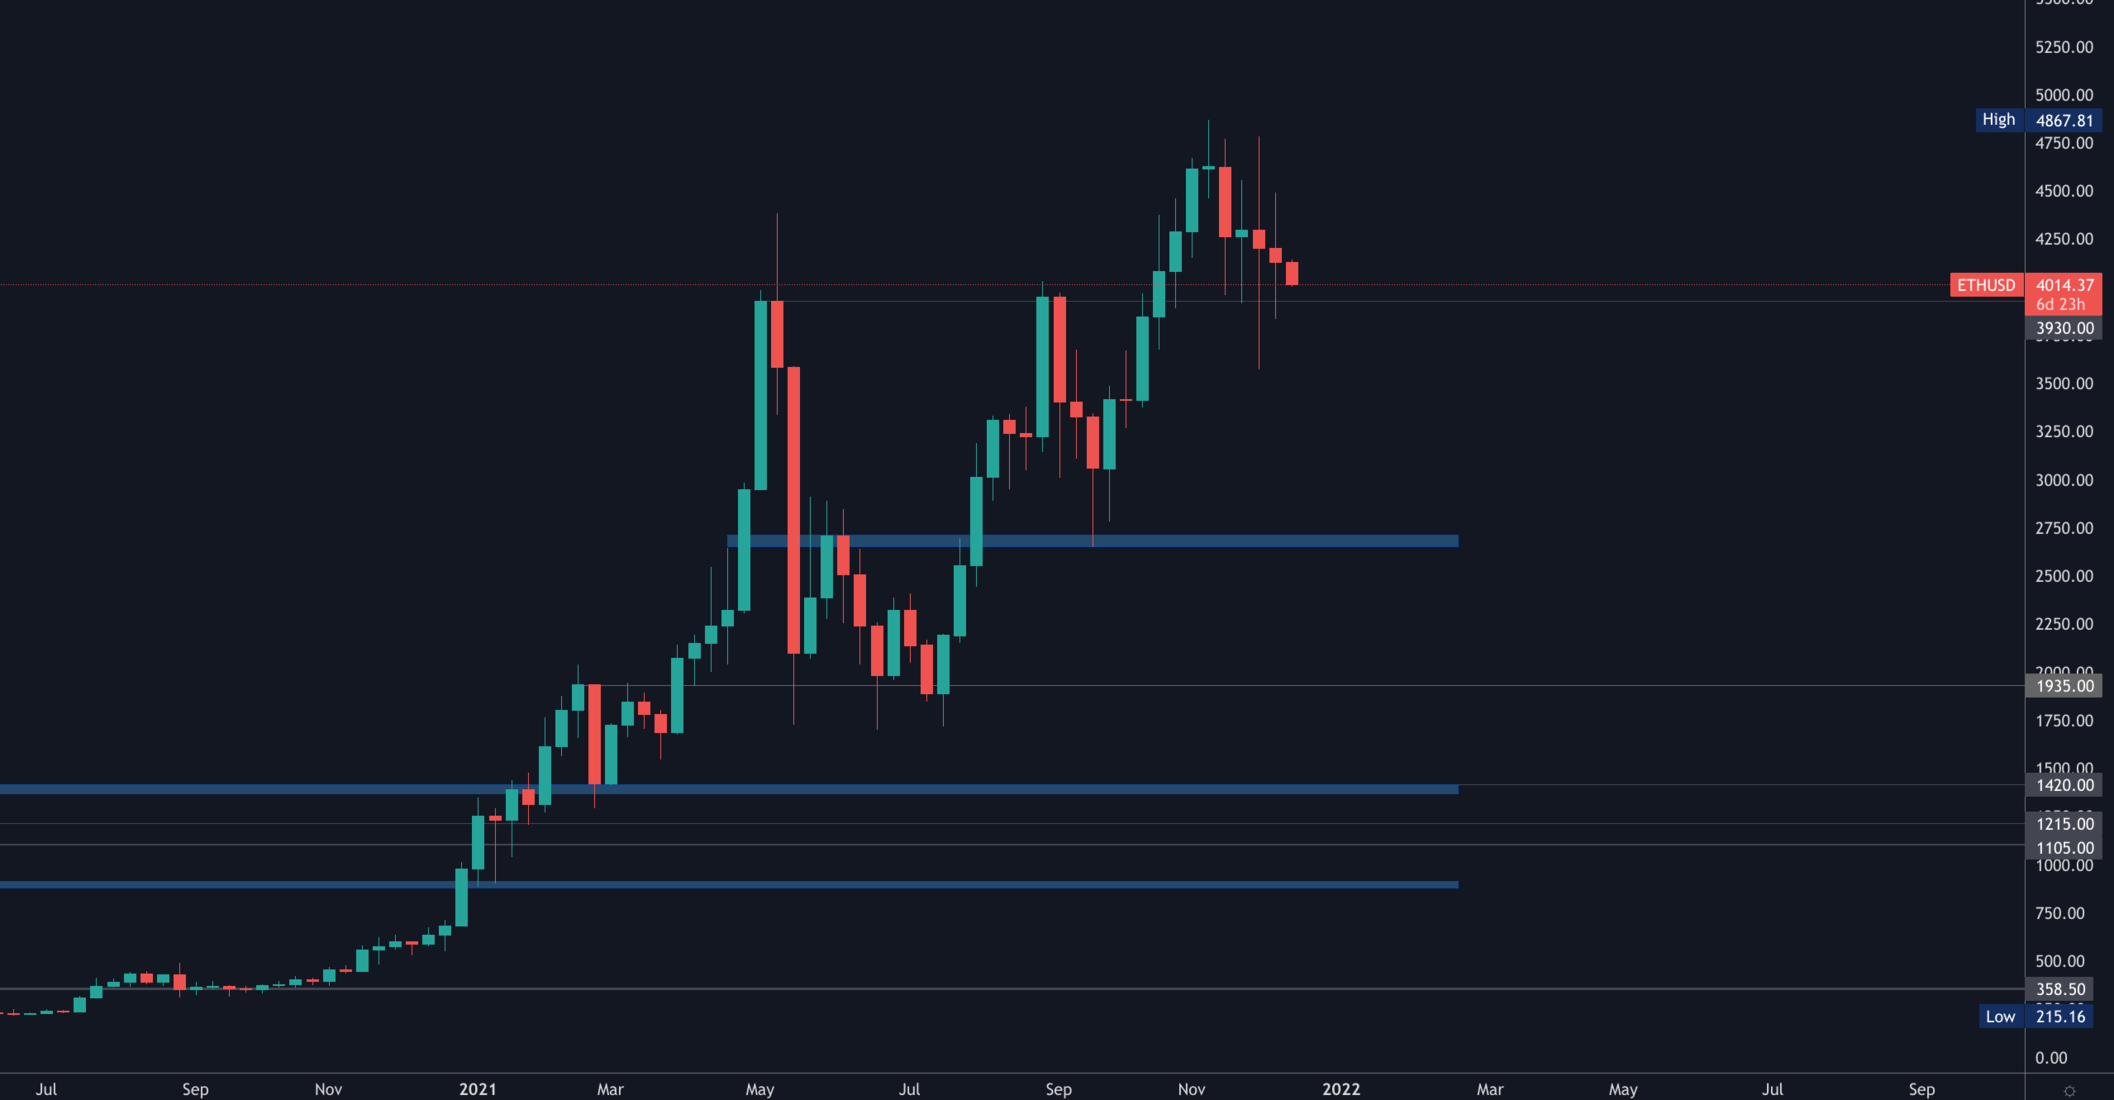
The most surprising chart in crypto where despite the sh*tshow across the board, market structure remains bullish as $3,930 holds as support.
DOT
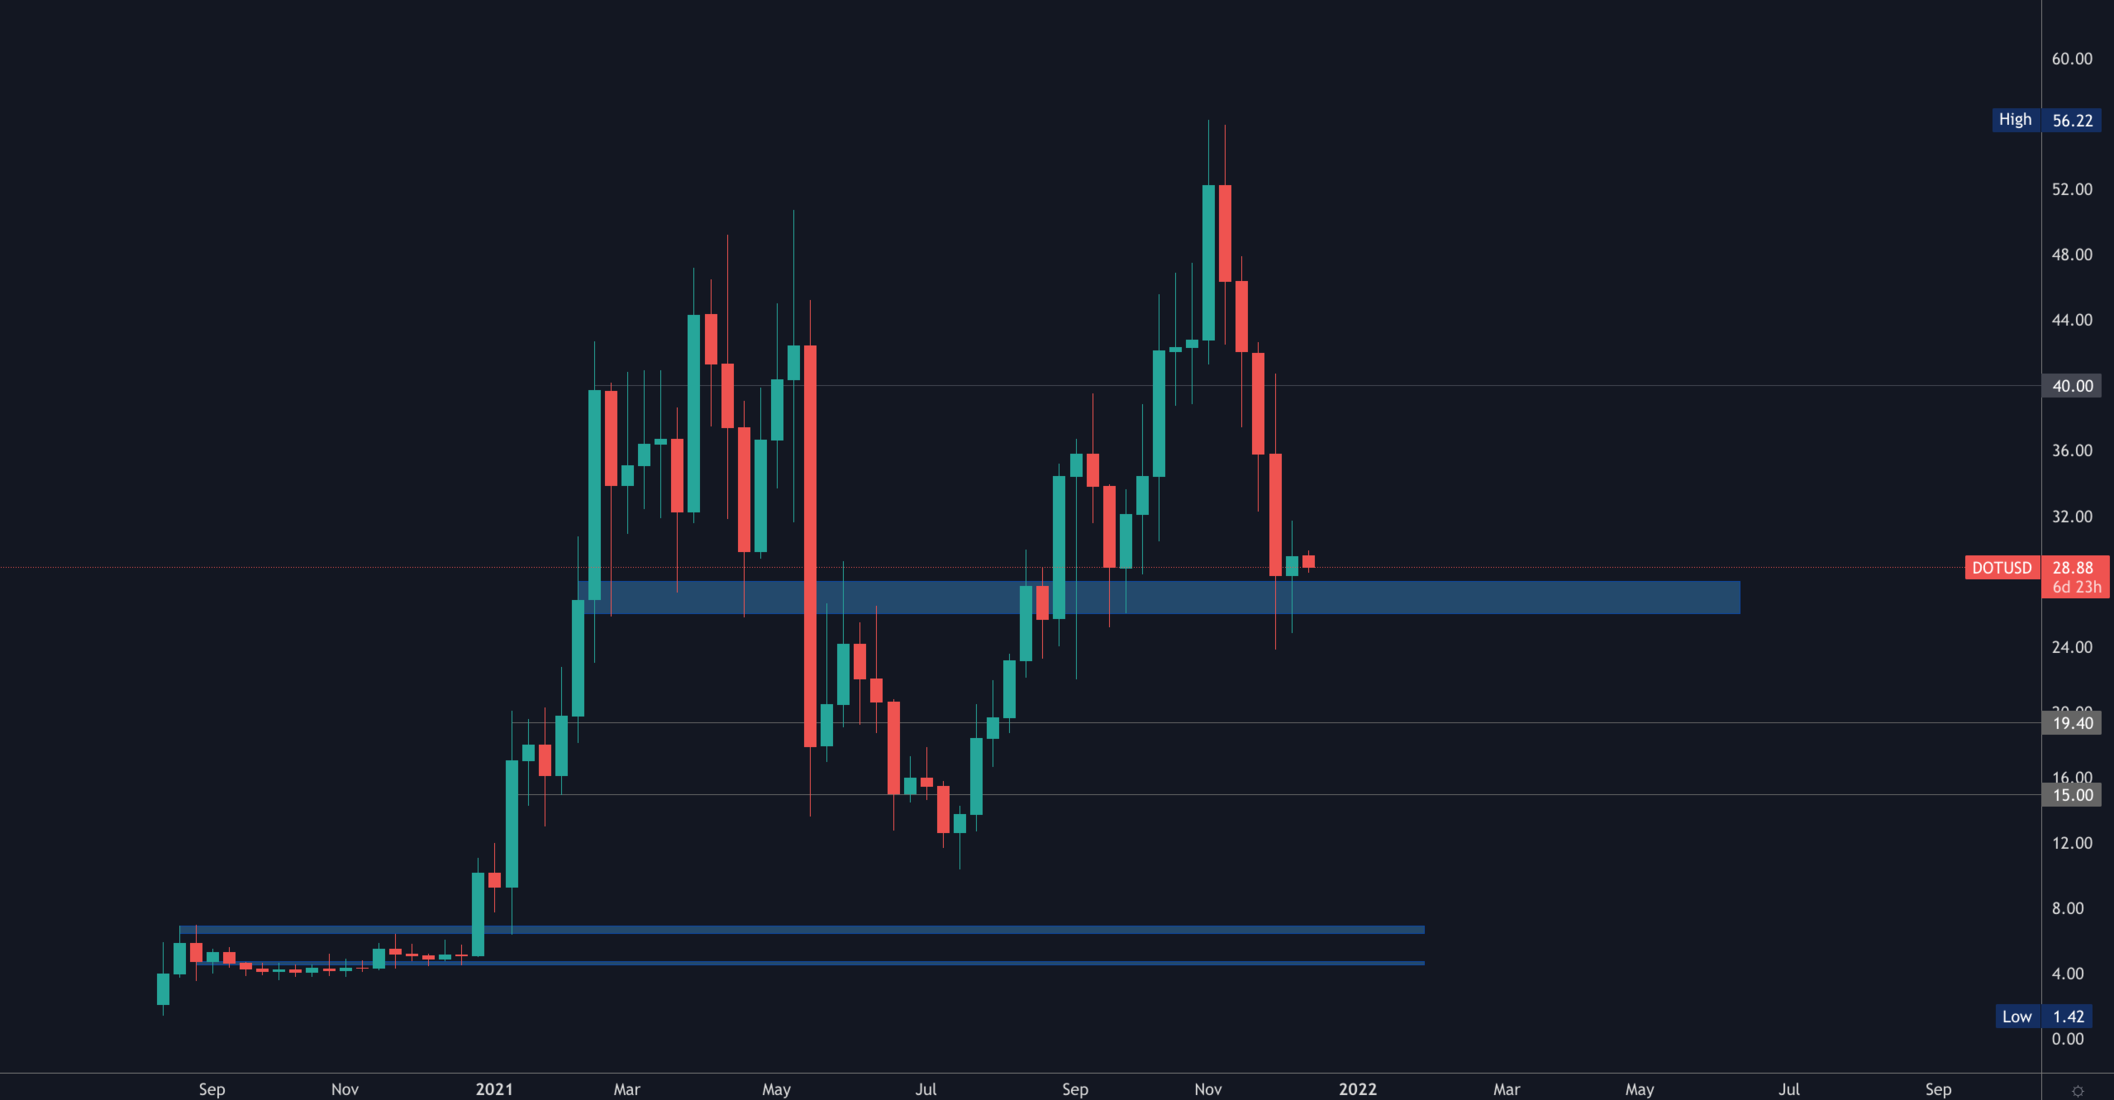
DOT holding support at $28 which technically sets the stage for a run to $40 - but if BTC drops further towards $40,000 then DOT would very likely slide back towards $20.
SNX
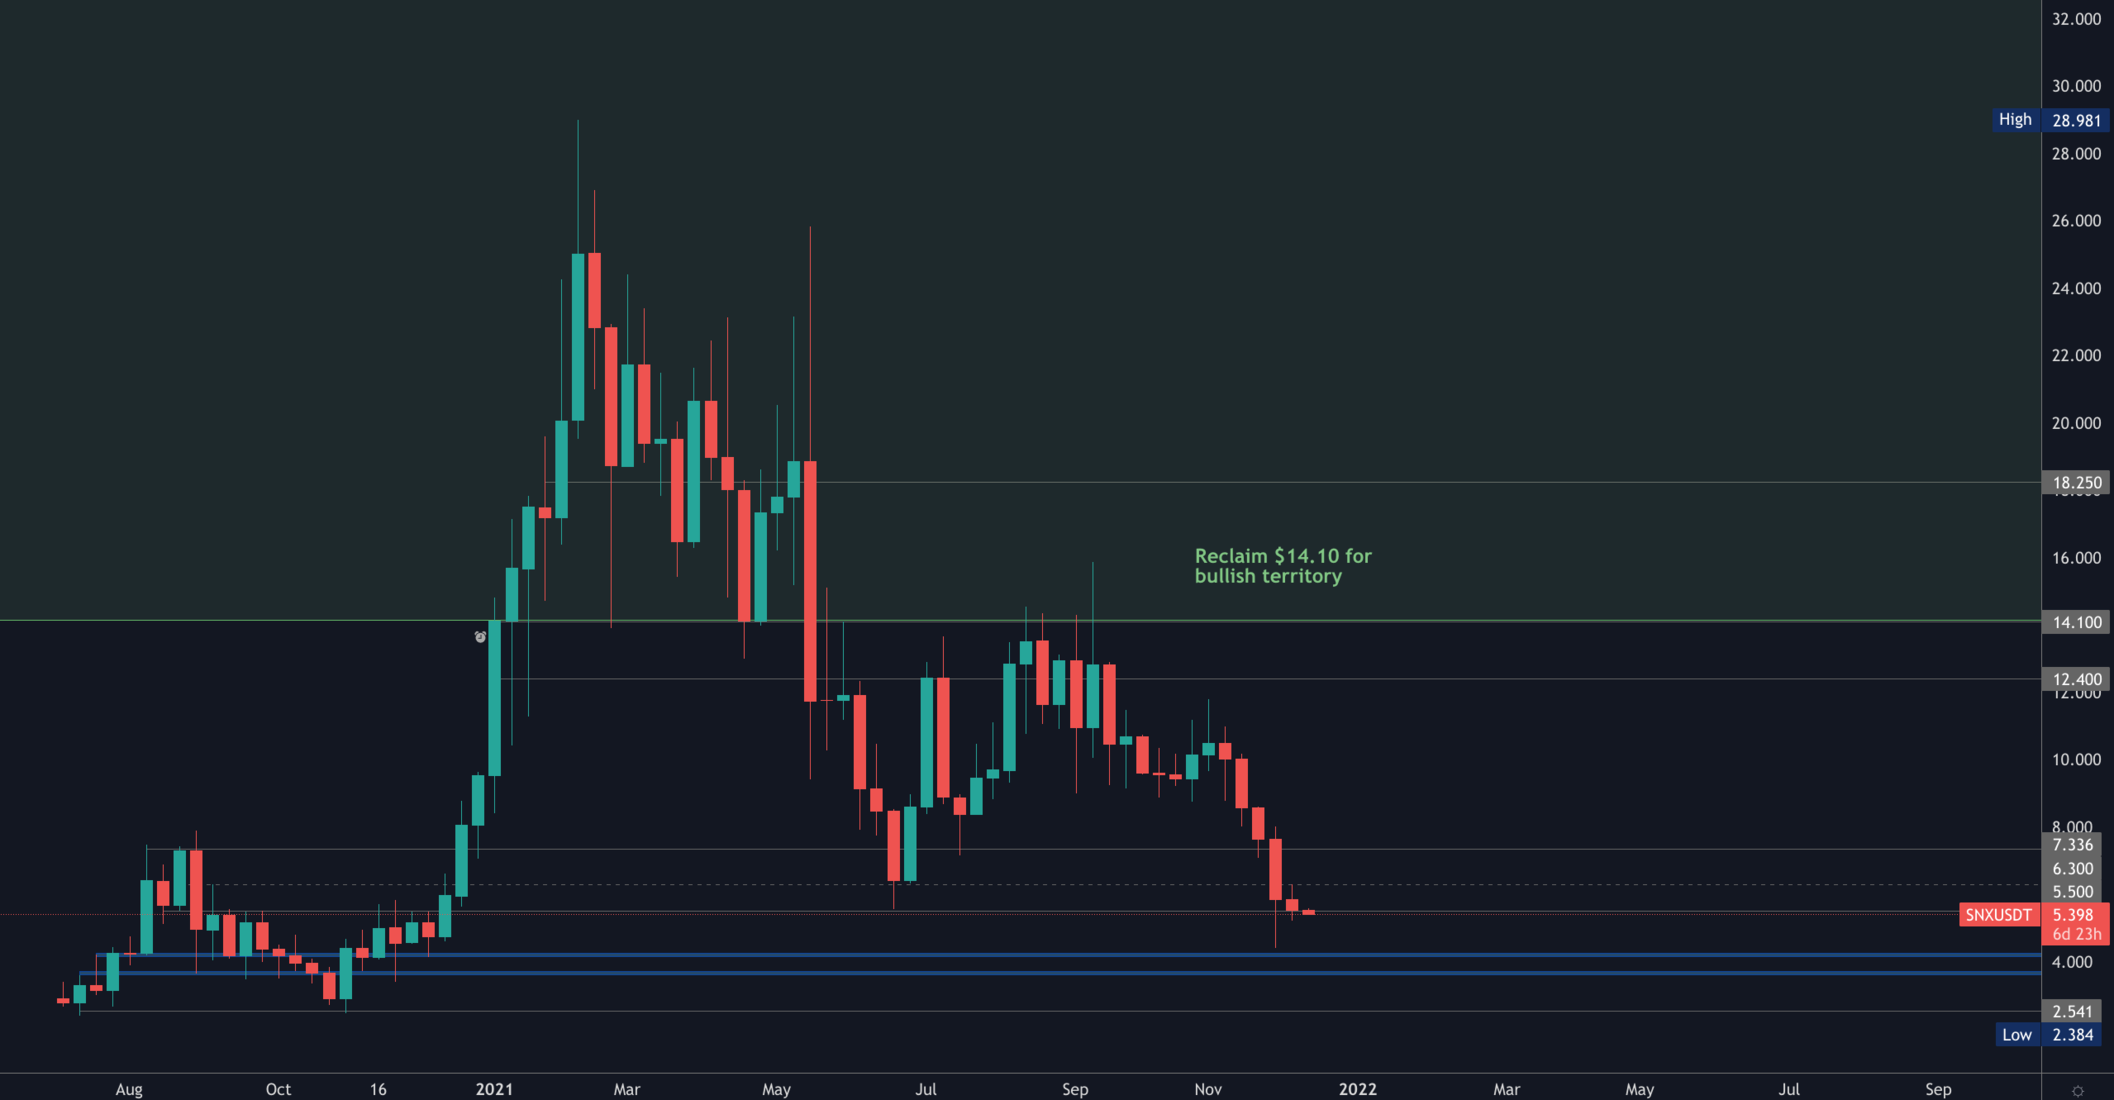
SNX has set new lows compared to June which is concerning - price is currently ranging between $5.50 and $7.50.
RUNE
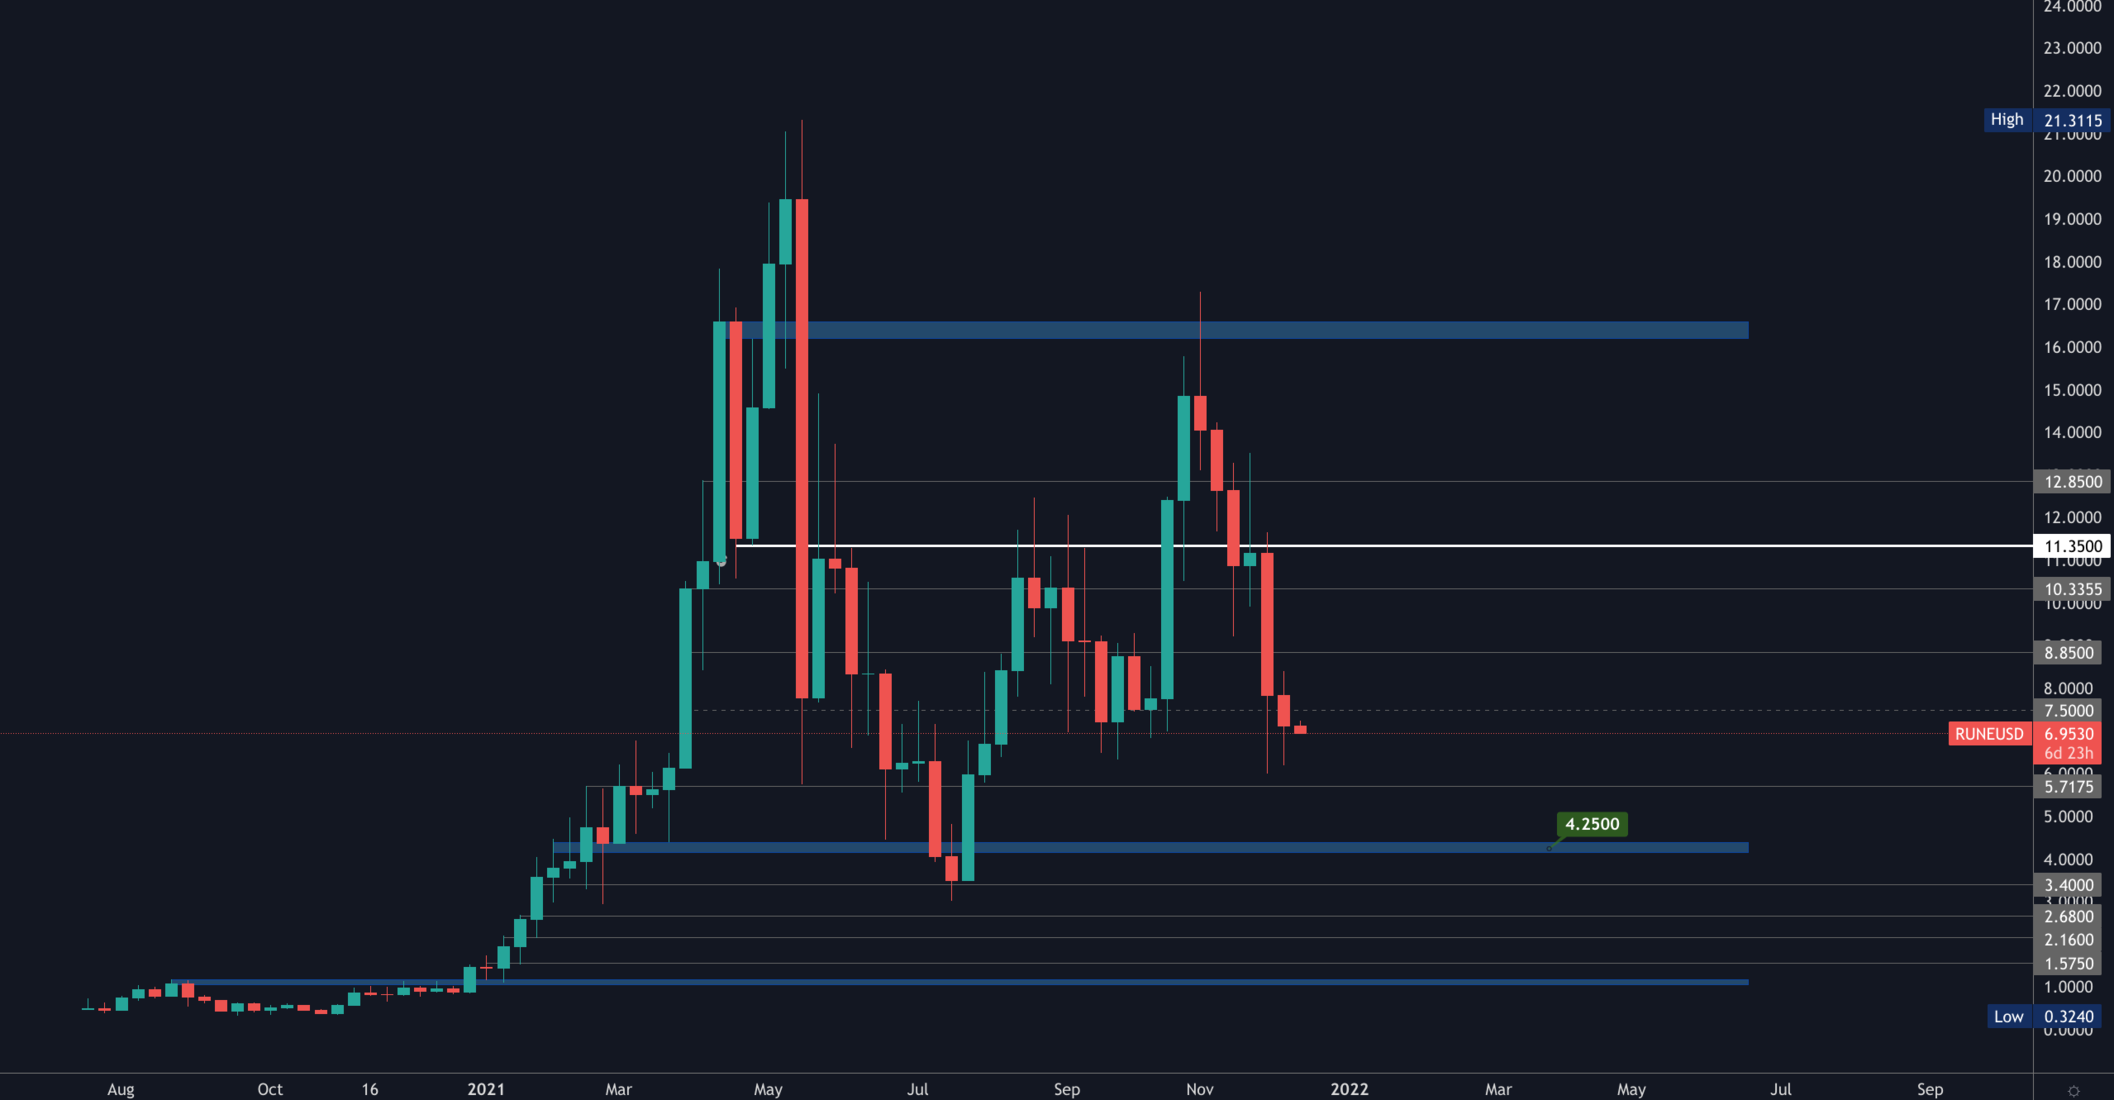
Test of $5.75 is likely given the closure below $7.50. This chart today is a perfect depiction of why following key levels is very important - since price broke back down $11.50 on the weekly the assumption became "chop & drop" which has occurred.
SOL
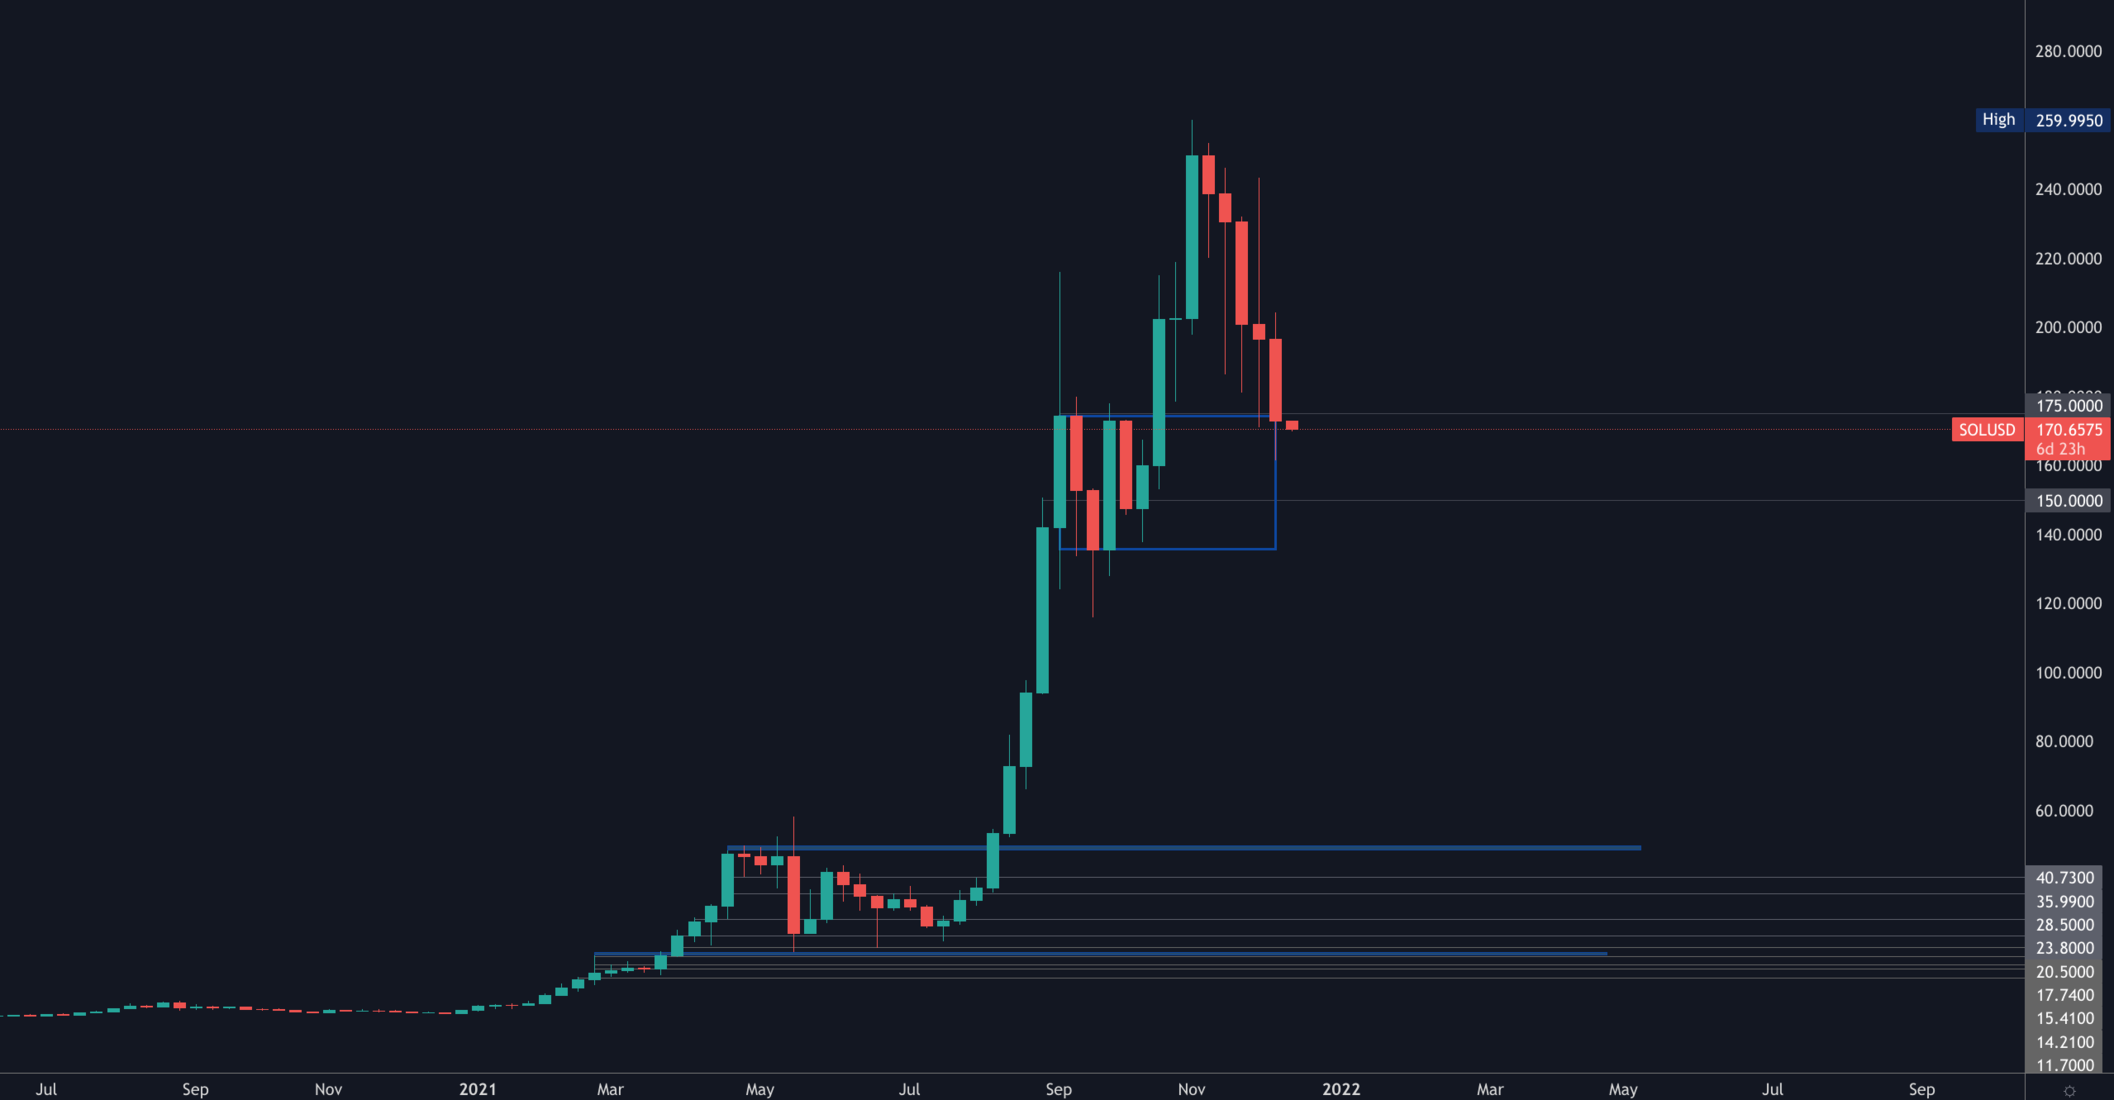
SOL closed at $173 ($2 away from $175). This is a break in market structure which tells us $150 is likely next.
SRM
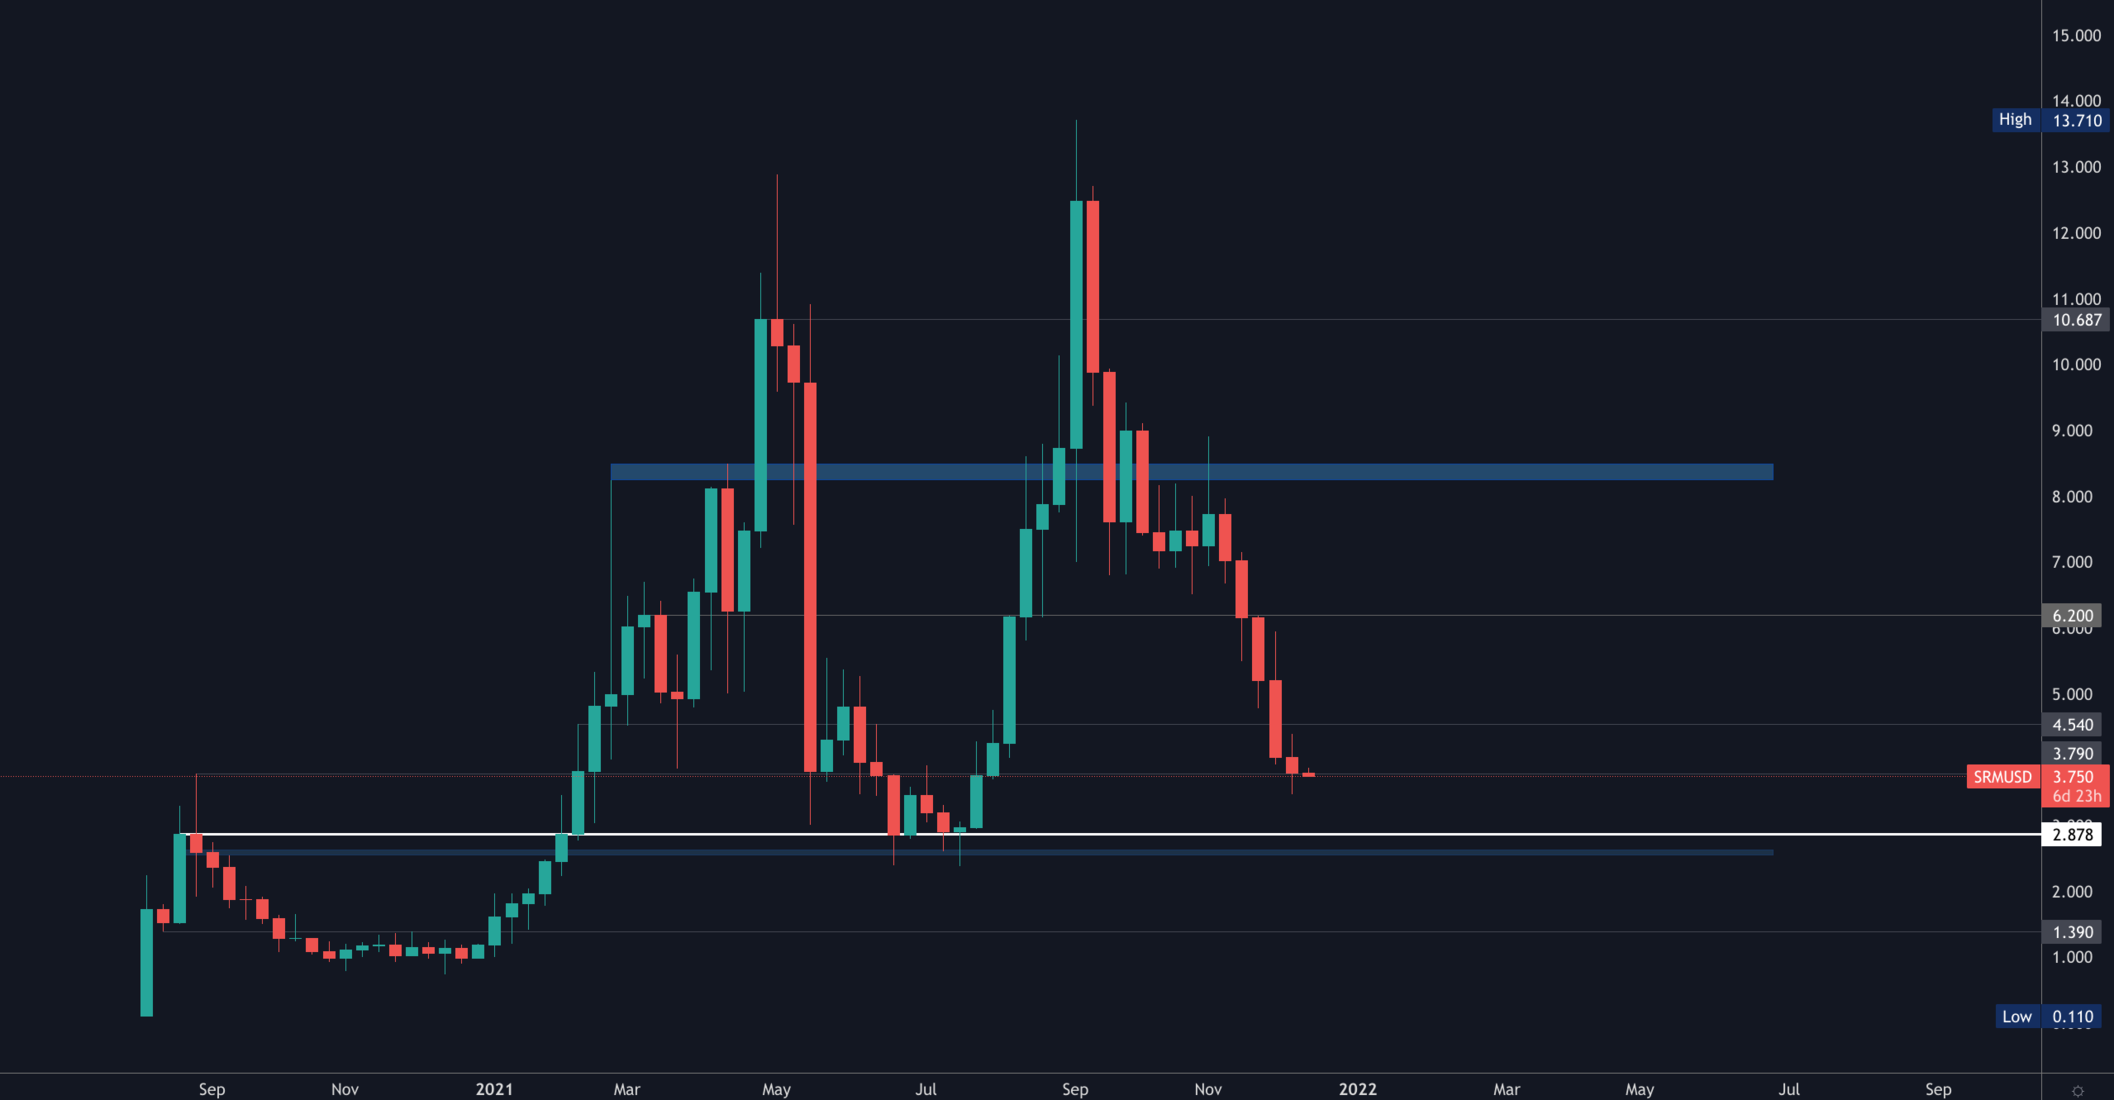
Our bias here is that SRM finds a bottom once again in the [$2.50-$4.00] range.
MINA
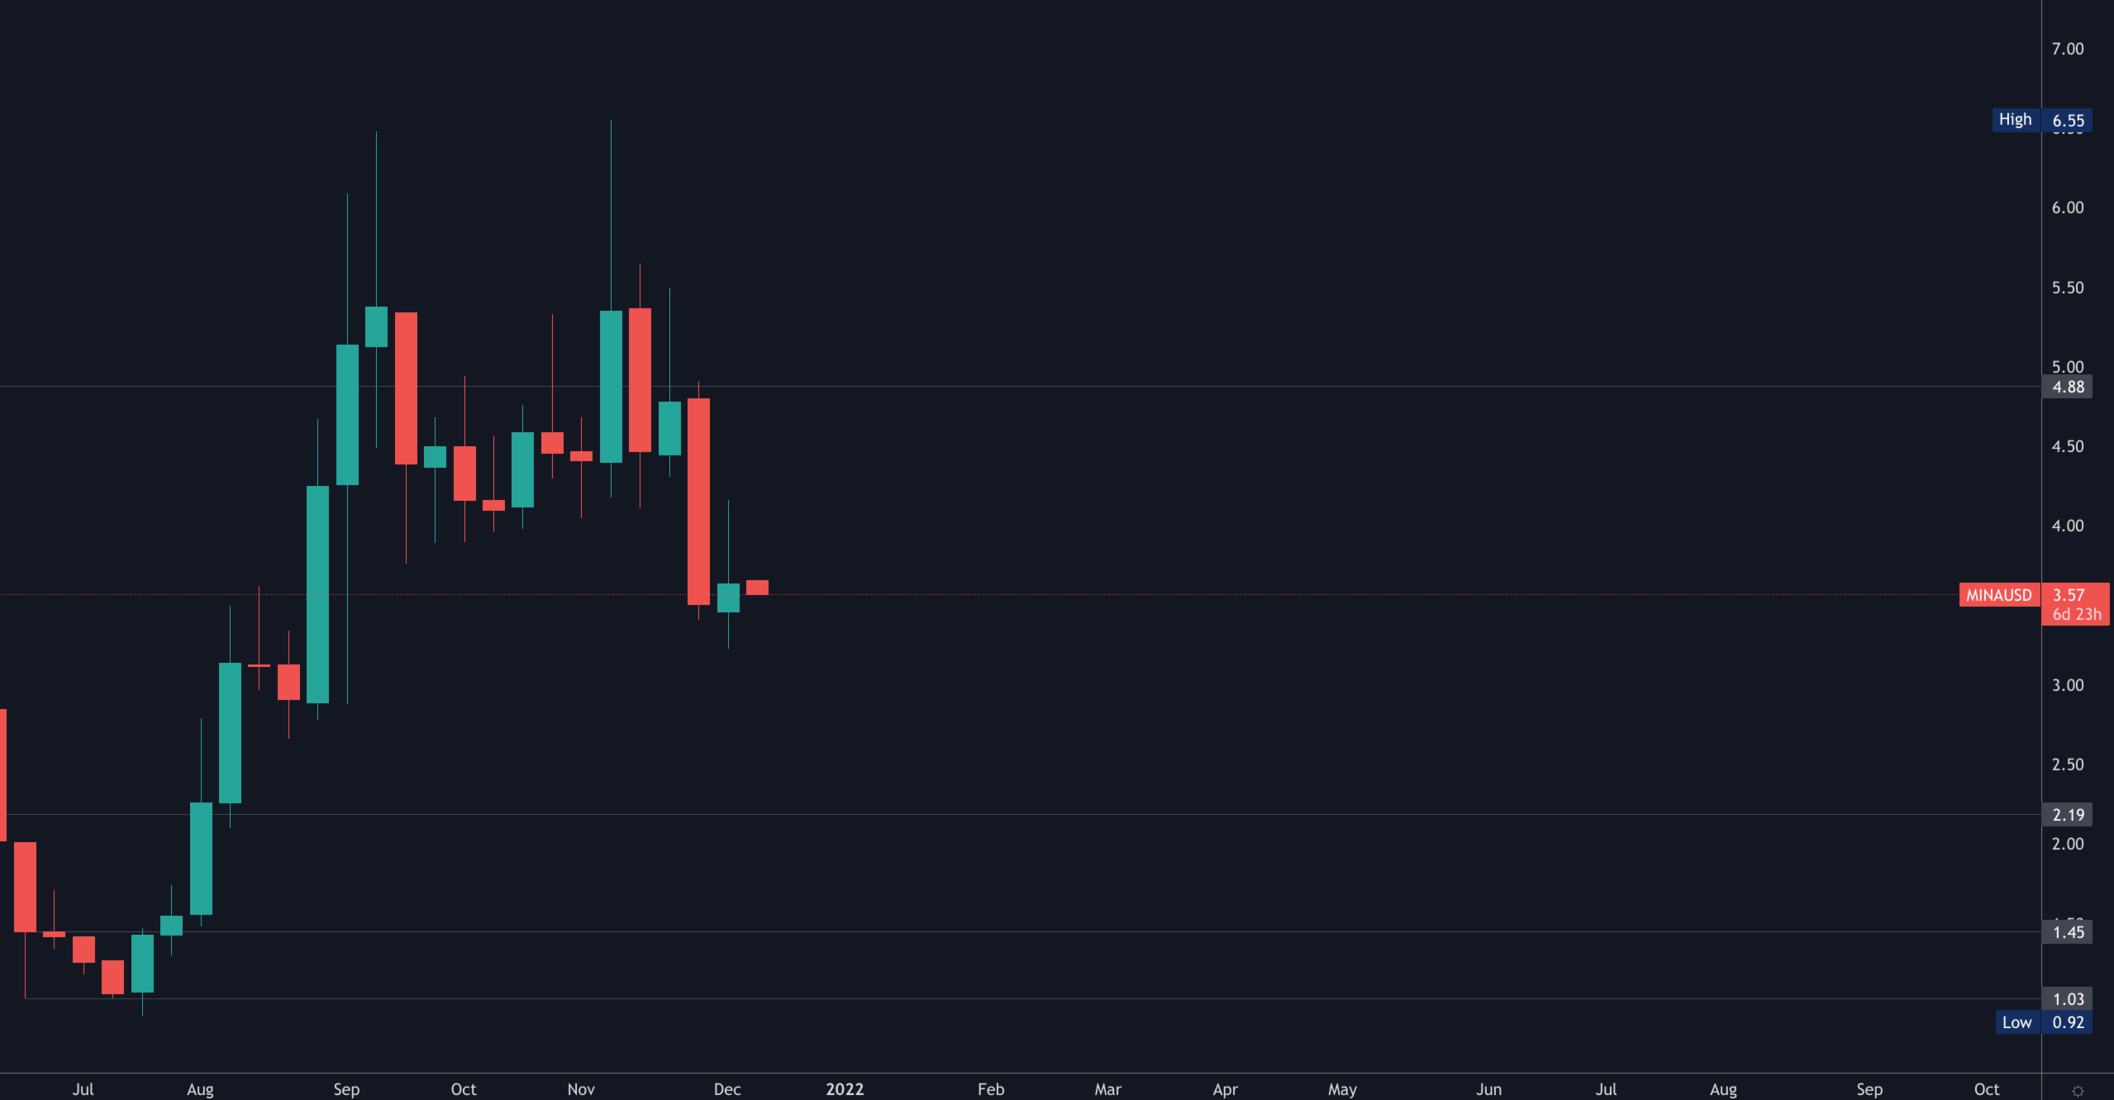
$4 turned into resistance, still expecting $3 in the coming weeks.
FTT
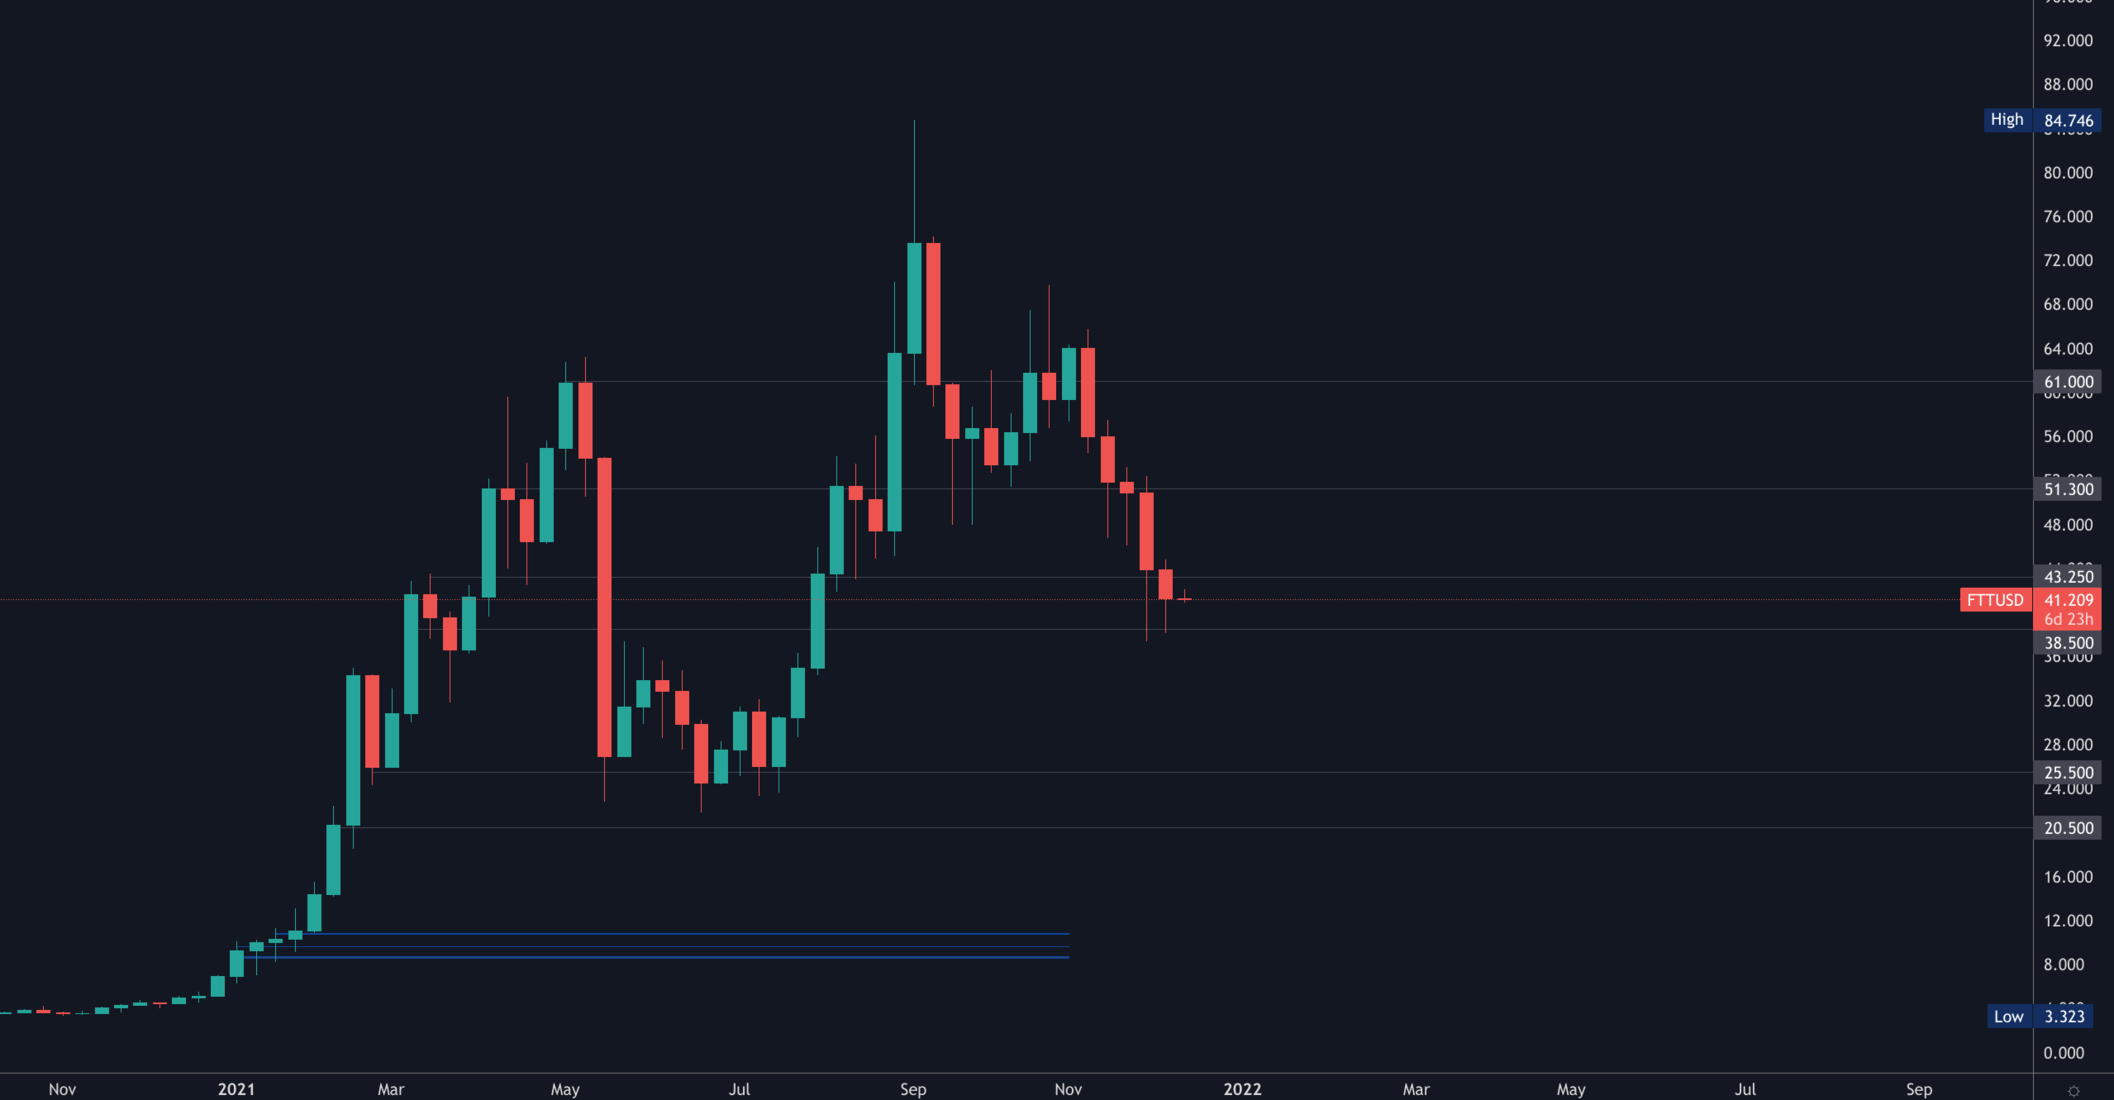
FTT broke $43.25 which set the stage for $35.
DYDX
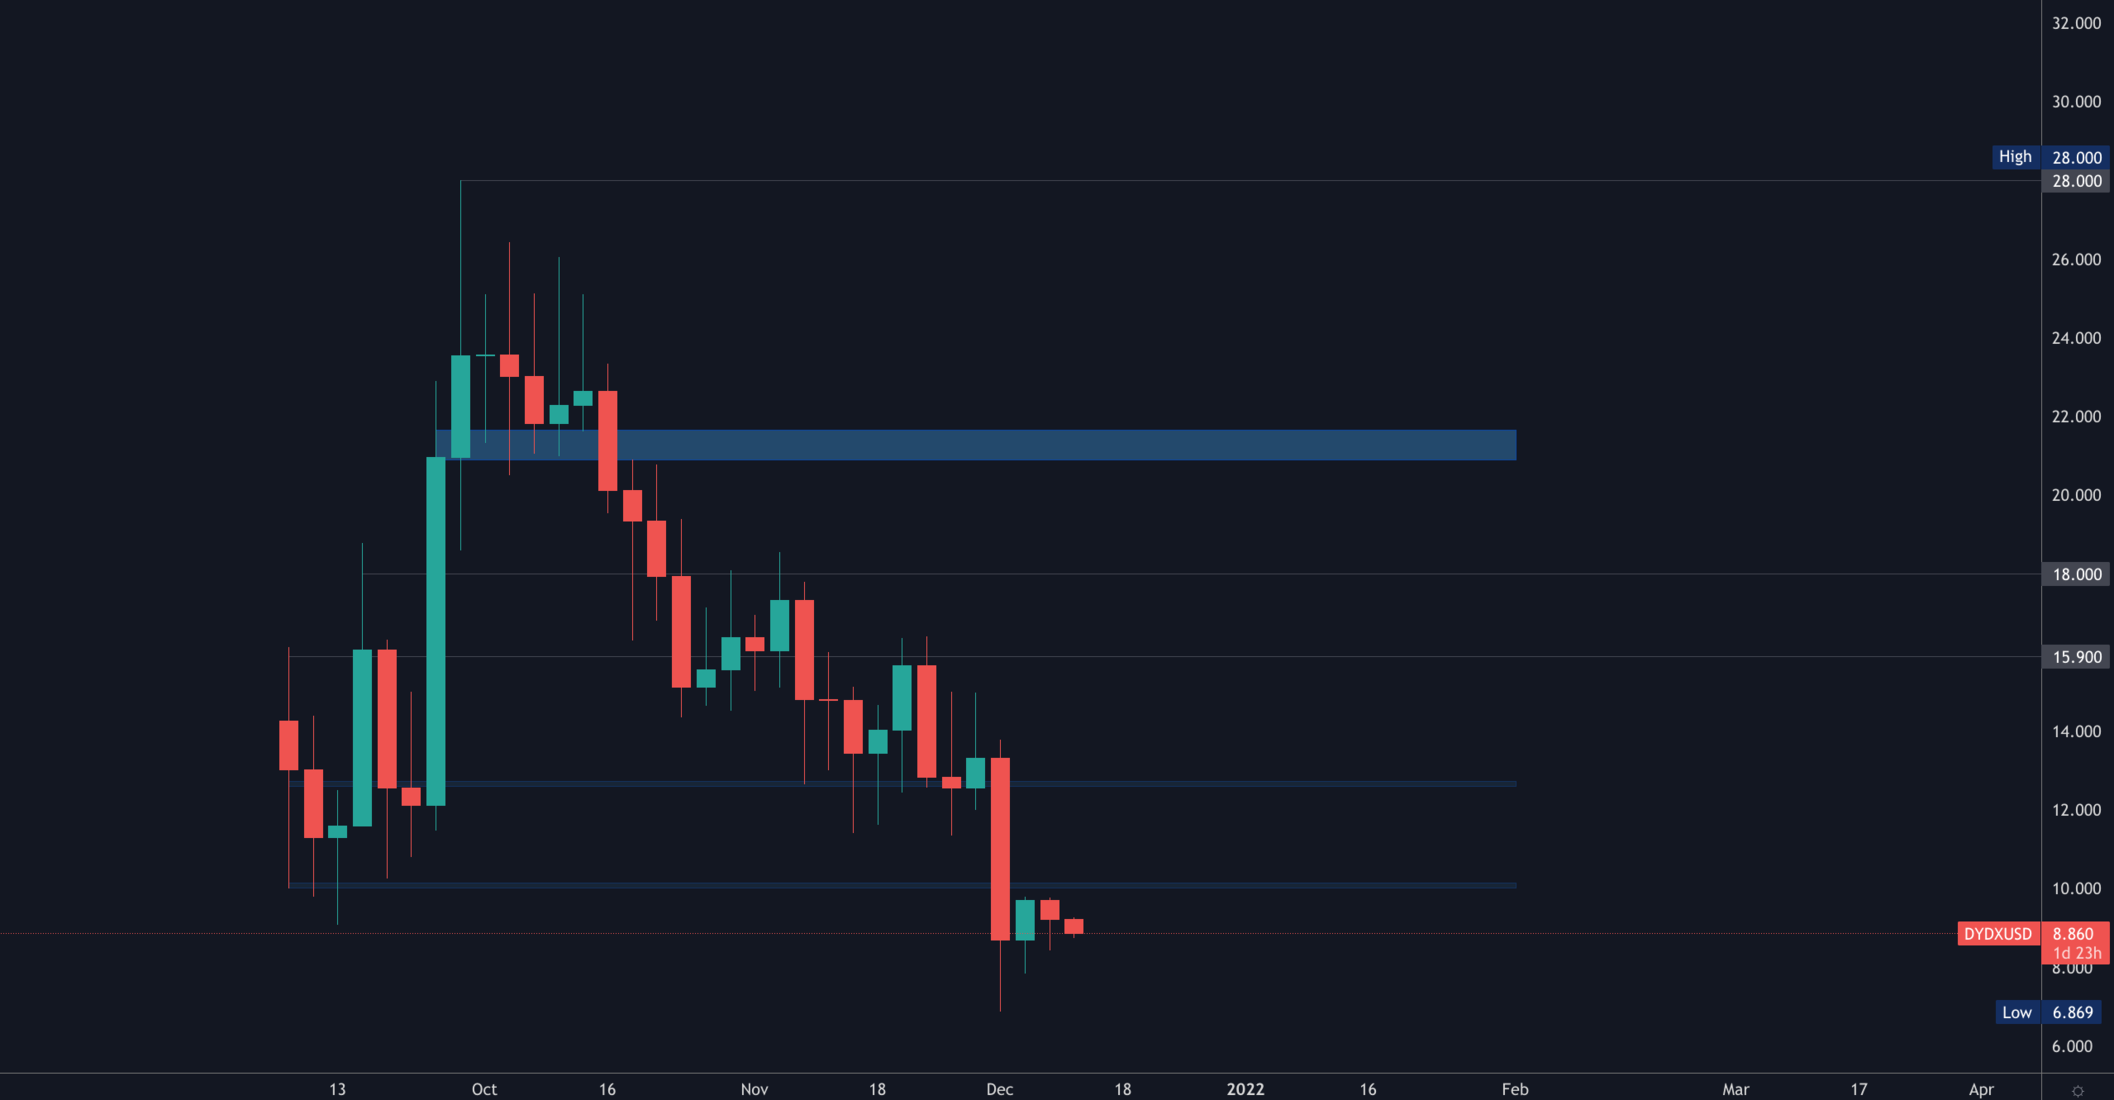
Bearish market structure. Given the steepness here, we'd expect a bottom to form sometime in Q1/Q2 2022.
Recommended from Cryptonary


