🎄 Cryptonary Christmas Sale! 50% OFF. Save $500 Now Only ⏰ : 1d 3h 26m 11s
The Fear & Greed index gathers data from several sources and simplifies it into the chart that we see here. We keep our eyes out for sentiment reaching the extremes as, historically, it has helped signal towards a bottom or top being set. From the Index above, sentiment has reduced slightly since last week but remains in Fear. As we remain in Fear, not Extreme Fear, there's the possibility that Bitcoin's bottom isn't in quite yet.


There's been no significant change here since our last Weekly Technicals. The funding rate remains positive and open interest remains at the highs. As stated last week, this suggests higher odds that the next move from BTC will be explosive and may liquidate a number of positions.
This week's closure has invalidated the bullish engulfing candle that formed a week prior, whilst at the same time creating a Lower High. As we still closed under $2.45T, we are still facing the possibility of a visit to $2T. The invalidation for this would be reclaiming $2.45T, which would likely lead us towards $3T and beyond. It's worth highlighting that, from the chart above, the Higher Low structure is still intact.
We can also say the same for the Alts MCap. The bullish engulfing candle led us straight into resistance, at $1.5T, which leaves us with the possibility of retesting $1.11. A reclaim of $1.5T would invalidate this and once again open the door to reaching new highs.
Bitcoin has ranged between $45k and $53k for several weeks and is showing no signs of a clear direction. The previous week's bullish engulfing candle has been invalidated, and $45k is held as support. However, the more times a support is tested, the weaker it becomes. Losing $45k as support will almost certainly lead us towards $40k.

DOT has held up reasonably well in comparison. After losing the liquidity area of $26.50 - $28, it immediately reclaimed it (with a bullish engulfing candle) and retested it as support. Although we haven't seen an immediate bullish reaction, DOT held the liquidity area as support which maintains the possibility of a run towards $40.
SNX held its ground, retested $5.50 as support, and closed last weeks' candle (only slightly) green. $7.50 is still on the table as long as $5.50 holds and the majors behave themselves.
RUNE failed to capitalise on the bullish engulfing candle last week, but it did retest $6.75 as support and closed above it. So long as this level holds, it means that $11.50 is next.
We weren't sure where SOL would close for a few days, as it danced around $175. Price did hold on to $175, which would technically set us up for a run at $200. However, it is another case of the previous weeks' bullish engulfing candle not being taken advantage of. In fact, a bearish engulfing candle was the result, coupled with the formation of a lower high. SOL is skating on thin ice. Only with a daily reclaim of $200 does SOL get interesting from a bull's standpoint.
SRM is still ranging between our weekly key levels of $2.90 and $4.85. Closing below $2.90 opens up the possibility of $1.50 and, in contrast, flipping $4.85 into support leads us towards $6.20.
MINA is another asset that failed to capitalise on the bullish engulfing candle and, after an attempt to tackle it earlier in the week, closed underneath its $4 resistance. This leaves us with the possibility of a revisit to $3. Alternatively, if MINA closes above $4, we're open for a run into $5.40.
The theme of failure to capitalise immediately on bullish engulfing candles continue. With another retest of our $35 support region, FTT ranges in the lower half of the $35 to $50 range.
We had the anticipated run towards $10 but failed to reclaim this level. We'll continue to monitor dYdX on the daily timeframe for reclamation of $10.
Disclaimer: Not financial advice nor investment advice. Only you are responsible for any capital-related decisions you make, and only you are accountable for the results.
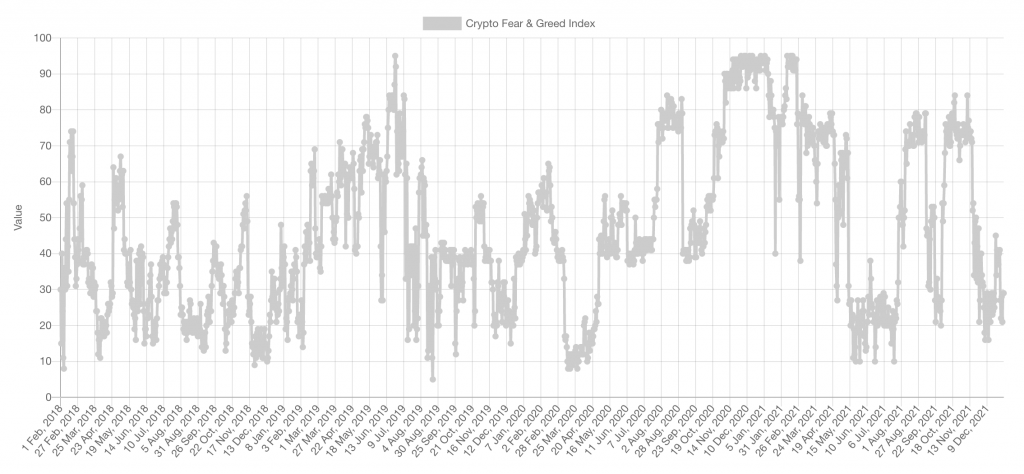