Save 23% ($351) & Get a Free 1-1 Call with our Team ⏰ : 0d 2h 59m 44s
Weekly Technicals Pro – Volume 92
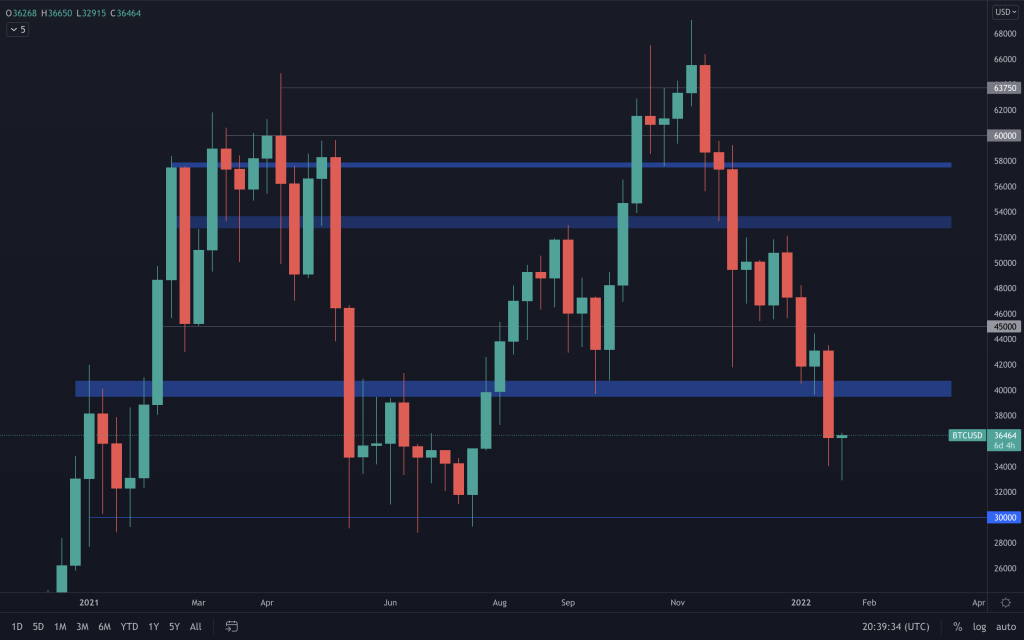
With the lower timeframe bearish structure remaining intact, we saw Bitcoin move into the $30k -$40k range, as we’d anticipated in our Goblin Town journal and daily T.A. Although we expected to see some strength in the market, we mentioned that it wasn’t forthcoming, and it became clear that the FED effect wasn’t over and that further downside was the likely outcome once the Total Market Cap closed below $1.75T. This downside doesn’t alter the bigger picture, however. When coupled with the Total Market Cap’s support level and structure, it’s fair to expect Bitcoin to start looking to form a bottom within the lower half of this range. For now, the market is still in a bearish structure, with Bitcoin's ‘last line of defence’ about -20% away. Our expectation is to see Bitcoin begin to form a bottom around $30,000, give or take. This bottom may take some time, and it would be reasonable to expect the market to move sideways within this range for most of Q1. Should Bitcoin reach $30,000 and hold this level of support (again, we don’t make assumptions that this will be the case), we’d see the formation of a double-bottom form on the monthly timeframe.

Disclaimer: Not financial nor investment advice. Only you are responsible for any capital-related decisions you make, and only you are accountable for the results.
Market Index
Total Market Cap
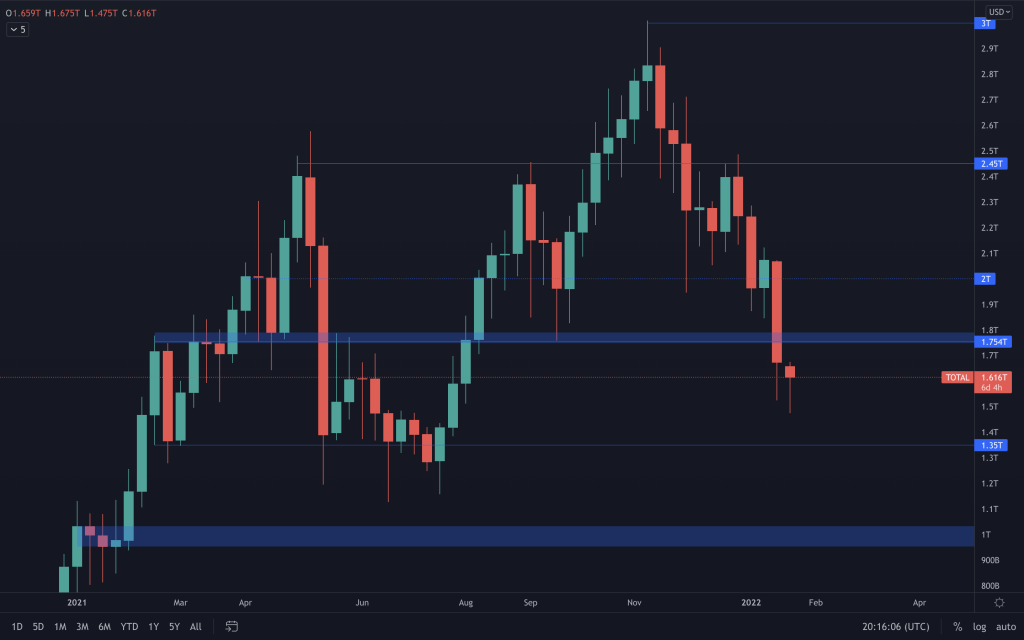 From this index, we can see that back in November, the Total Market Cap moved into the all-time highs and, in doing so, created a higher high. This is the typical structure that you'd expect from a bullish market. Instead of continuing into those highs, the index has seen a 50% retracement and now finds itself at $1.6T. Below $1.6T, the Total MCap has $1.35T as support and $1.75T as resistance above. To maintain the bullish structure, the index needs to maintain a price above $1.127T. But when coupled with BTC, it's unlikely to see this level for the bullish outlook to remain intact. This will be explained a little more later.
Of course, we may create a lower low; nothing in any financial market comes with any guarantees. But from a technical analysis point of view, this structure remains intact, and for it to do that, it would be reasonable to expect to see a bottom forming around here.
From this index, we can see that back in November, the Total Market Cap moved into the all-time highs and, in doing so, created a higher high. This is the typical structure that you'd expect from a bullish market. Instead of continuing into those highs, the index has seen a 50% retracement and now finds itself at $1.6T. Below $1.6T, the Total MCap has $1.35T as support and $1.75T as resistance above. To maintain the bullish structure, the index needs to maintain a price above $1.127T. But when coupled with BTC, it's unlikely to see this level for the bullish outlook to remain intact. This will be explained a little more later.
Of course, we may create a lower low; nothing in any financial market comes with any guarantees. But from a technical analysis point of view, this structure remains intact, and for it to do that, it would be reasonable to expect to see a bottom forming around here.
BTC
ETH
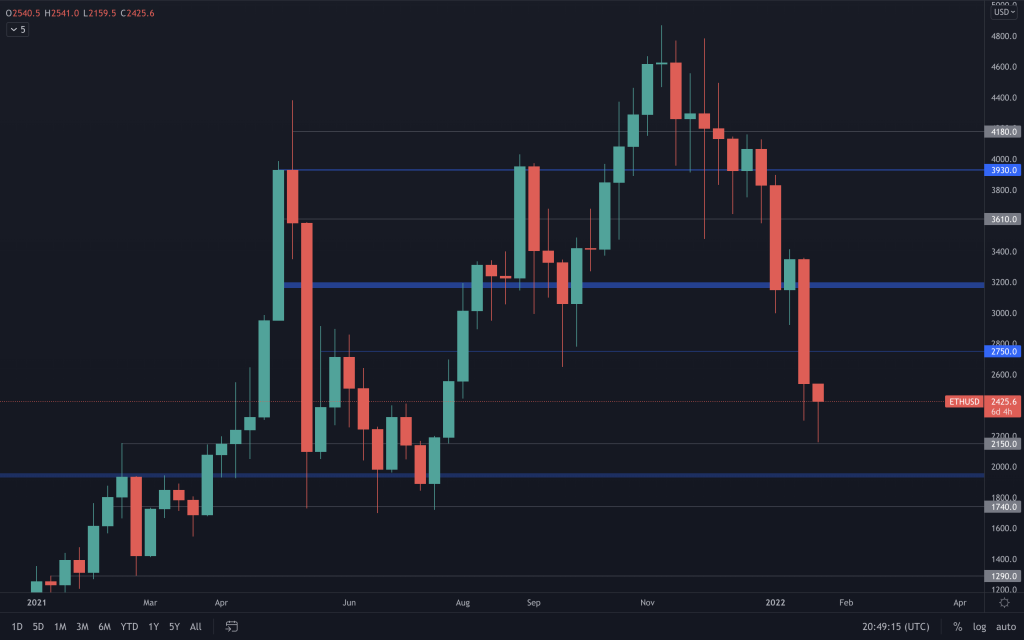 With the $2,750 support lost and the market still trending downwards, we've seen ETH push down further and head further towards $2,000 already today. Our opinion of ETH reflects that of BTC, where we are expecting it to form a bottom in the low $2,000's. Tbh, we didn't think we'd get to see ETH at this price again!
DOT
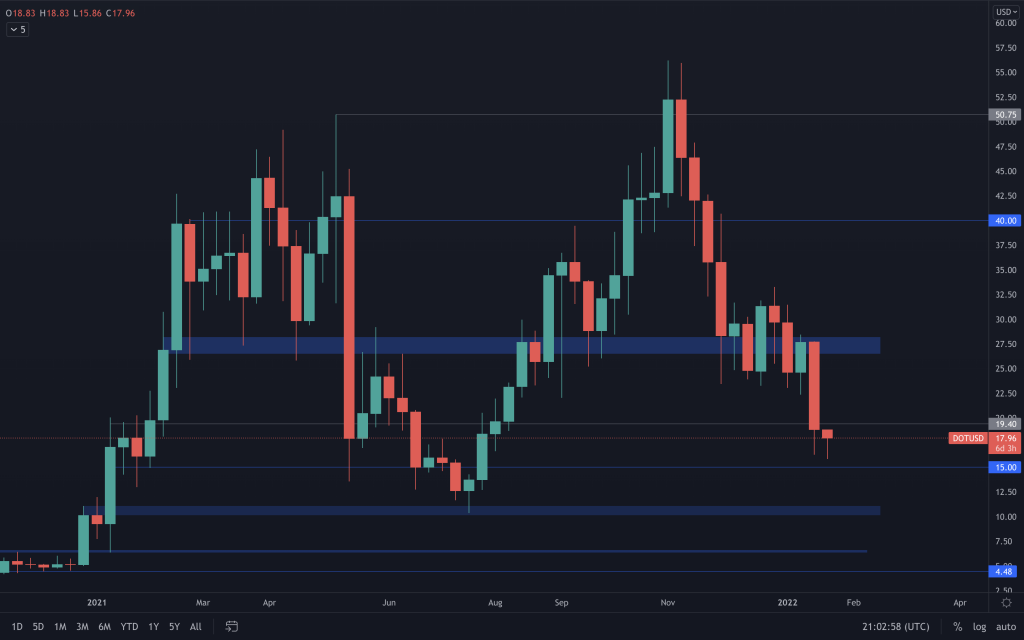 DOT finds itself in a situation very similar to that of Bitcoin. As long as Bitcoin ranges between $30,000 and $40,000, we'll likely see DOT range between $15 and $20 for the time being.
SNX
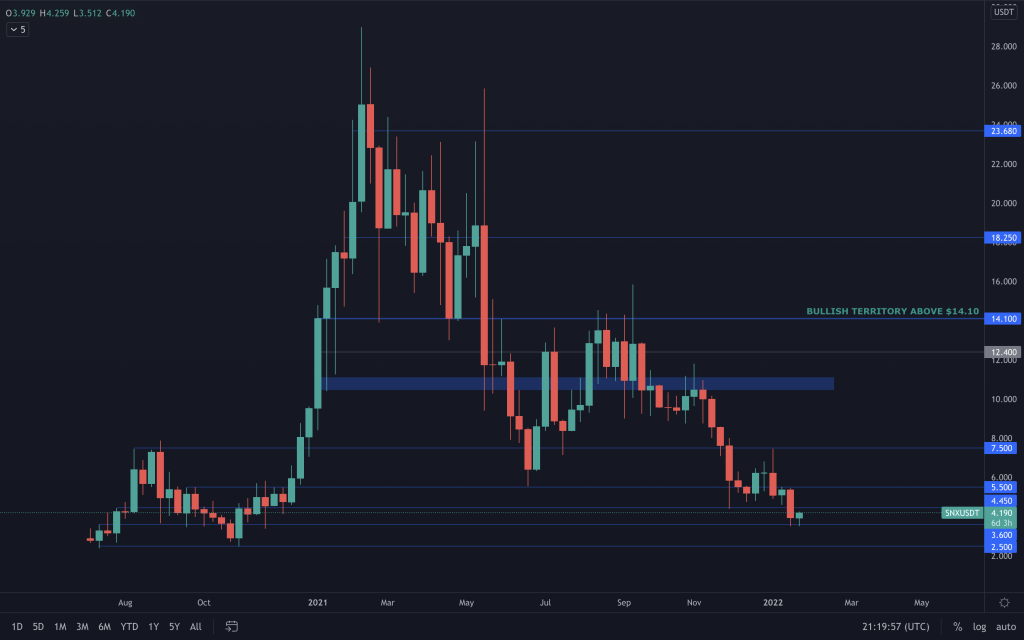
SNX has tested $3.60 today already, and we'd expect this level to offer a decent level of support. With Bitcoin ranging and the market in uncertainty, it will likely remain between $3.60 and $4.45 for the time being.
RUNE
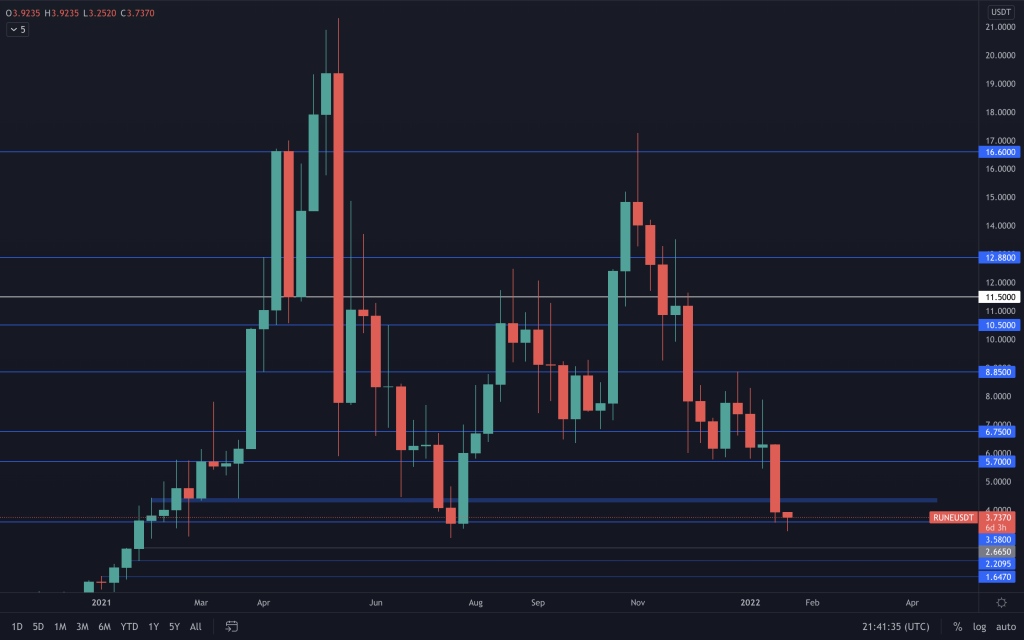
We've seen RUNE dip along with the rest of the market. The bottom has likely been set/is very close. It has tested the low $3s for the first time since July '21 when it experienced several exploits. From our point of view, the fundamentals remain unchanged, the security of the ecosystem has vastly improved, and the vision of THORChain remains the same.
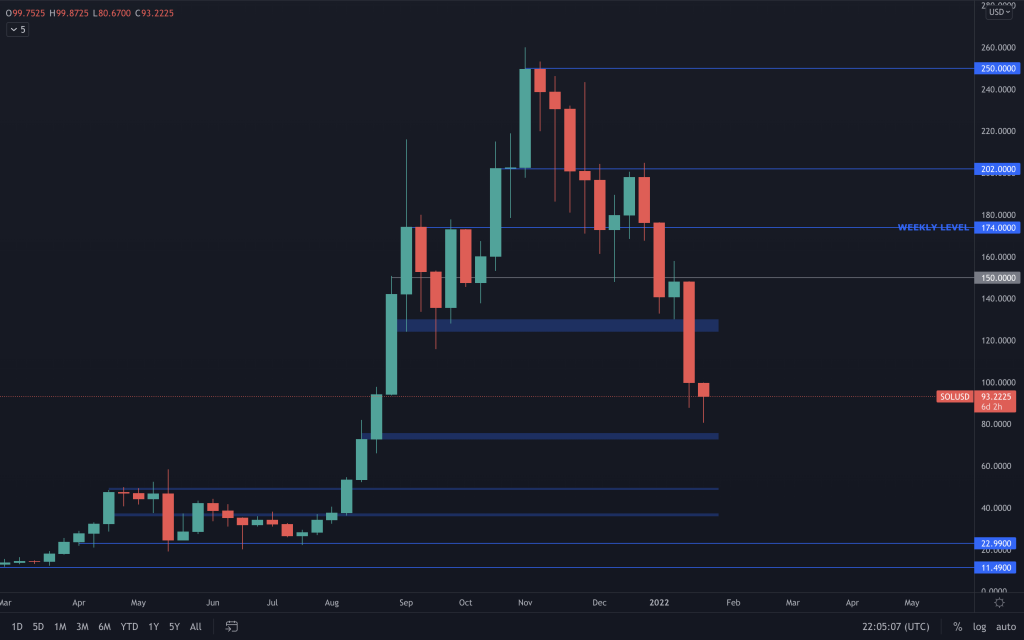
SOL
SRM

SRM cut through the $2.88 support to close the weekly candle at $2.26, making further downside towards $1.50 likely.
FTT
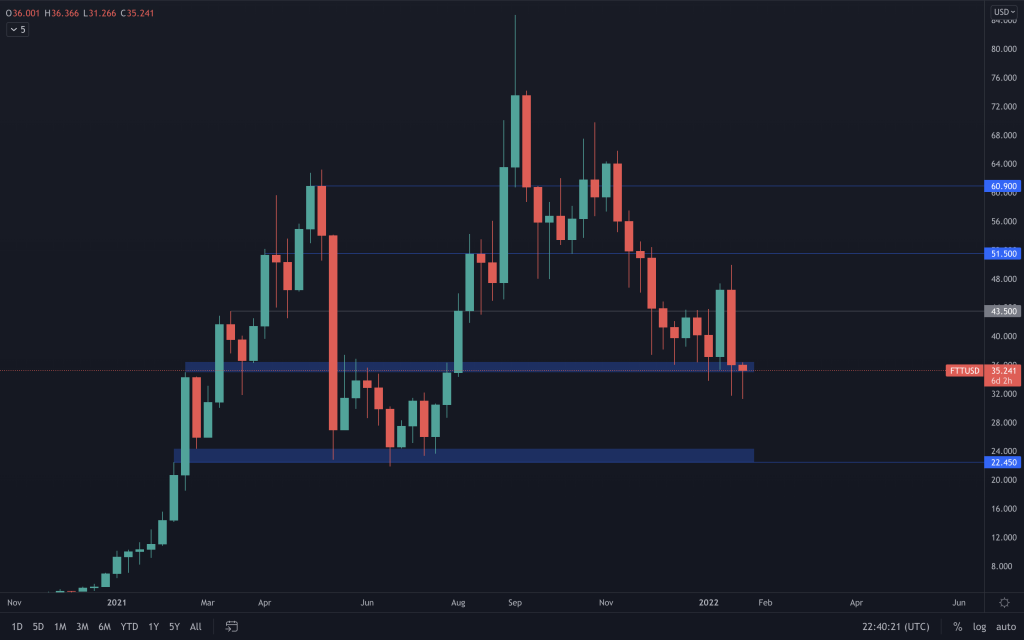
FTT closed outside of the $35-$50 range on the daily timeframe, but eventually, the weekly candle just managed to close within it. This is one that we are going to have to watch over the coming days to confirm the $35 reclaim.
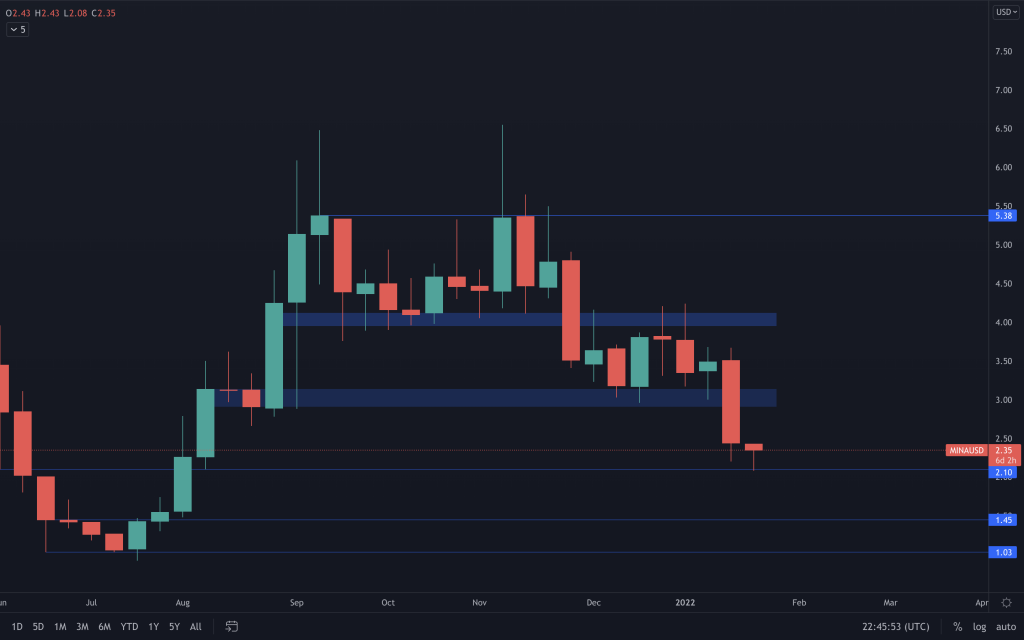
MINA
dYdX
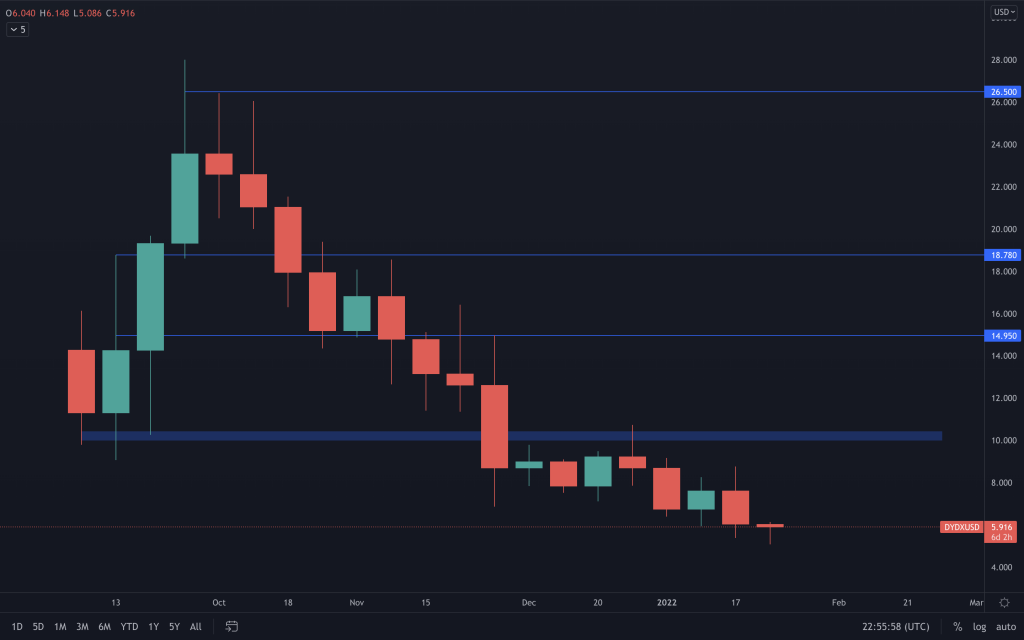
dYdX is simply continuing its move down through the single digits. We're certainly interested below $5 as we look for a bottom between $3 and $5.
Recommended from Cryptonary


