Save 23% ($351) & Get a Free 1-1 Call with our Team ⏰ : 0d 2h 59m 44s
Weekly Technicals Pro – Volume 93
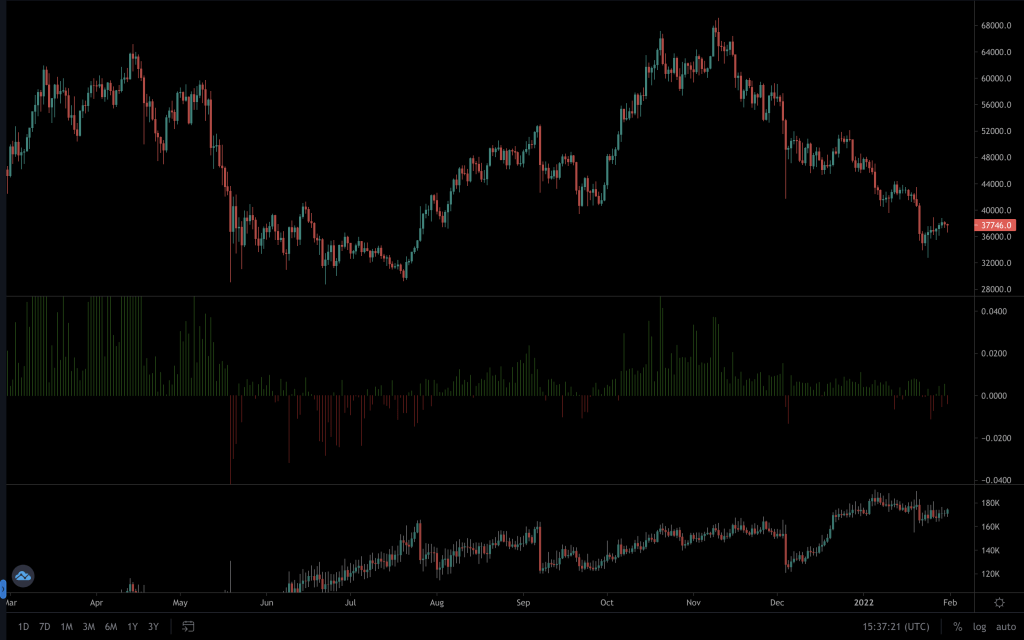
Open Interest has remained relatively stable over the past week, but we have seen the Funding Rate closing negative a little more often. This signifies that more short positions are being opened (shorts paying longs), which has often suggested that a bottom in price is near. Of course, it doesn't indicate when a bottom is set, and the price will reverse - as you can see back in May-July 2021.

Disclaimer: Not financial nor investment advice. Only you are responsible for any capital-related decisions you make, and only you are accountable for the results.
Market Sentiment
Market Indexes
Total Market Cap
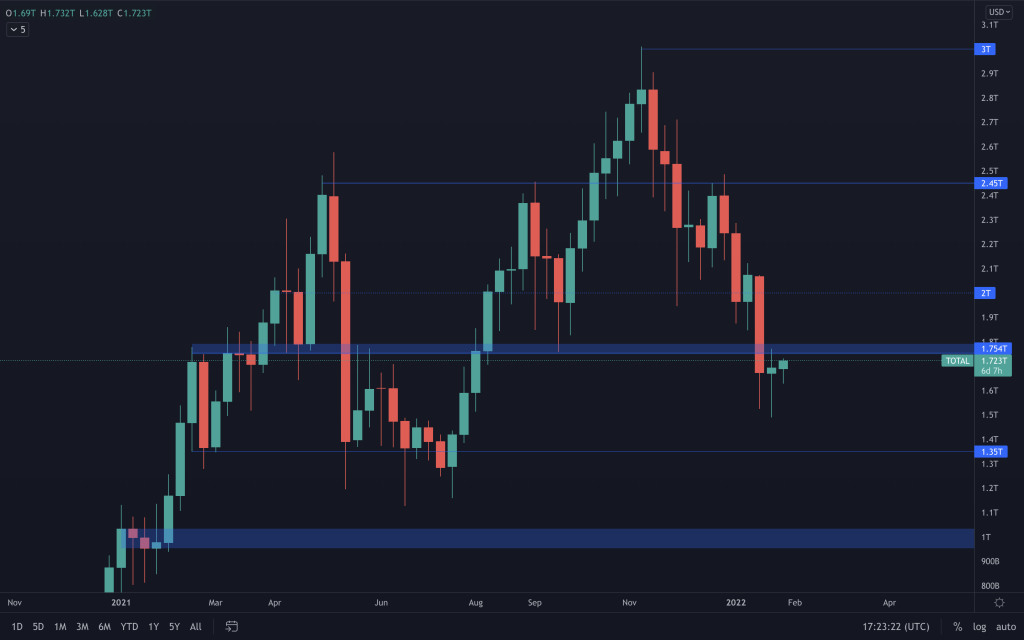
The Total Market Cap has closed slightly bullish, but it is still within the $1.35T - $1.75T range. More importantly, there is the closing of the monthly candle tonight, which will now be the market's focus.
Bitcoin
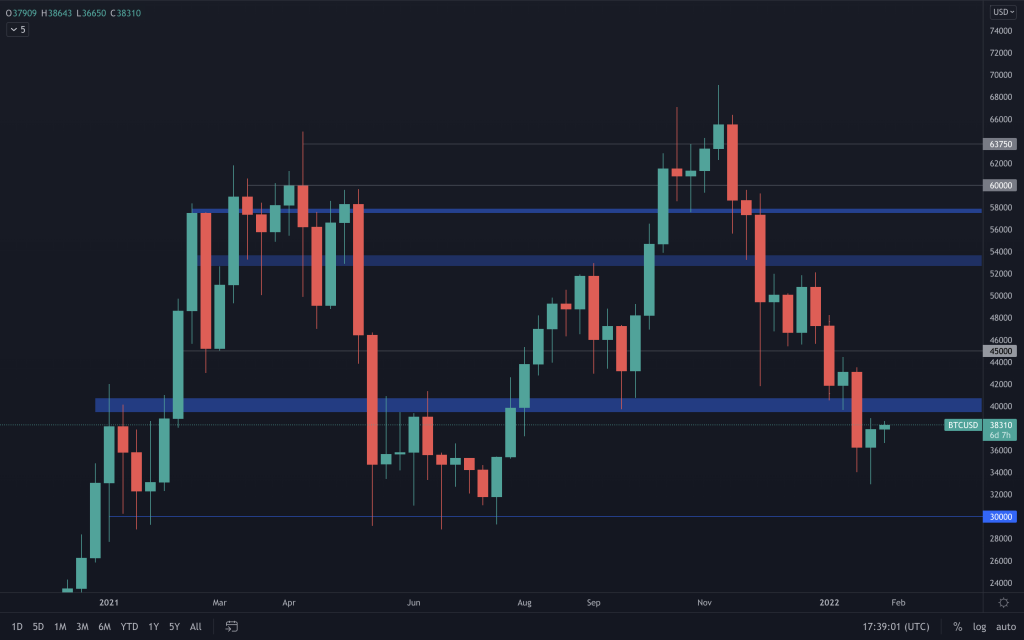
We see the same being reflected in the Bitcoin chart. A slightly bullish candle, but a candle closure that was still within the $30,000-$40,000 range. With tonight's monthly candle closure approaching and Bitcoin's price close to the resistance, we could yet see a little more volatility. It's worth mentioning that a lot of the altcoins performance will rely heavily on how Bitcoin reacts around this $40k level. For now, the market overall remains bearish even though we've seen Bitcoin's price steadily move up over the last week. Whilst the funding rate suggests that a bottom may be near, the Fear & Greed Index also suggested that a bottom may be near. What neither of them does, is identify the timing of when the market will begin to reverse. We hope to identify that in the charts.
Ether
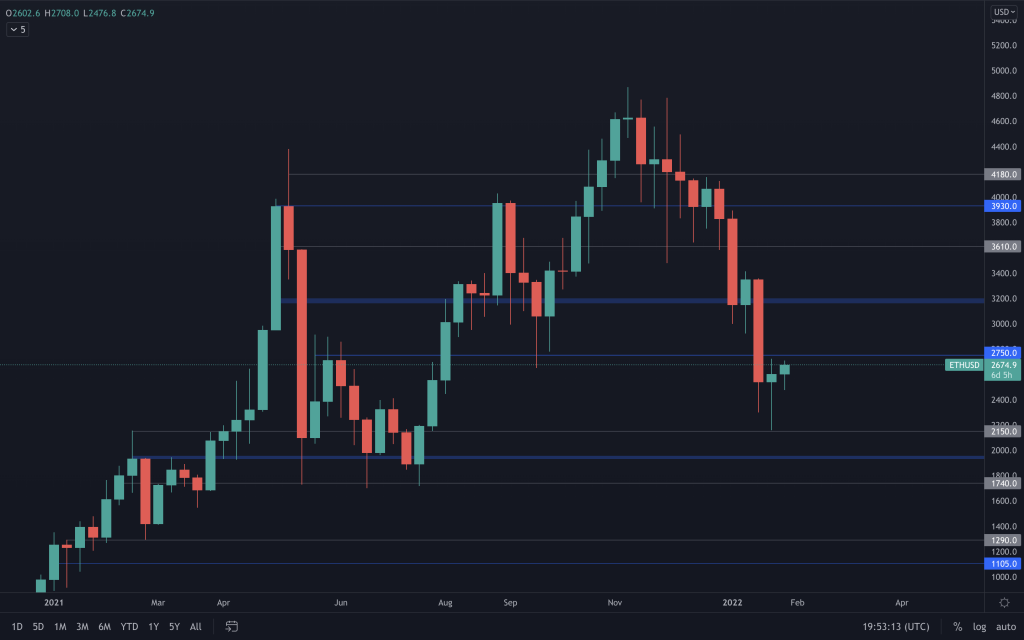
Another chart that is similar to the preceding two. We've seen Ether test a daily support level ($2,150) and push back up to close the week near the $2,750 resistance. It closed underneath it, which keeps it in the $2,000-$2,750 range. But the monthly close is tonight, and $2,750 is also a key level for the monthly candle.
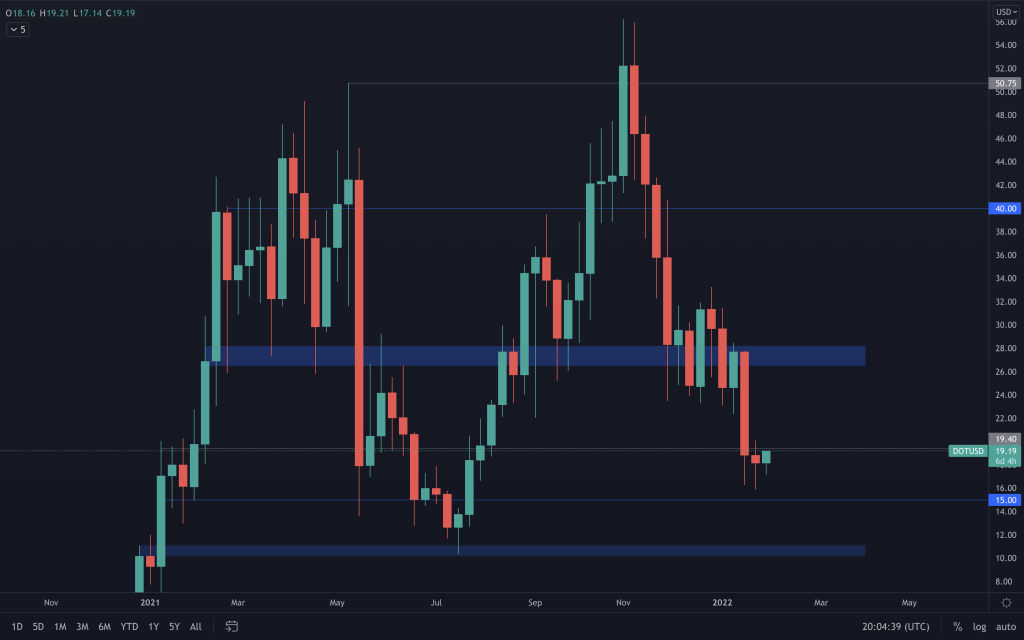
DOT
SNX
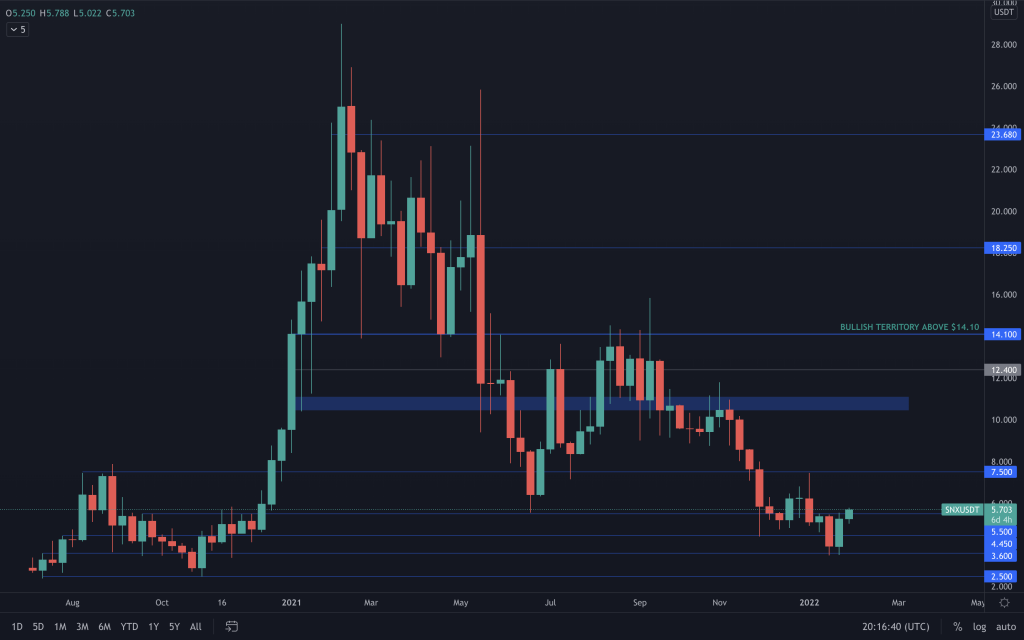
Reclaiming $5.50 would have been the strongest indication of further upside towards $7.50. However, the weekly candle closed just below, despite recovering most of the previous week's loss. We'll monitor SNX daily, as a closure above will suggest a move to $7.50, but its price action will now depend more on that of Bitcoin's.
RUNE
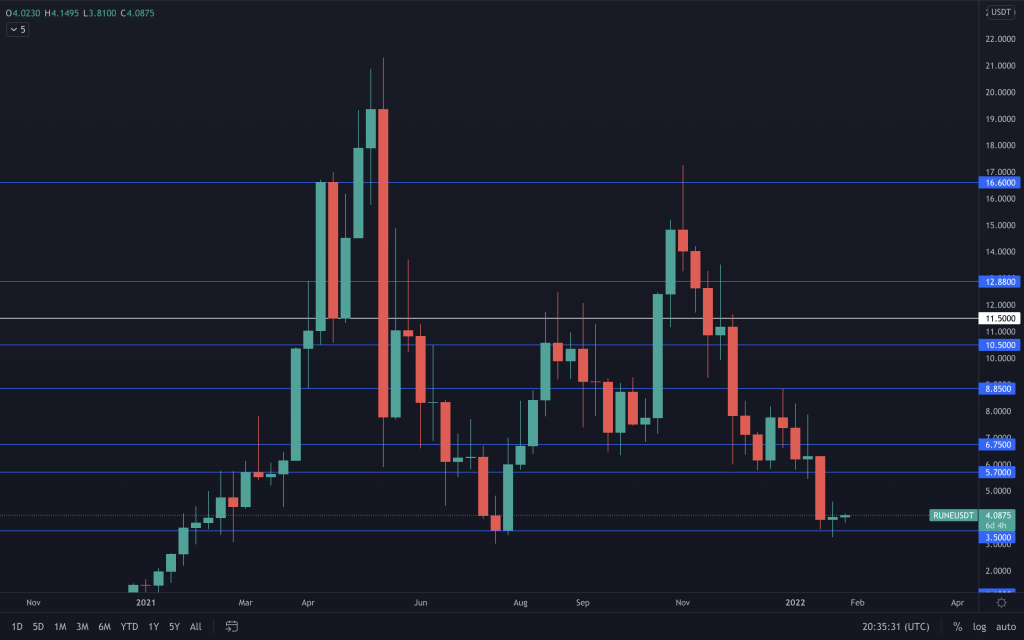
Since seeing the drop from $5.70 to $3.50 the week previous, RUNE has maintained $3.50 as support. Although an indecisive candle (Doji) doesn't indicate RUNE's next move, maintaining $3.50 is key for seeing any upside movement in the price. We can see that it's moved sideways and has $4.40 as resistance on the daily timeframe. So we'll be monitoring RUNE daily to indicate its next move.
SOL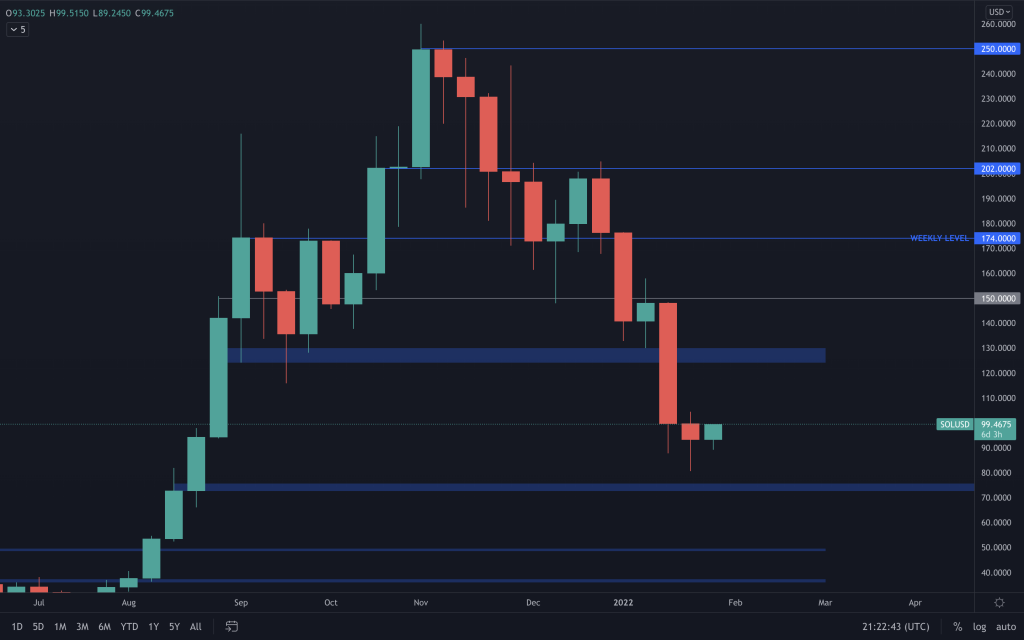
The past week has seen SOL fighting daily resistance around the $100 psychological level. From a weekly perspective, it's still midway between two key levels ($75 & $125)with a bearish structure. Of course, reclaiming $150 would change that structure at this moment in time.
SRM
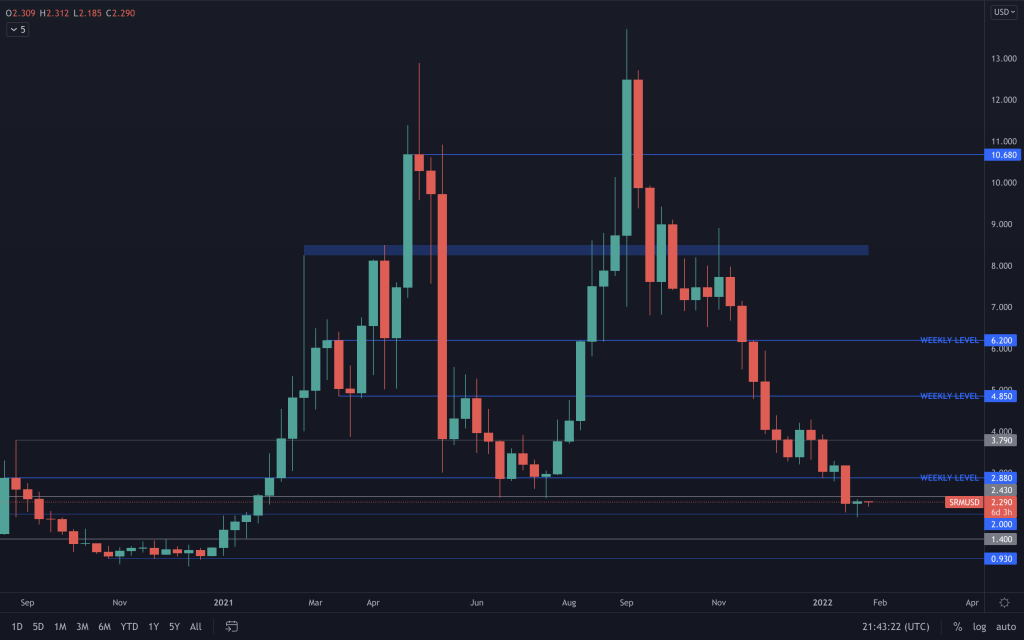
SRM has managed to maintain $2 as support, but our interest would lie in it being able to reclaim $2.88 on the weekly timeframe as the odds of upside from that level would be greater than where its price is currently.
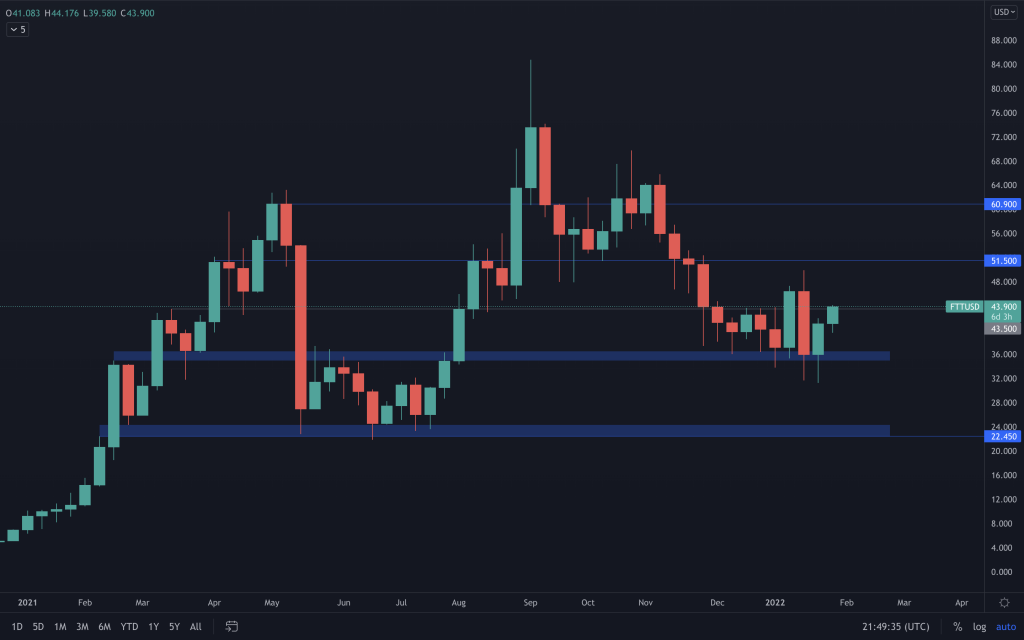
FTT
 .
.
FTT is very much doing its own thing as it continues to range between $35 and $50.
MINA
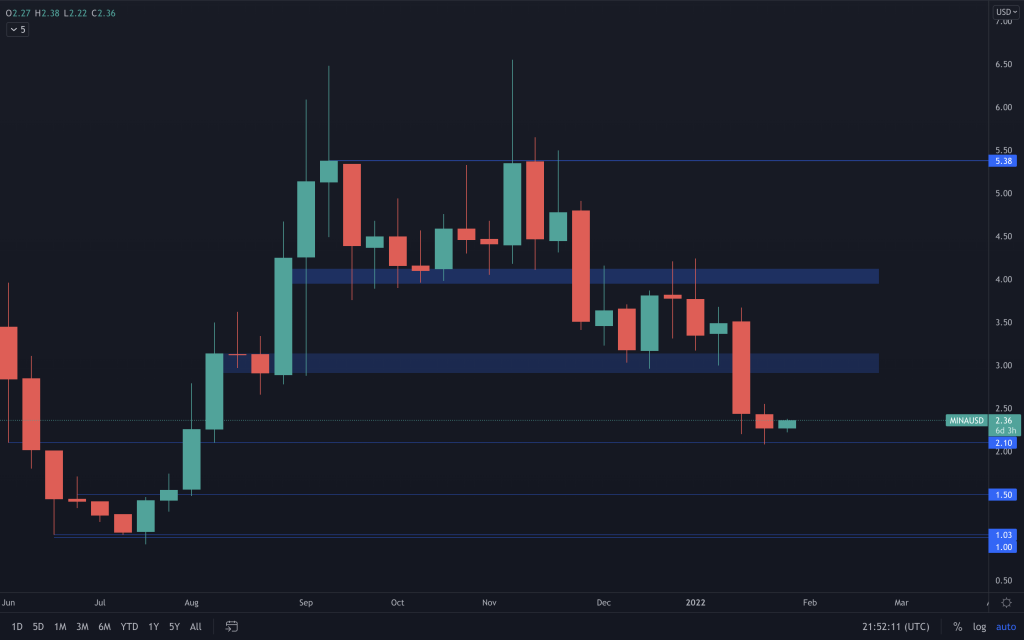
The delay of Snapps until Q2/Q3 left MINA vulnerable to a downside move. That move materialised, and we saw it immediately head for $2, now putting it in the $2 to $3 range. With MINA/BTC also being at support, it would be reasonable to expect a move towards the top of the range. Of course, this is reliant on BTC's volatility being reasonably low.
dYdX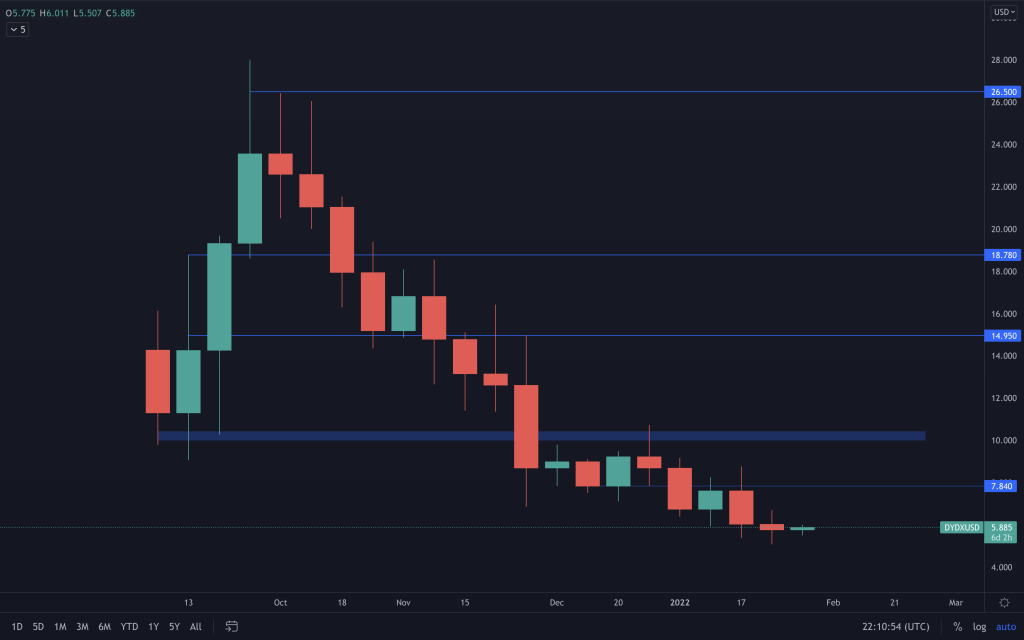
The weekly chart confirms what we write on our daily analysis. The price is still declining, albeit not at such an accelerated pace. We're still anticipating a bottom between $3 and $5.
Disclaimer: Not financial nor investment advice. Only you are responsible for any capital-related decisions you make, and only you are accountable for the results.
Recommended from Cryptonary


