Save 23% ($351) & Get a Free 1-1 Call with our Team ⏰ : 0d 2h 59m 44s
Weekly Technicals Pro - Volume 95
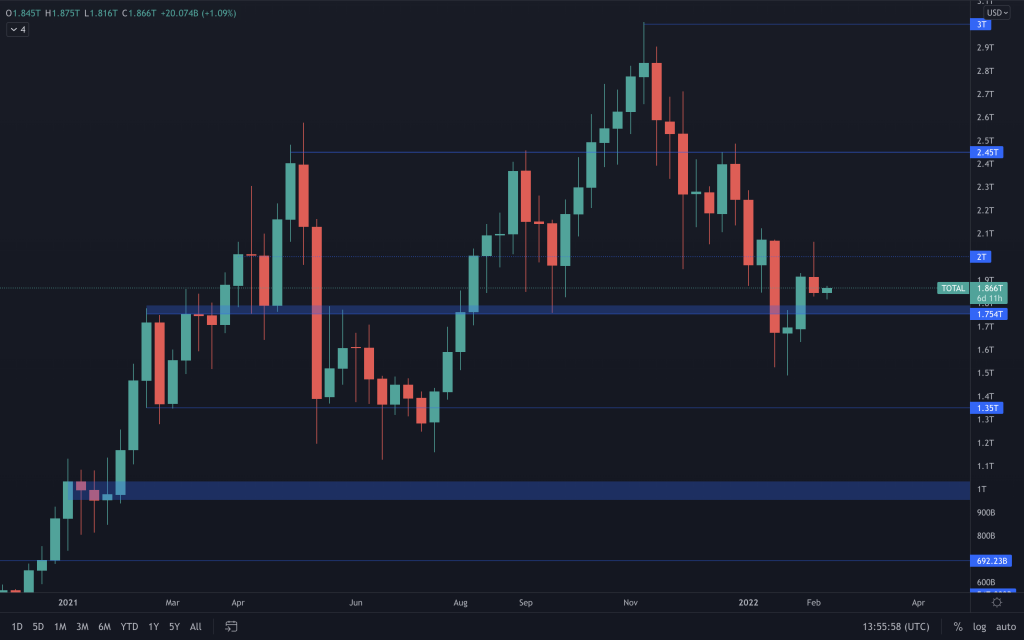
The Total Market Cap remains between $1.75T and $2T. It's quite easy to see that the structure remains bearish, as it consists of lower-lows and lower-highs. But the interesting development was the relatively quick return of $1.75T back into support. Whilst this remains the case, we are on the lookout for signs of the market reversing (forming a higher-low (likely around support) or for the index to trade above the previous lower-high ($2.12T)). Should this not occur, and we see $1.75T lost as support, we would be looking at the Total Market Cap continuing down towards $1.35T.

Disclaimer: Not financial nor investment advice. Only you are responsible for any capital-related decisions you make, and only you are accountable for the results.
Market Indexes
Total Market Cap
Altcoins' Market Cap
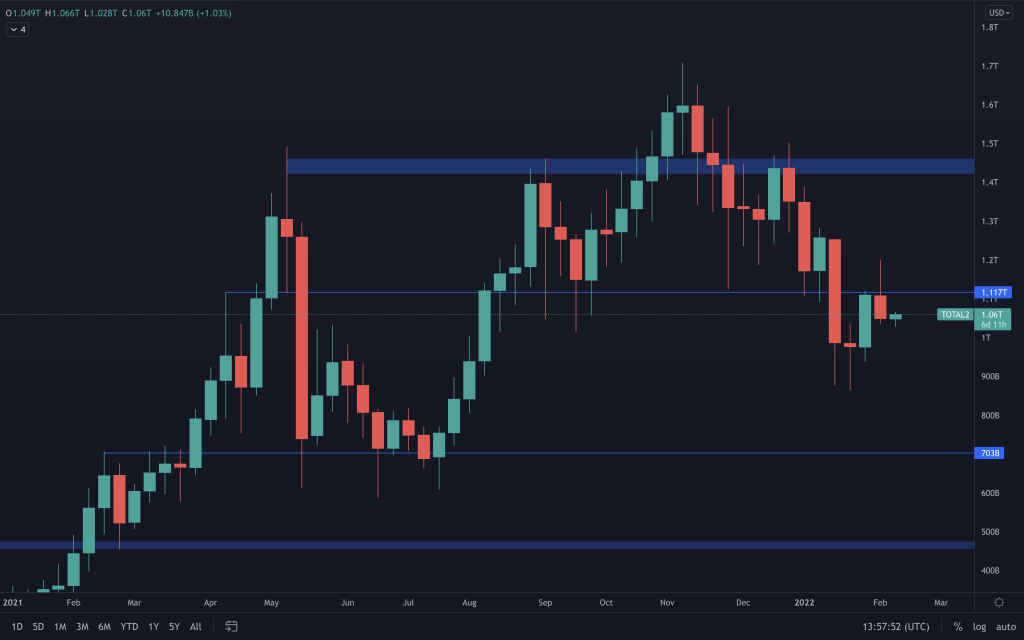
In contrast to the Total Market Cap, the Altcoins' Market Cap paints a different picture. As Bitcoin saw some volatility but closed relatively close to its opening price, we saw altcoins struggle to hold their ground, which can often be the case. The weekly candle failed to reclaim $1.117T, which keeps it within the $703b - $1.117T range.
Bitcoin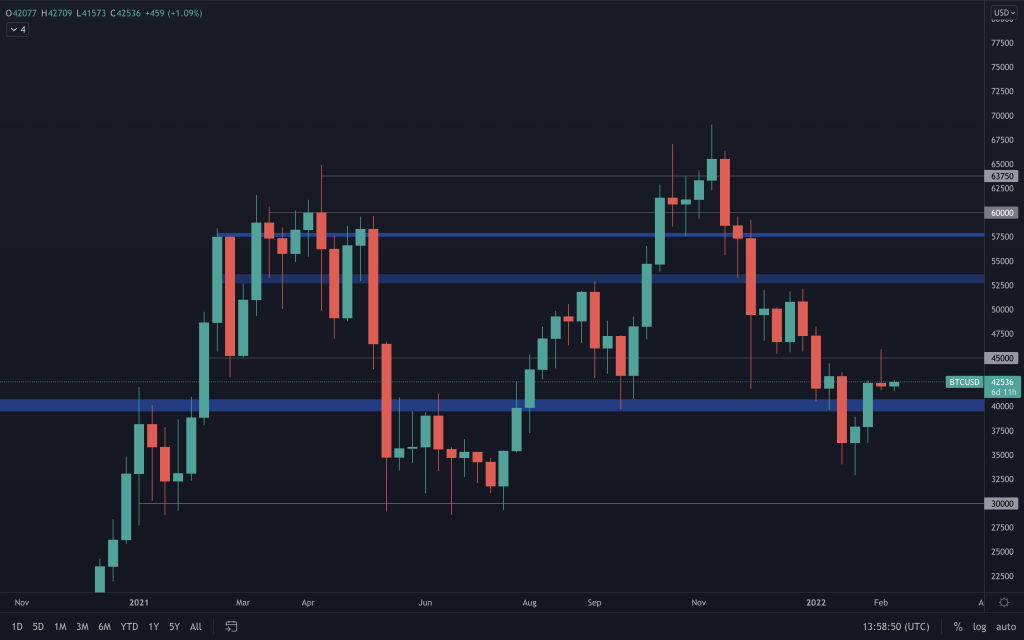
The weekly candle did close slightly bearish, but Bitcoin remains above the all-important $39,500-$40,500 pivotal level. We've also seen the creation of a new high, which could offer hints of a market structure change and a reversal to the upside. With the price being at/near a key level, we're looking out for signs of strength by the bulls. By this, we mean a closure above $45,000 or creating a higher-low around support. We should expect further downside if BTC closes below $39,500.
Ether
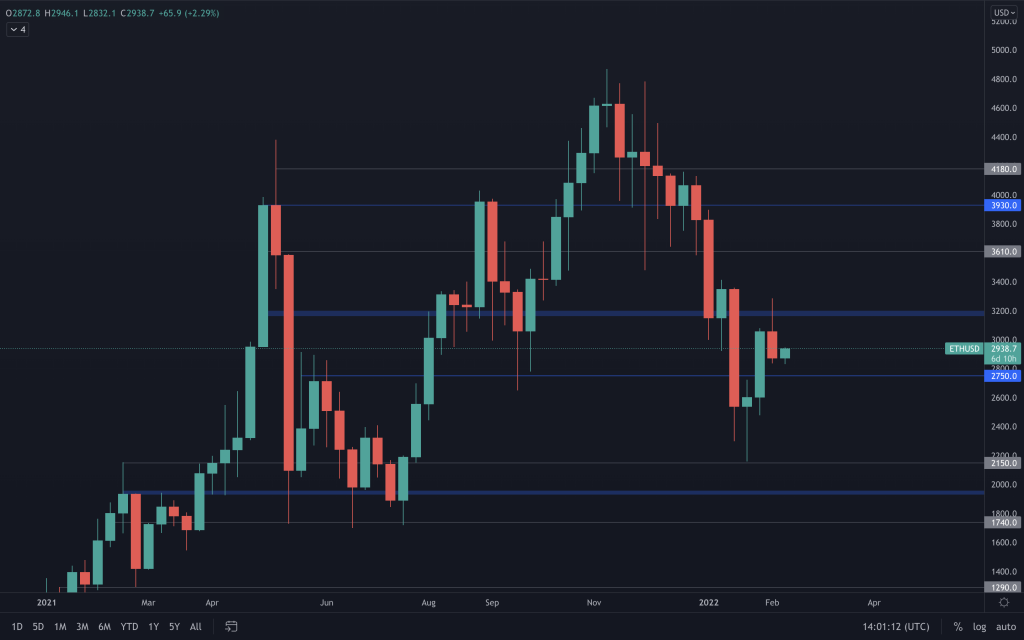
Once again, Ether closed inside the $2,750-$3,200 range and has now created a lower-high, keeping the bearish structure intact. We await to see which way Ether breaks out of this range. A breakout to the downside would bring $2,000 back into play. Alternatively, a break above would alter the structure and should result in some relief, at least, towards $4,000.
DOT
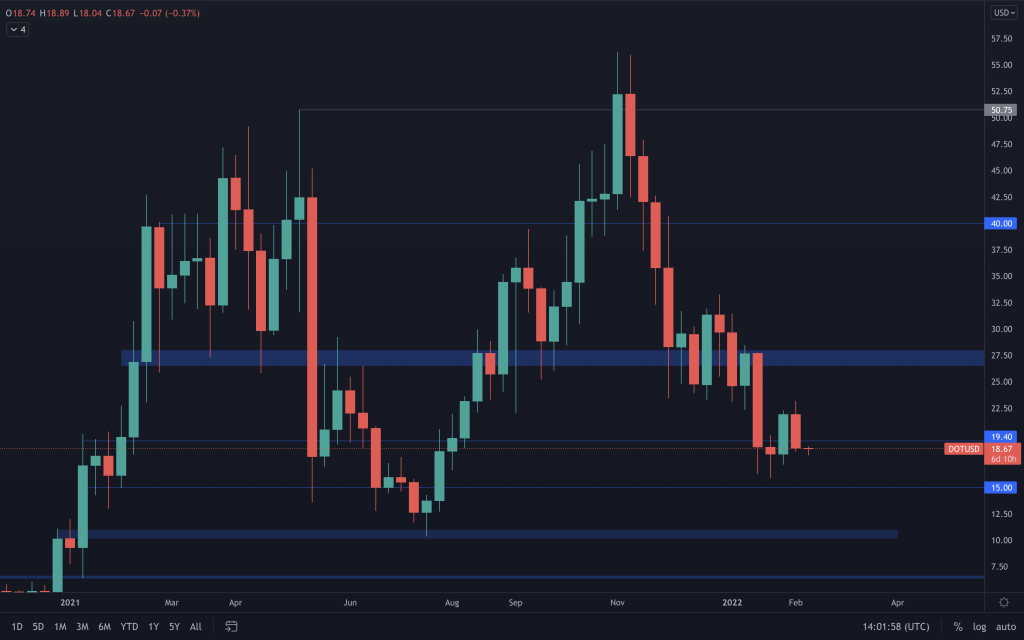
The bullish breakout of the previous week was invalidated, and DOT has closed the week below $19.40, putting it back in the $15-$19.40 range. It's also created a new lower-high around $23, keeping the bearish structure intact for now.
SNX
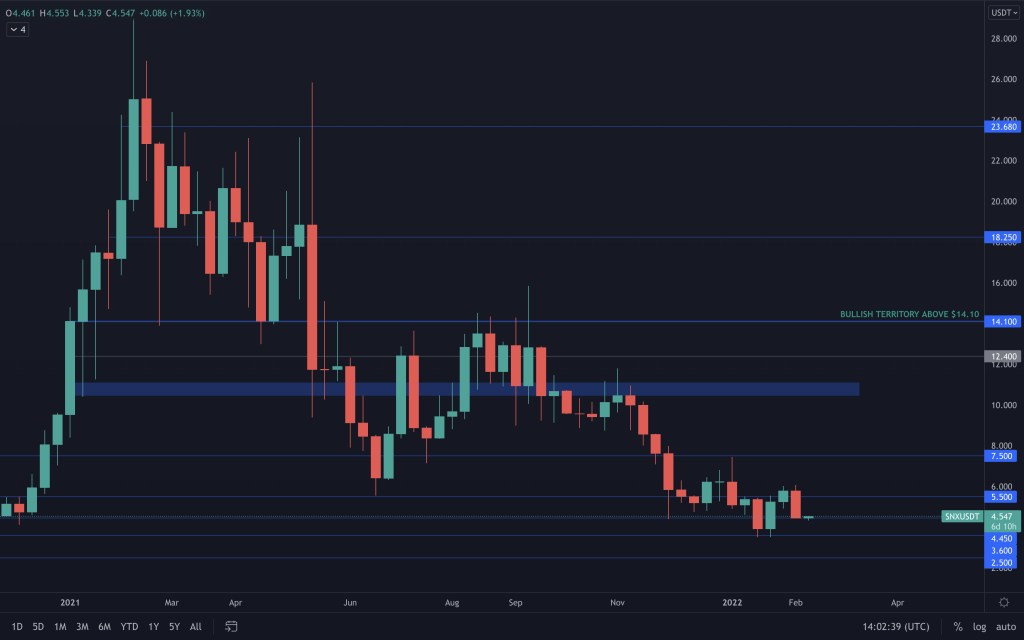
SNX has managed to break the market structure, but last week's candle was a bearish engulfing candle that left no wick to the downside. The candle did manage to close $0.01 above support at $4.45. This kind of candle often sees the price push down further at some point. SNX has seen the start of a change in structure (HH), so it does have a chance to alter its momentum should it create a higher-low.
RUNE
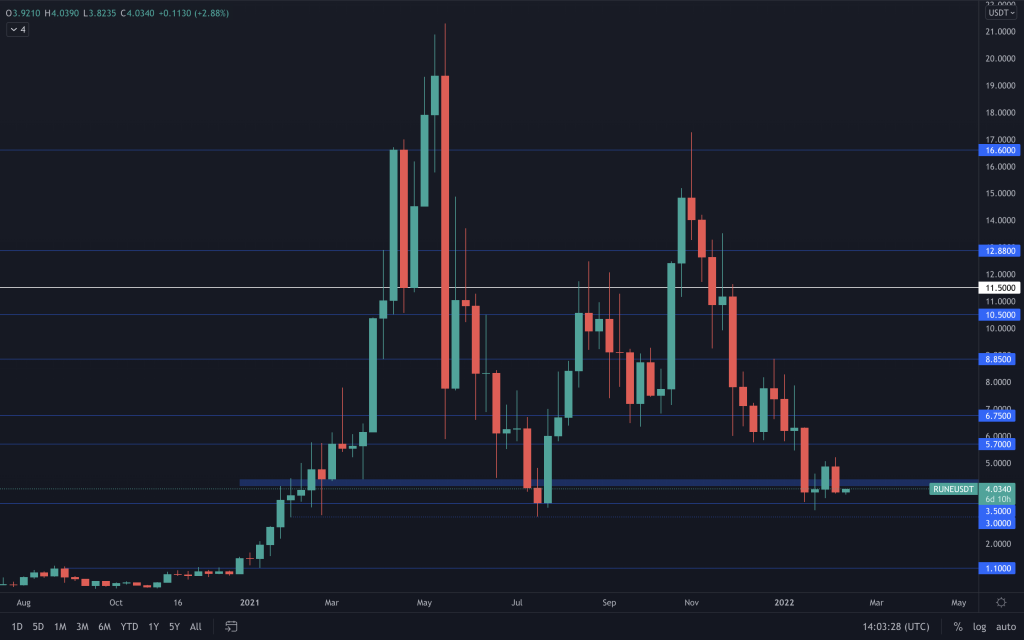
Another closure below $4.15 and last week's bearish candle also created another lower-high, in keeping with the Altcoins' Market Cap chart. We may yet see RUNE revisit the $3 liquidity area. To offer signs of a recovery, RUNE has to reclaim $5.70.
SOL
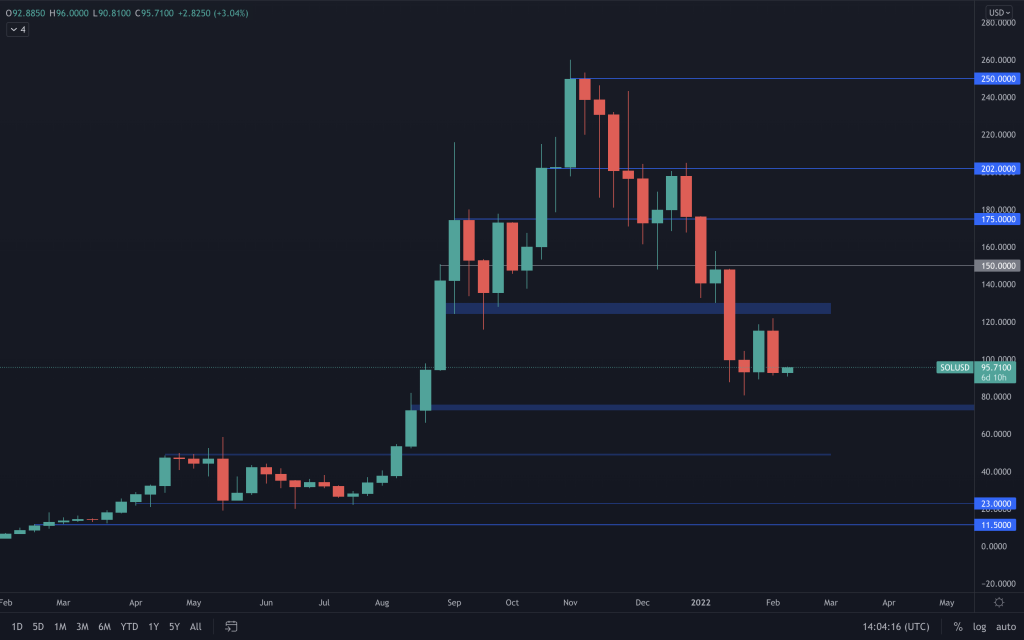
Apologies if it sounds repetitive. SOL has also created a lower-high. For SOL to begin to look bullish, it would have to reclaim $125. This is a change from $150 the previous week due to the creation of a lower-high. But, for now, it remains in the $75-$125 range.
SRM
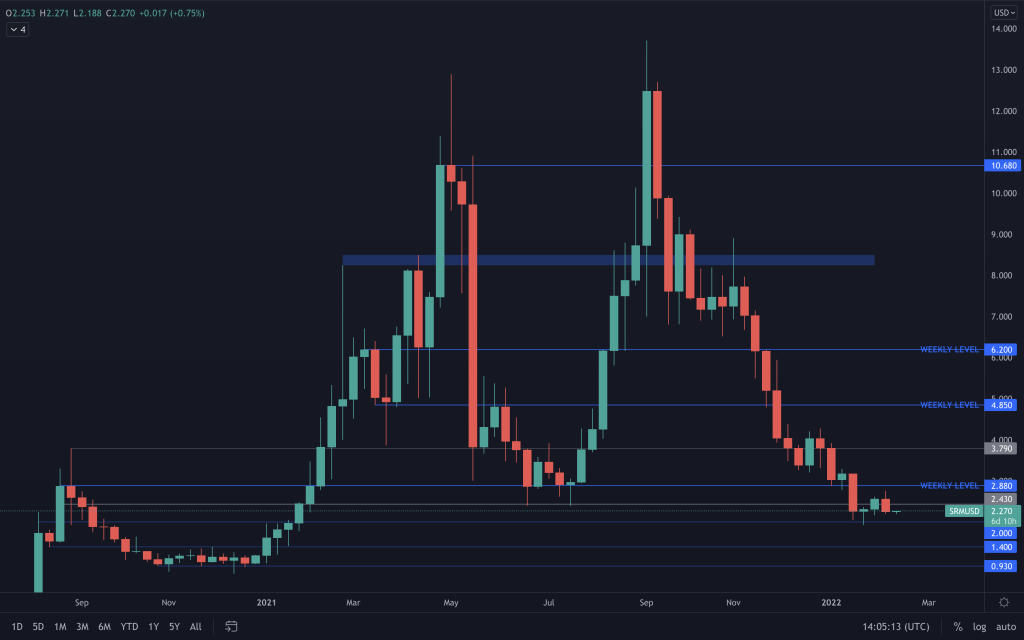
SRM also registered a lower-high, and we are still waiting for a reclaim of $3 for SRM to offer a higher chance of appreciation.
FTT
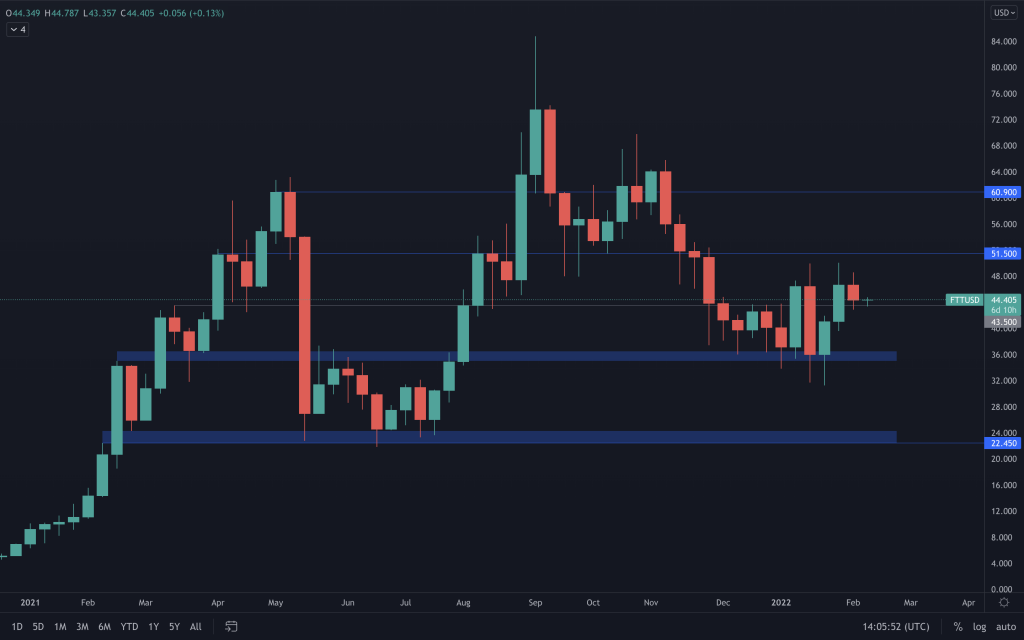
Still, no breakout for FTT as it closed last week with a neutral candle, and it simply remains in the $35-$50 range.
MINA
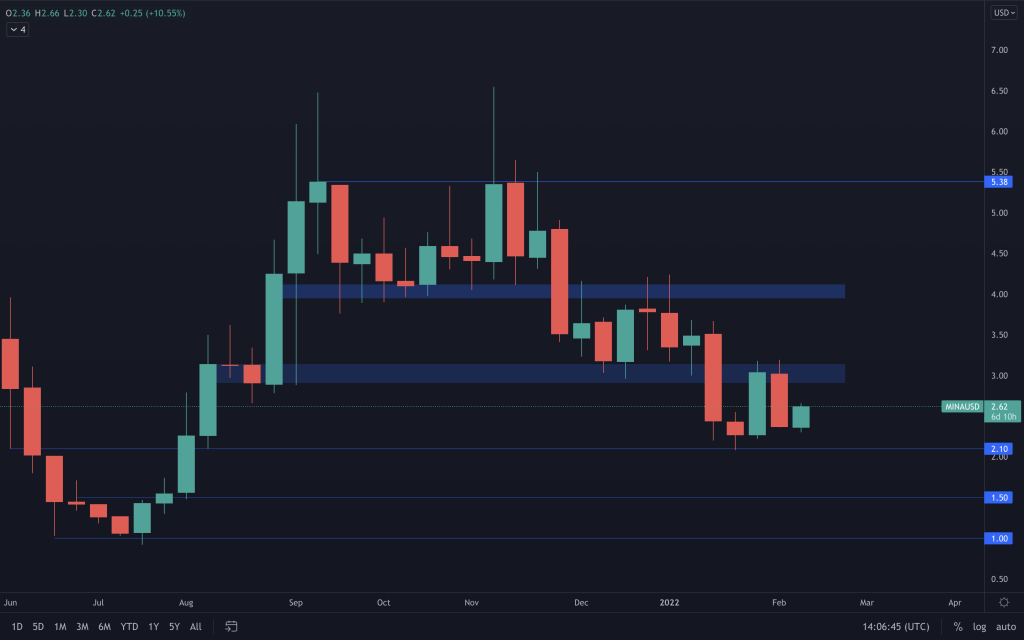
MINA could not reclaim the $3 level given the bullish end it saw the week previous. It still shows an overall bearish structure and remains within the $2.10-£3.14 range.
dYdX
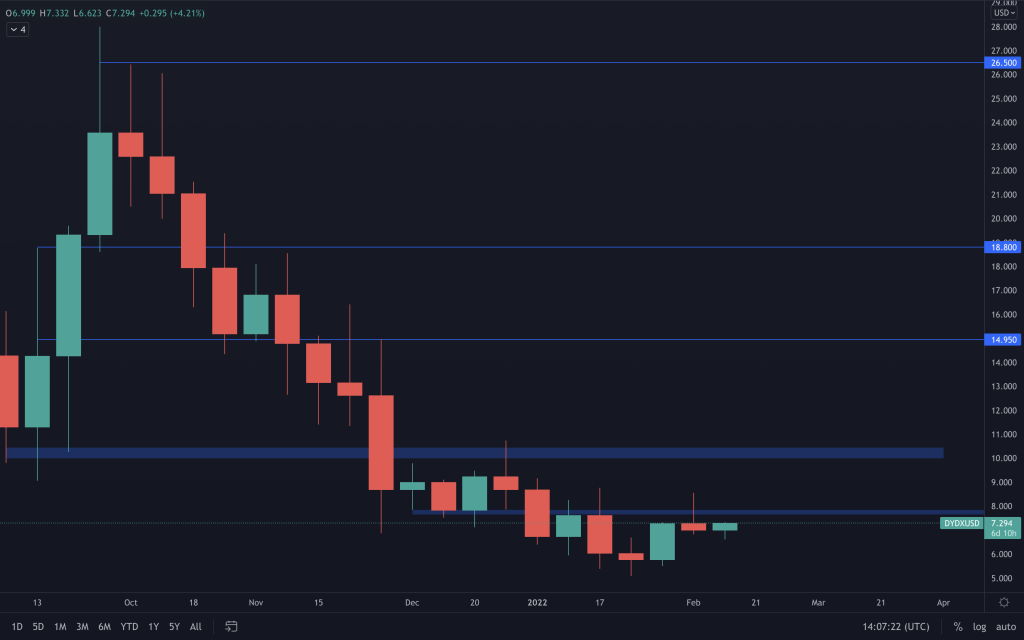
Although dYdX has been a relatively good performer over the past two weeks, it couldn't hold onto to close the week above $7.85 to offer it a chance for a run at $10. It's still in a downtrend, though, so overall, nothing has changed.
Recommended from Cryptonary


