Save 23% ($351) & Get a Free 1-1 Call with our Team ⏰ : 0d 2h 59m 44s
Ether has taken the spotlight this week with an outstanding rally on both price and options open-interest which reached all-time highs.
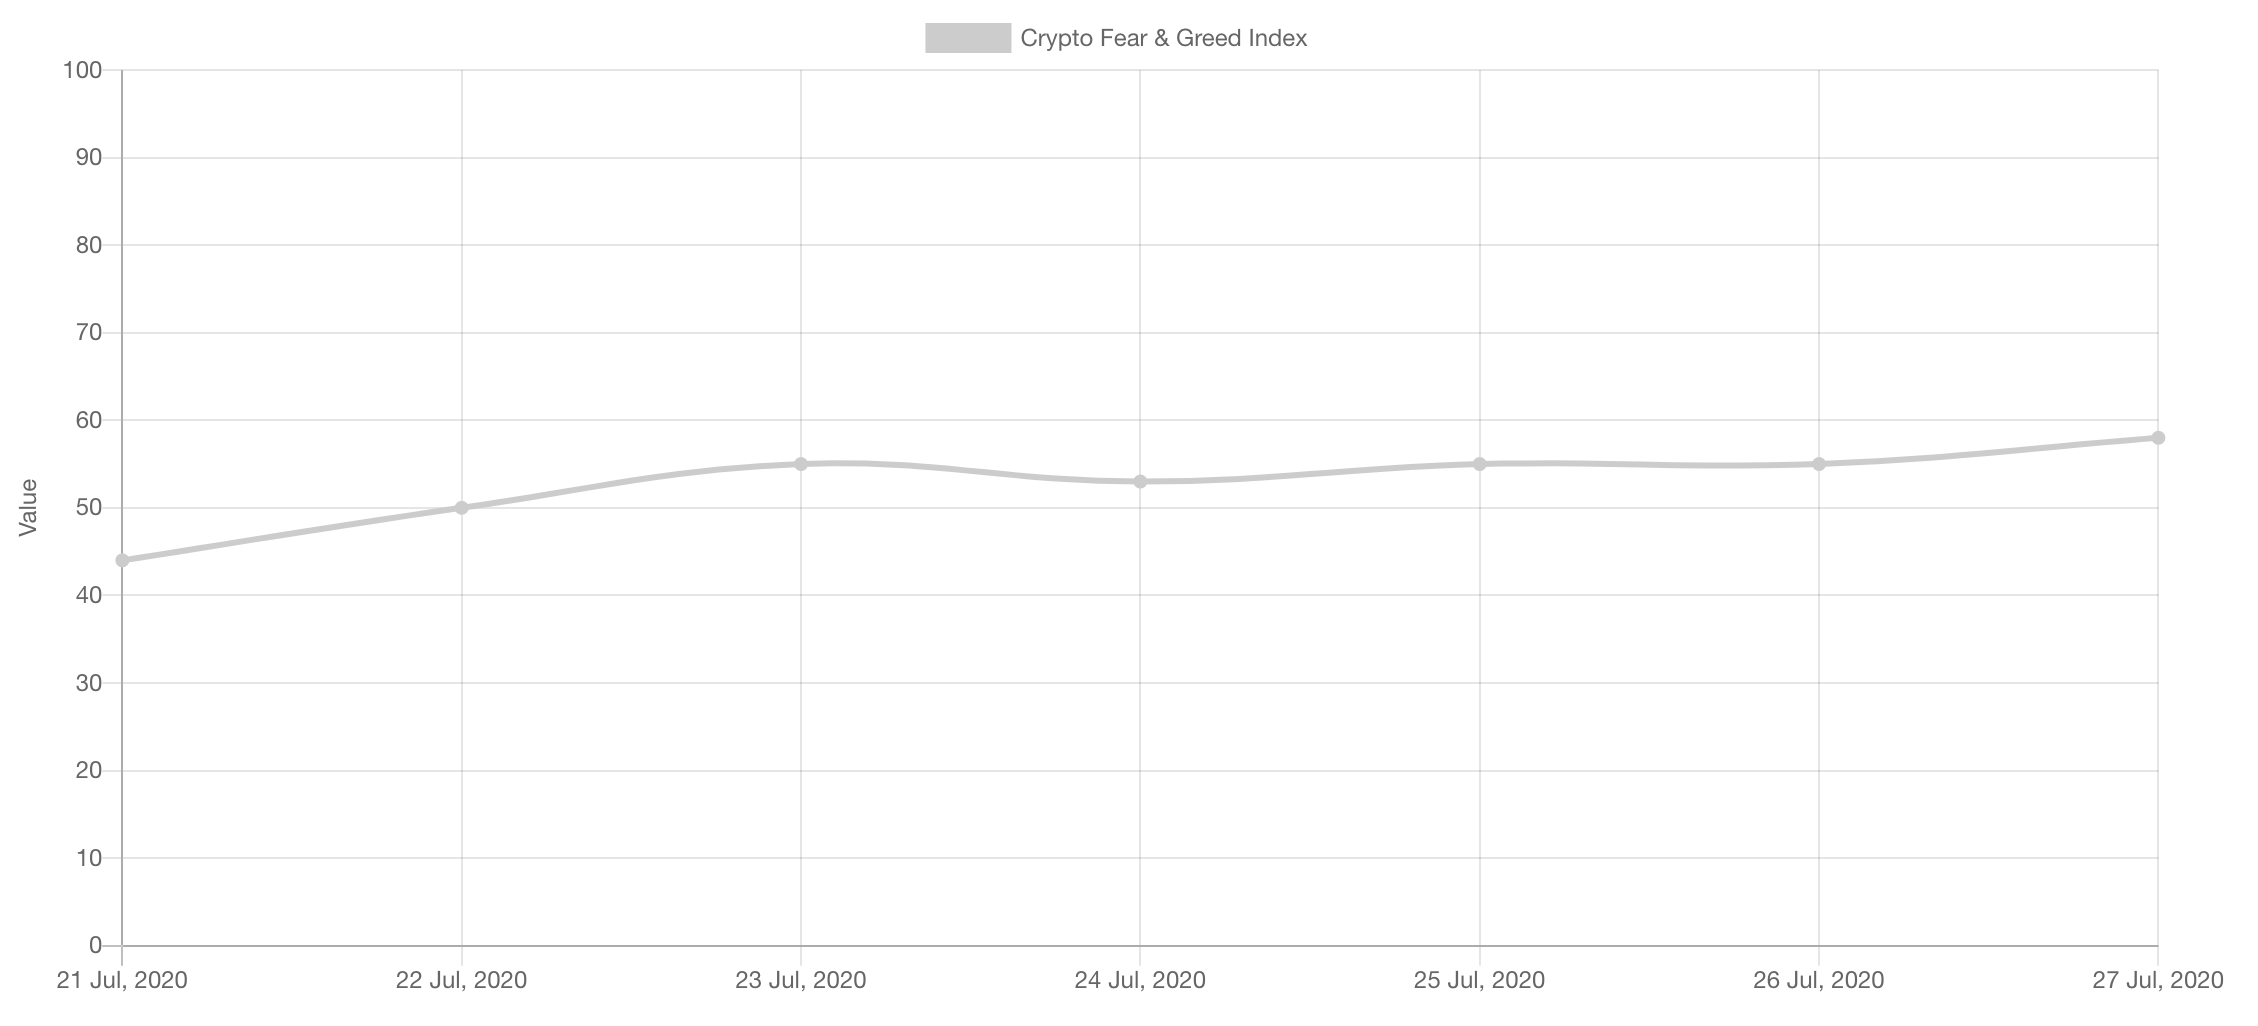
Market Sentiment
After weeks of stagnation, the market begun moving once again and that led investors/traders to start turning into a greedy sentiment as can be seen by the graph below. Those who use such metrics, tend to start being careful with longs and start protecting profits when this happens.
Volume & Open Interest
The most important breakout has been that of volumes as they reached very low lows. However, as explained last week in “Weekly Technicals 14” volume has reached a point of stagnation which is usually followed by a breakout as we have seen here.
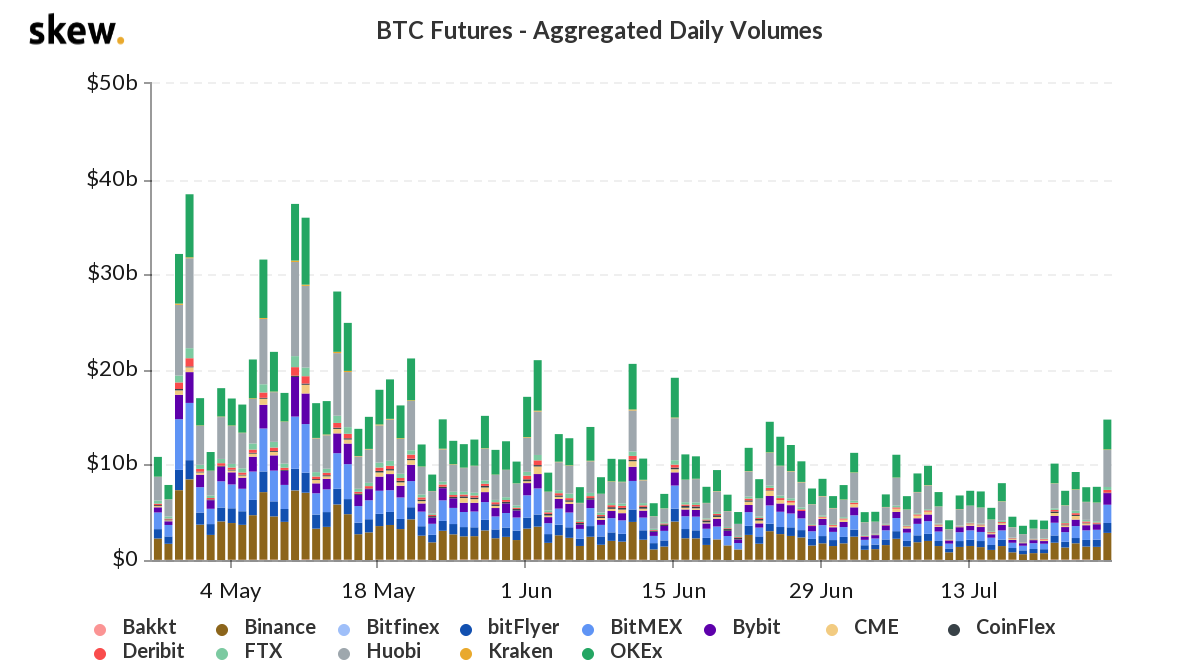
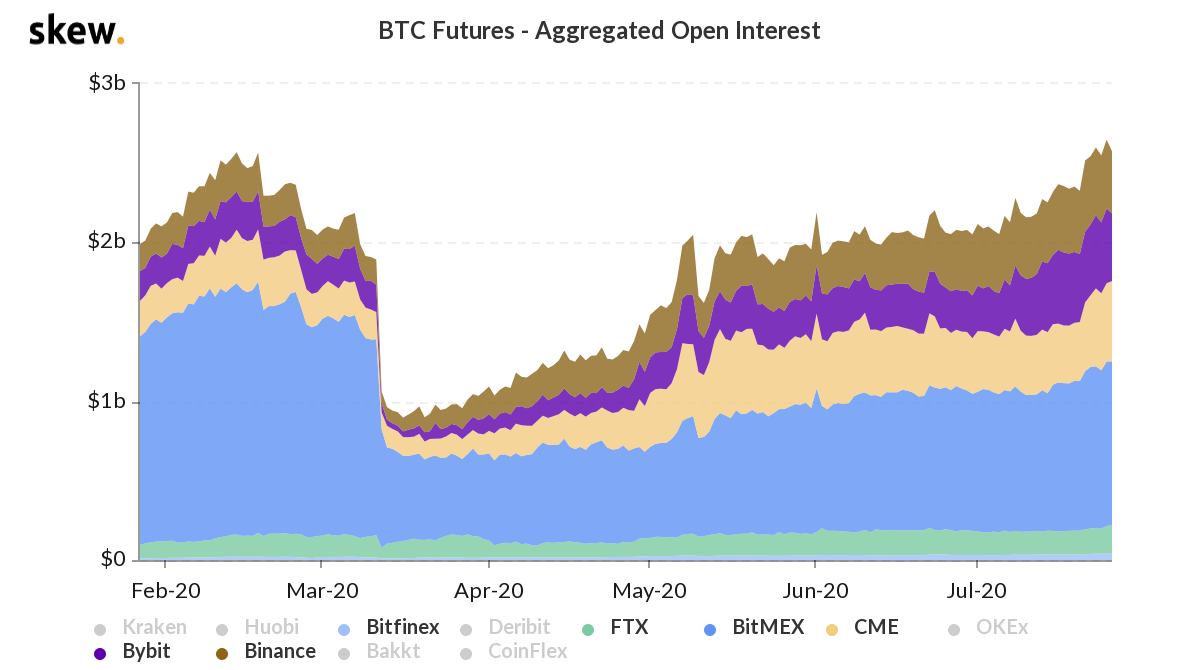
Of course, the futures’ open interest followed suit and had a more accelerated run as volume broke out.
Market Indices
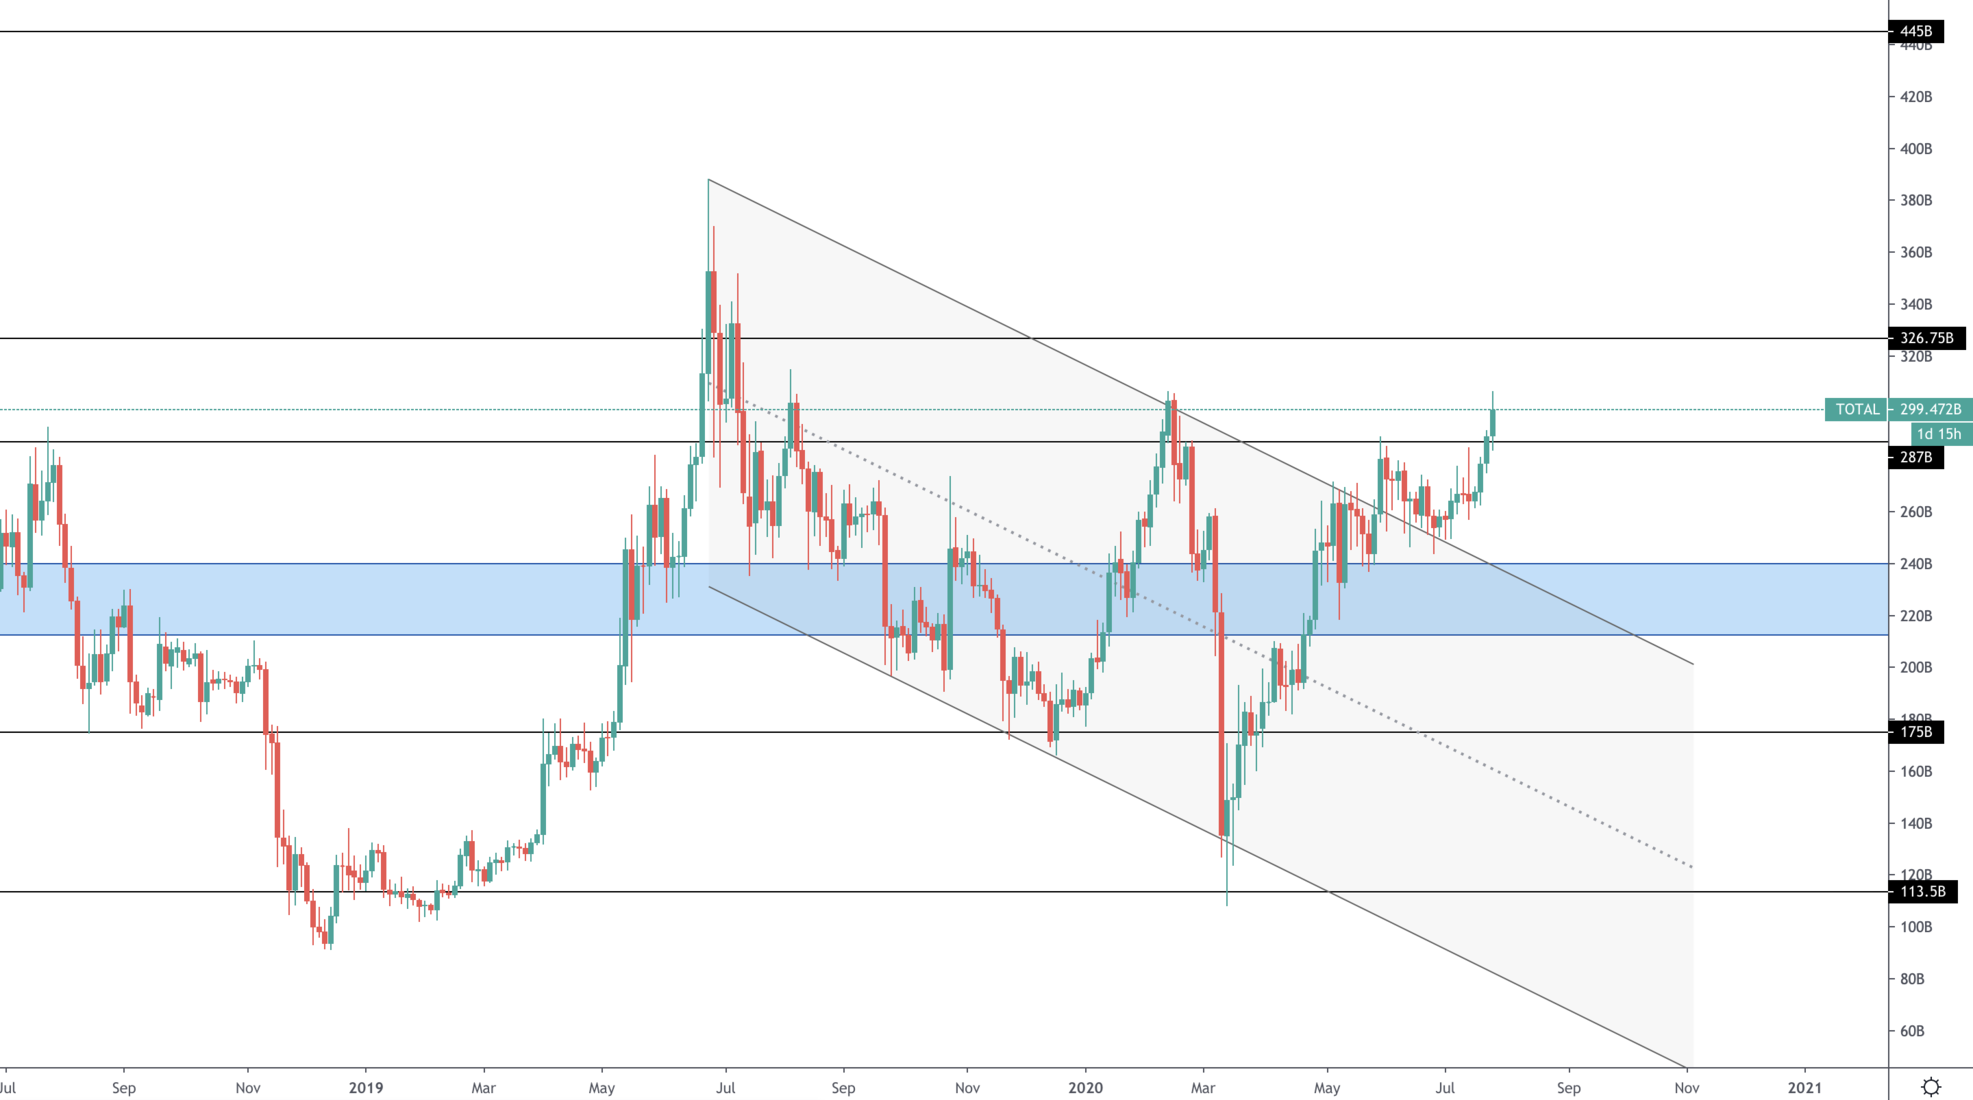
Total Market Cap
Last week, price had broken out of the year-long descending channel and remained there for a period of retests. Since then, it has seen an extraordinary rise and crossed the $287B key level which will not be considered future support. The next key level is annotated on the chart ($326.75B).
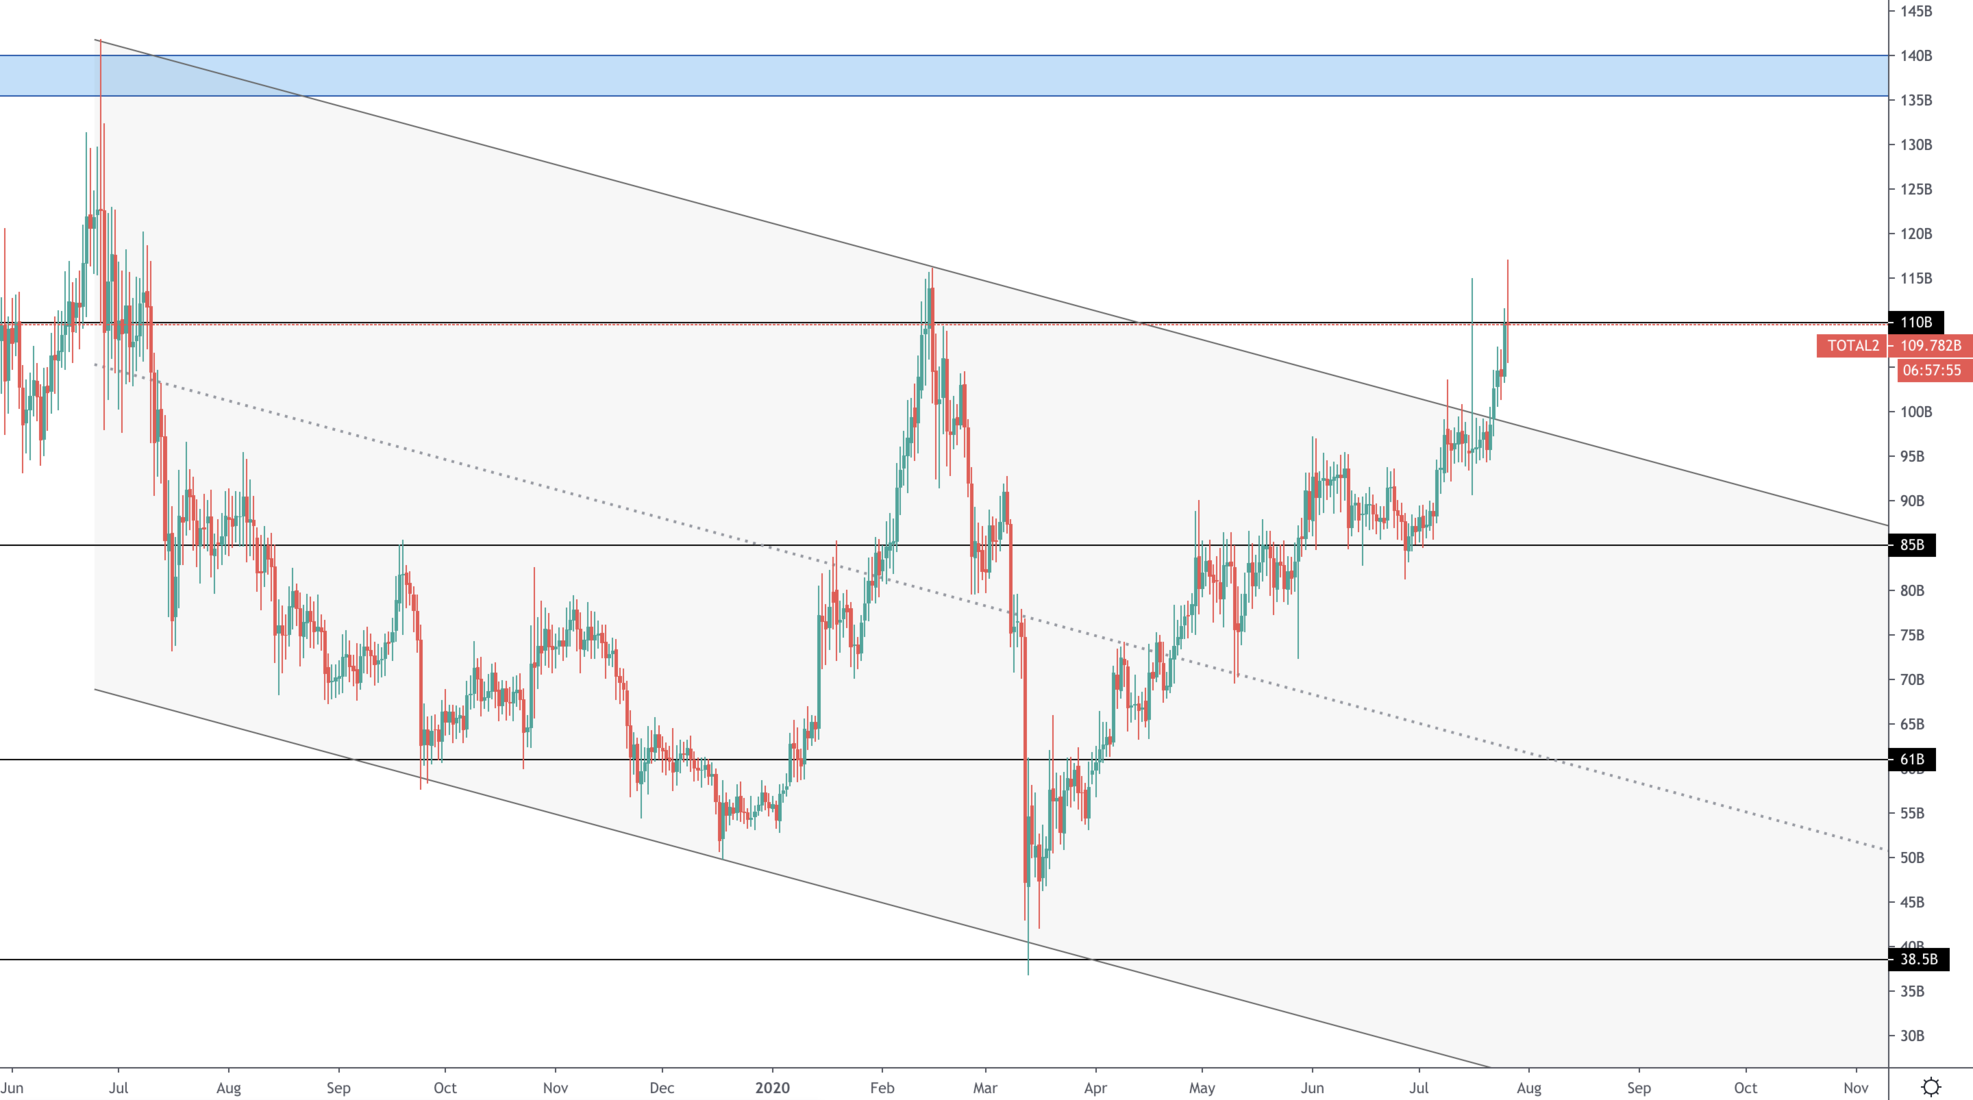
Altcoins’ Market Cap
The Alts MCap also broke out of the descending channel which was mainly pulled by ETH. Currently, price is at resistance, if crossed the next level would become [$135B-$140B]. If the latter is crossed, the cryptocurrency market (Alts in this case) will enter a very interesting period where we expect lots of growth.
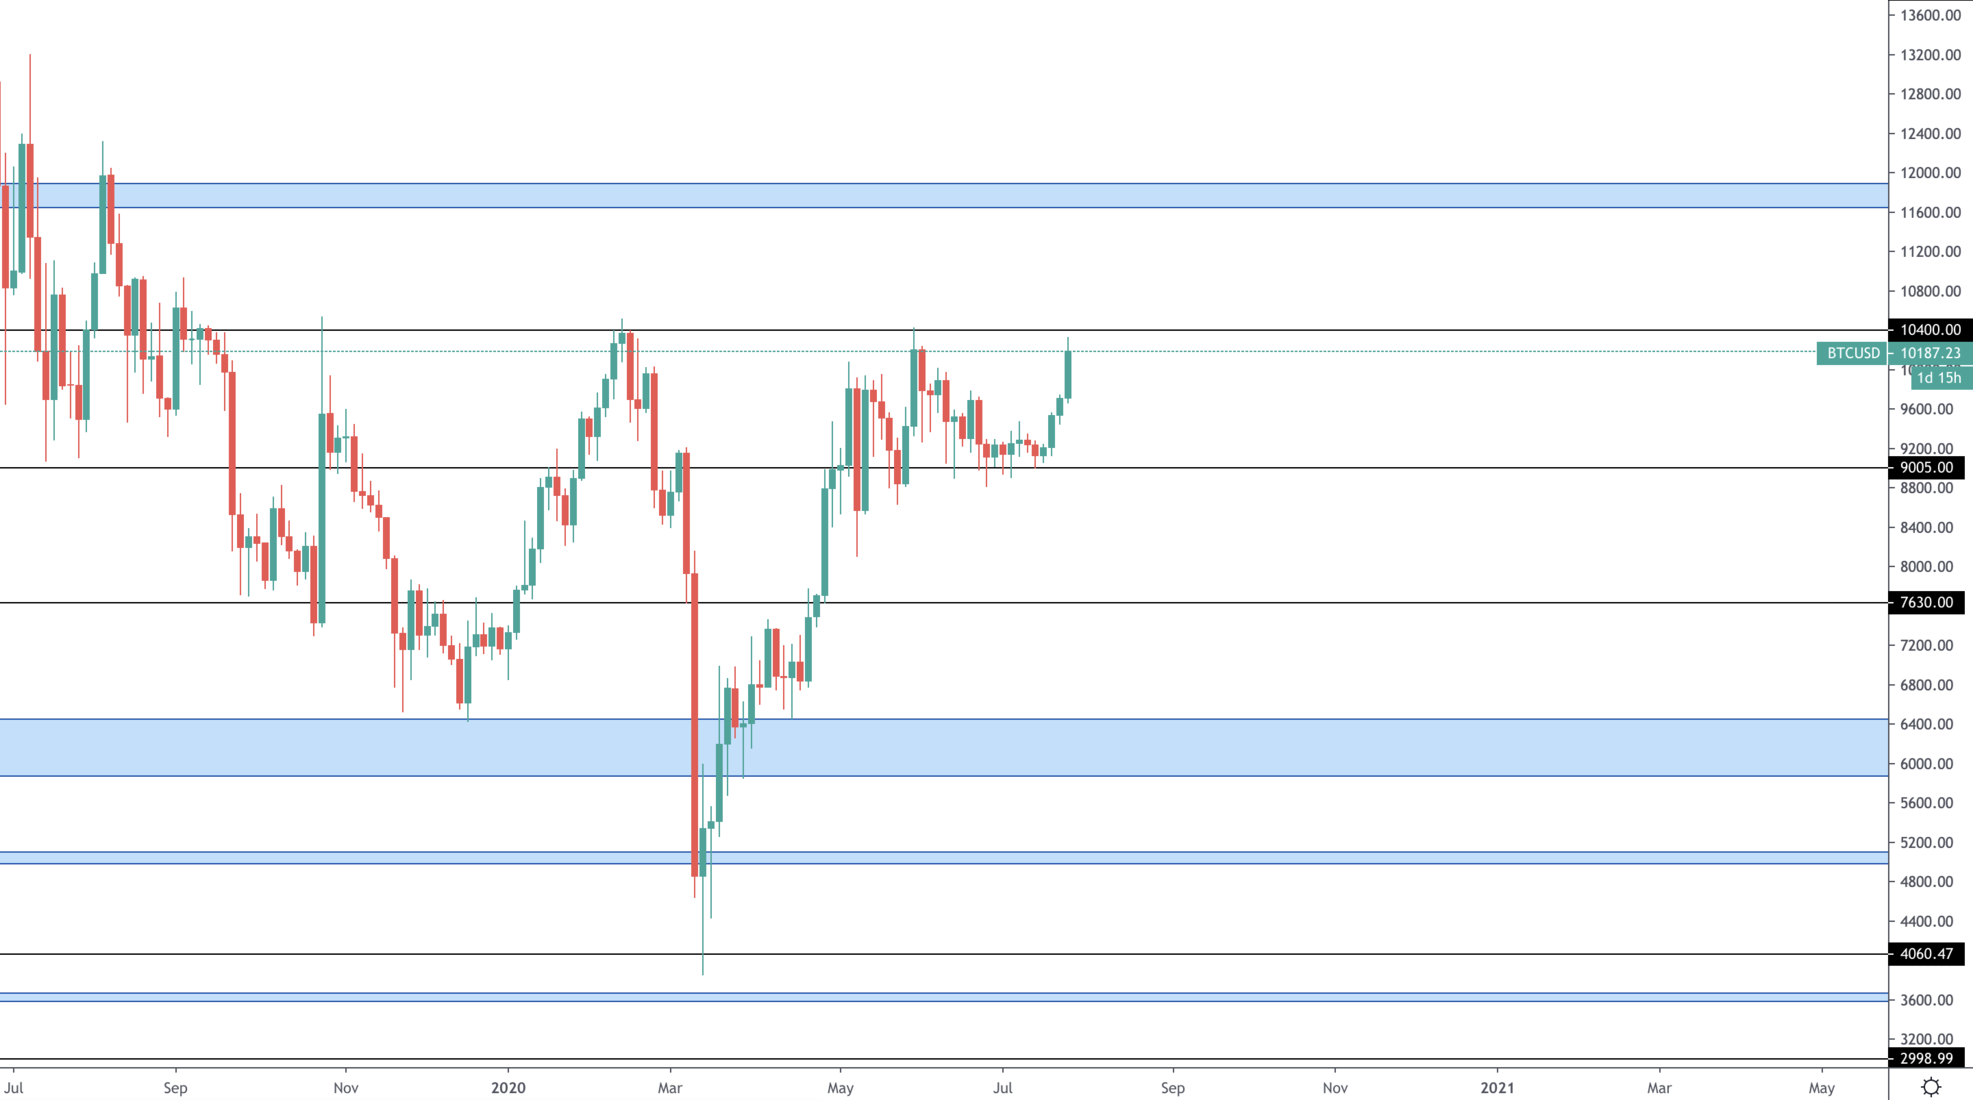
Bitcoin
Bitcoin bounced from support and now into resistance. Only of $10,400 is taken over by bulls could price have a chance at visiting mid-$11,000.
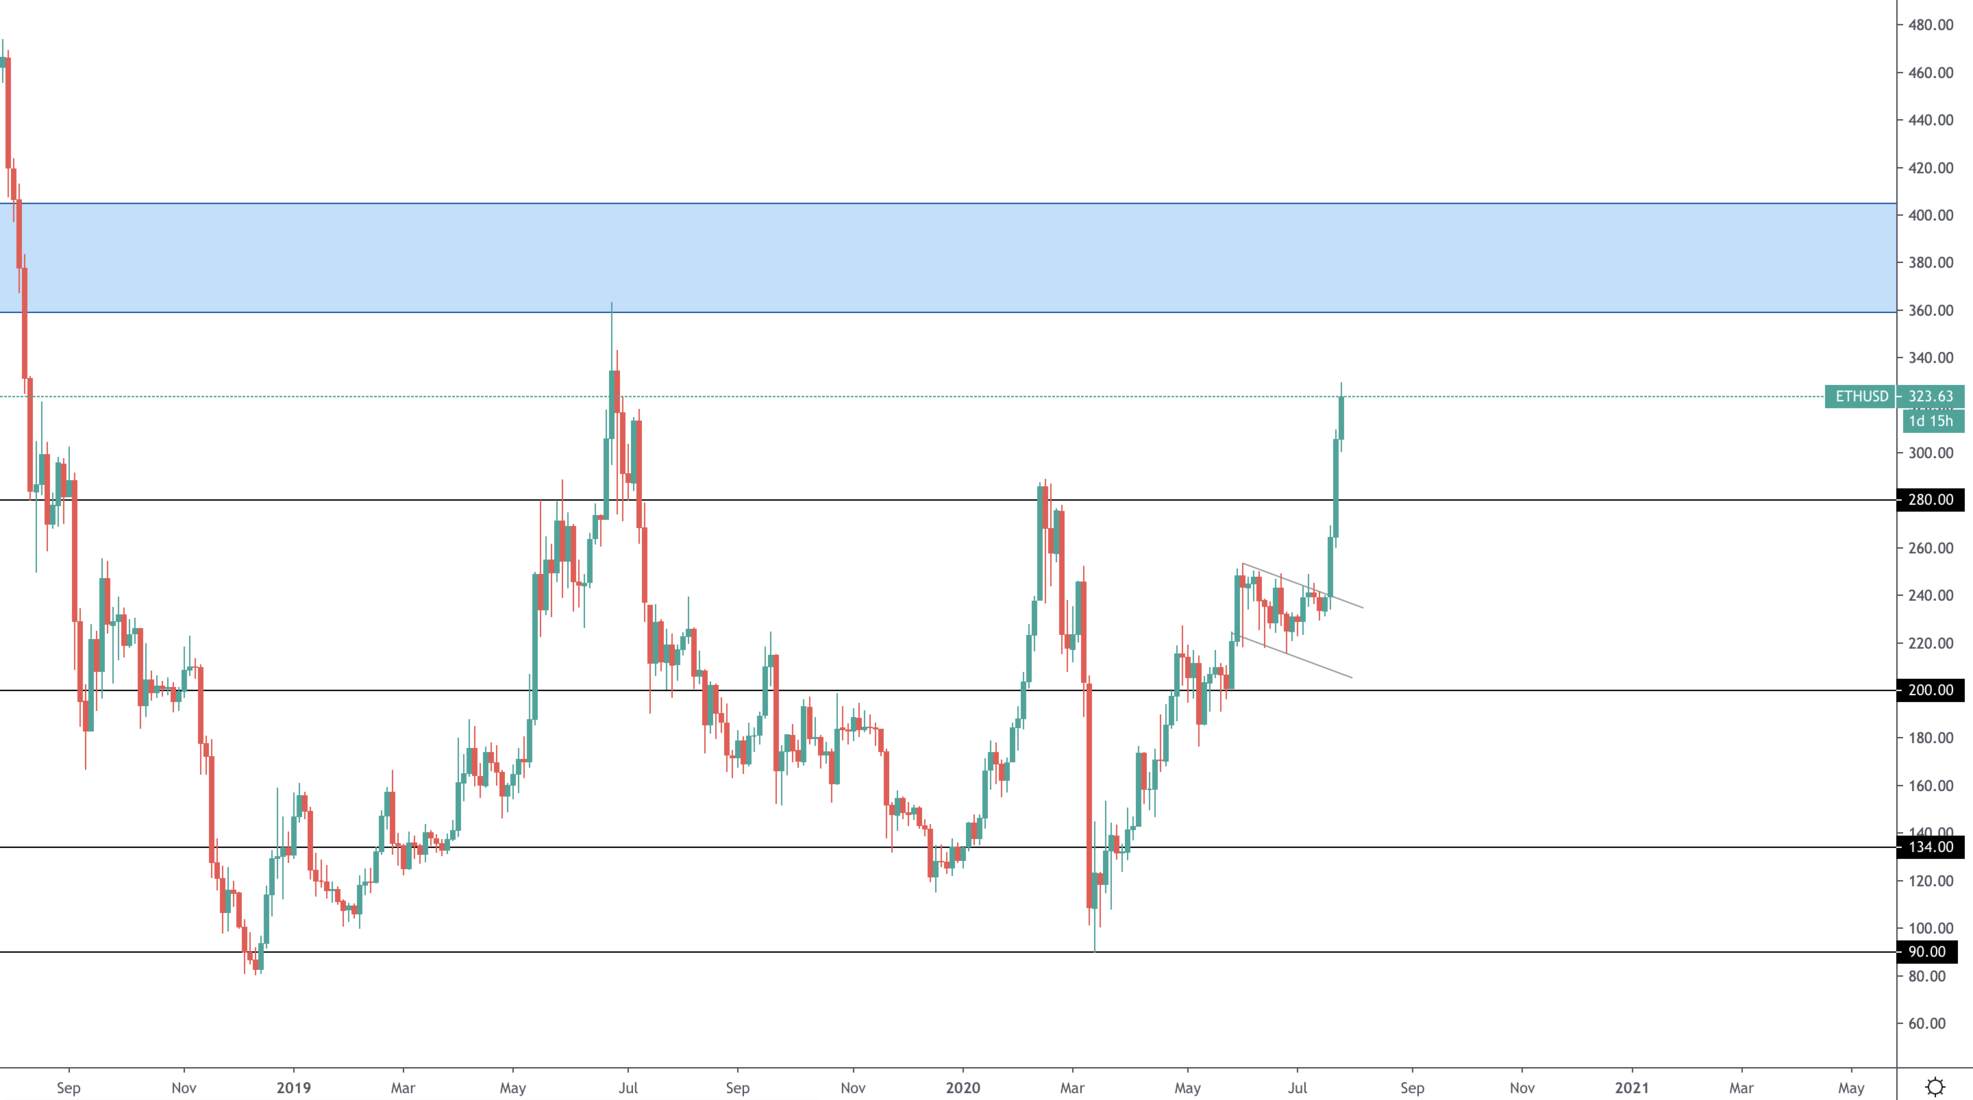
Ether
Now we come to the most interesting asset for the past few days. ETH had broken out of both the descending channel AND a bull flag which sent its price soaring to our $280 target. As it is now beyond that too, the next level is the [$360-$405] liquidity area which crushed price in mid-2019. Cross that and perhaps ETH will have a chance to soar to $800+.
Recommended from Cryptonary


