Save 23% ($351) & Get a Free 1-1 Call with our Team ⏰ : 0d 2h 59m 44s
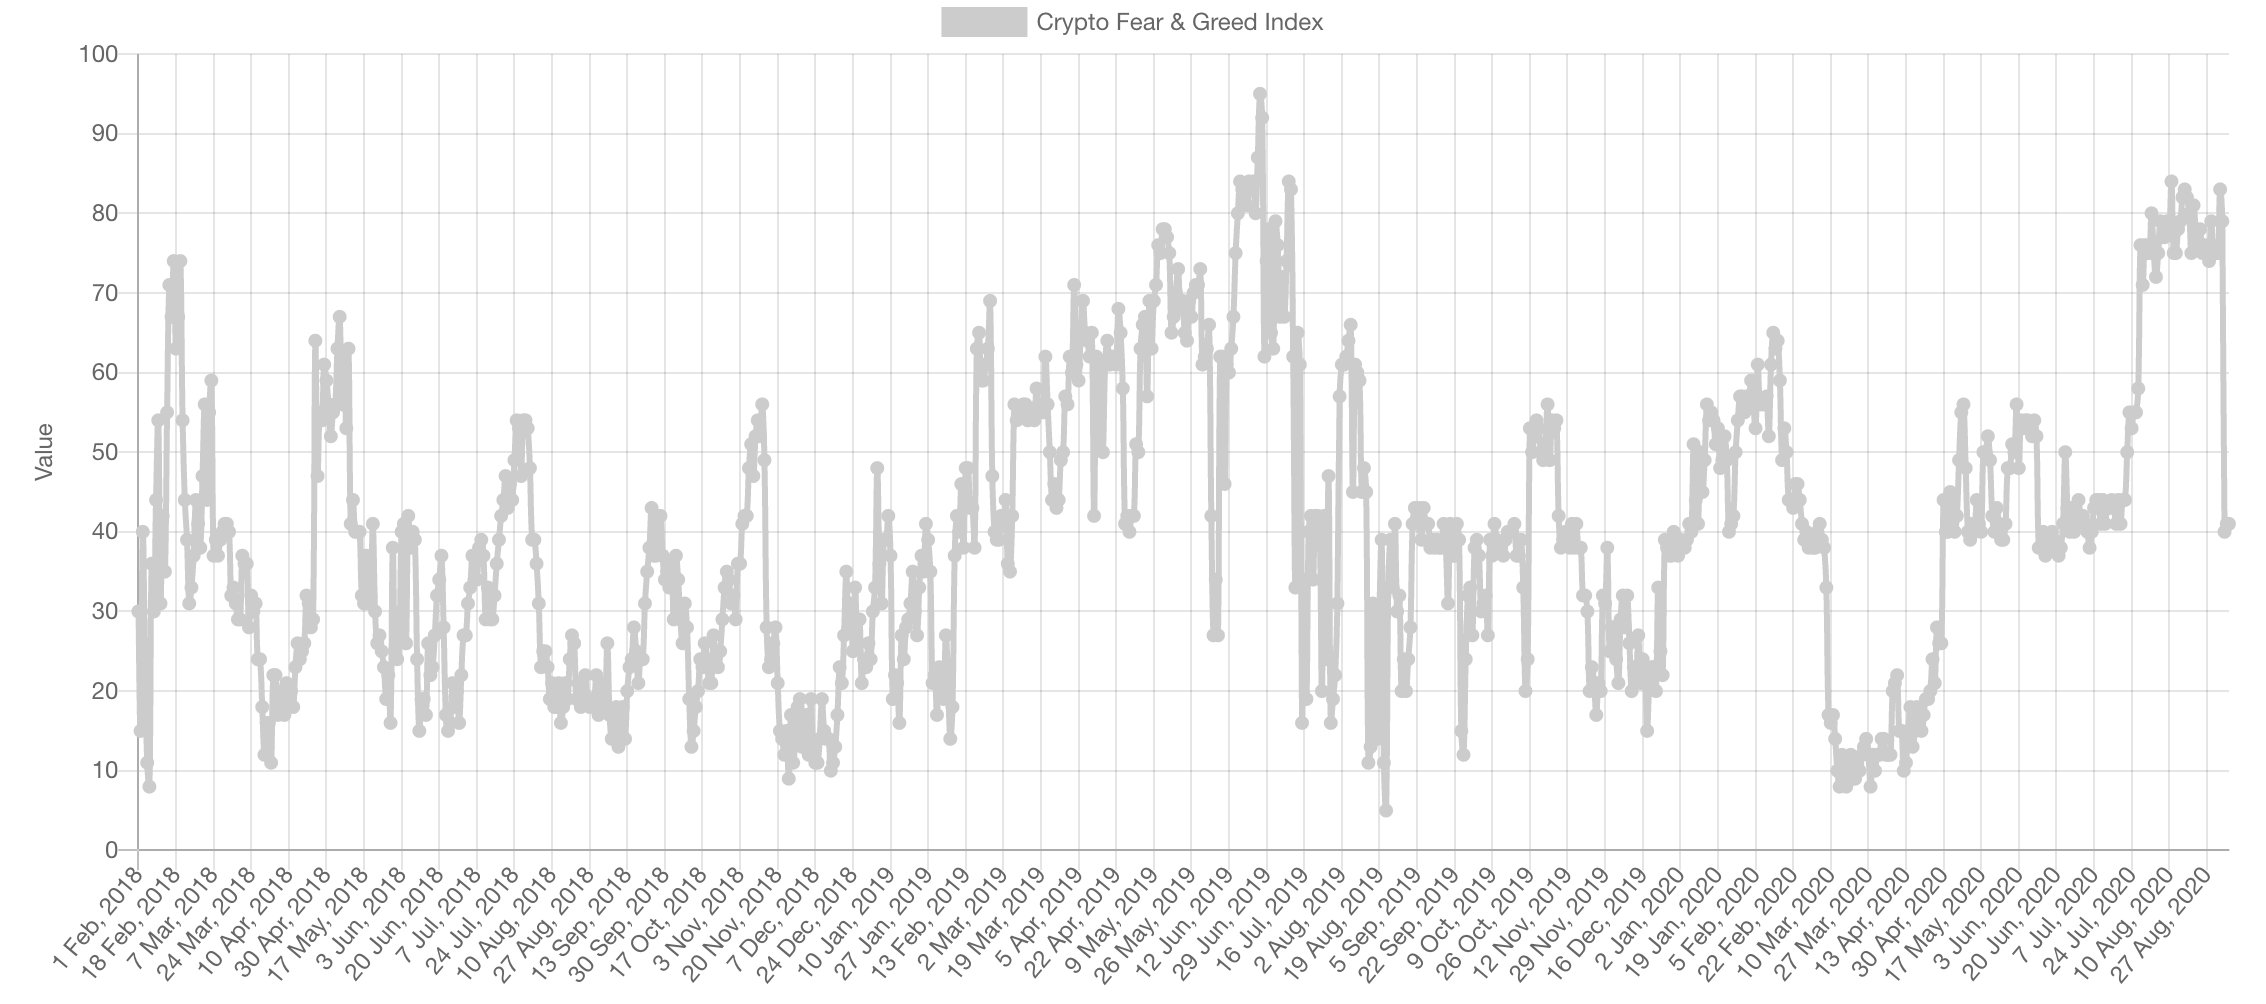
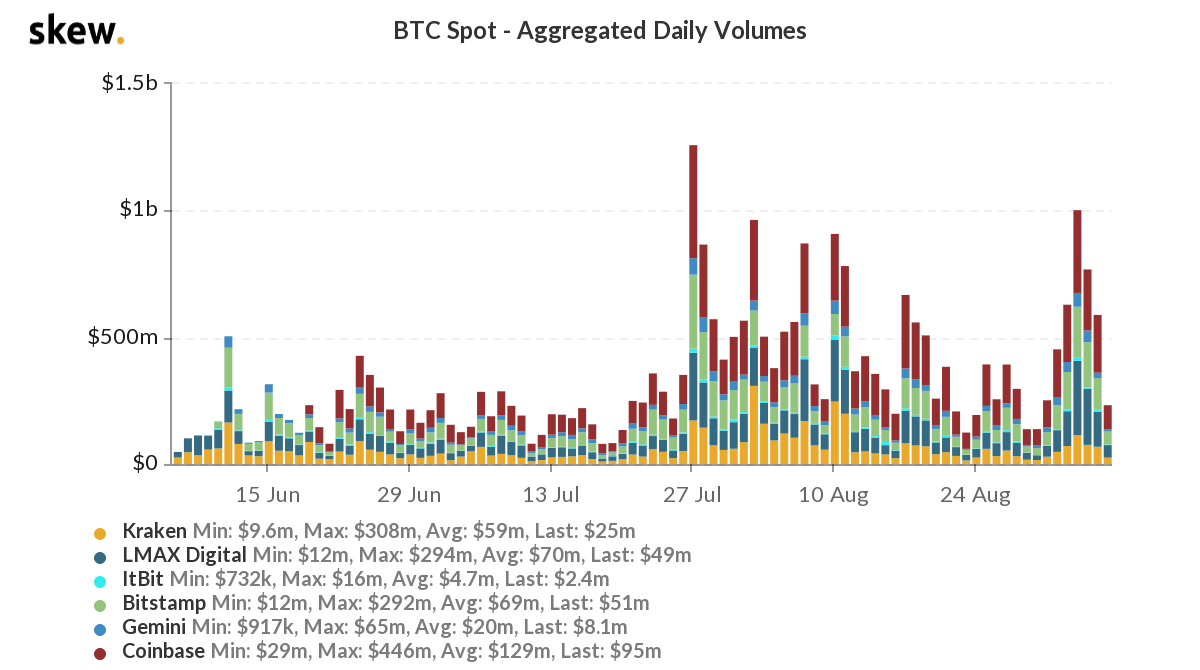
- Market Sentiment & Volume
- Liquidations
- Total & Altcoins Market Capitalisations
- BTC & ETH
This was accompanied by an increase in spot trading volume on Bitcoin.
Liquidations
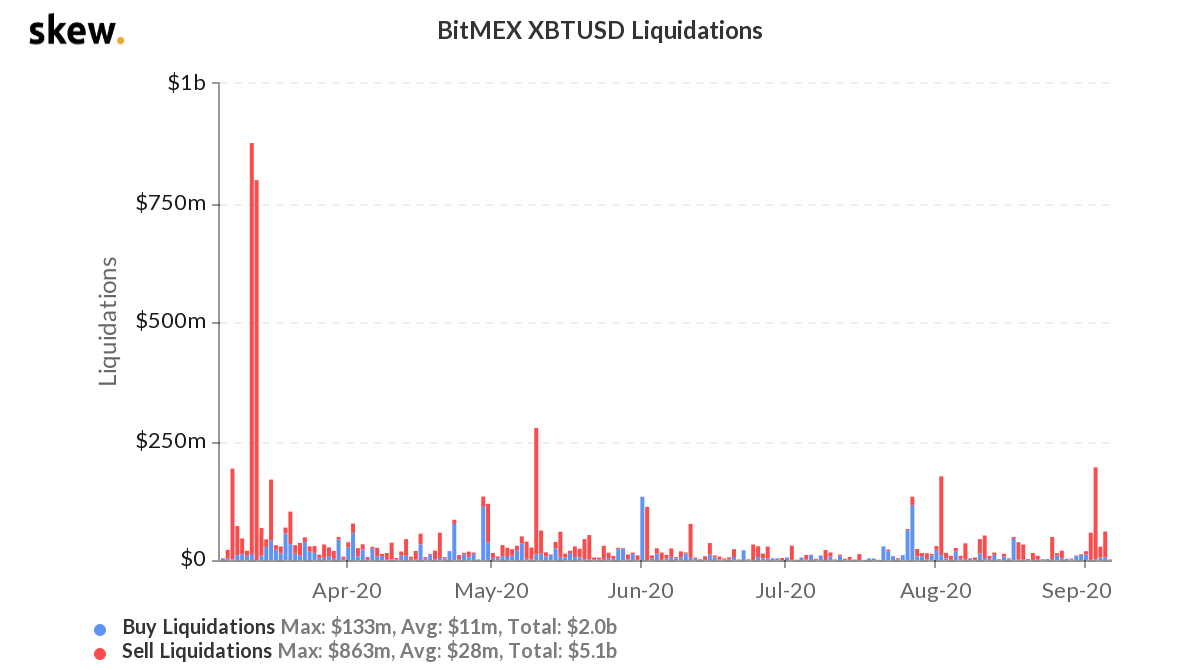
After Black Thursday, many are fearing a second similar move to take place so let’s dissect the most important piece of the puzzle: liquidations. Back in March the market crashed on the pandemic narrative of course, but the magnitude of the crash was caused by over leveraged traders which created a cascading effect through liquidations. The liquidations from that day were north of $1.8 BILLION, the last drop caused a mere $200 million in liquidations. A repeat of that drop is very unlikely.
Crypto Indices
Total Market Cap
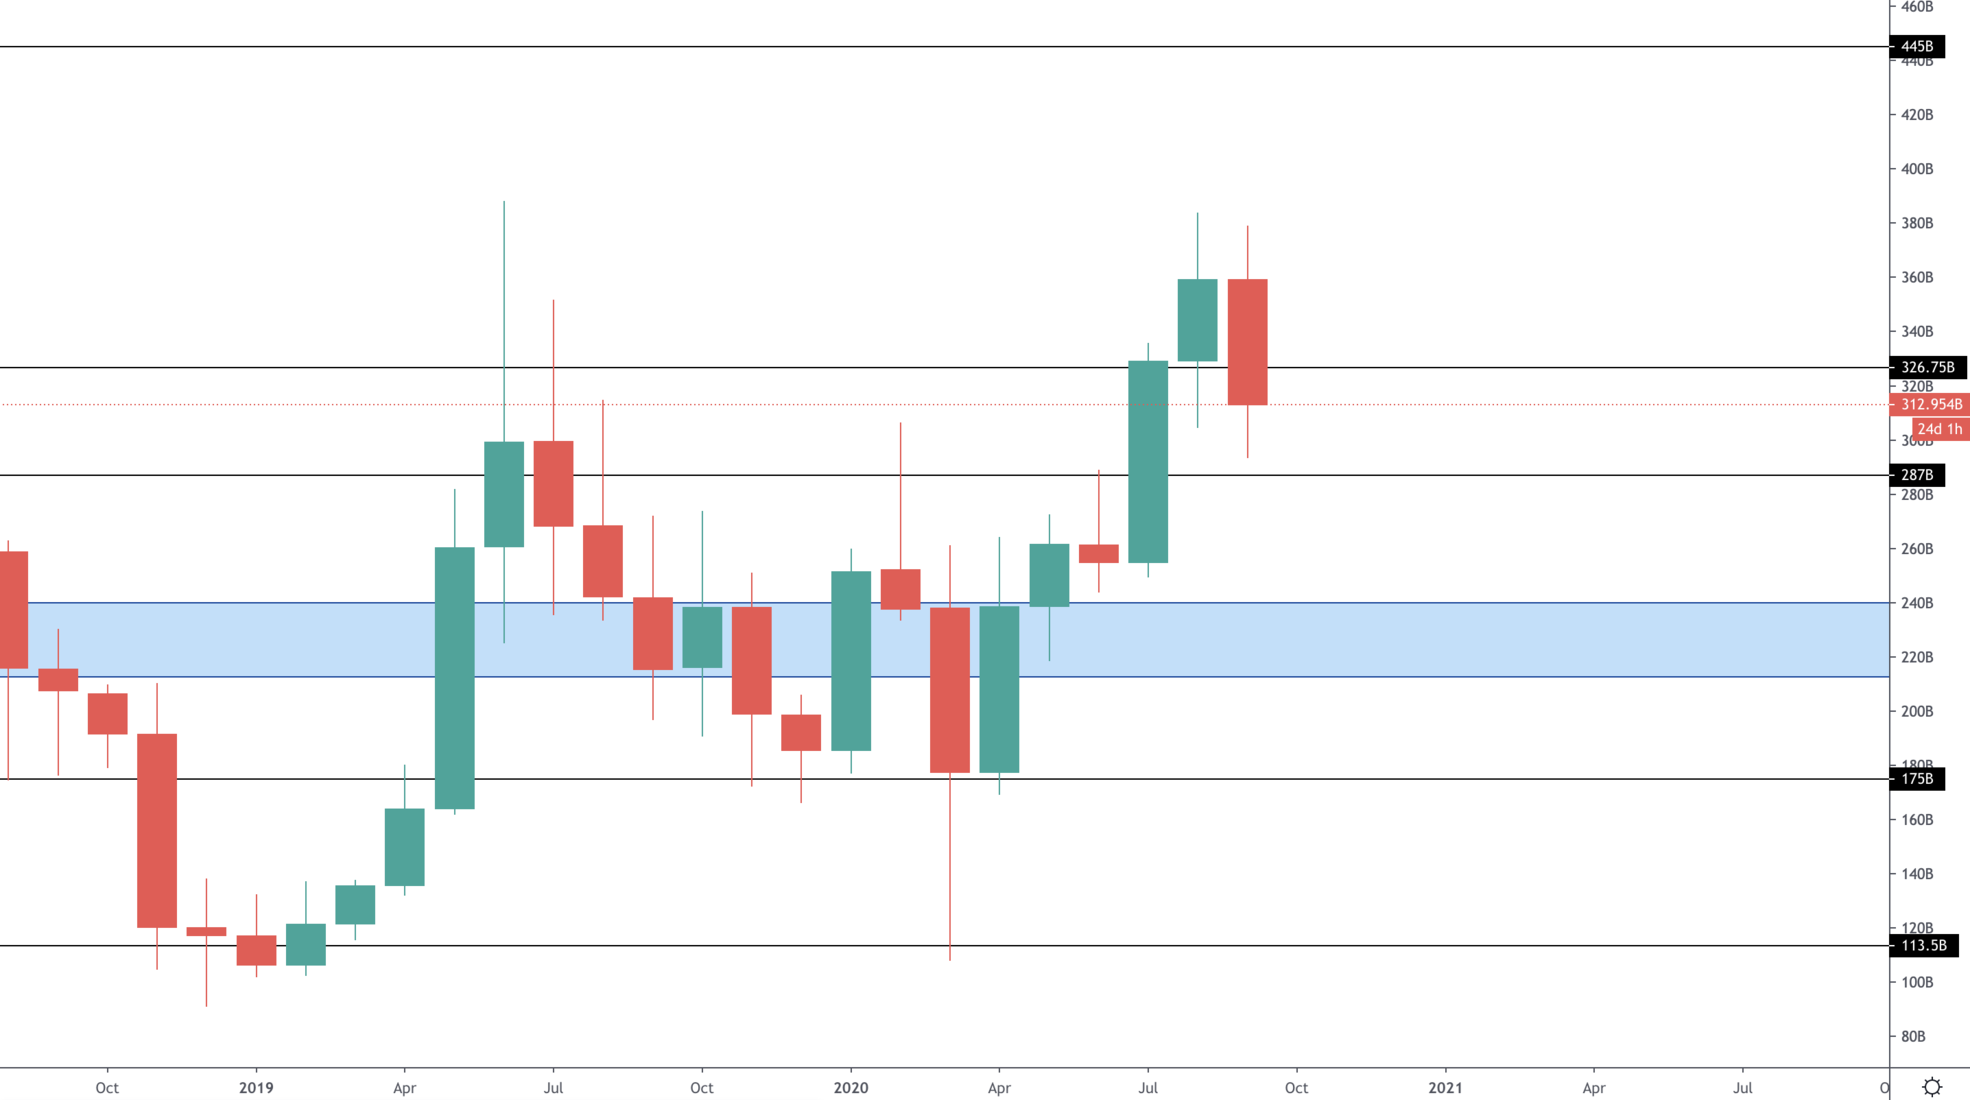
Let’s zoom out and look at what the market has achieved and where it is struggling. The market is clearly struggling with the high set in 2019, it tested it twice and dropped. This in fact is not bearish because it showed that the supply over there is no longer as significant or else we would’ve seen a harsher crash from the first touch. Most importantly, the August monthly candle closed well above the previous closure highs, which sets the stage for more bullish movement.
Altcoins Market Cap
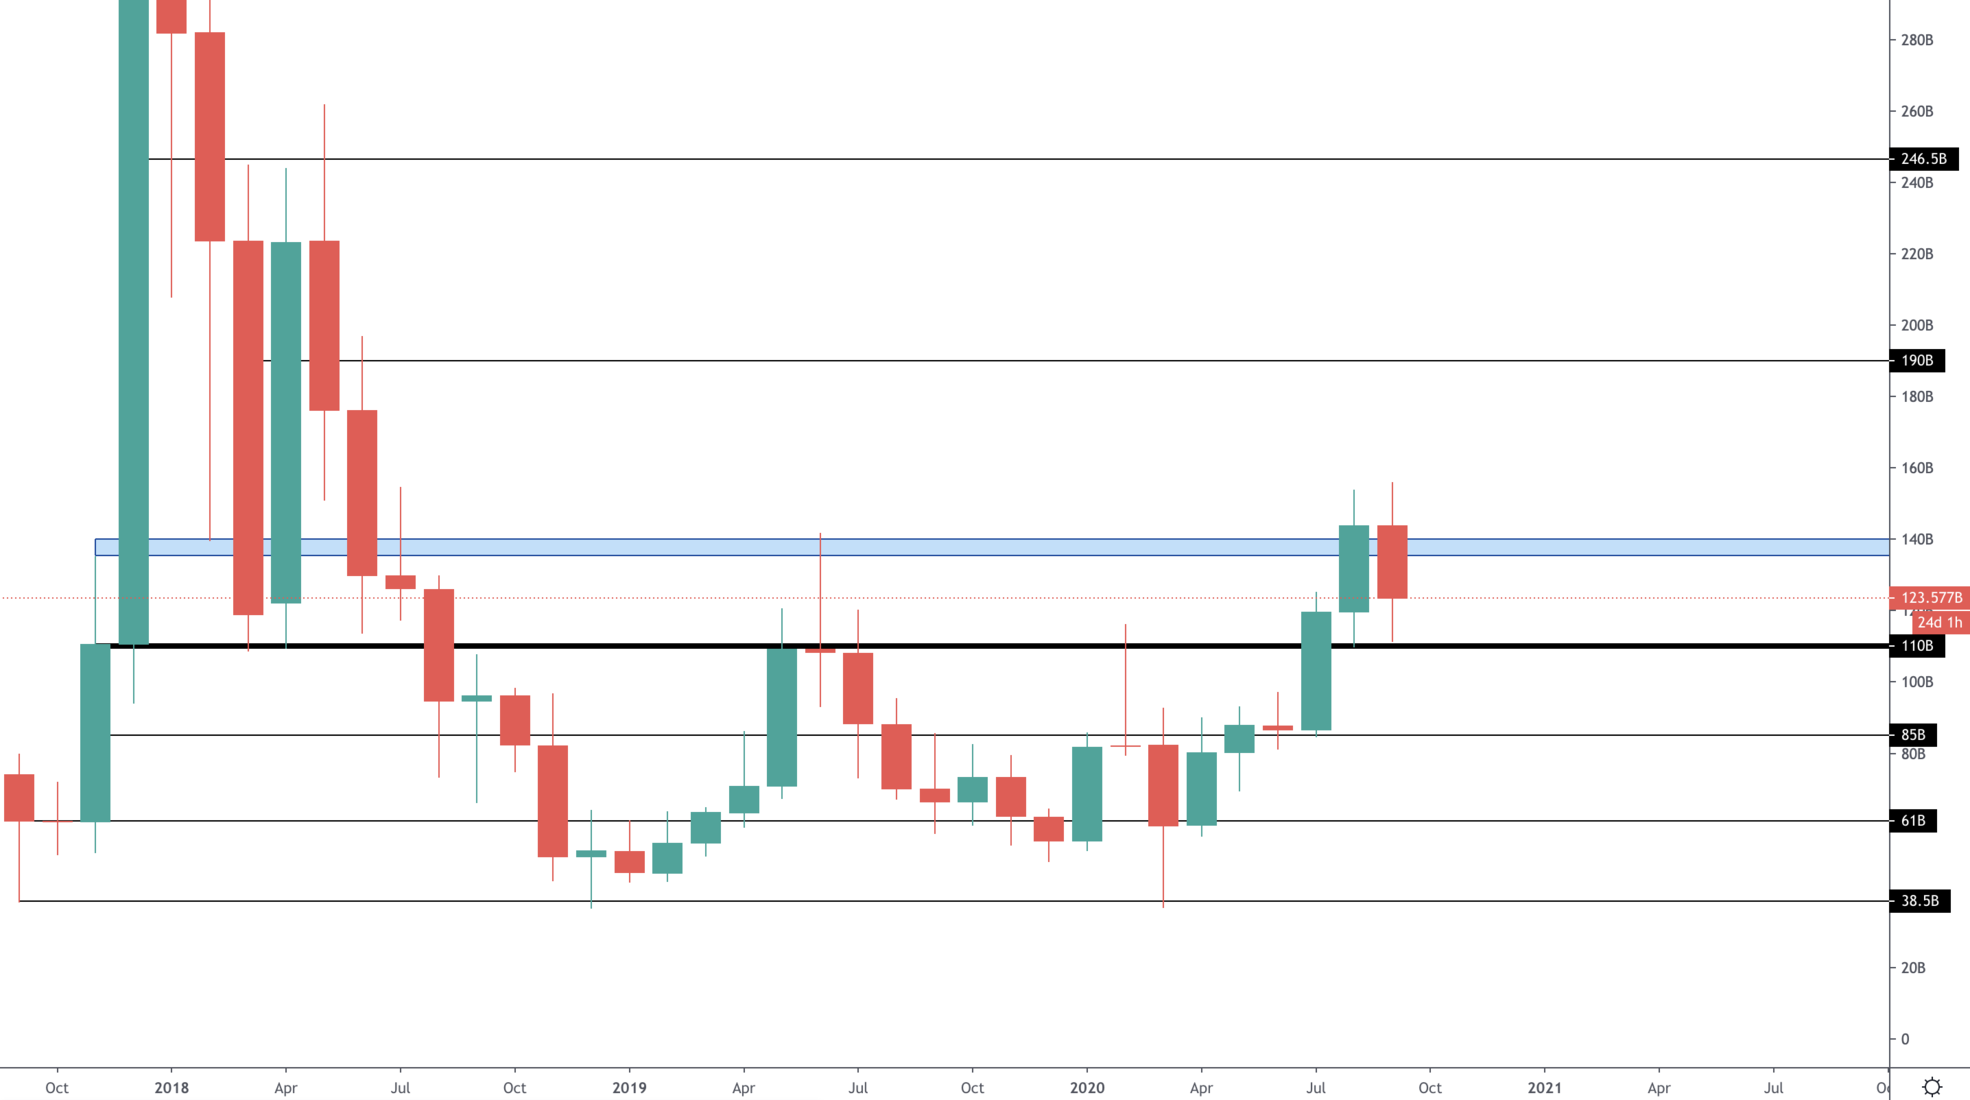
Look closely, $110B acted as the ultimate monthly support at the start of 2018 and crushed all upside price movements after the end of 2018 crash. Two previous monthly candles closed horrendously when they faced that line. $110B is arguably the most significant key level for Altcoins, separating bullish from bearish territory.
Price is well above it, closed two monthly candles above it and managed to take out the 2019 high. In our eyes, this screams bull-run and for that reason we have bought the dip because the R:R is extremely attractive.
Bitcoin
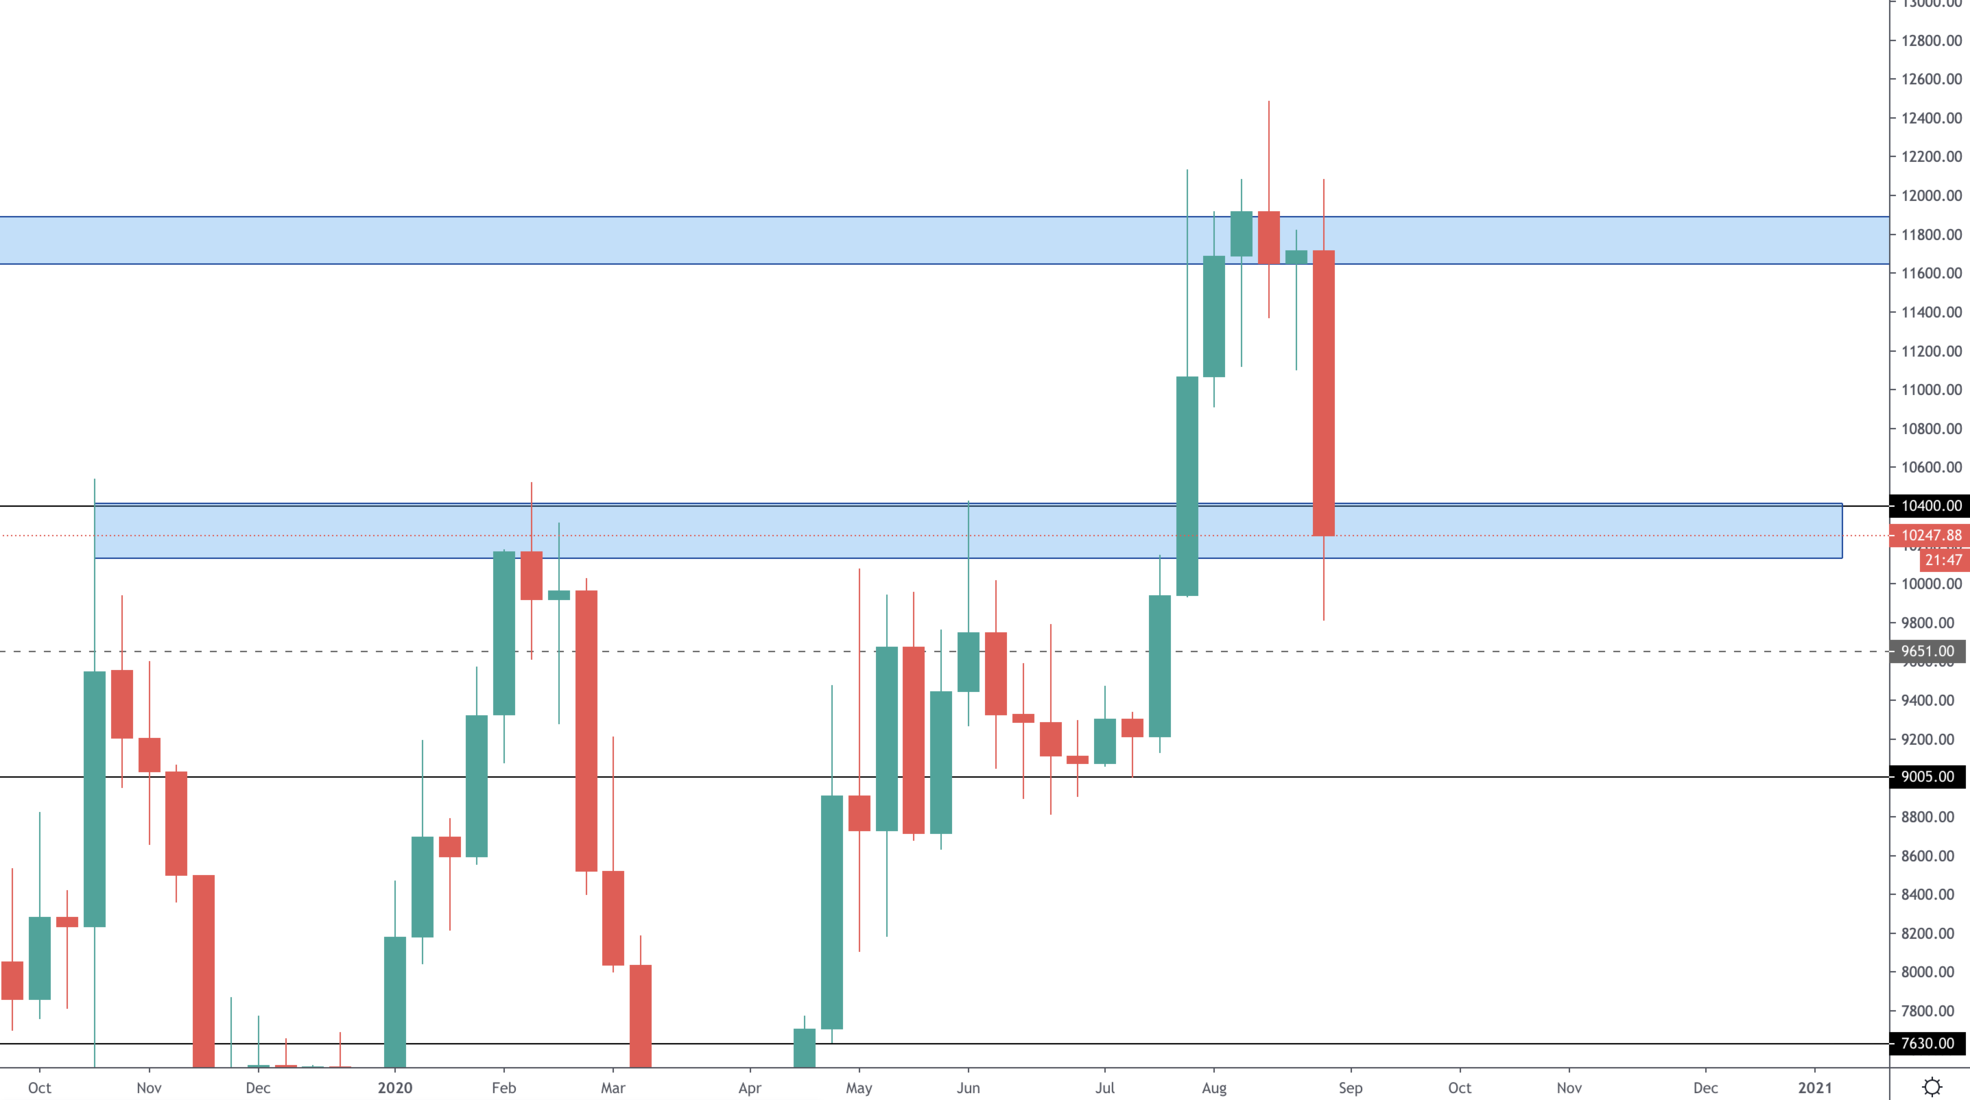
Price broke monthly records by closing above the 2019 closure high. Weekly timeframe (shown) also bullish with the closures and price is now back at high timeframe resistance turned support. Once again, yes the $9,600 CME gap is likely to close but that’s only a correction in the midst of the start of a bull-run.
ETH
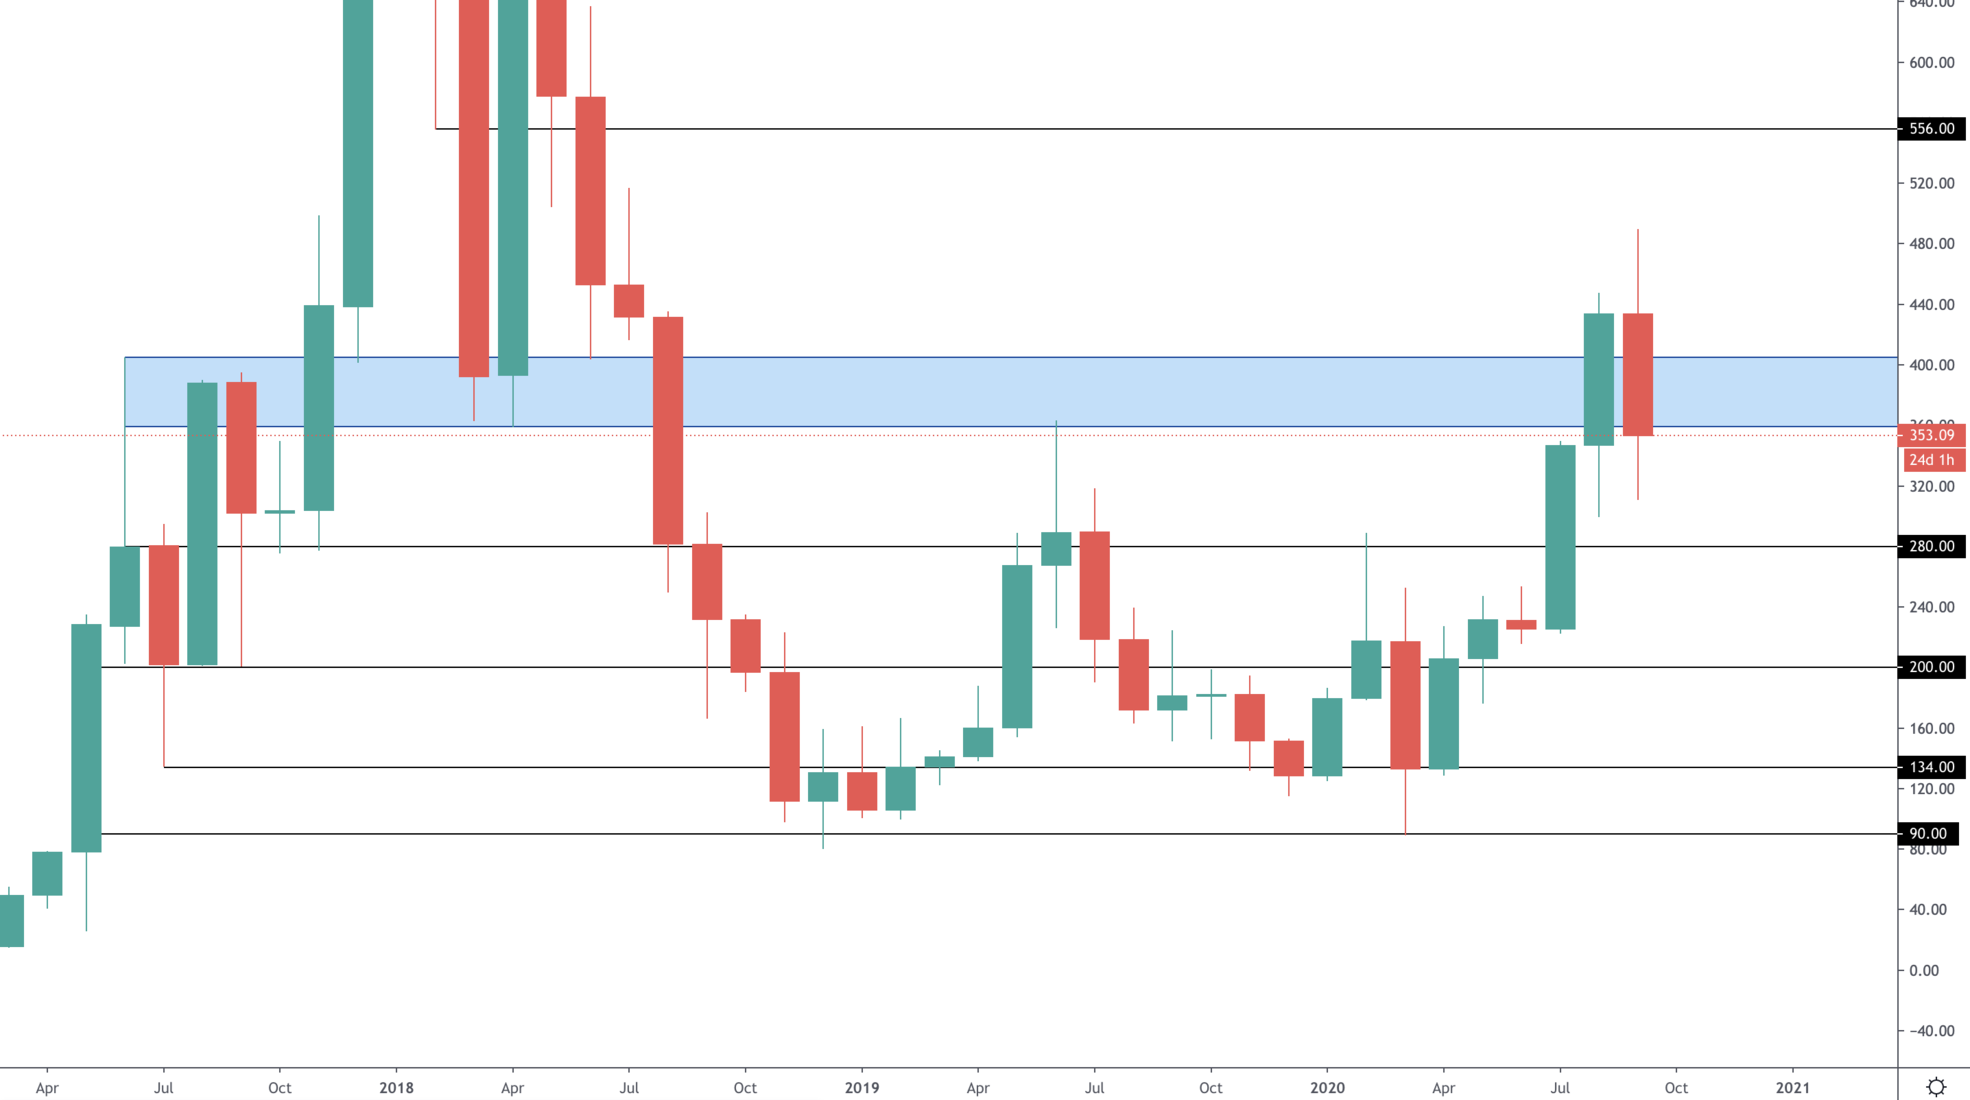
The [$360-$405] liquidity zone for ETH is the equivalent of $110B for Alts. Price closed an entire monthly candle outside of it. End of argument.
We are betting that this will end up being a mere wick on the monthly timeframe by end of September.
Disclaimer: None of the above constitutes financial advice or any sort of recommendation. These are purely opinions.
Recommended from Cryptonary


