Save 23% ($351) & Get a Free 1-1 Call with our Team ⏰ : 0d 2h 59m 43s
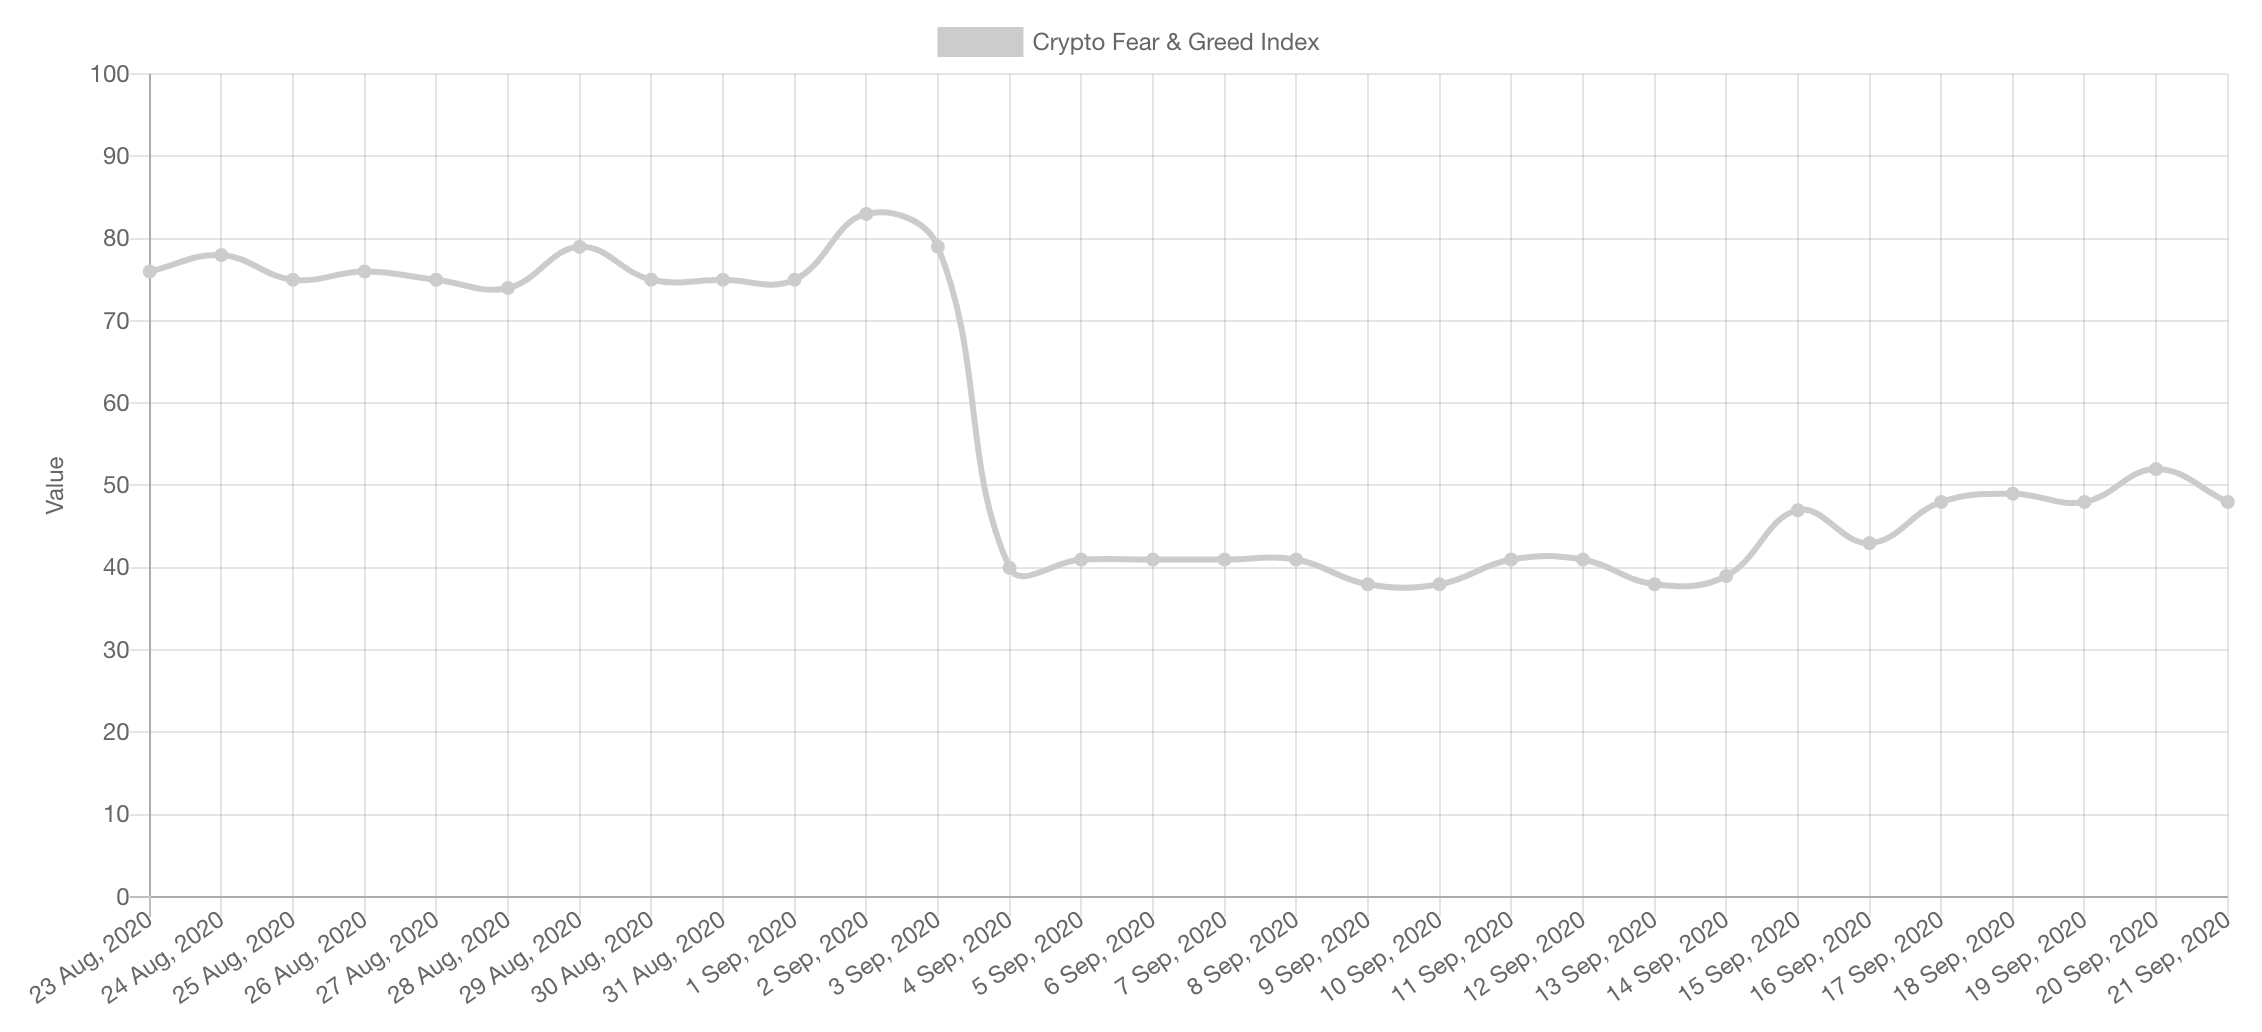
Since the sharp pullback seen in early September, all greedy participants have flipped in sentiment and entered a phase of fear. This was both expected and normal, why? Because participants that enter extreme greed are both weak holders and emotionally unstable when faced with adverse market movements. This pullback has shaken off a good portion of this greed. Now sentiment has entered a phase of neutrality.
Volume
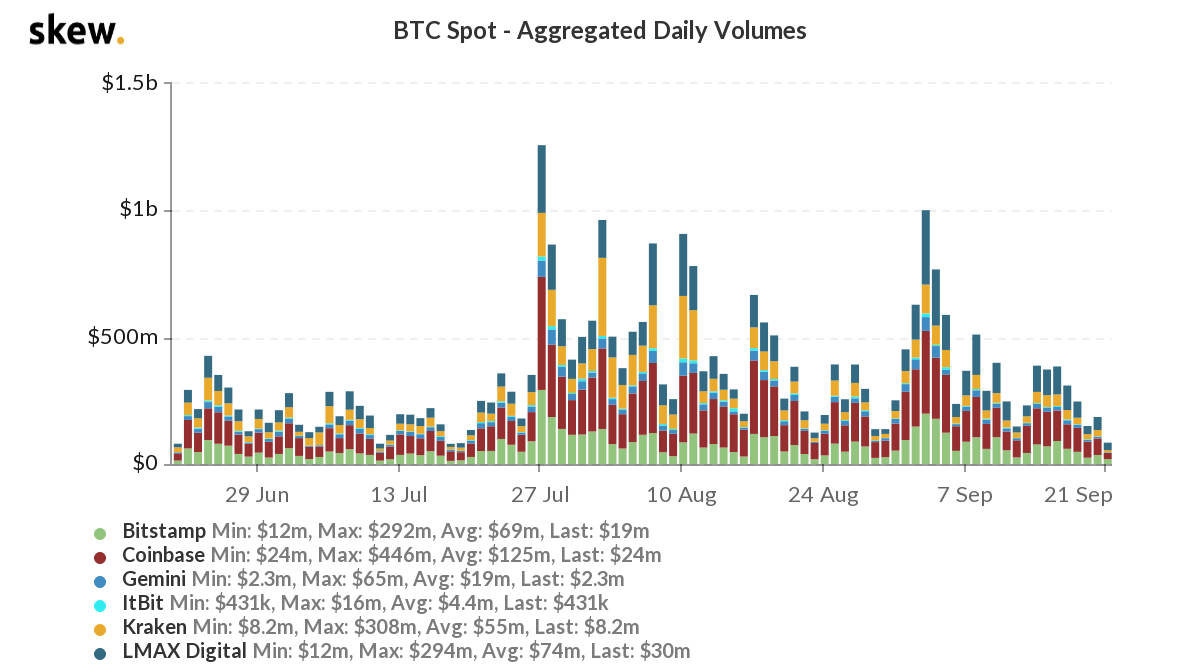
In contrast with the neutral sentiment we are also entering a period of low trading volume which precedes larger volatility. Which way? Only the charts can give us a hint.
Market Indices
Total Market Cap
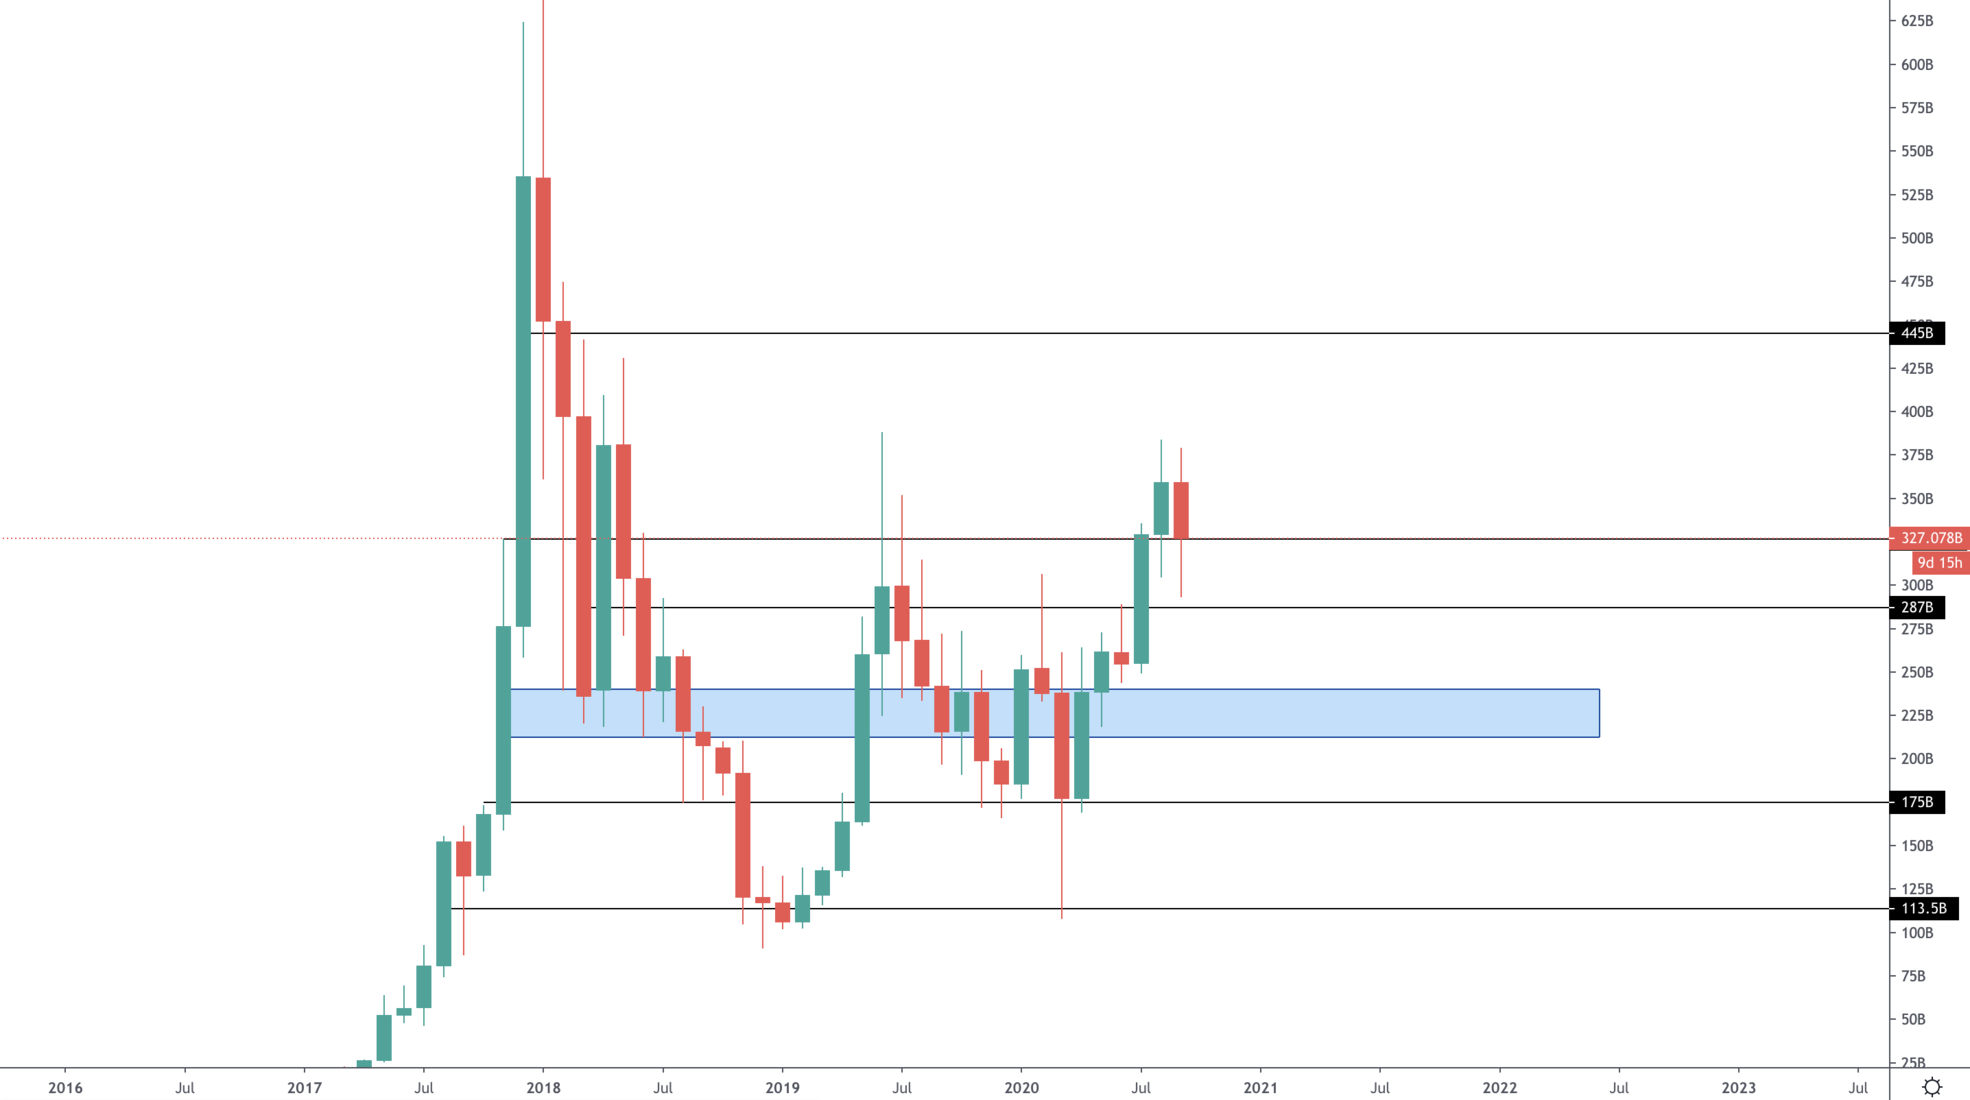
A few weeks ago, we tweeted “This will end up being a wick on the monthly chart” and so far this is materialising. There is no denying that the larger timeframes are highly bullish after having crossed levels and closed massive green candles. This keeps our eyes set at $450B as a next level. Does this have to happen immediately? Of course not, the market just came out of a massive run and consolidation/pullback are nothing more than a healthy tendency in a bullish market.
Altcoins Market Cap
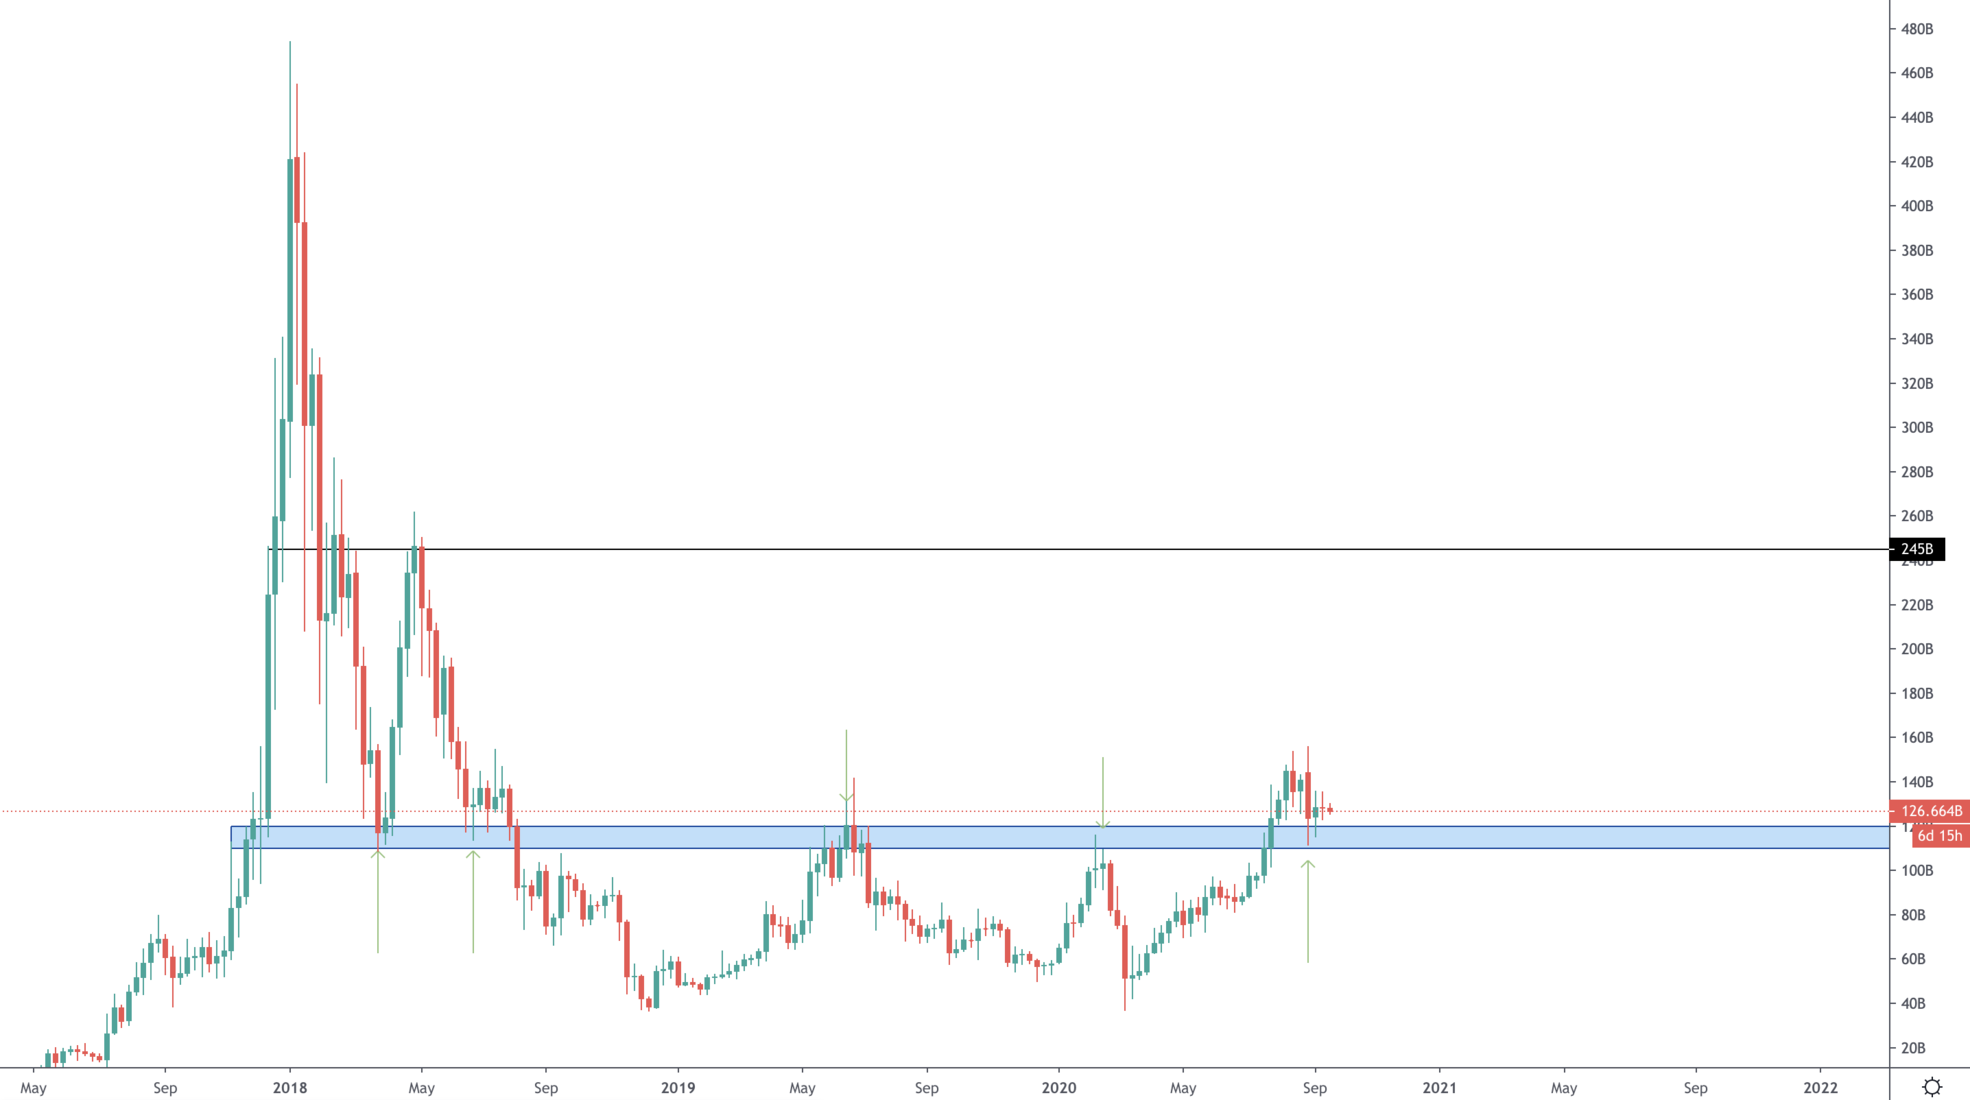
This chart was made for the sake of simplicity. Over the past few years, the most significant area of both support and resistance has been the [$110B-$120B] liquidity zone. It acted as major support in 2018 and crushed prices in 2019/2020. Now this area has been crossed over. Target? $245B with a clear invalidation. This represents one of the highest R:R trades ever.
Bitcoin
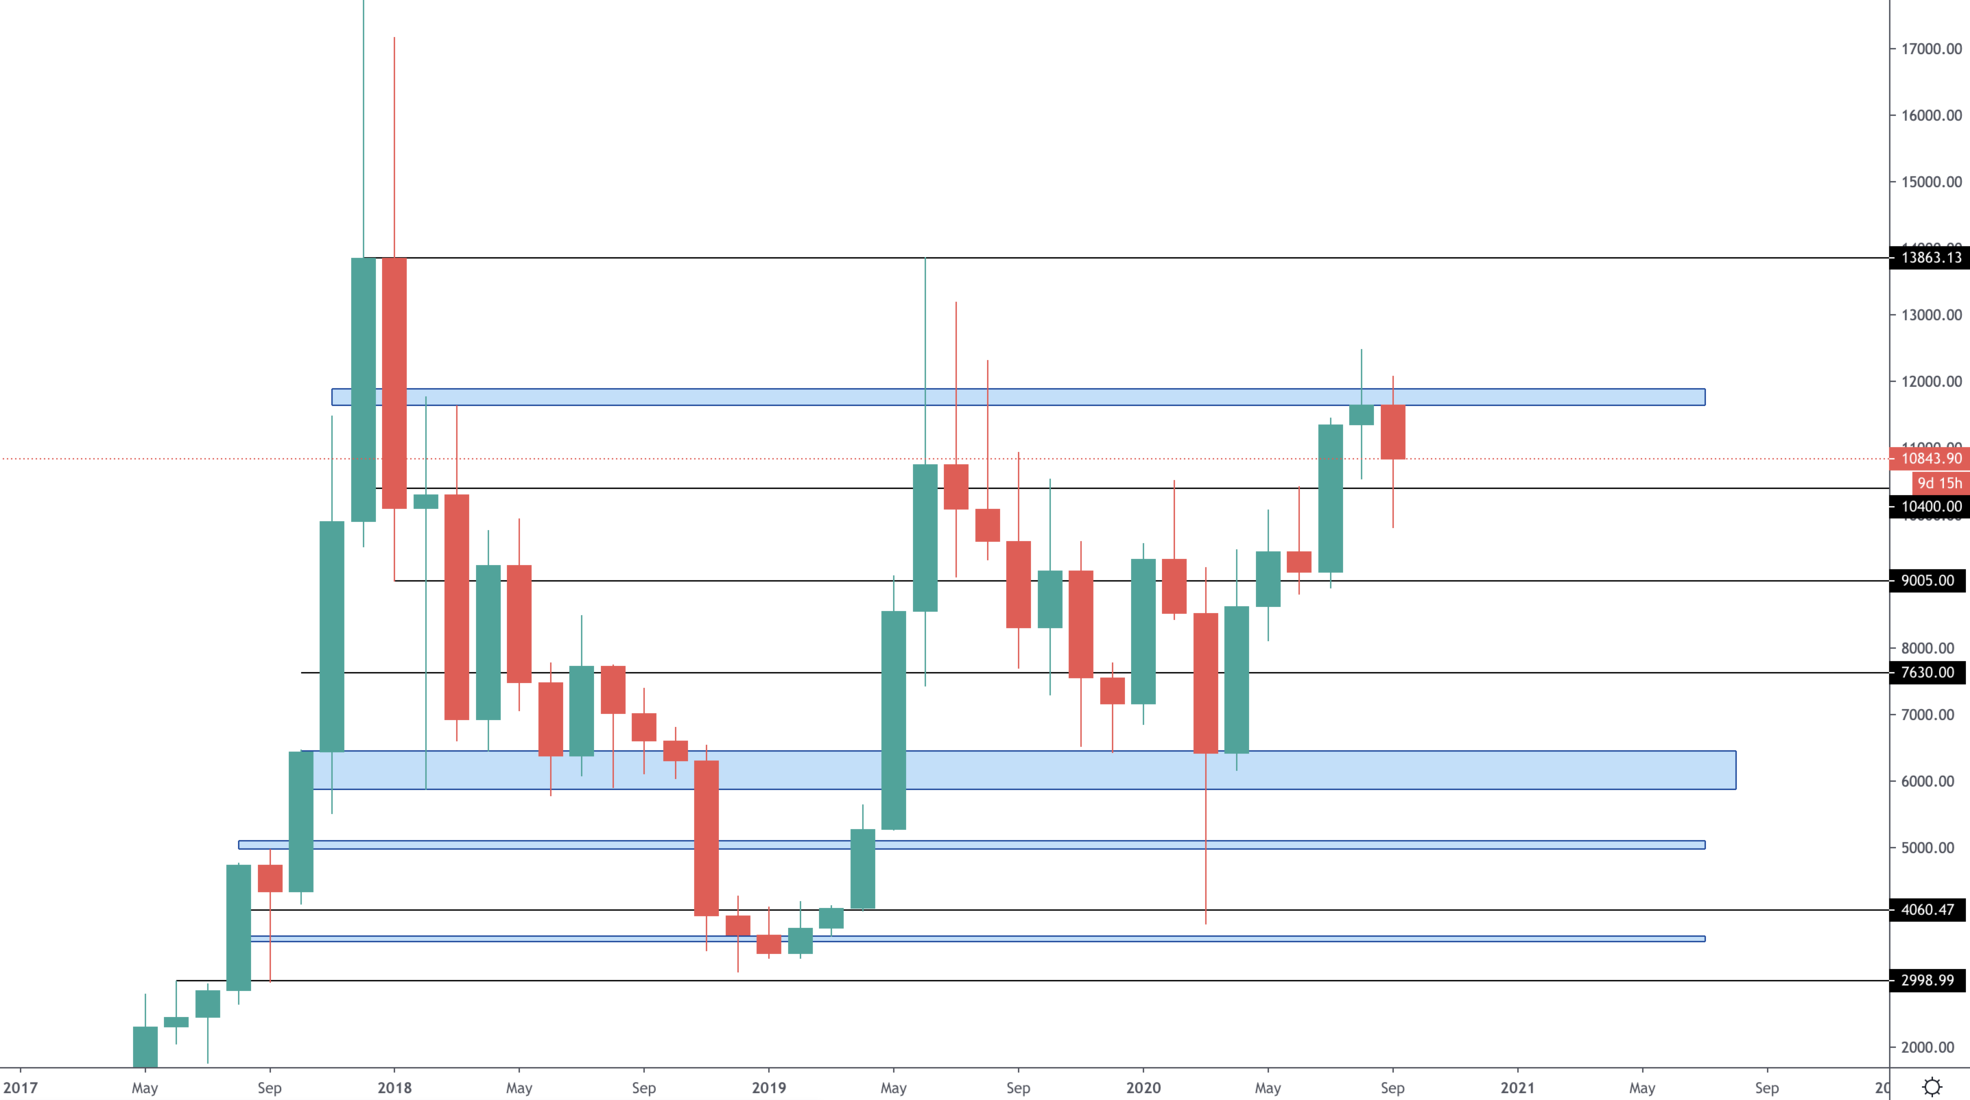
Up until now, this pullback represents a retest of crossed levels on higher timeframes. Smaller timeframes have reclaimed a good portion of the pulled back region too. $14,000 is the next target we are looking at, however we are not expecting it promptly and further consolidation may take place. There is honestly very little left before Bitcoin sets a new all-time high monthly closure which only opens up the doors to a new race.
Ether
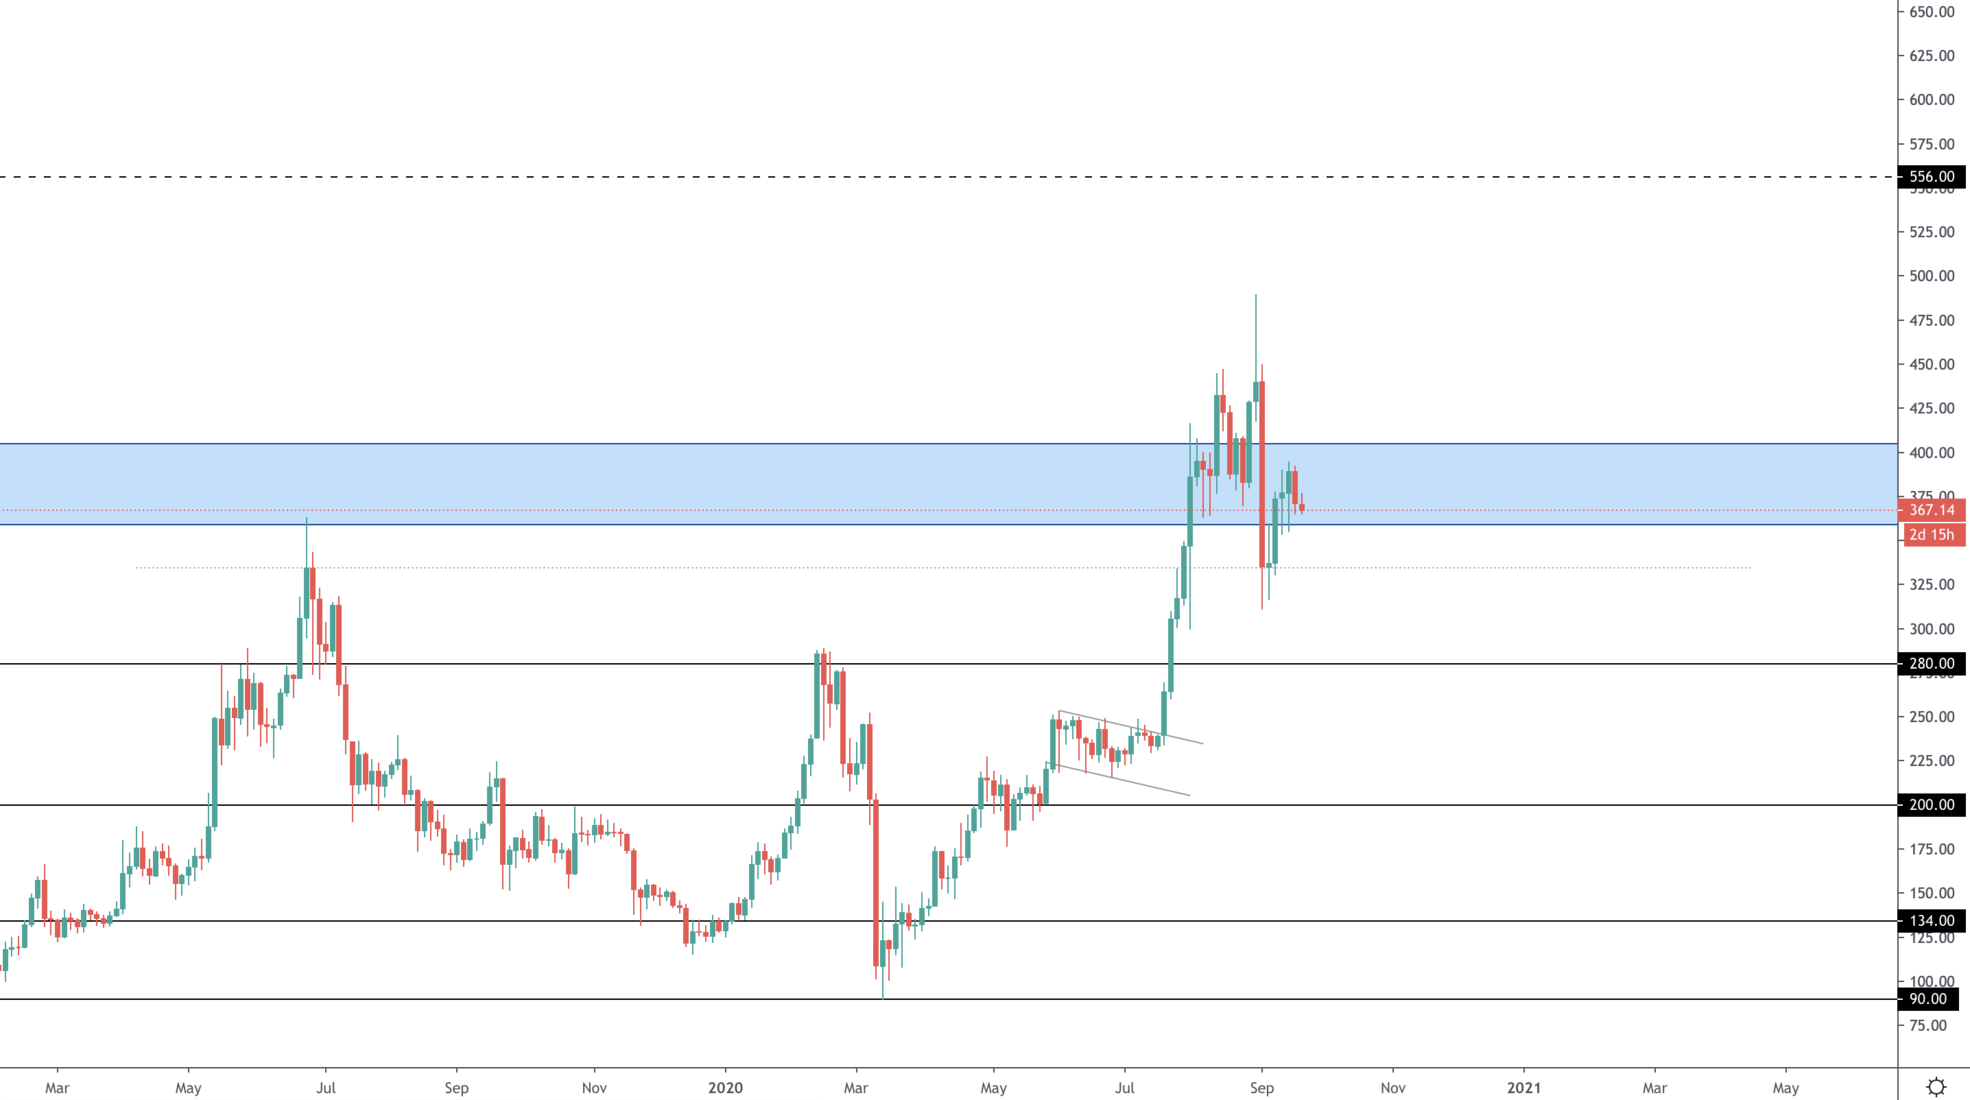
ETH retested the previous June 2019 high and reclaimed $360. For now price is ranging and only a break out of the [$360-$405] zone can tell us where price will be moving next judging by thus chart alone. Given the momentum, the altcoins mcap chart and overall sentiment, we are still betting on a $800 ETH.
Disclaimer: None of the above constitutes financial advice or any sort of recommendation. These are purely opinions.
Recommended from Cryptonary


