Save 23% ($351) & Get a Free 1-1 Call with our Team ⏰ : 0d 2h 59m 43s

This issue of Weekly Technicals Pro is a special one because we are covering both the weekly and monthly timeframes given the fact that both had closures on the same day.
Market Sentiment
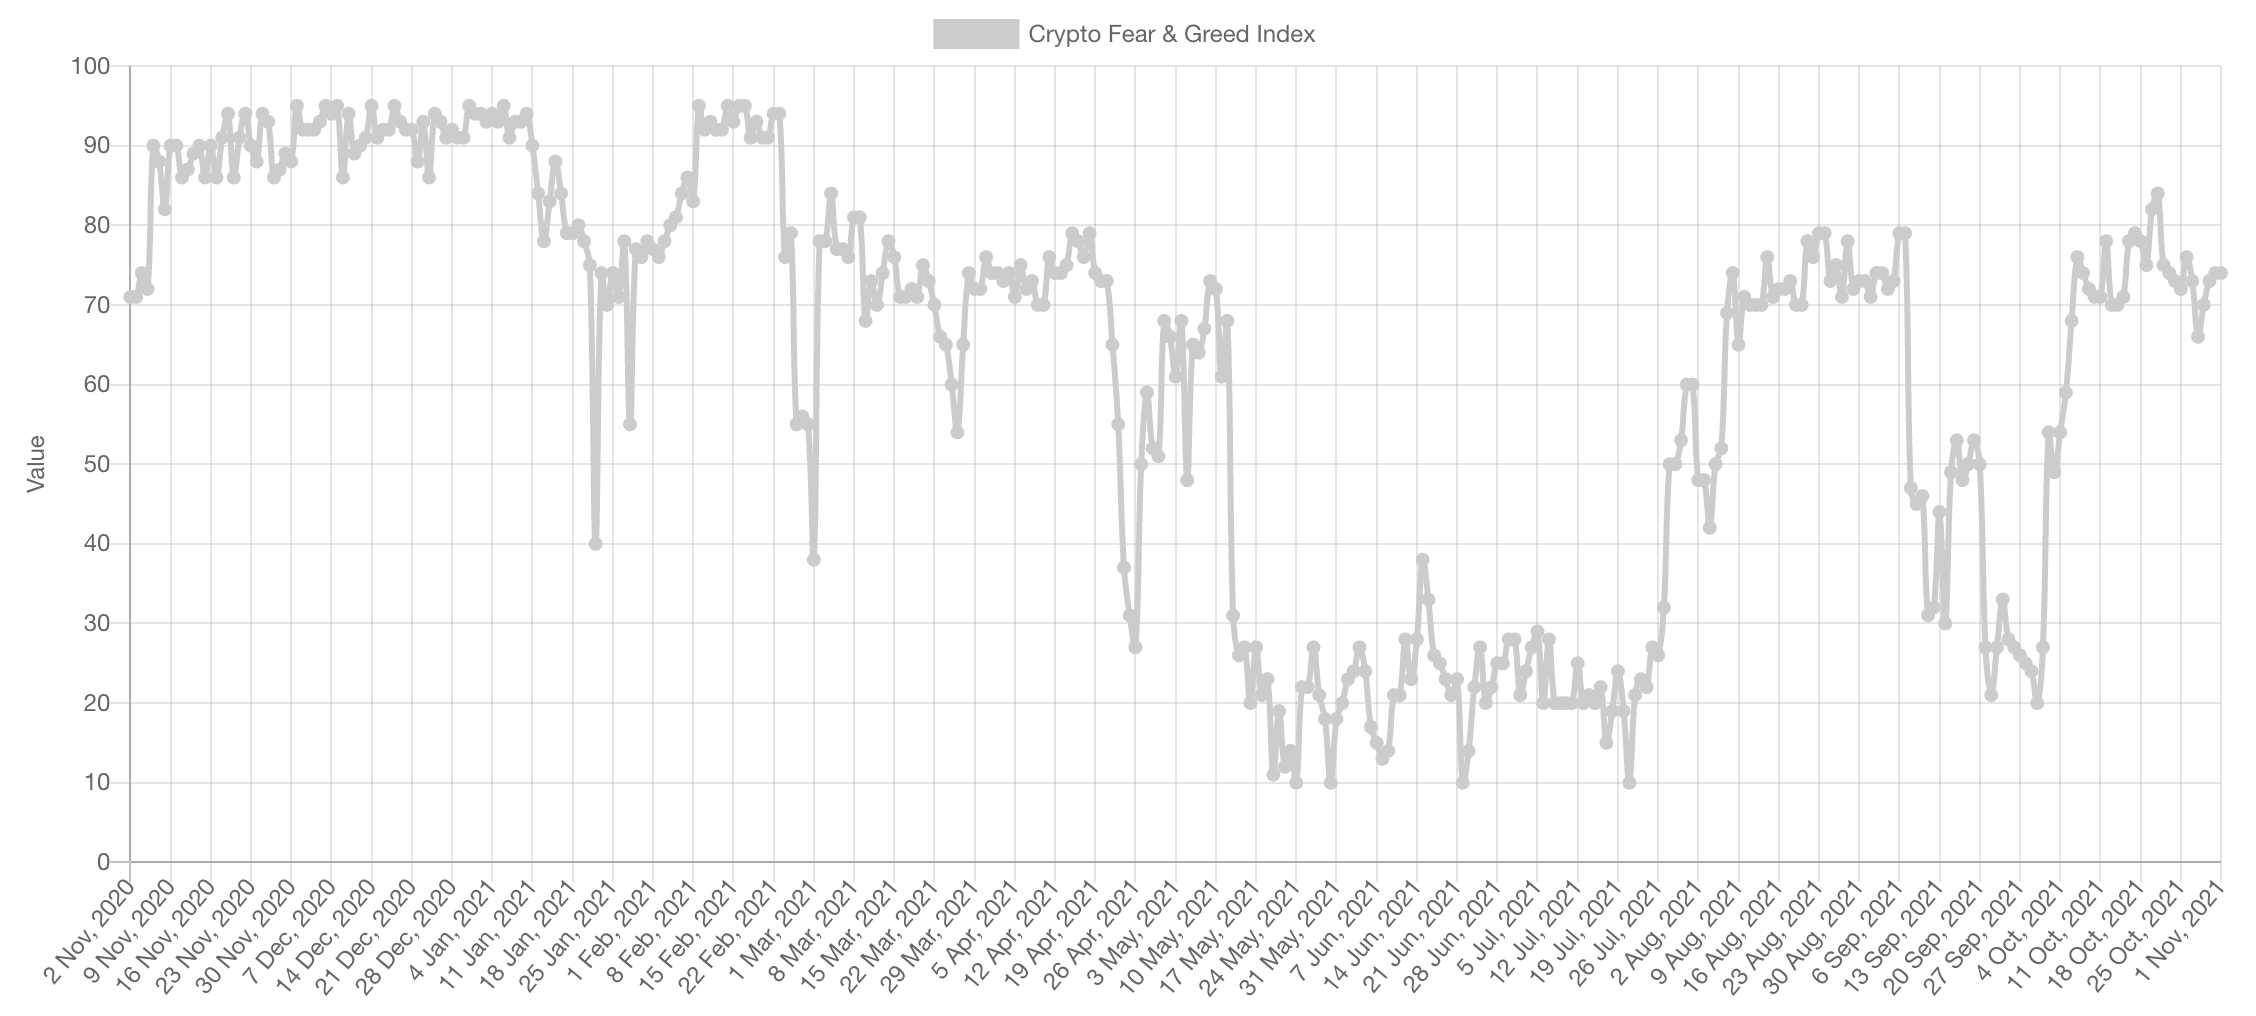
First and foremost, market sentiment. Thus far, sentiment has been ranging in low levels of Extreme Greed. The reason is simply: indecision. Most market participants are on the edge waiting to join but unsure as some others expect downside flushes. This type of indecision is what's leading to the current market stagnation.
To understand where we're headed next, we'll need to visit further charts.
Market Indexes
Total Market Cap
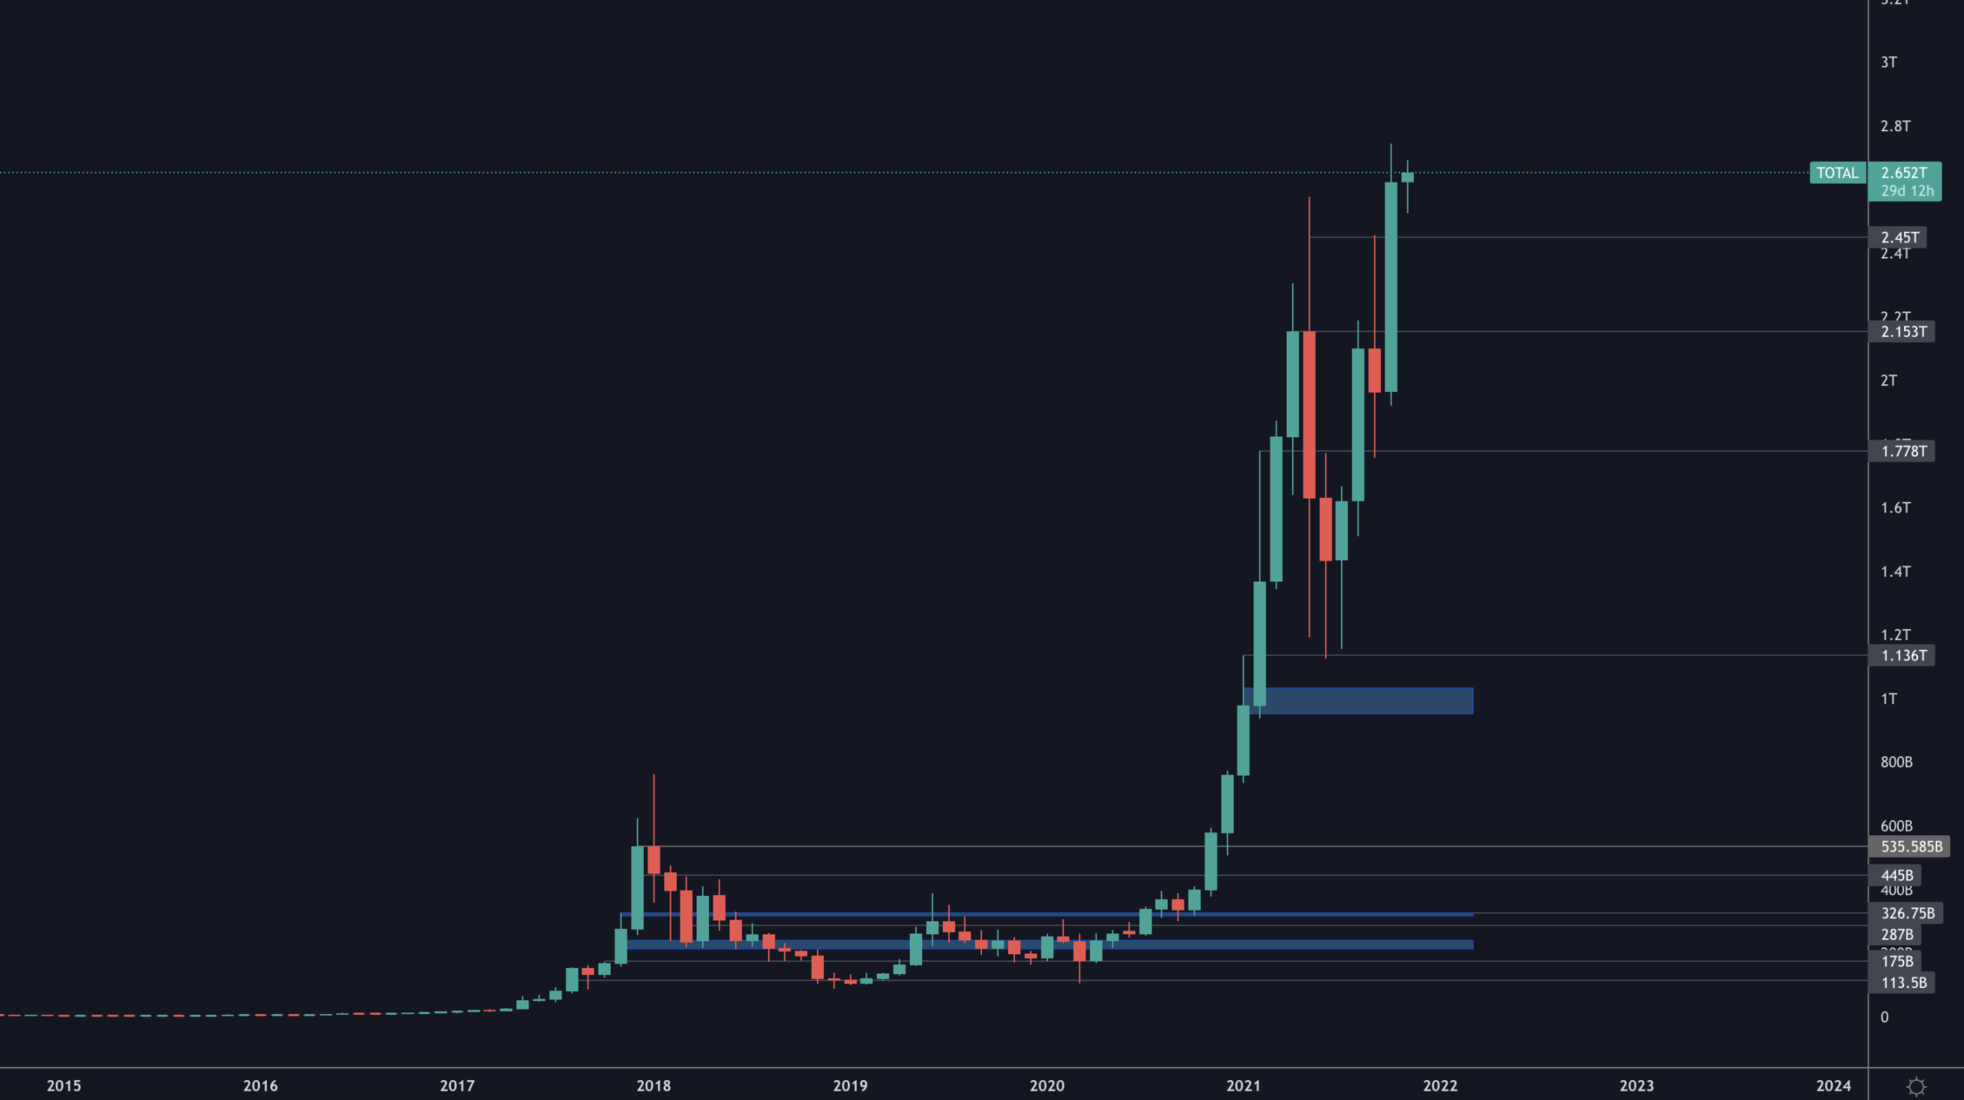
Crypto is officially in price discovery as we can see on the monthly chart. This means that previous resistances, namely $2.5T, has now been turned into support.
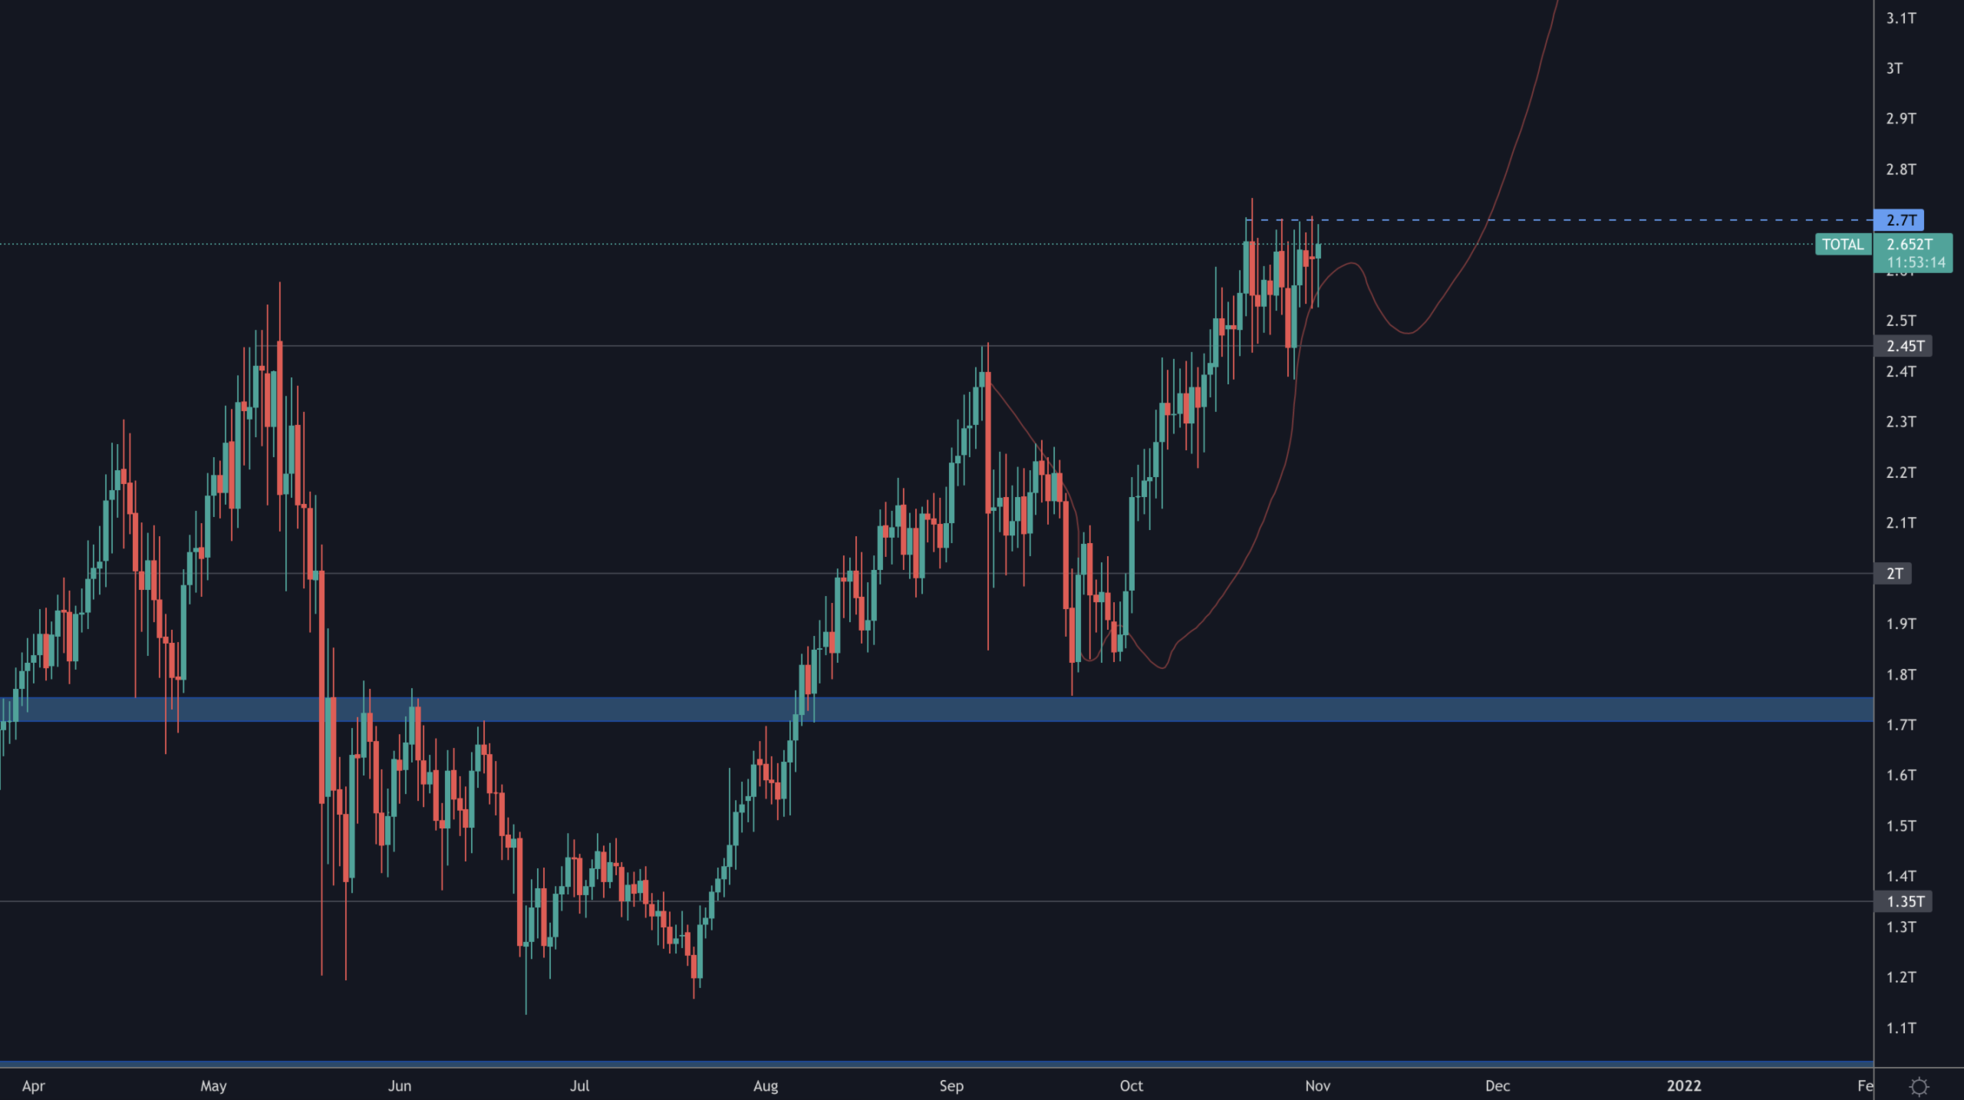
Here, we are exceptionally bringing the daily timeframe because the weekly timeframe communicates the exact same message as the monthly. The daily timeframe on the other hand is showing us consolidation above resistance ($2.5T) - which is perfectly following our squiggly line and an acceleration in the rally is highly likely to occur once $2.7T is crossed on the daily.
Altcoins' Market Cap
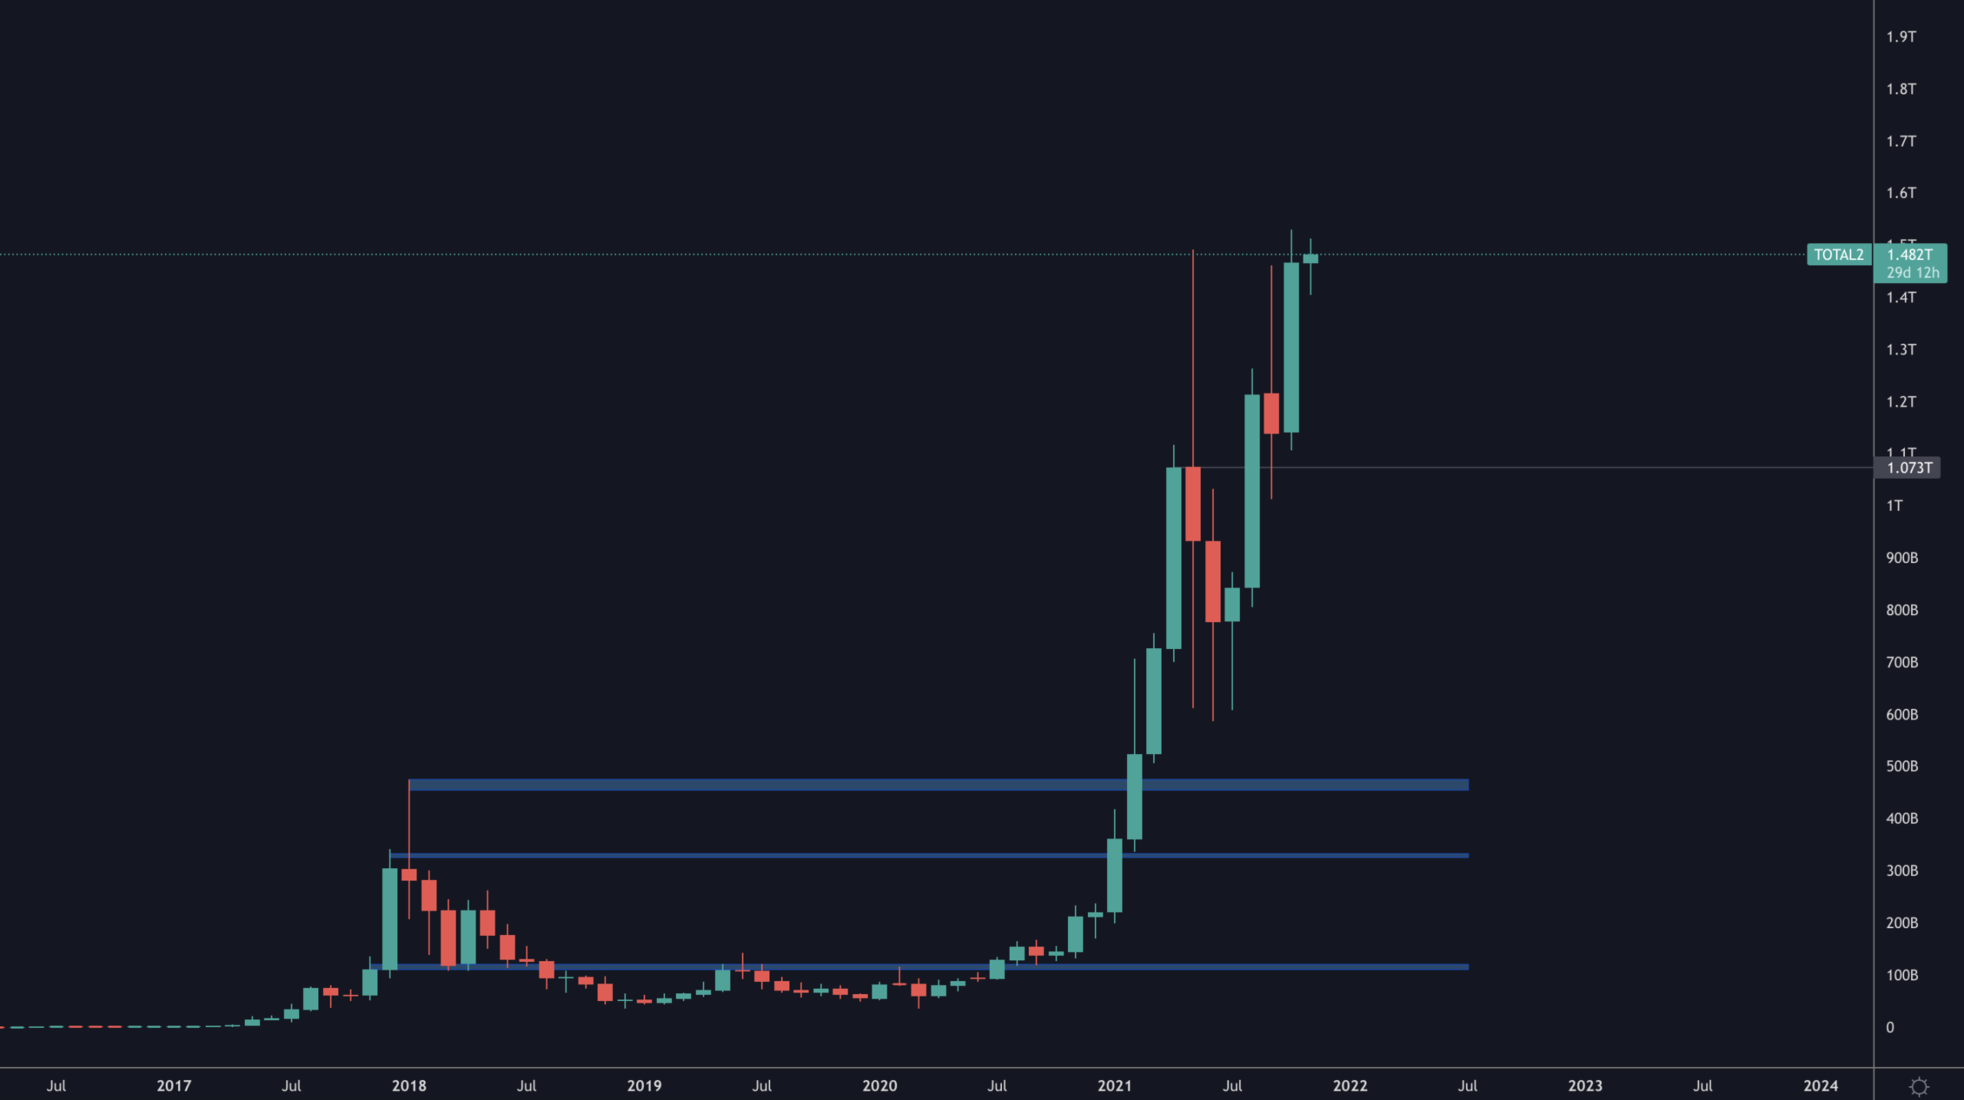
The Alts MCap is almost at price discovery and we can confidently say it is in a bullish market structure which is likely to remain for the coming months.
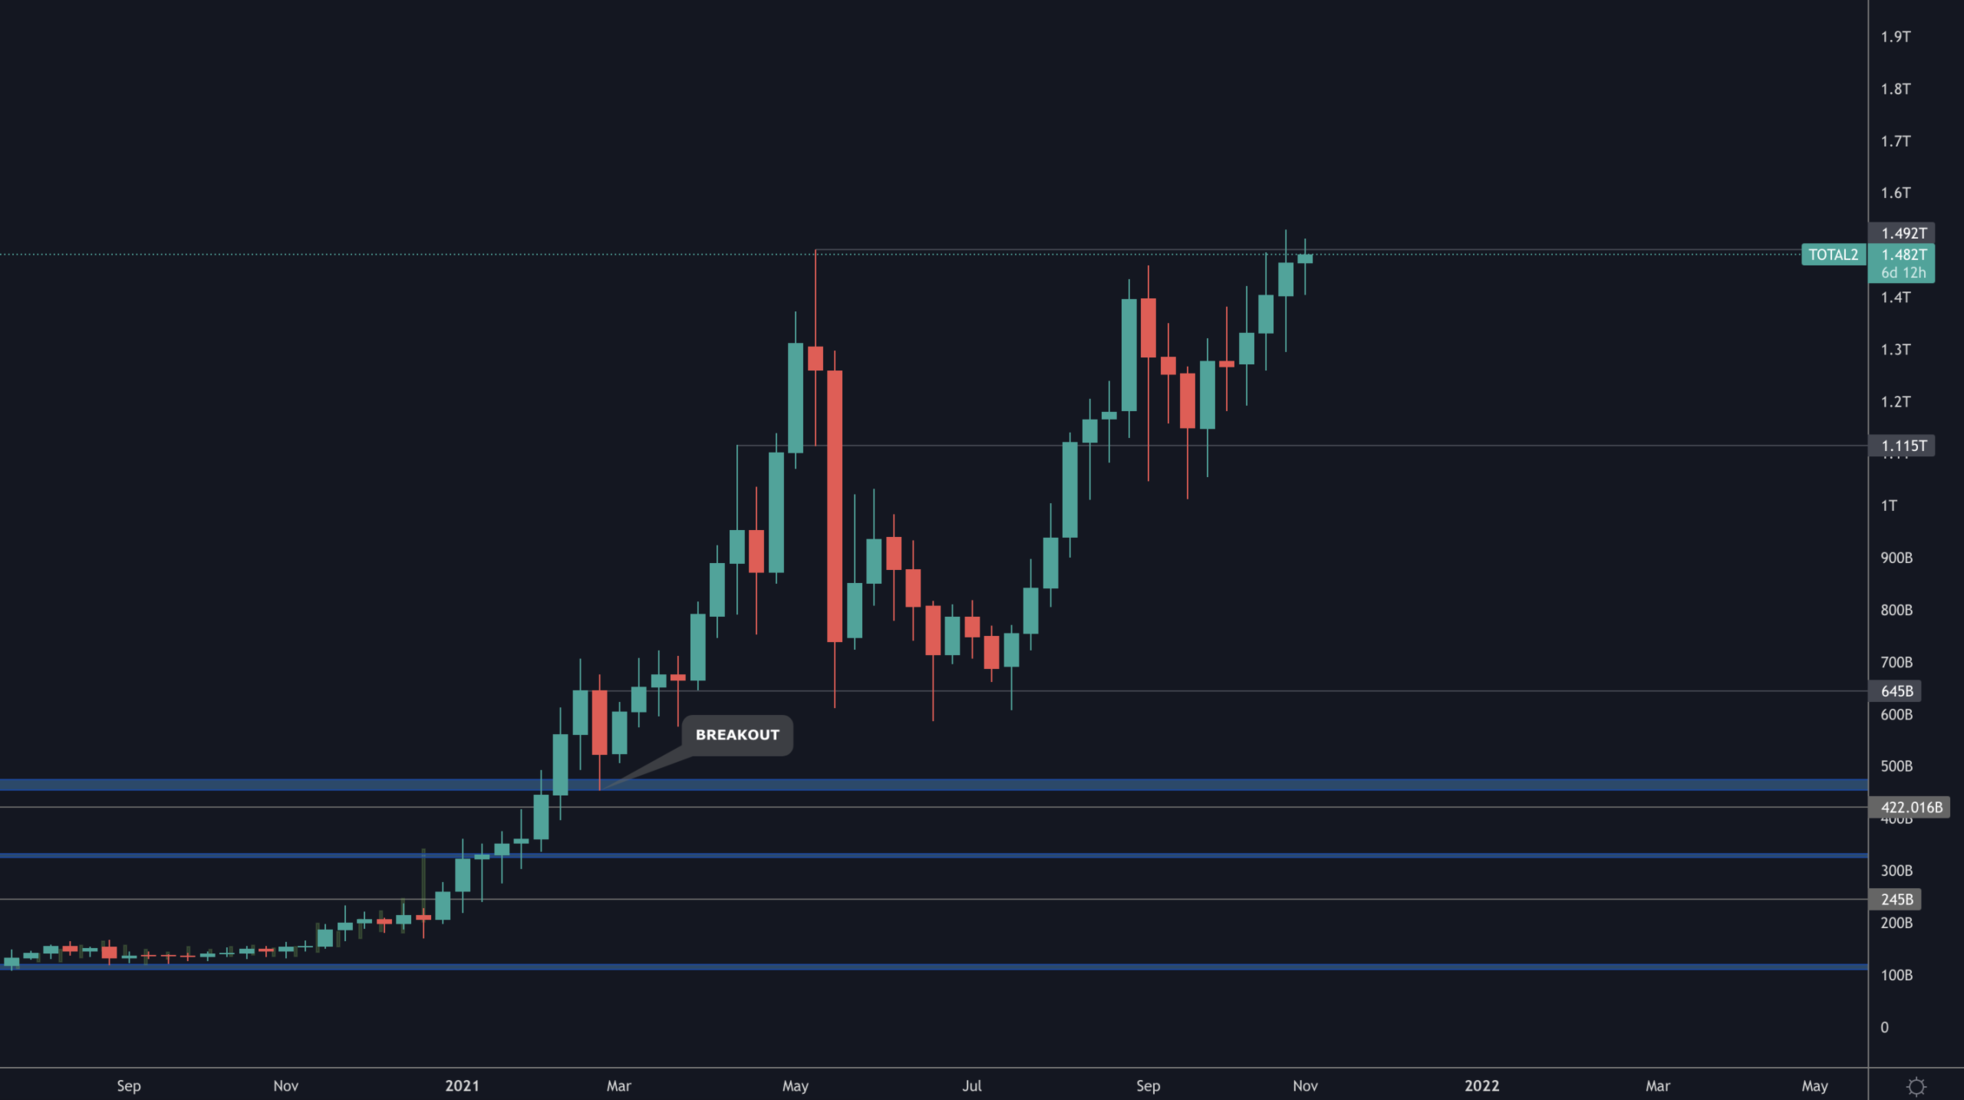
On the weekly, we can see a new high has been set. Nonetheless, a cross of $1.5T will activate a bullish cup and handle formation that targets $2.4T.
Bitcoin
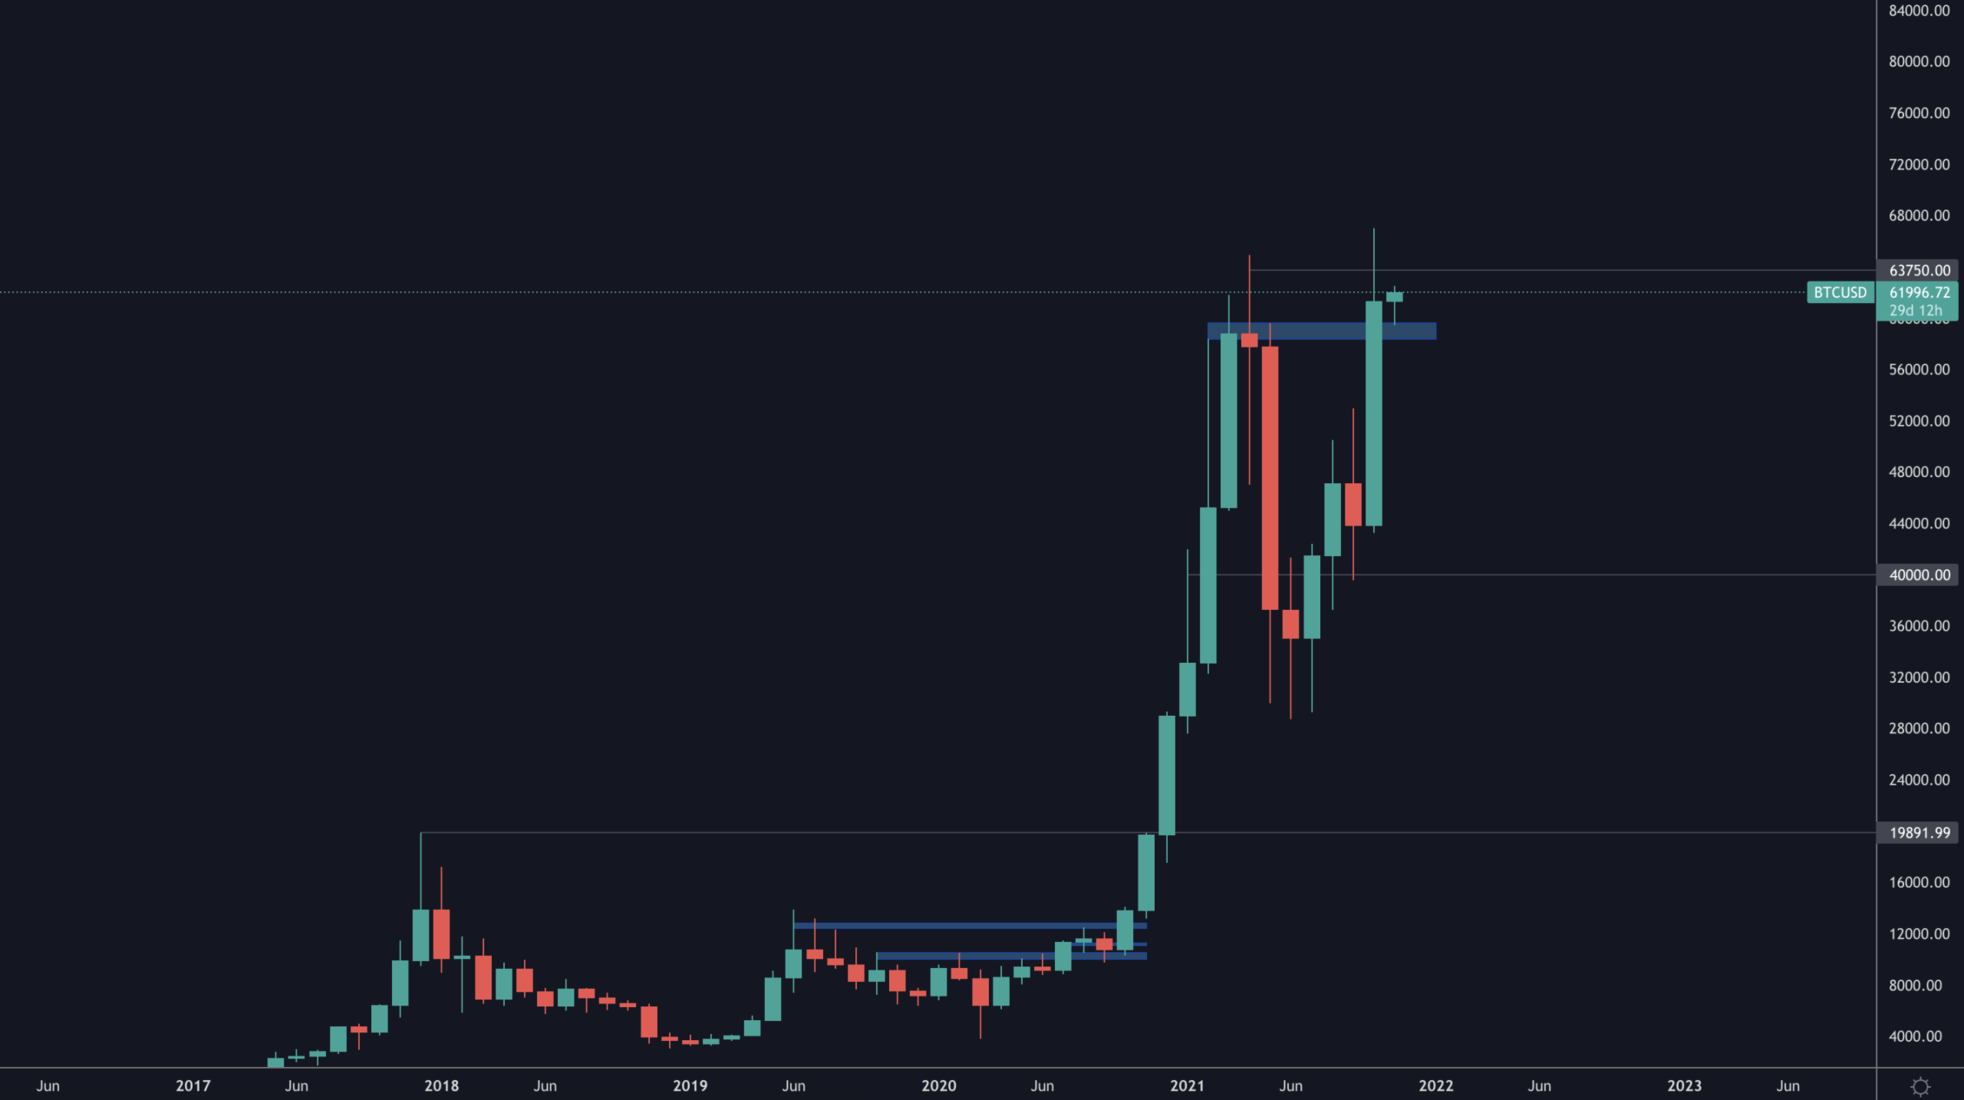
Bitcoin has officially set a new monthly high which communicates that further price discovery is likely near.
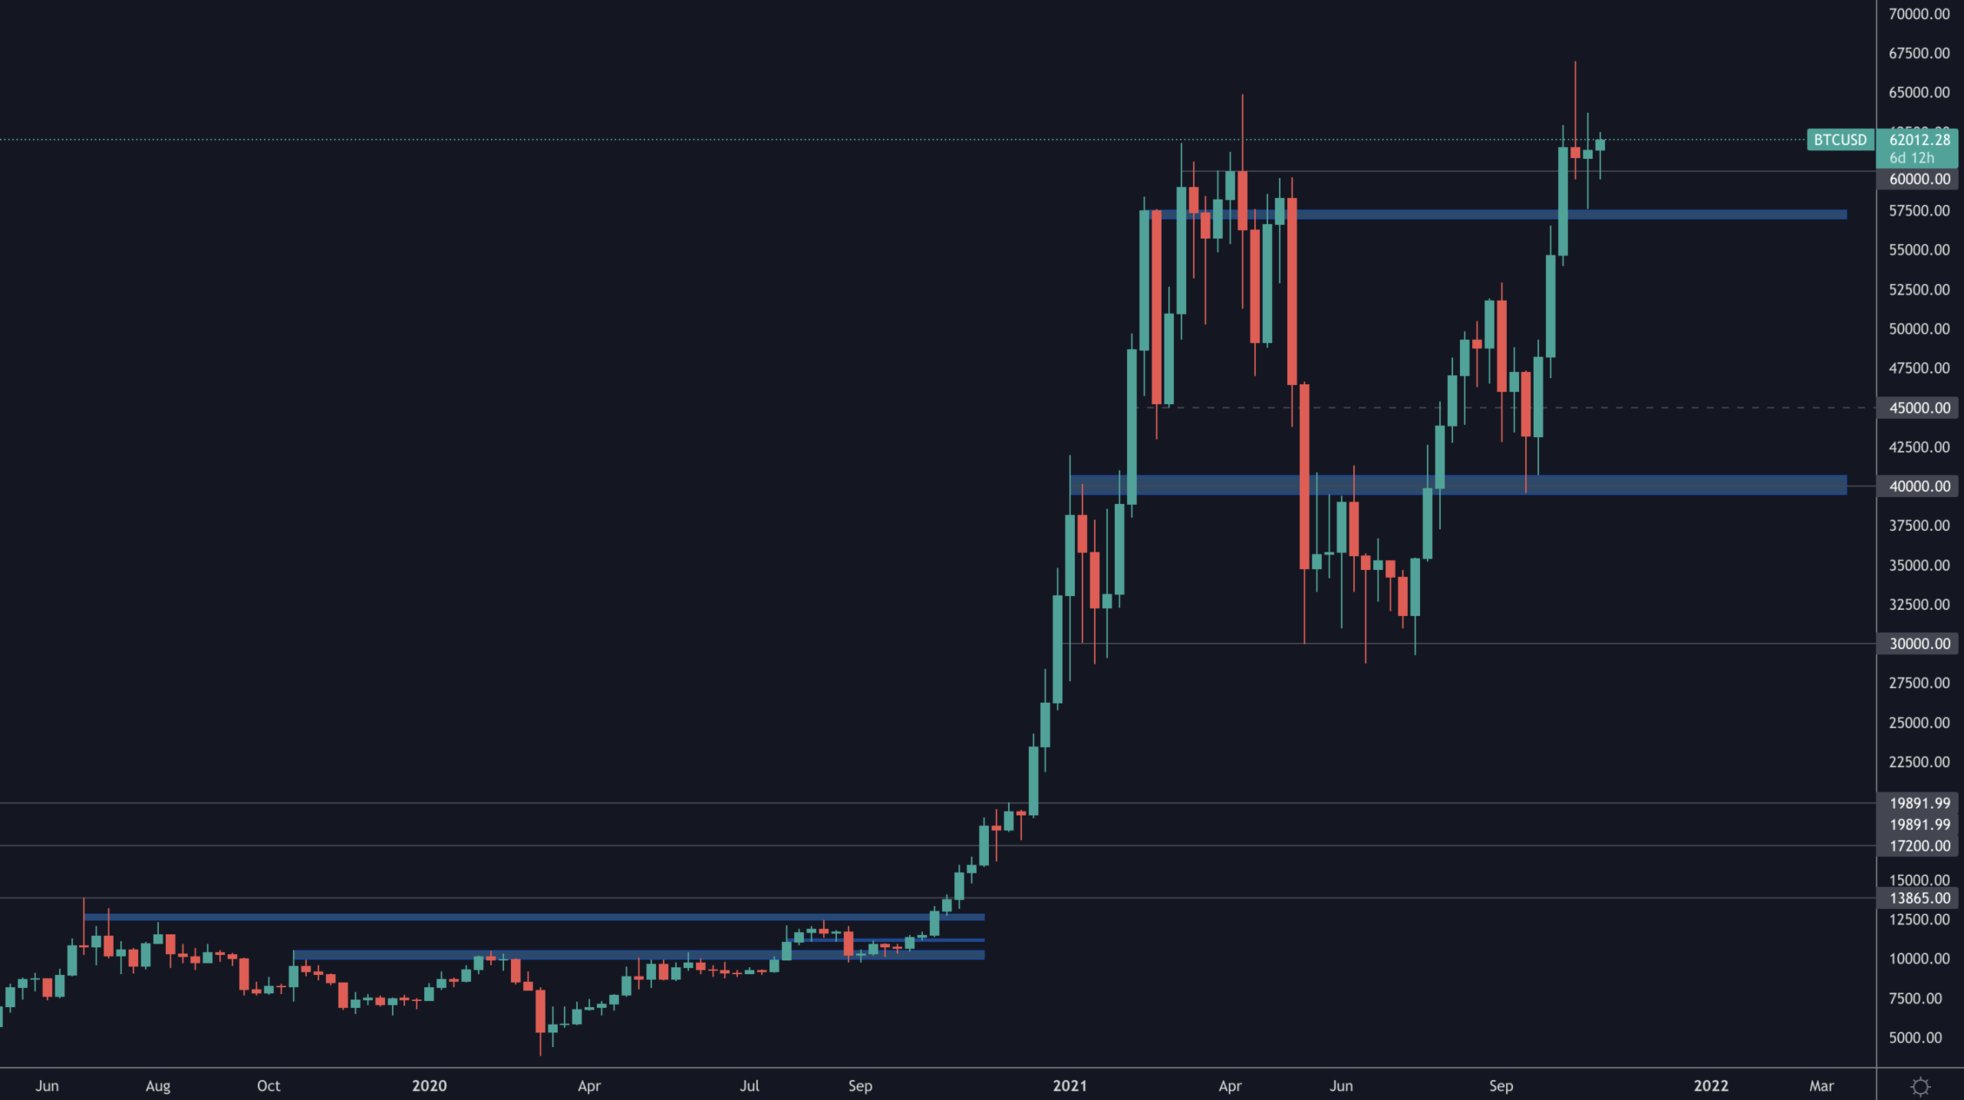
The sole requirement for BTC to remain bullish for price discovery is $60,000 holding on the weekly timeframe which it has.
Ether
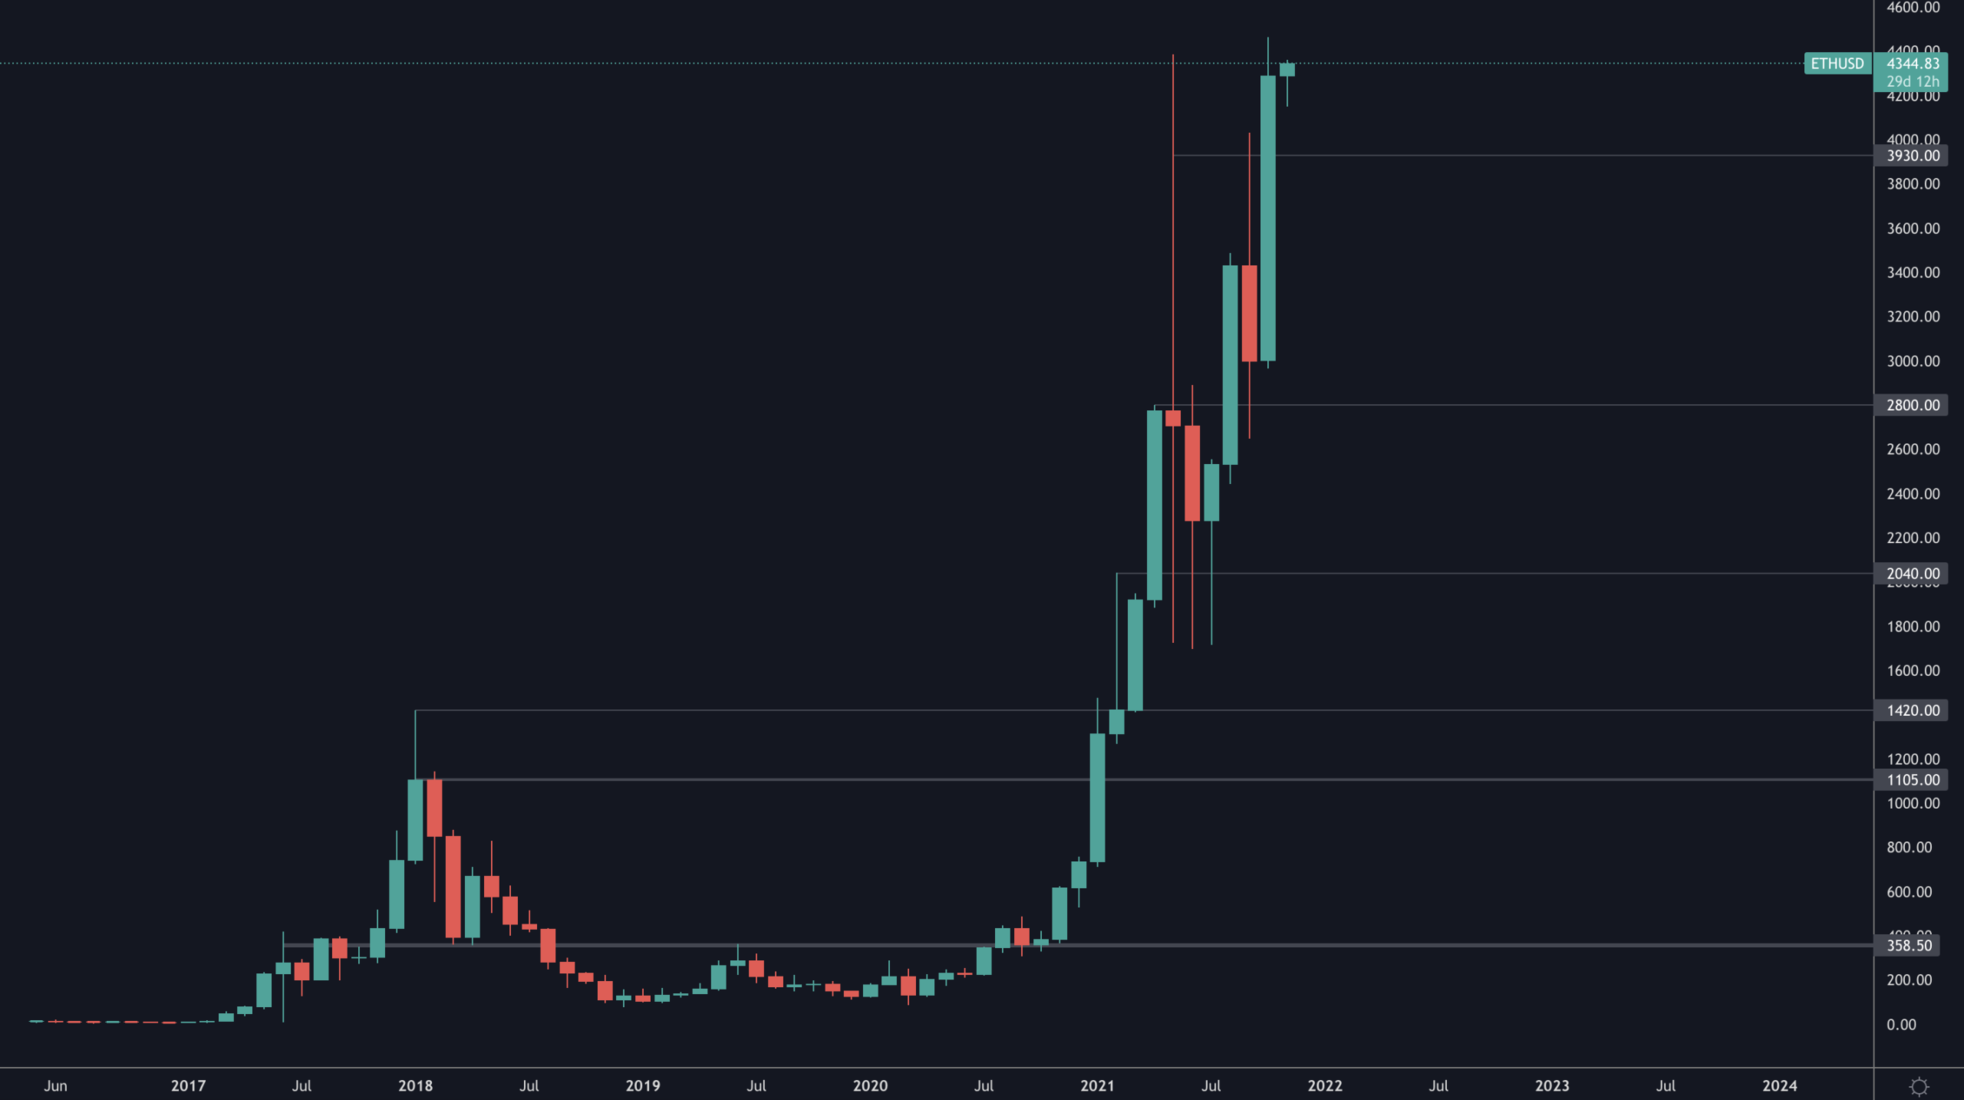
ETH continues on its bullish market structure journey on the monthly timeframe.
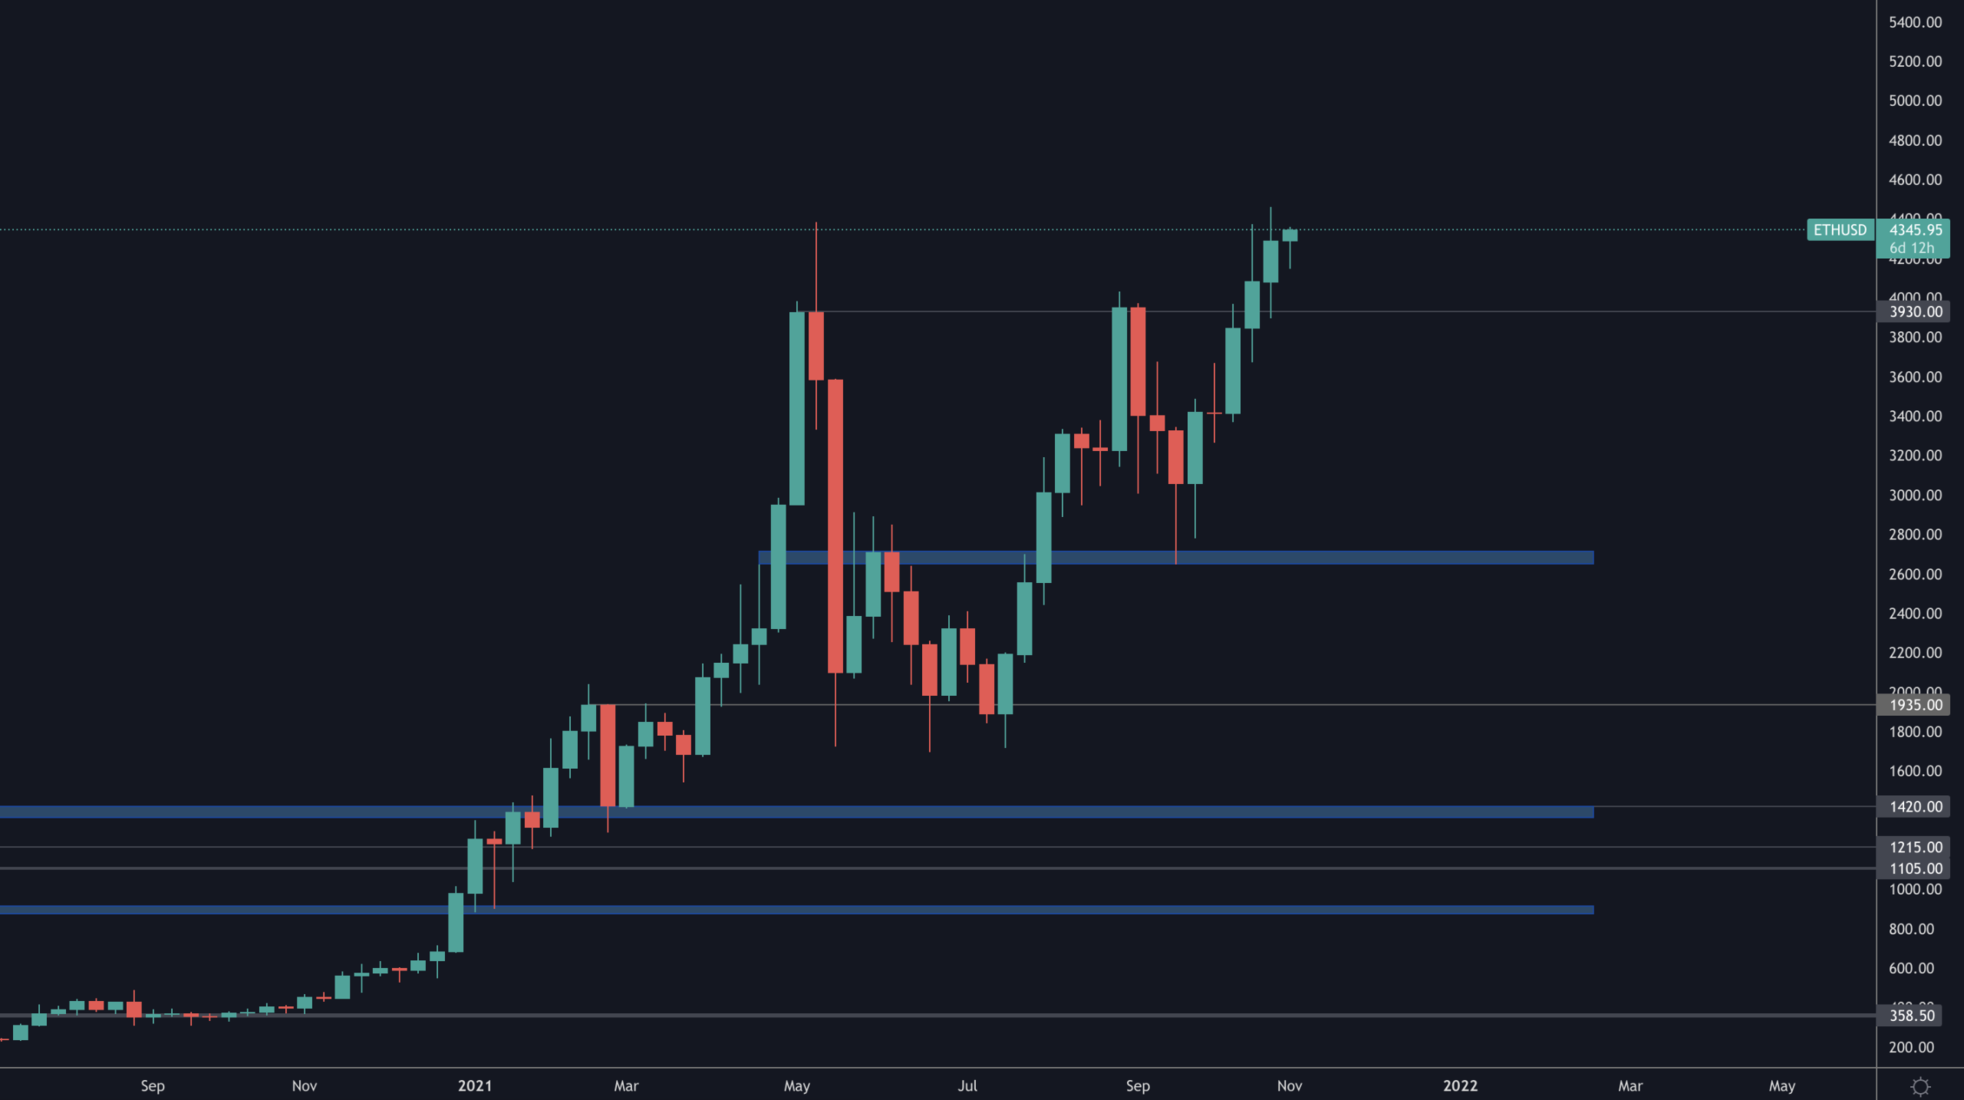
$3,950 has been perfectly turned from resistance into support and is also communicating price discovery on the horizon as long as the former level holds.
DOT
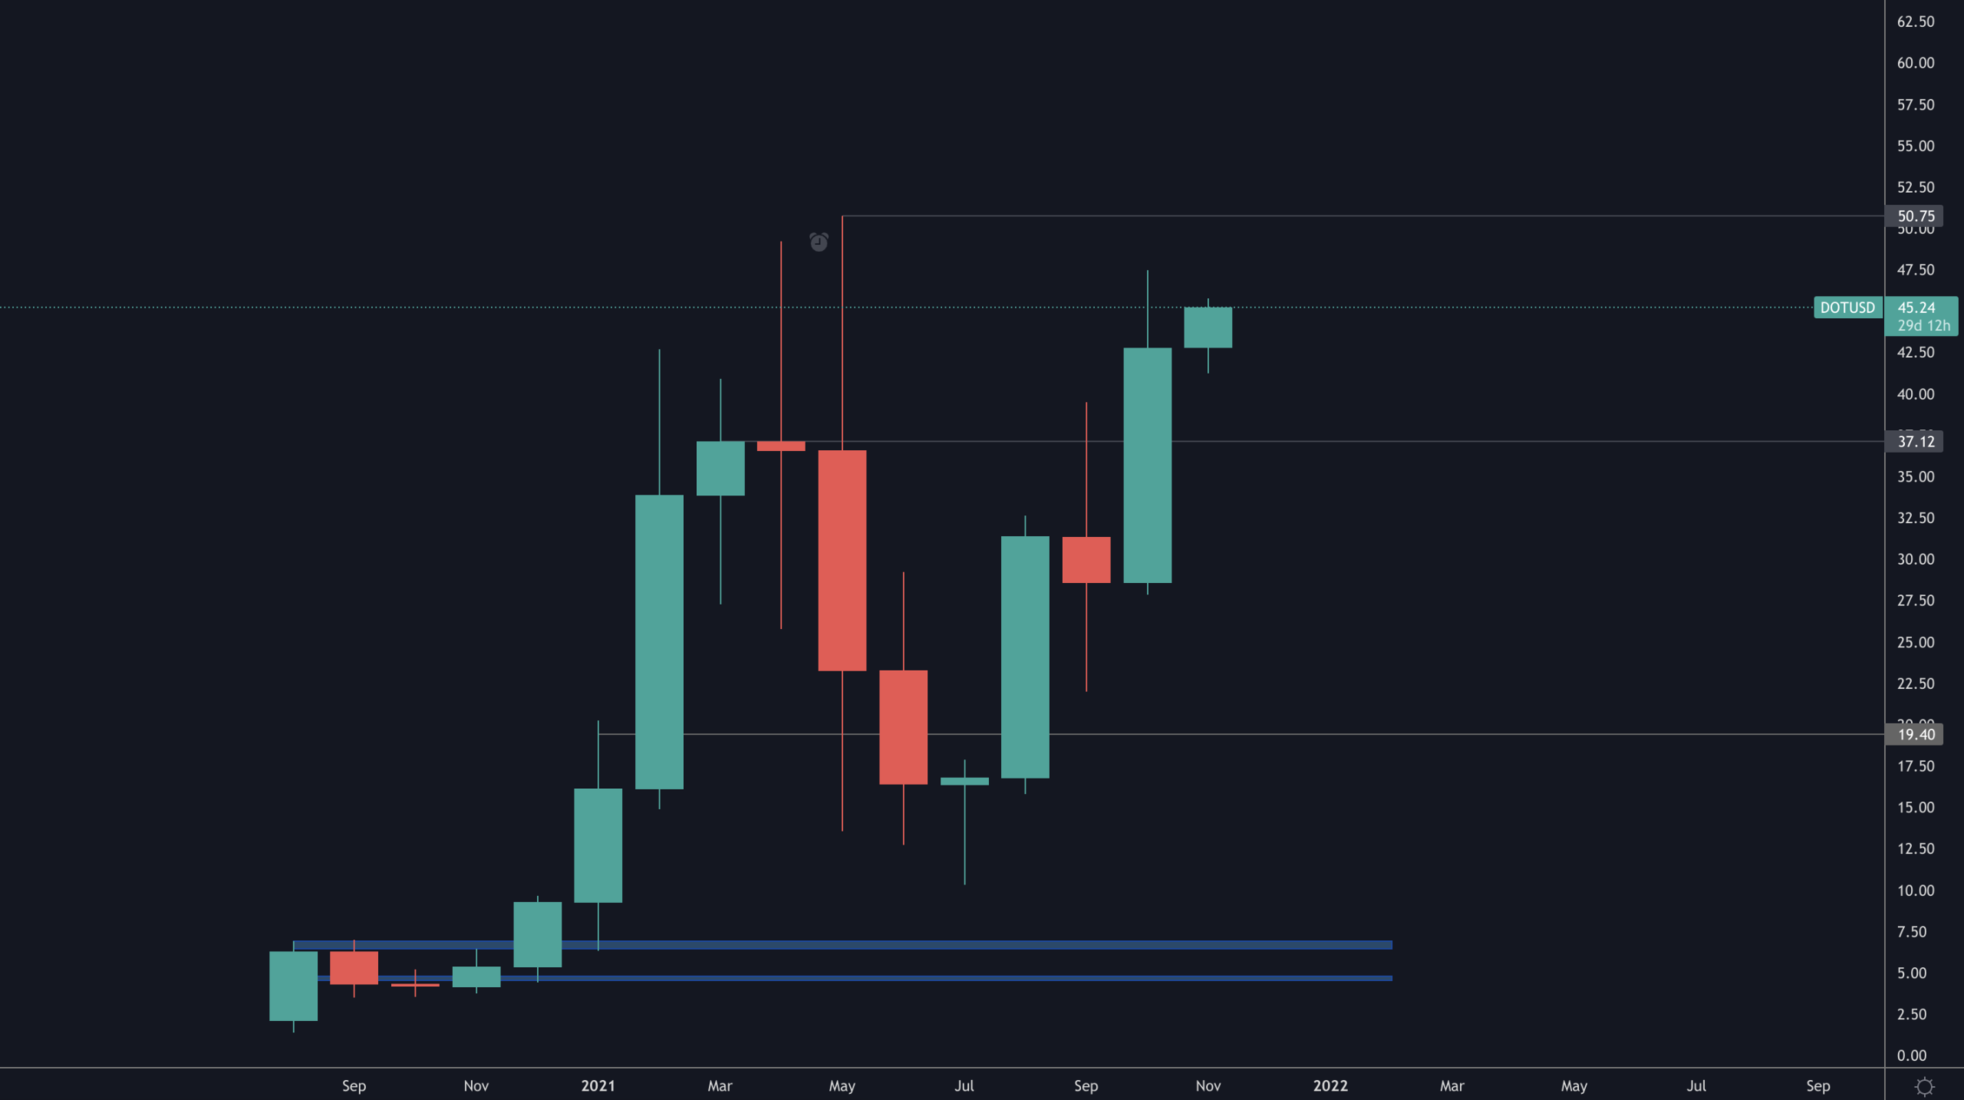
Brand new monthly high registered by DOT on the monthly, turning $37 from resistance into monthly support.
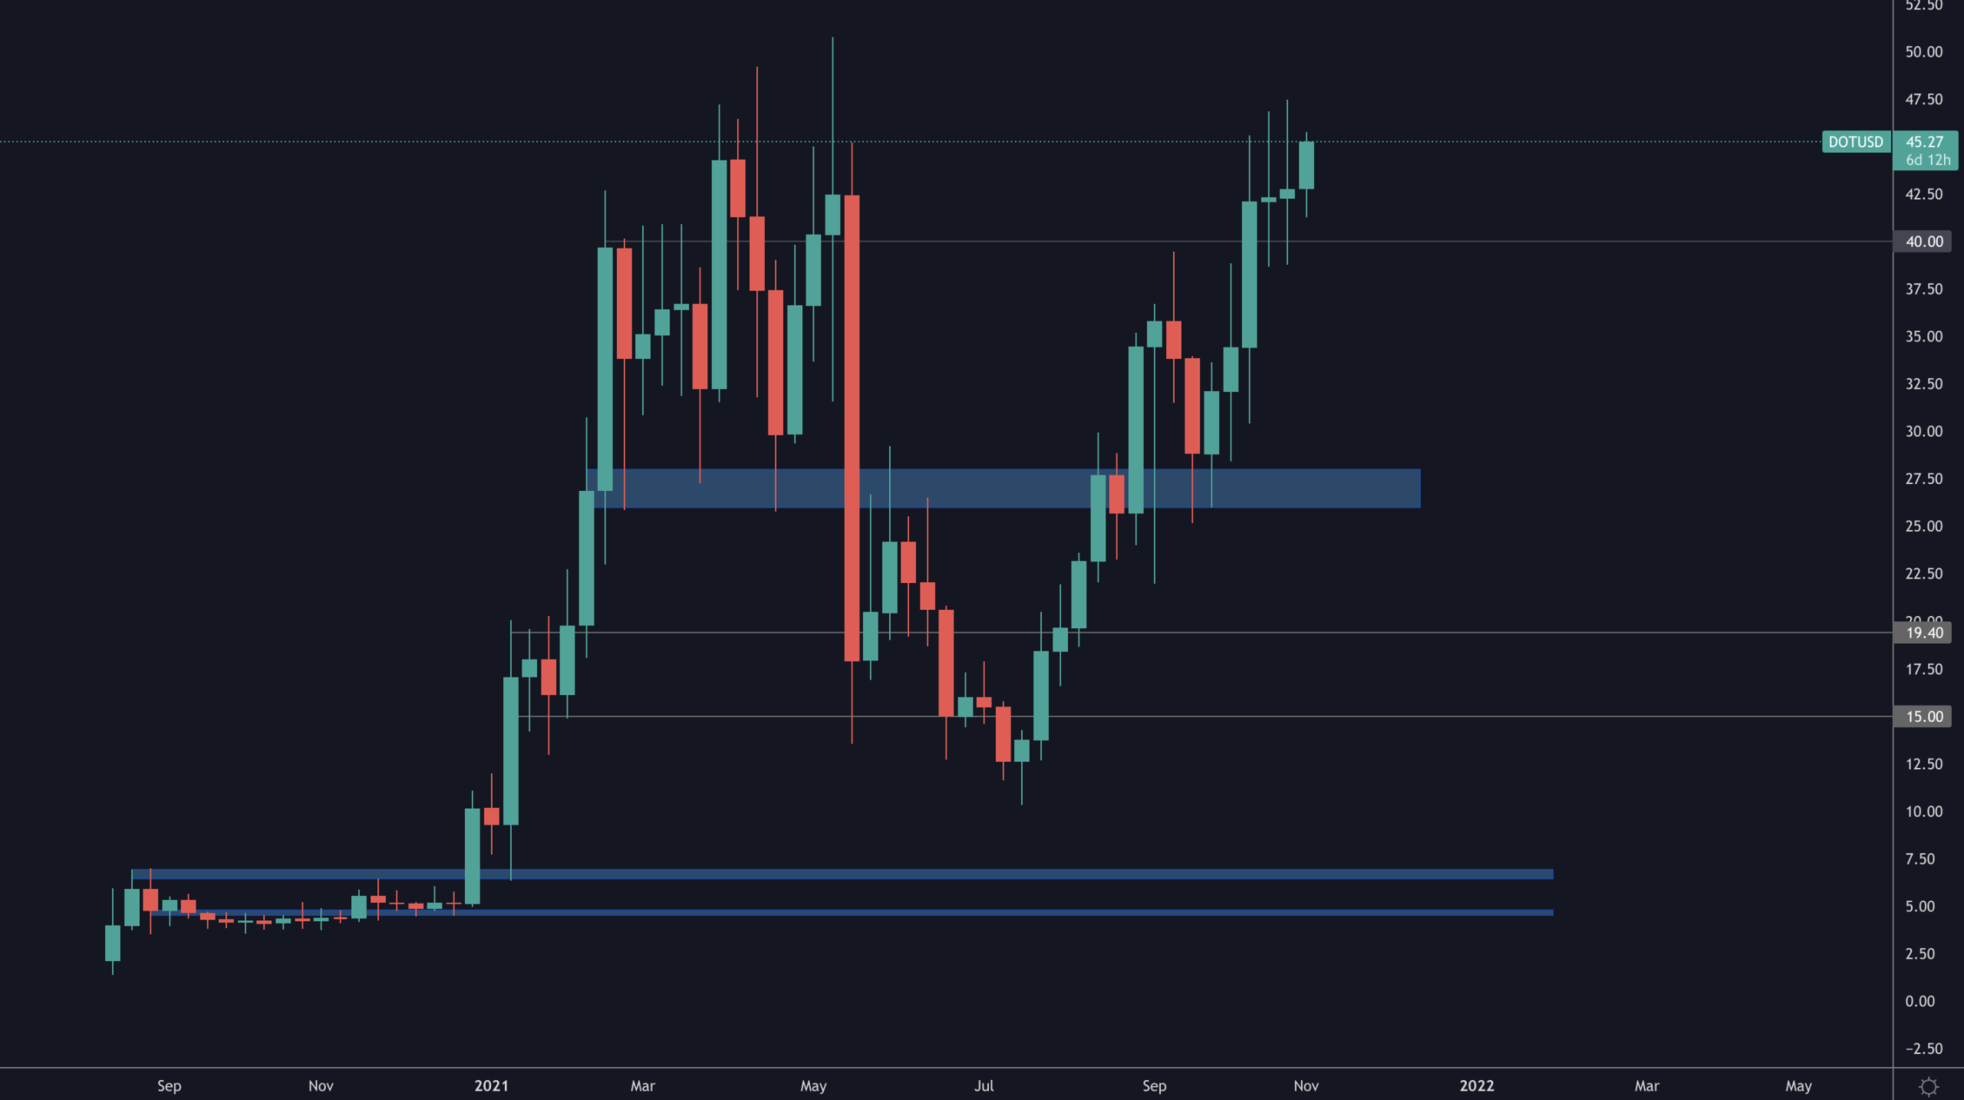
DOT holding $40 strongly as support unlike early 2021. This tells us also that price discovery is highly likely in the coming weeks.
SNX
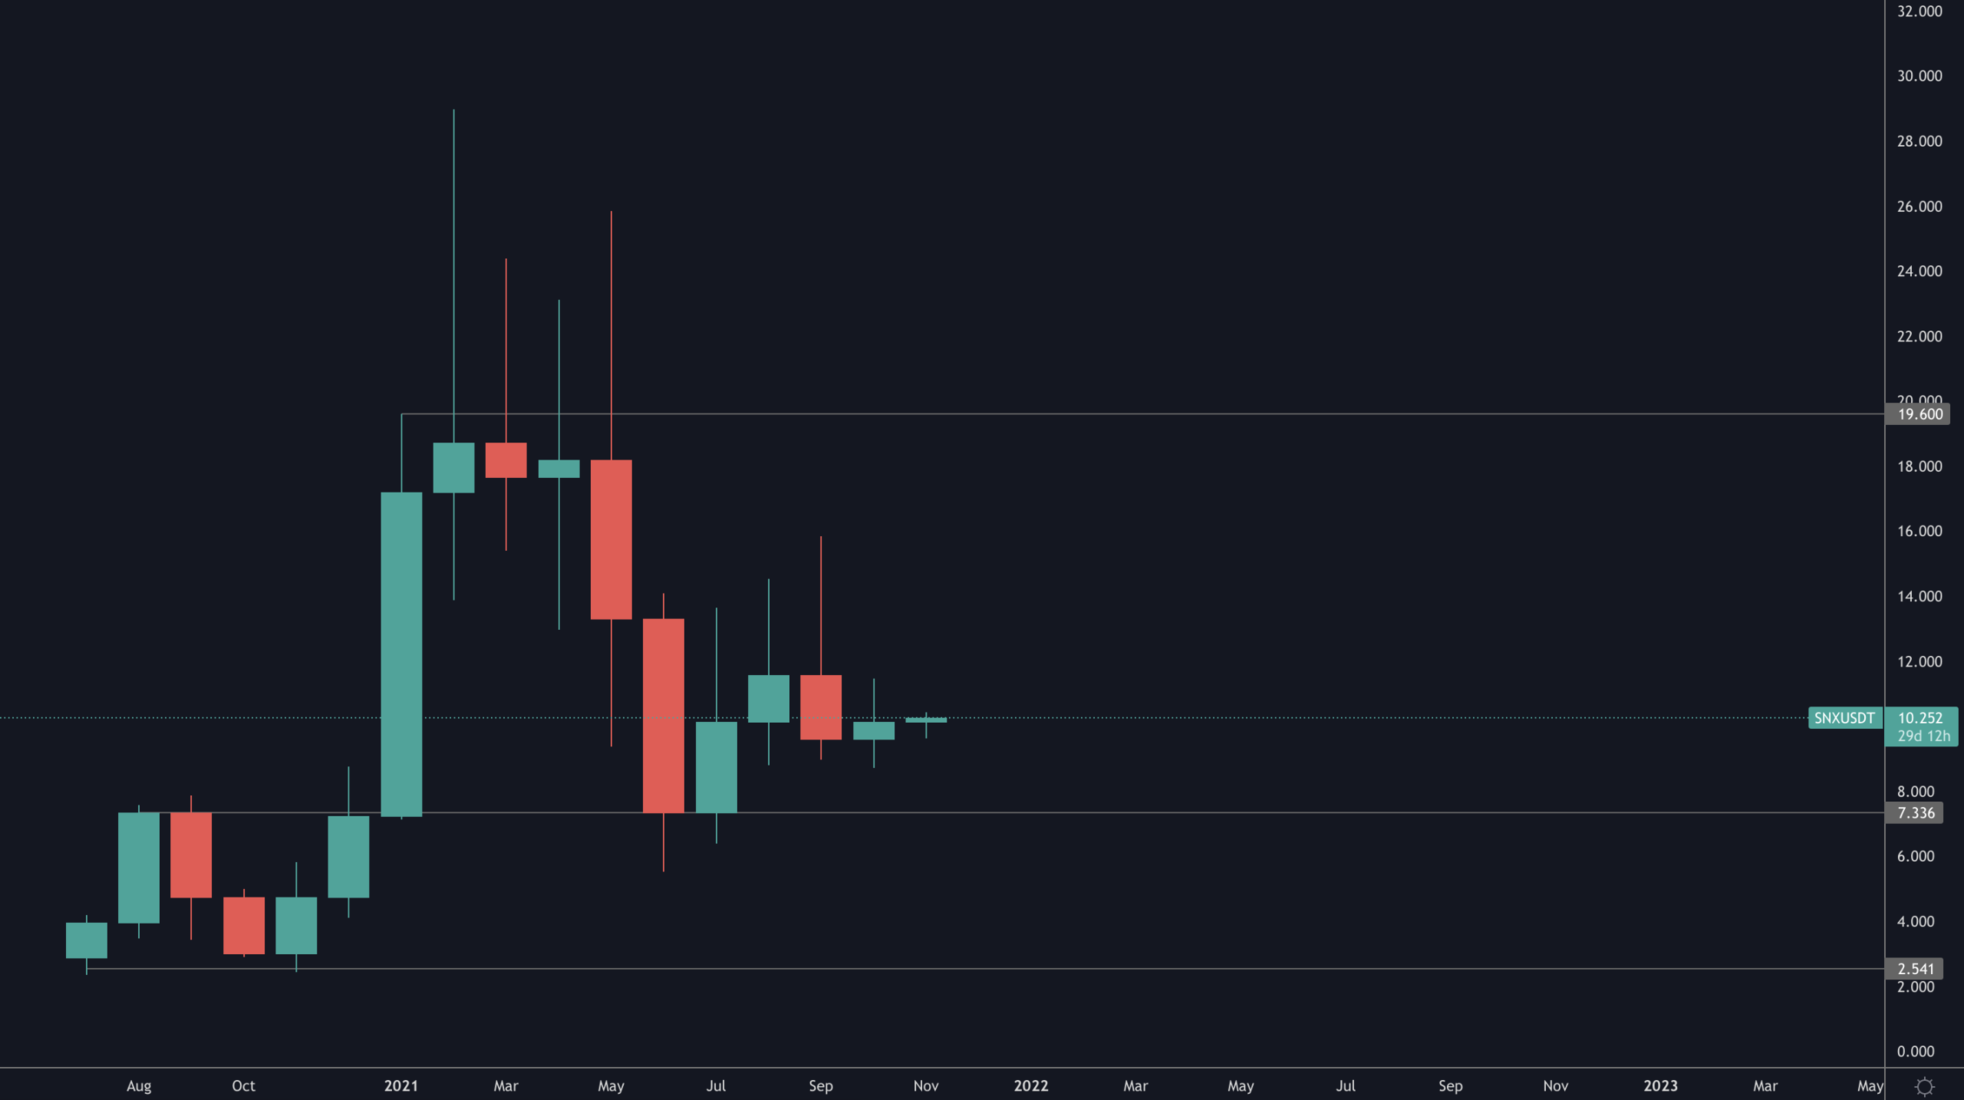
SNX's monthly timeframe simply tells us $7.50 is support and $20 is up next.
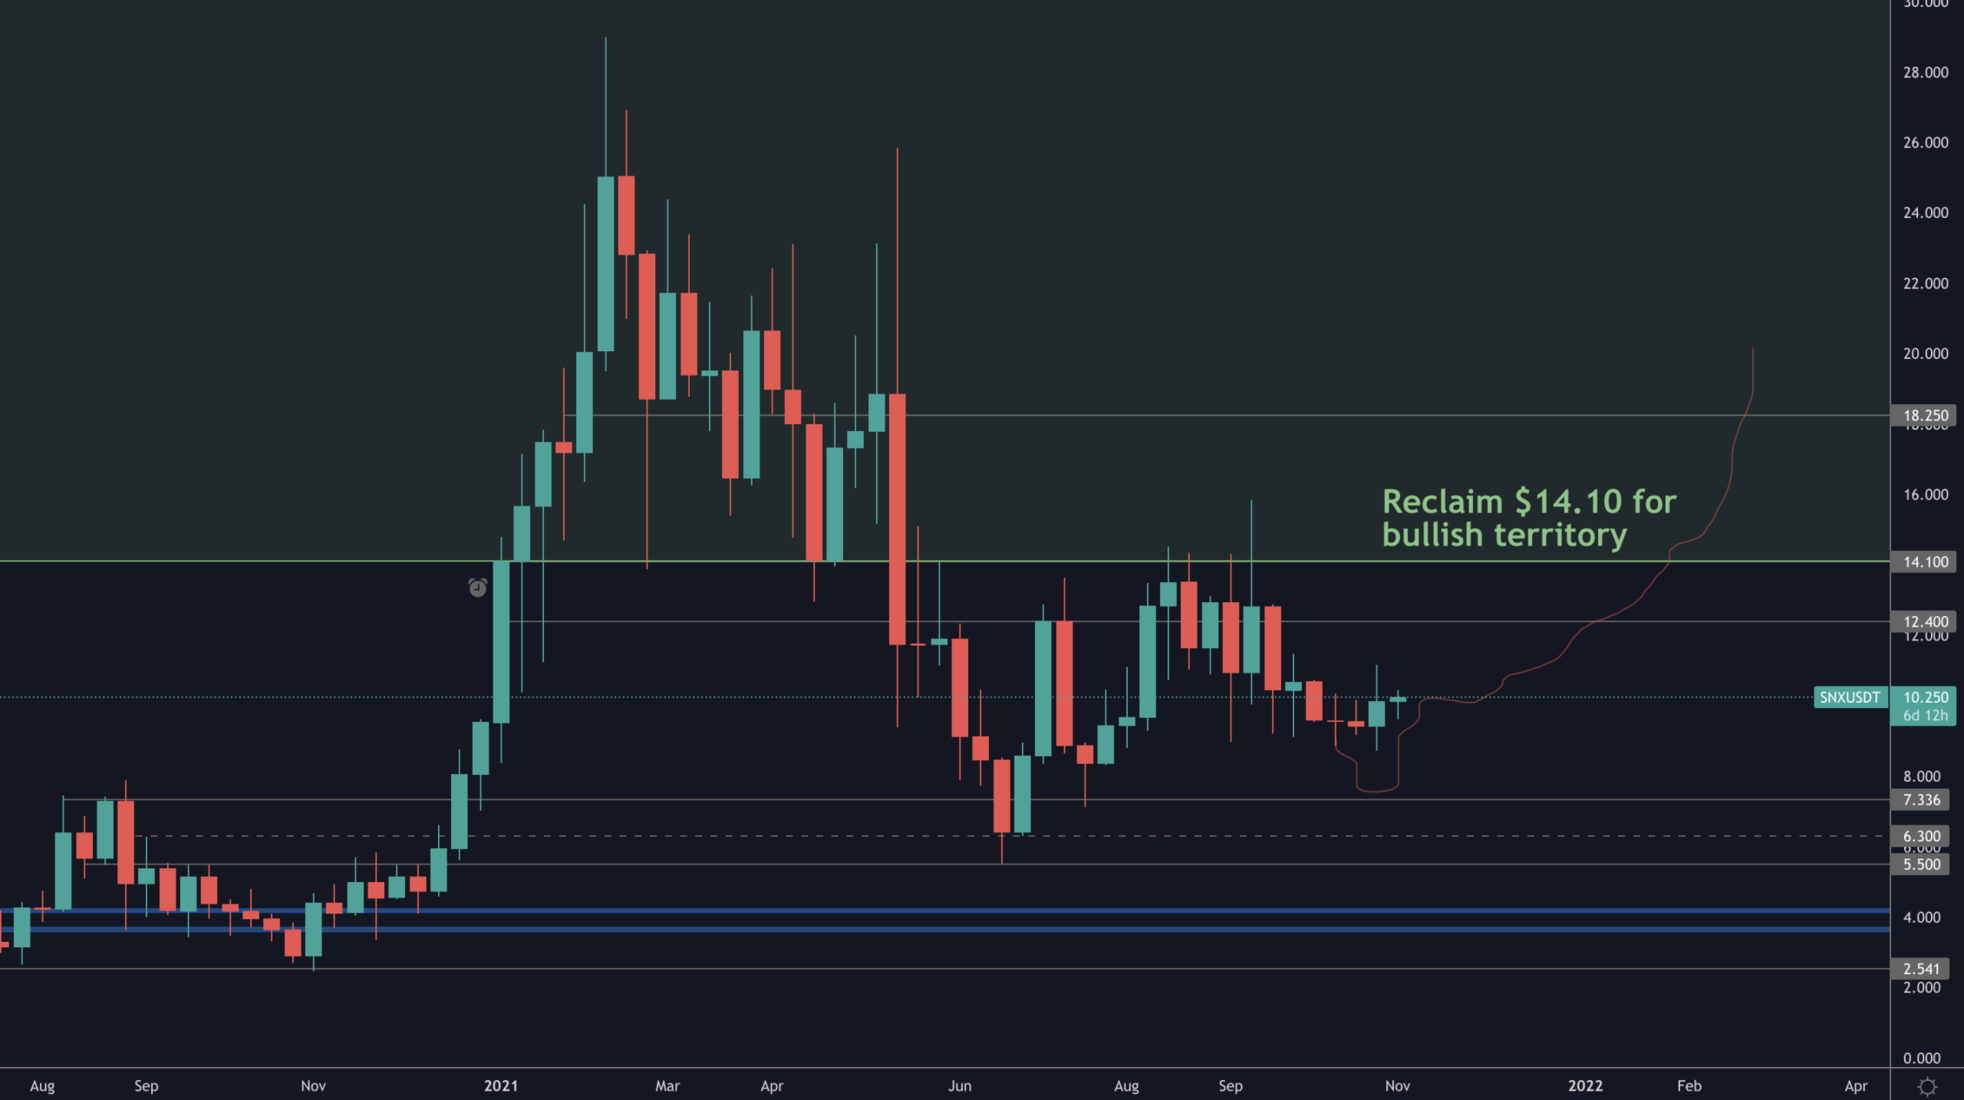
The weekly communicates a clearer image and states that SNX remains in bearish territory and would only become interesting at:
- $7.50 test
- $14.10 weekly reclaim into bullish territory
RUNE
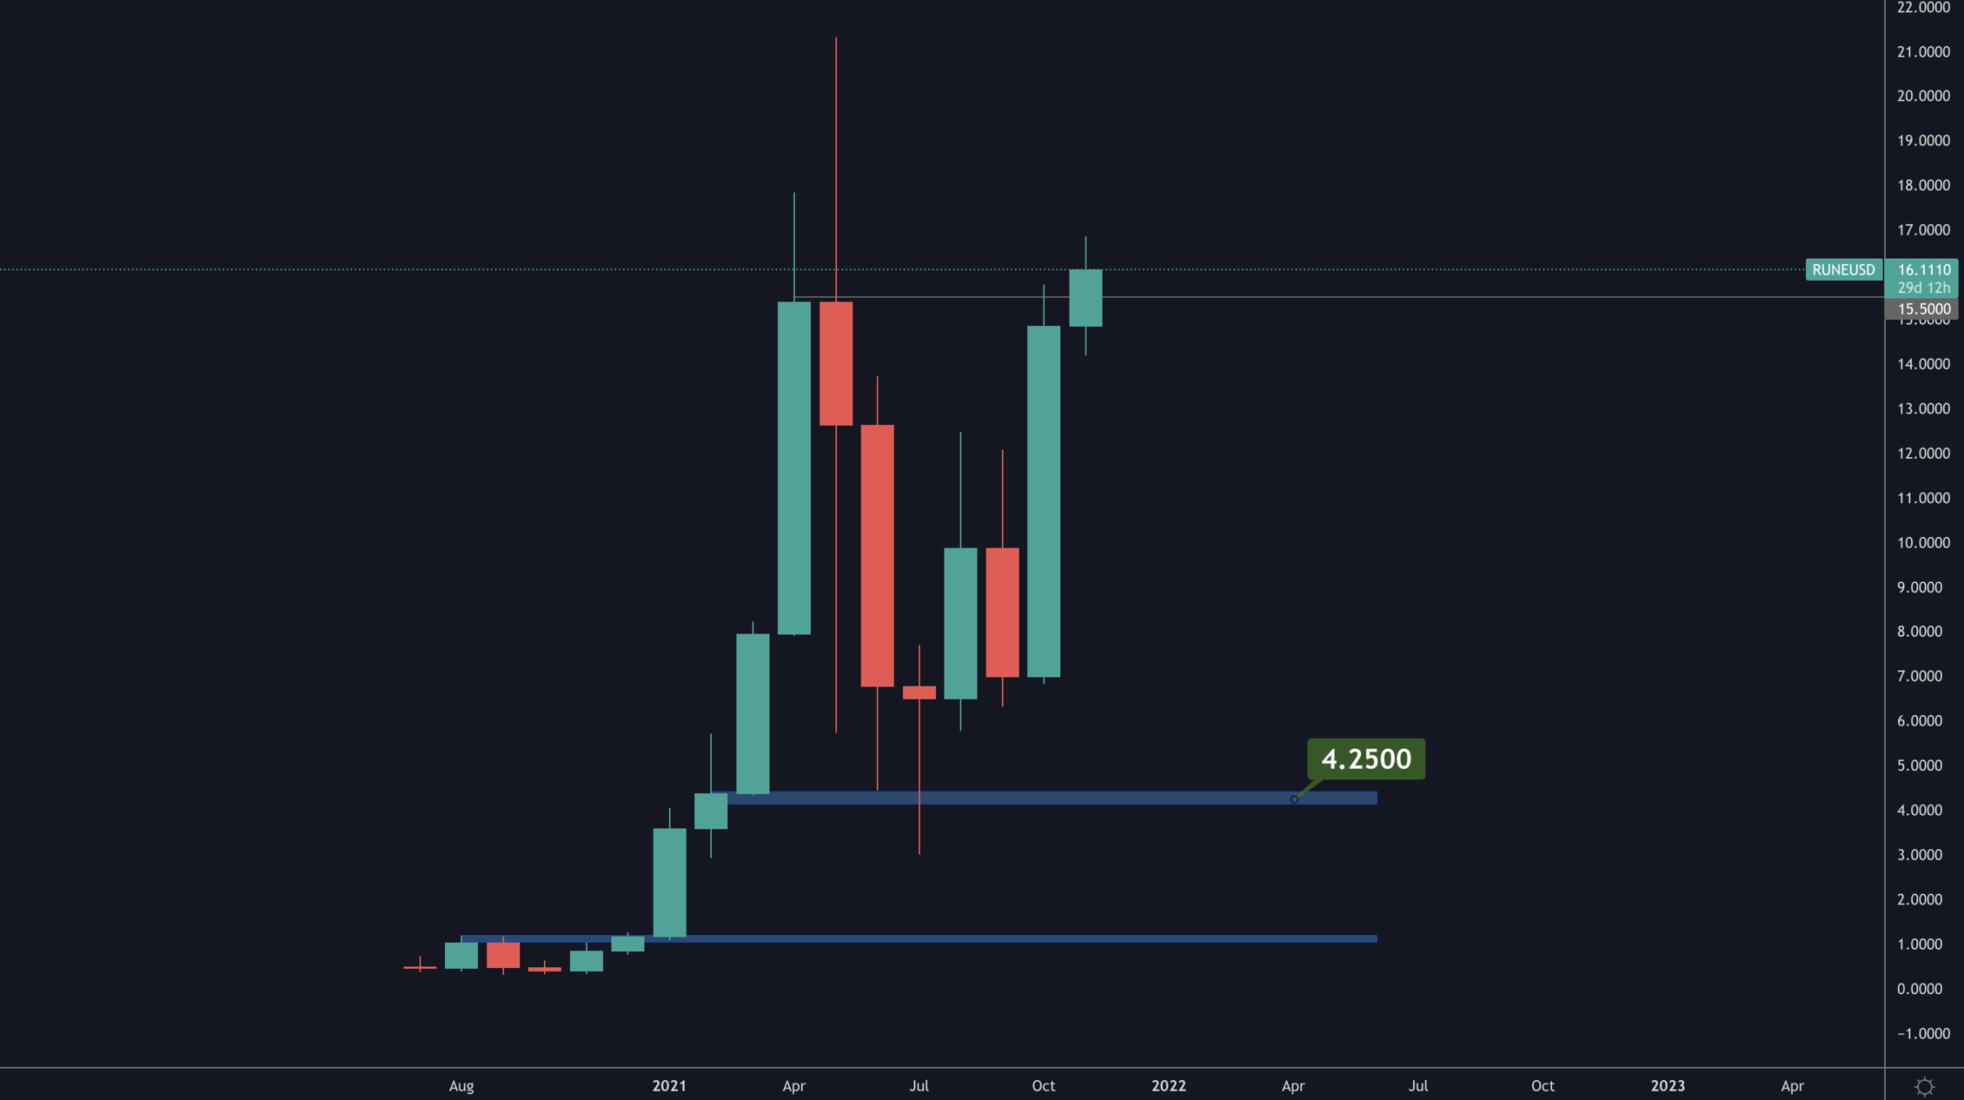
RUNE closed under the $15.50 monthly resistance but has registered a massive bullish engulfing candle on the monthly.
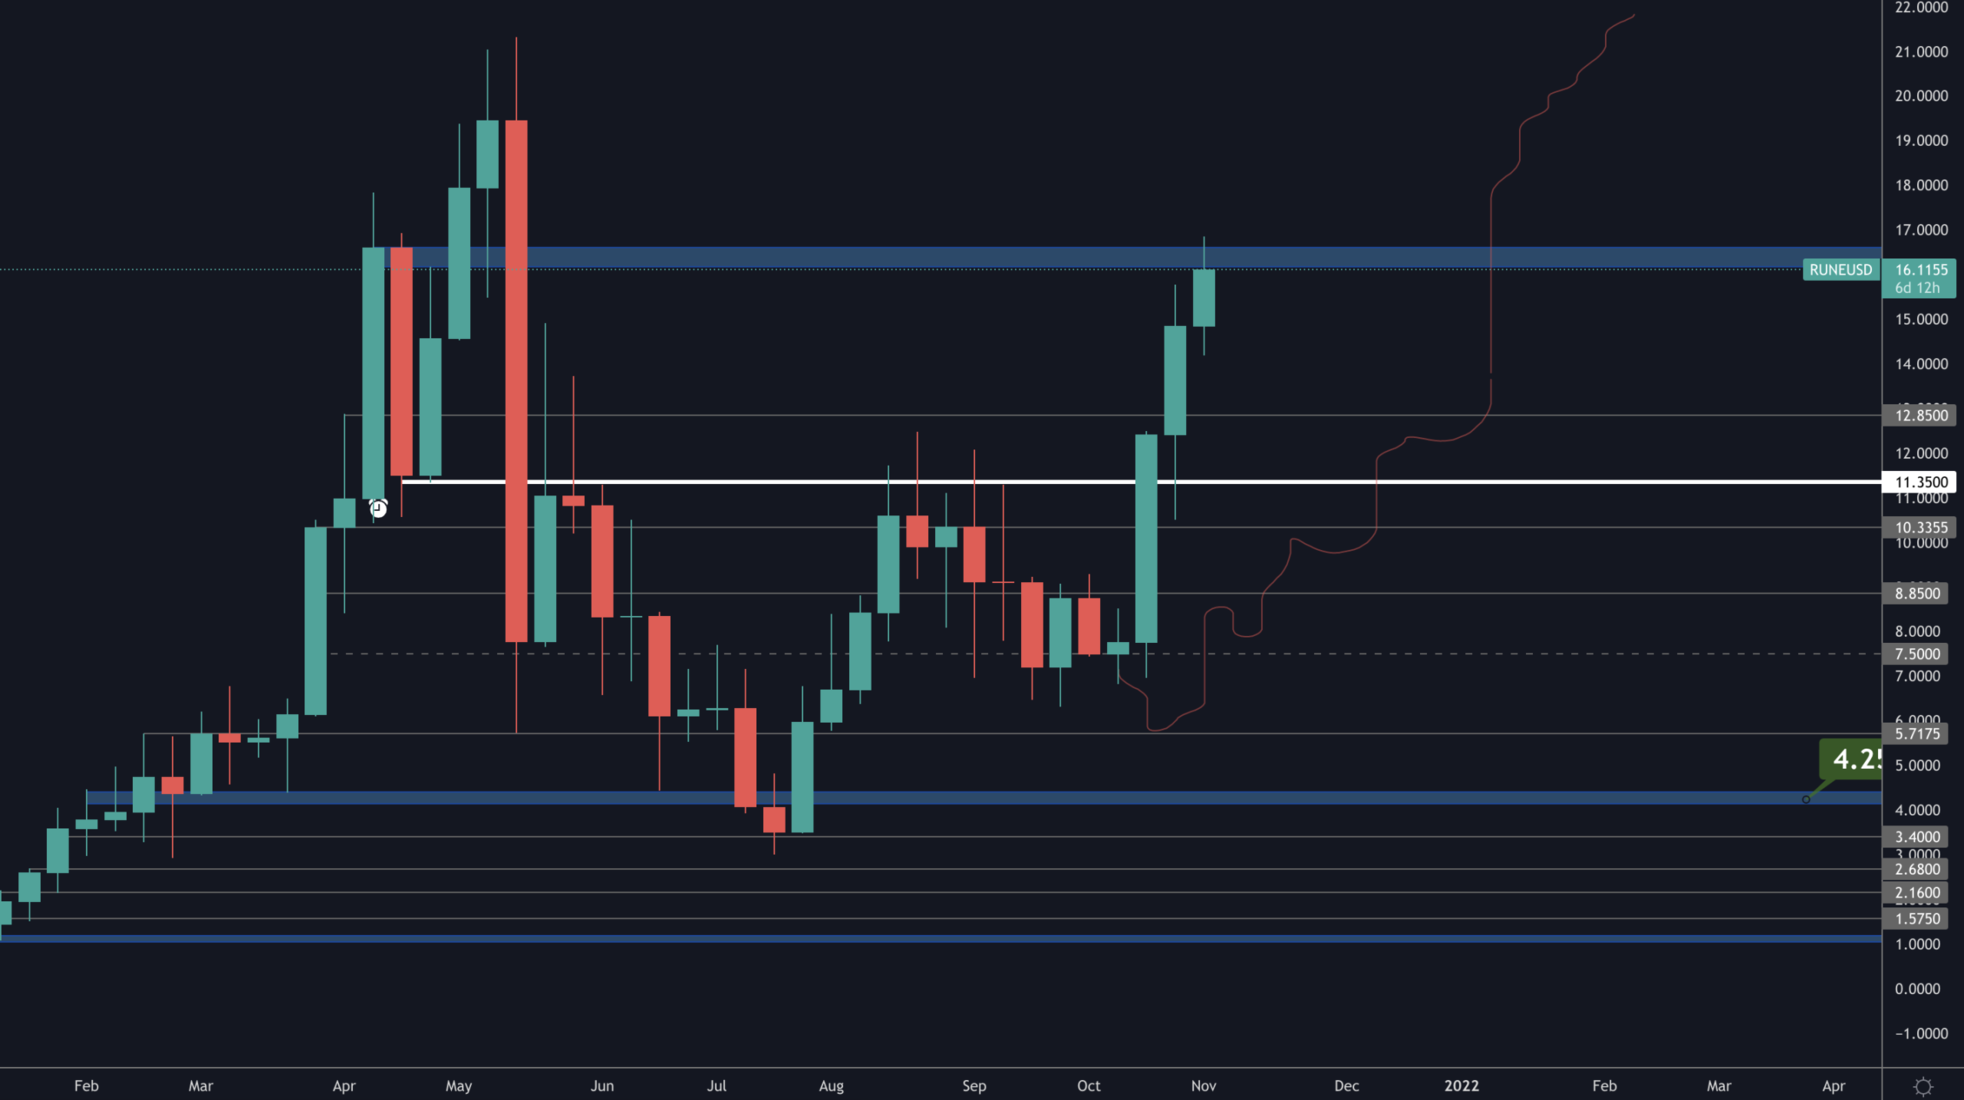
Currently at the $16.50 resistance but to us the only short-term target in sight is $21 since it re-entered into bullish territory.
SOL
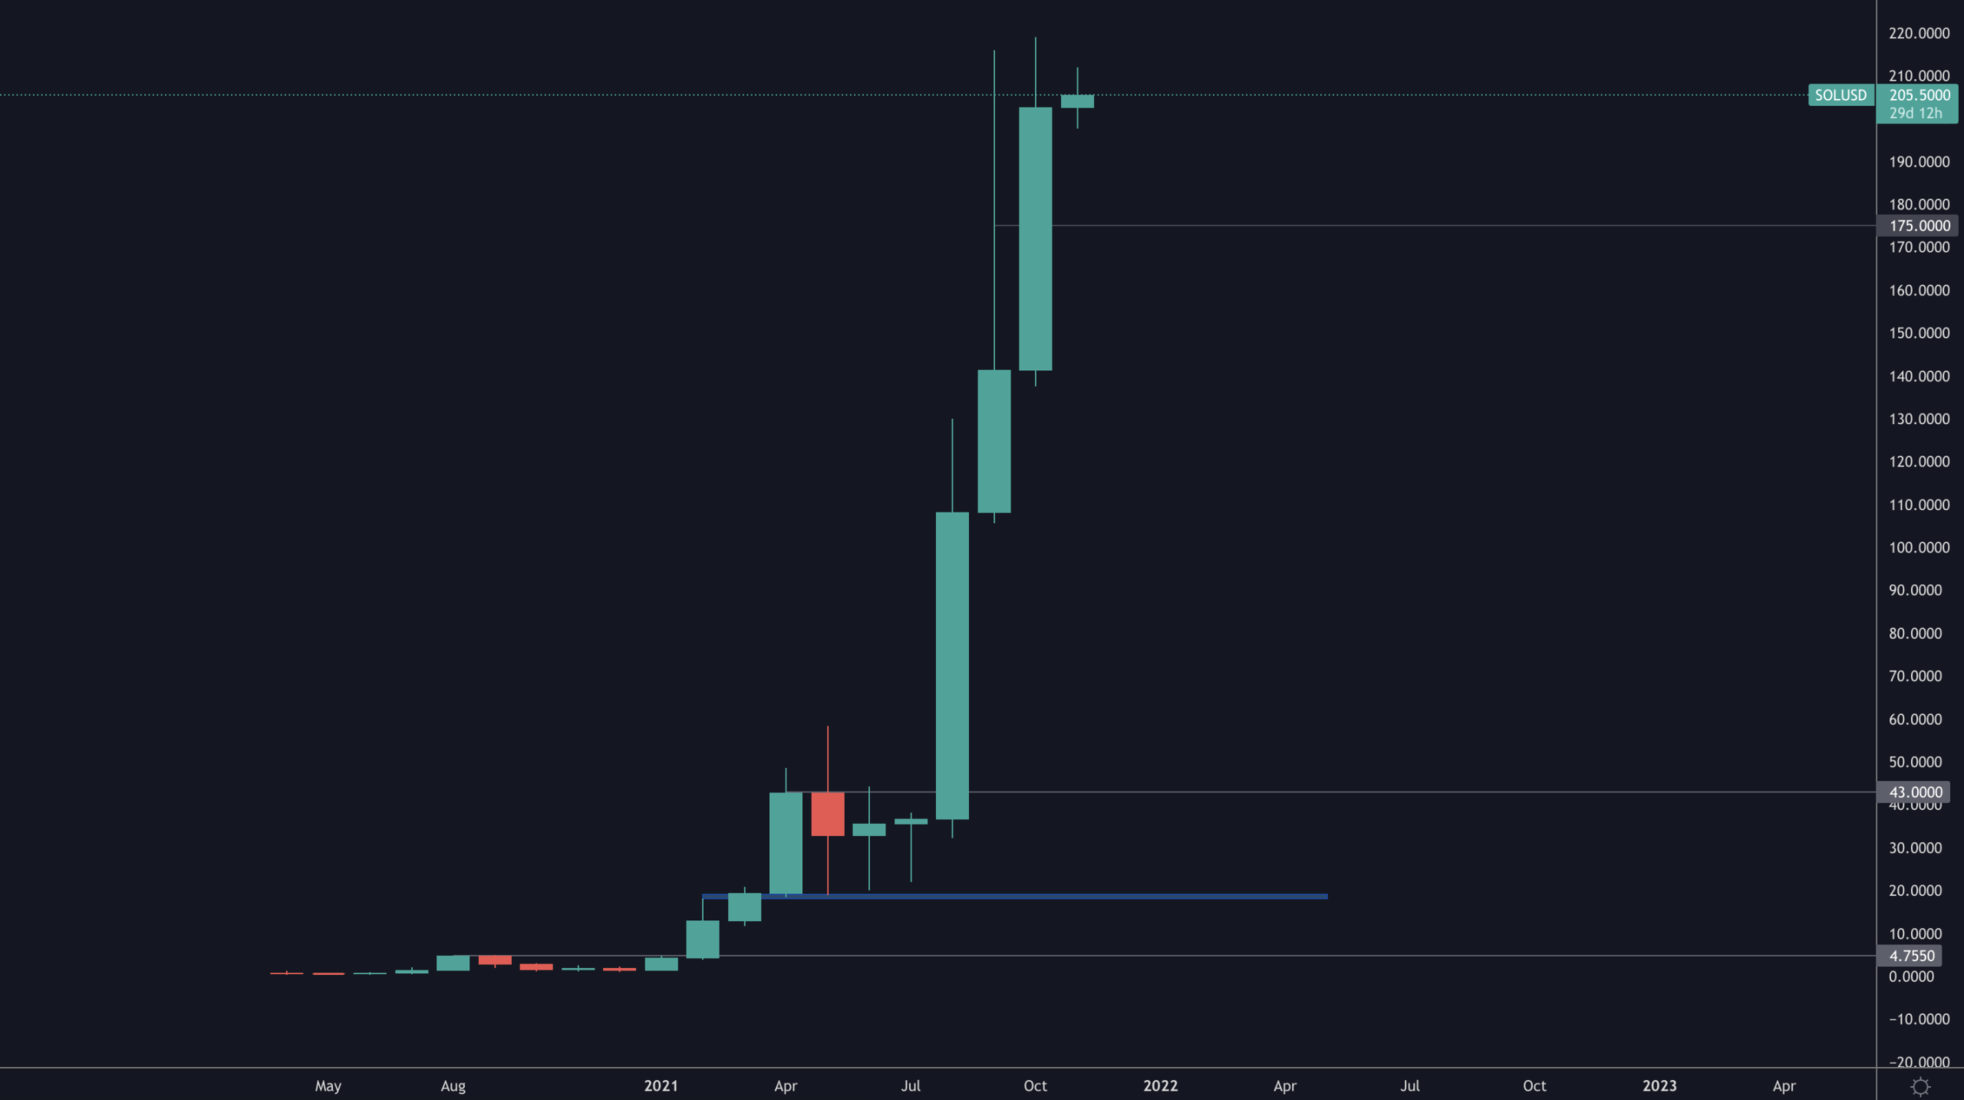
Pure verticalness with little to analyse. However, the reclaim of lost ground from September sets a bullish tone.
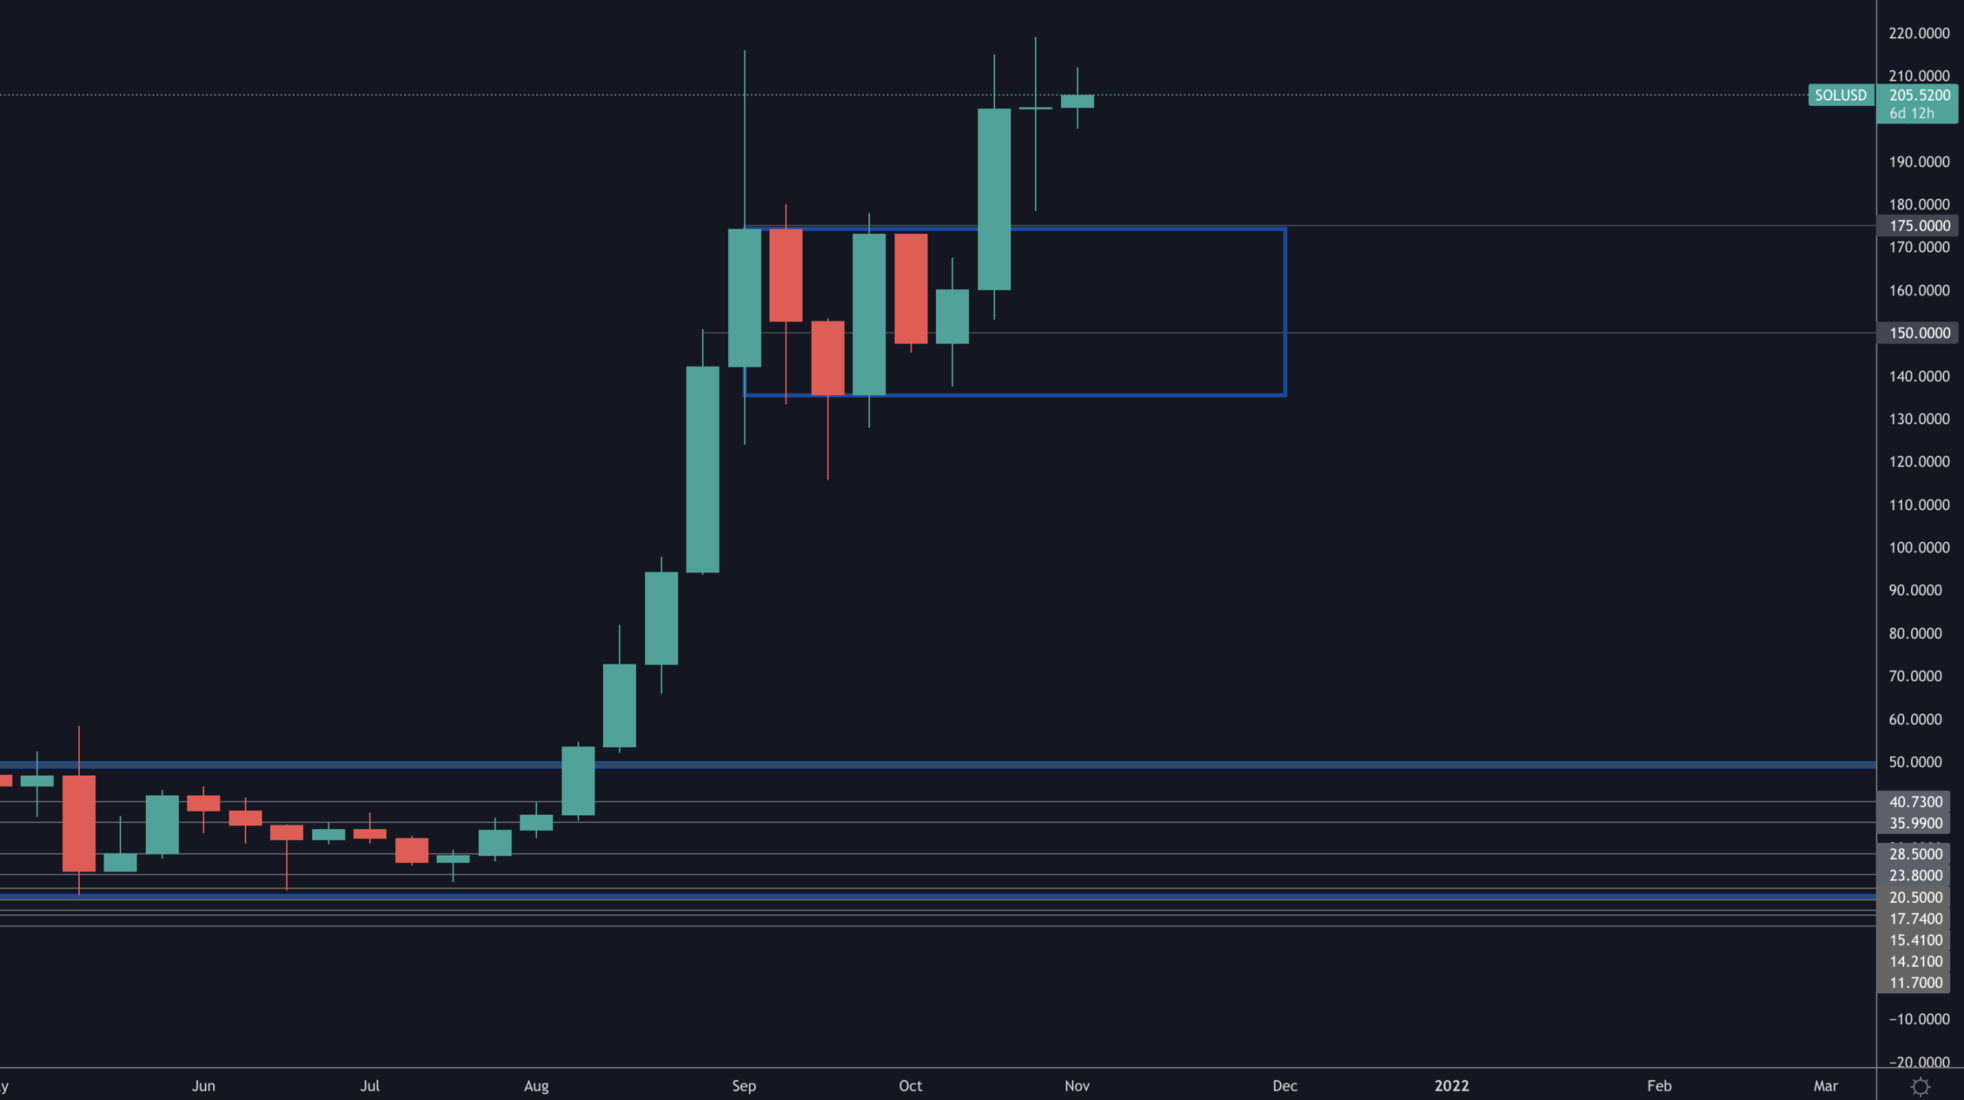
Weekly breakout and retest from the [$135-$175] range which communicates upcoming price discovery as long as that breakout remains valid.
SRM
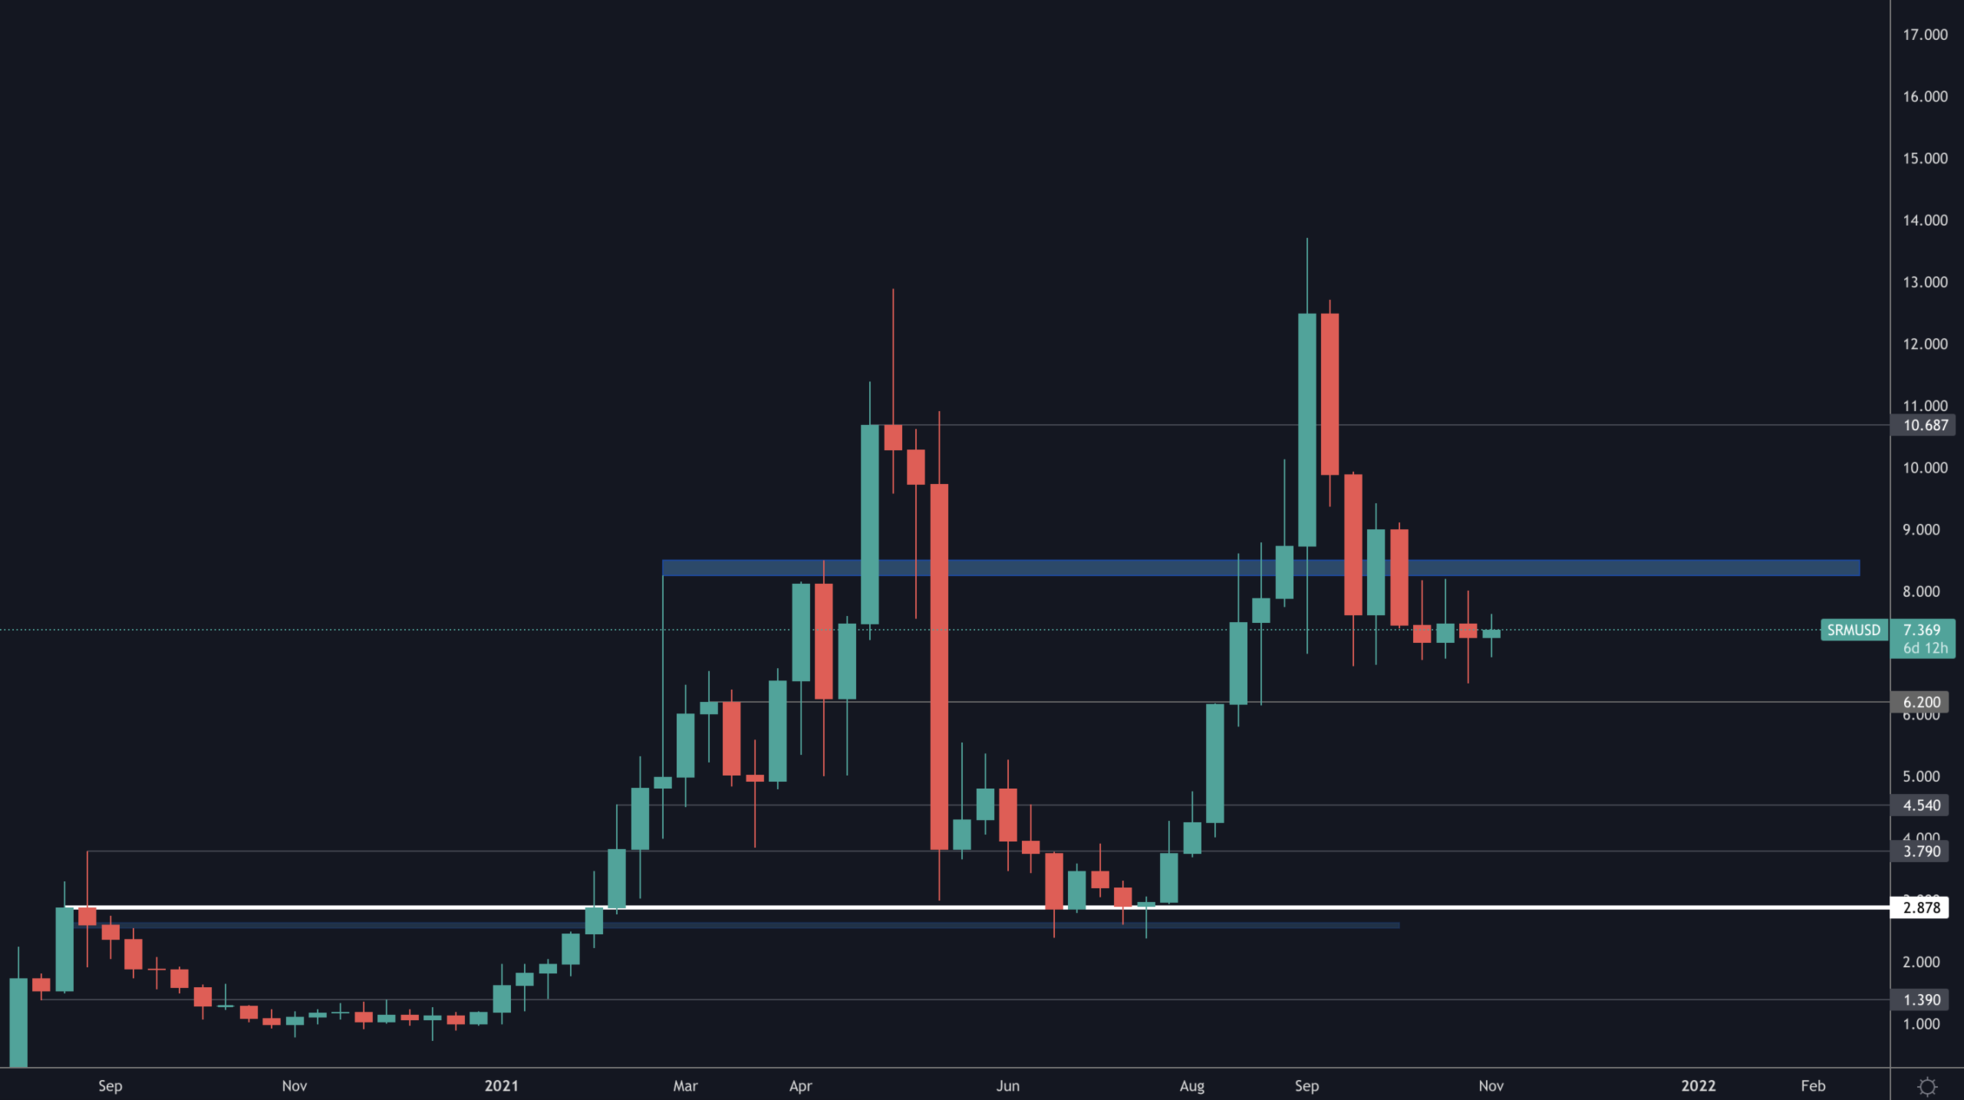
SRM in boredom zone until it breaks out from either $6.40 or $8.50. We believe the likely breakout is to the upside.
MINA
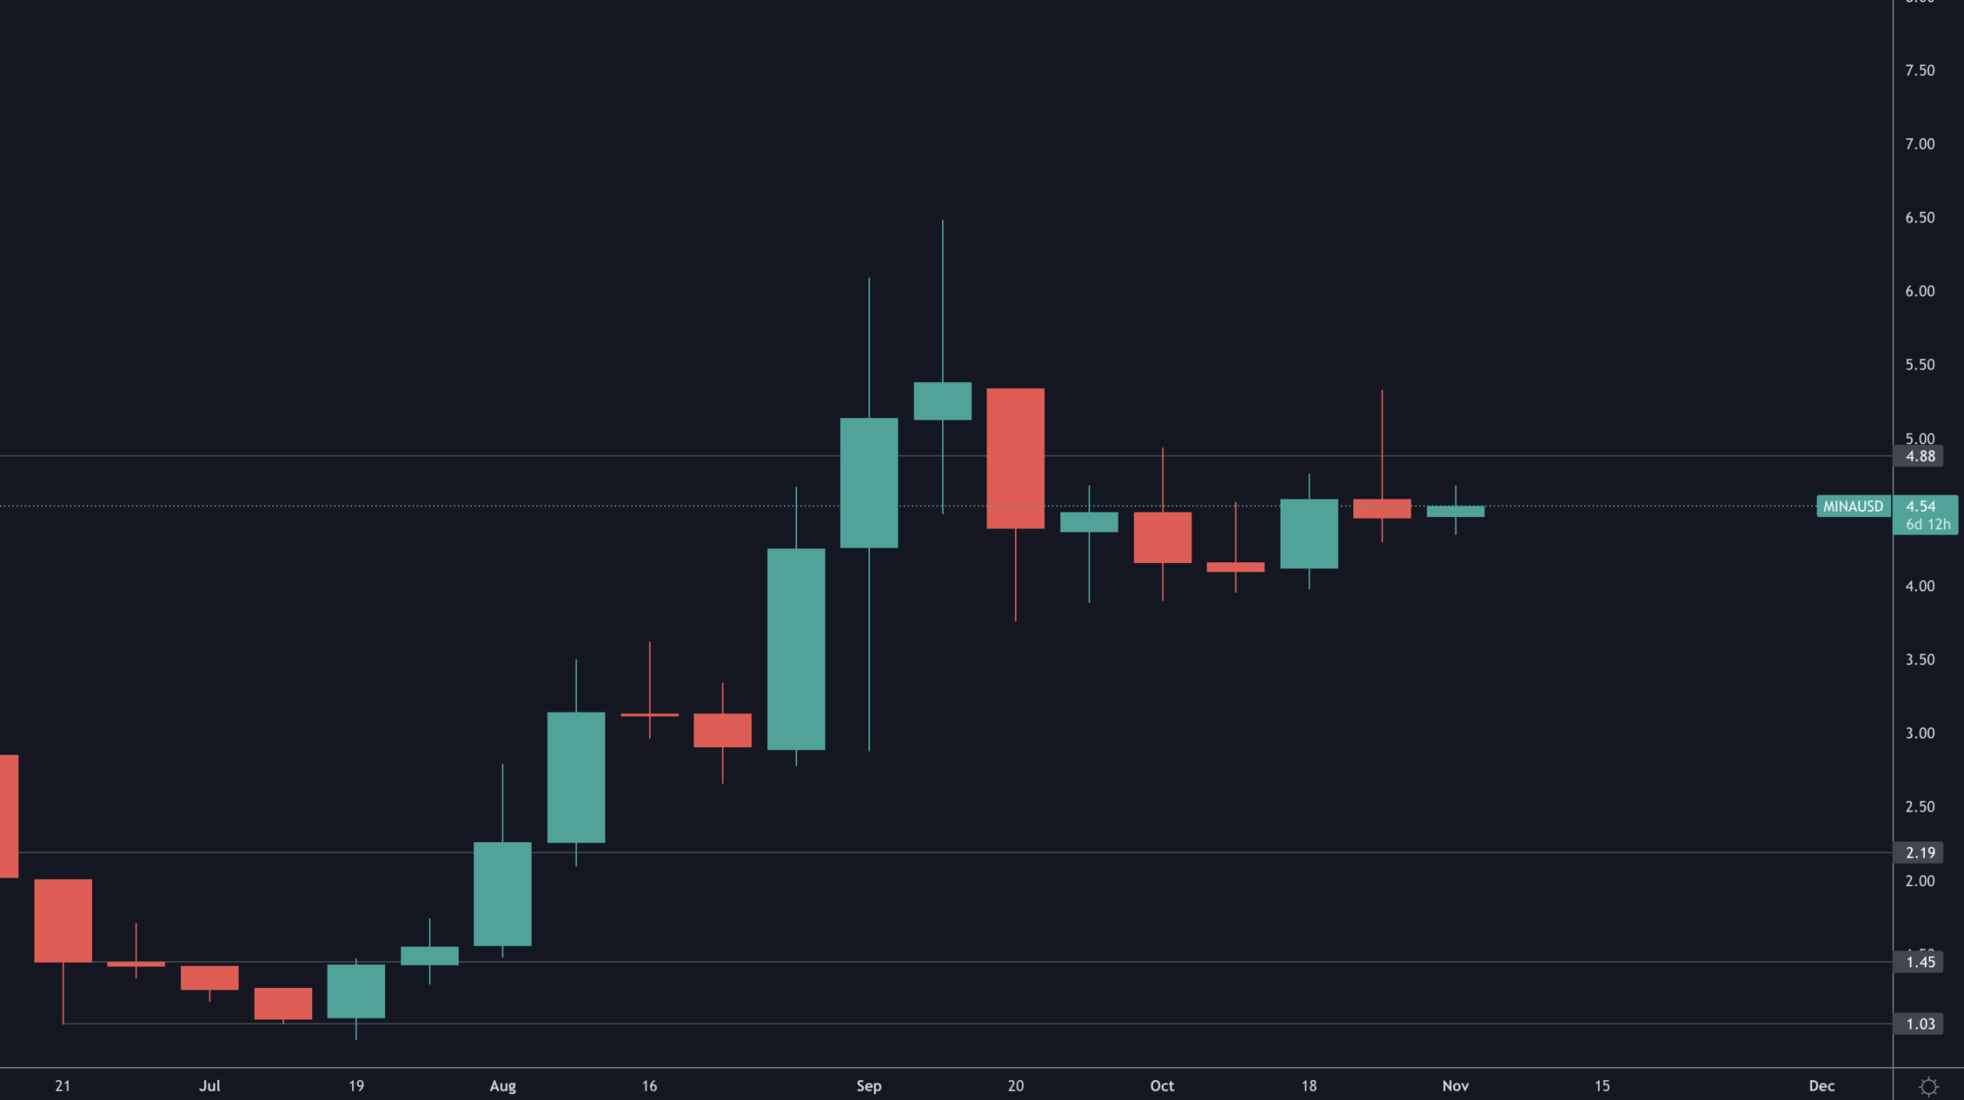
MINA in a bullish market structure on the weekly but it must reclaim $4.90 to run any further.
FTT
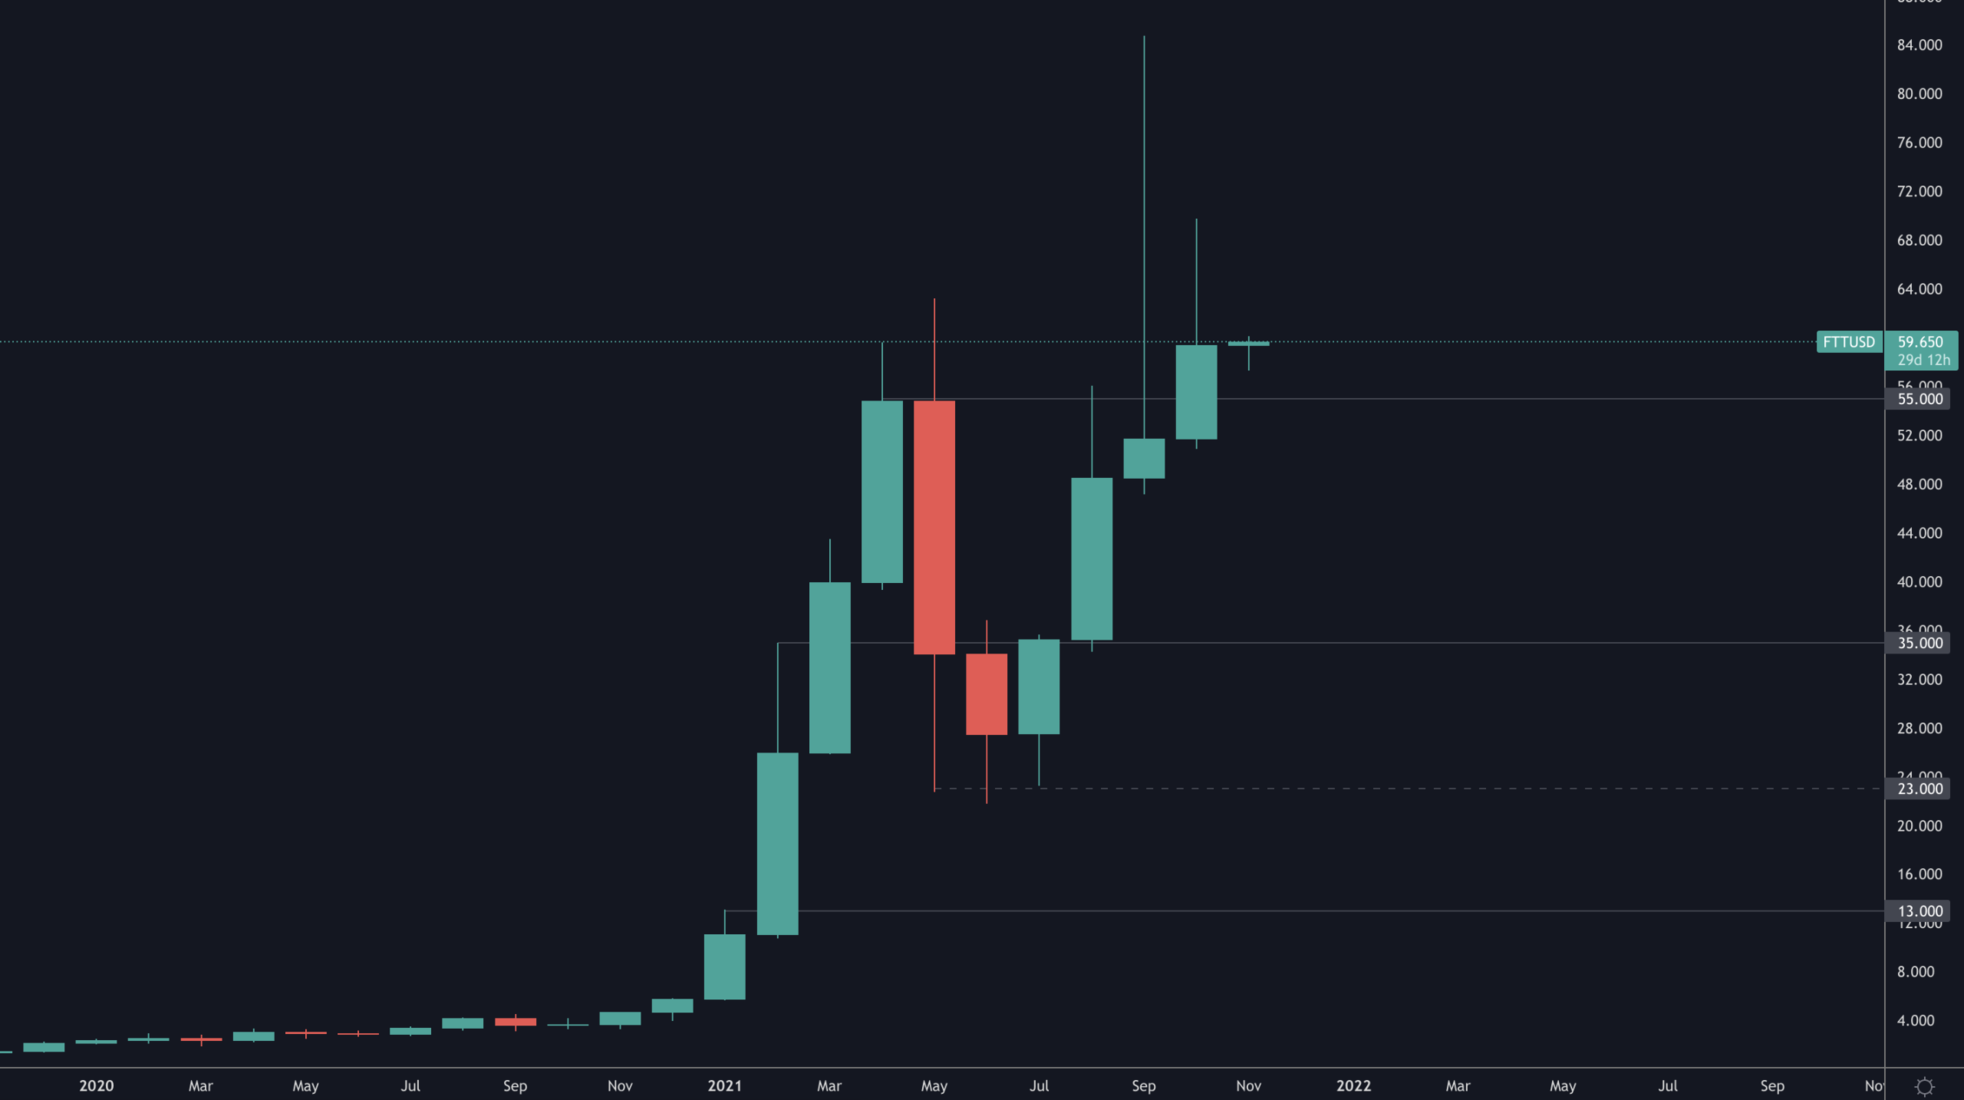
FTT has registered a new monthly high turning $60 from resistance into support.
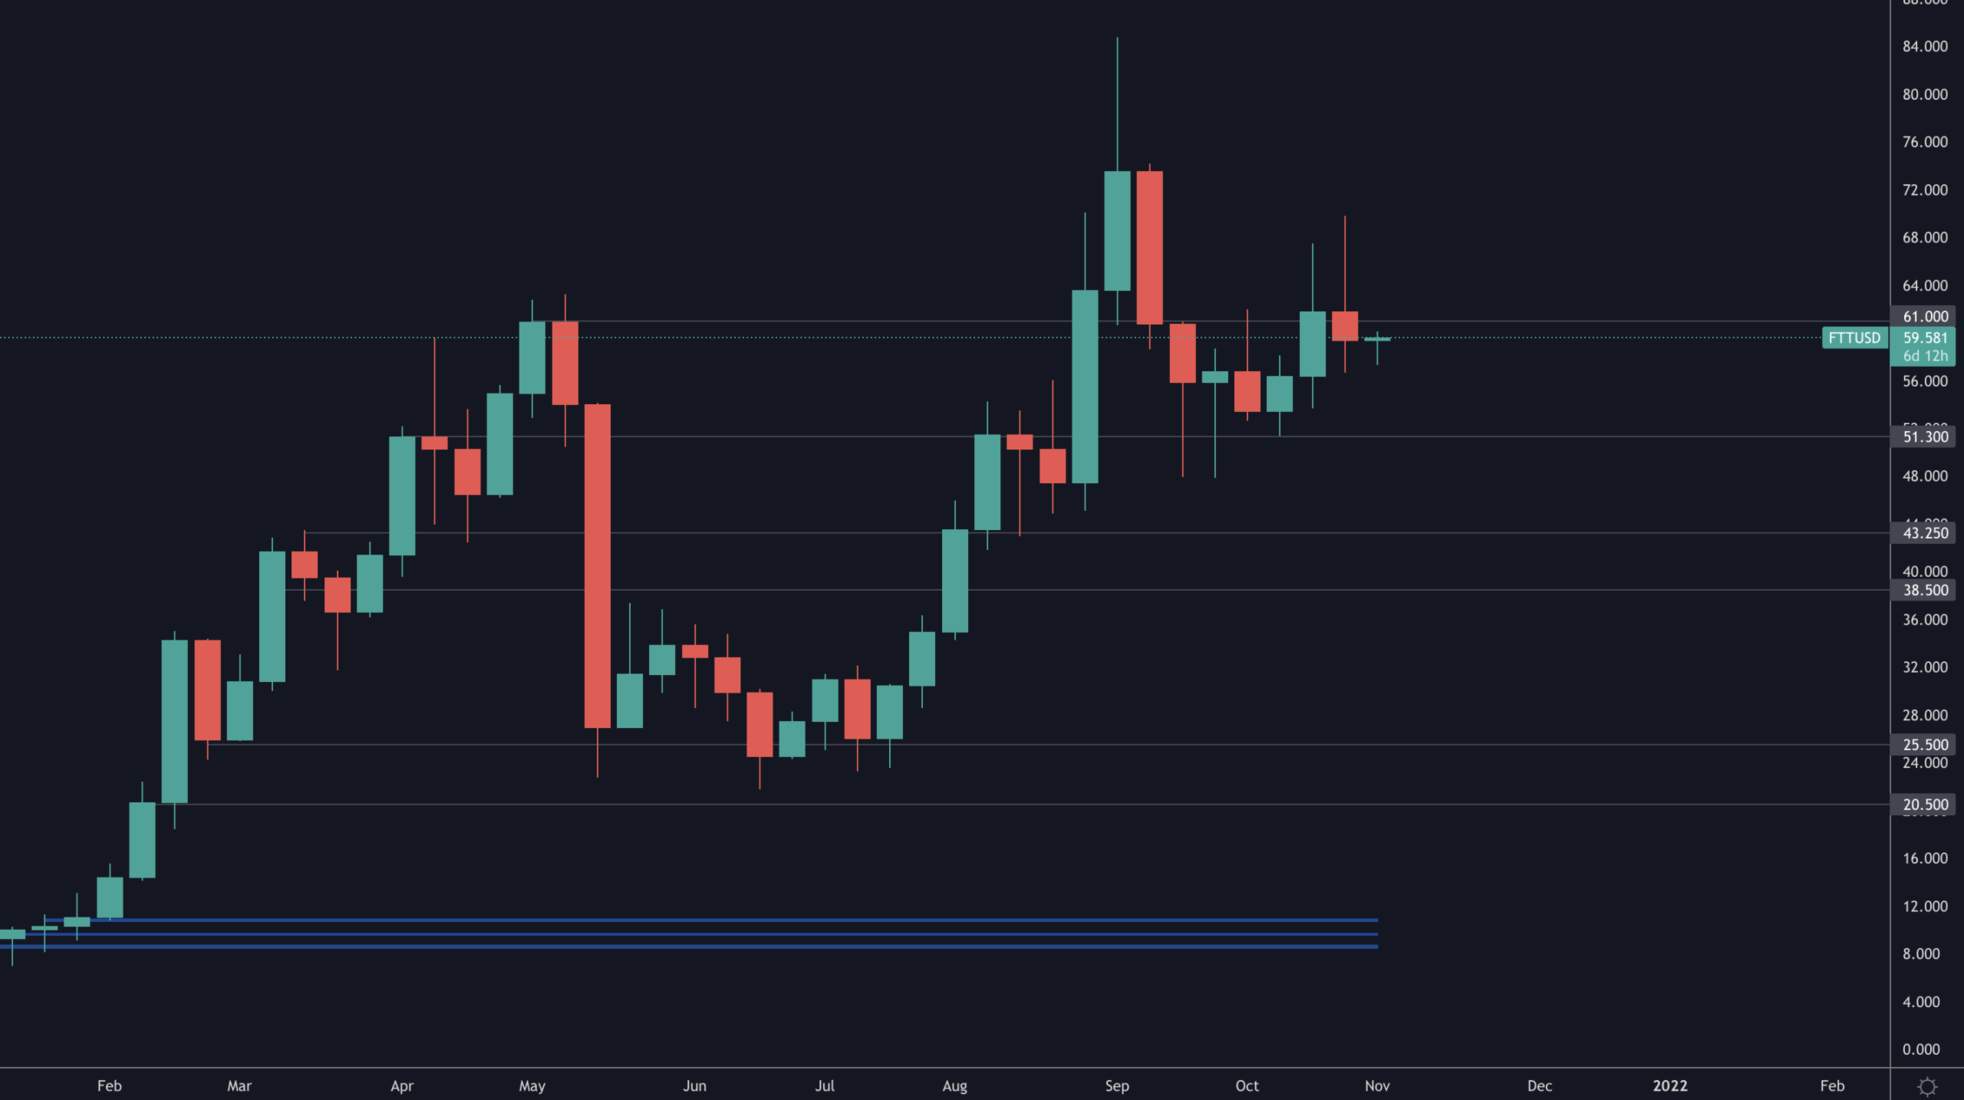
The weekly timeframe did slightly close under $60 which tells us a wick down to $50 is possible but not something we're personally paying attention to as we're bullish fundamentally on FTT - a loss of $50 would be worrying of course but we believe the odds of that happening are slim.
DYDX
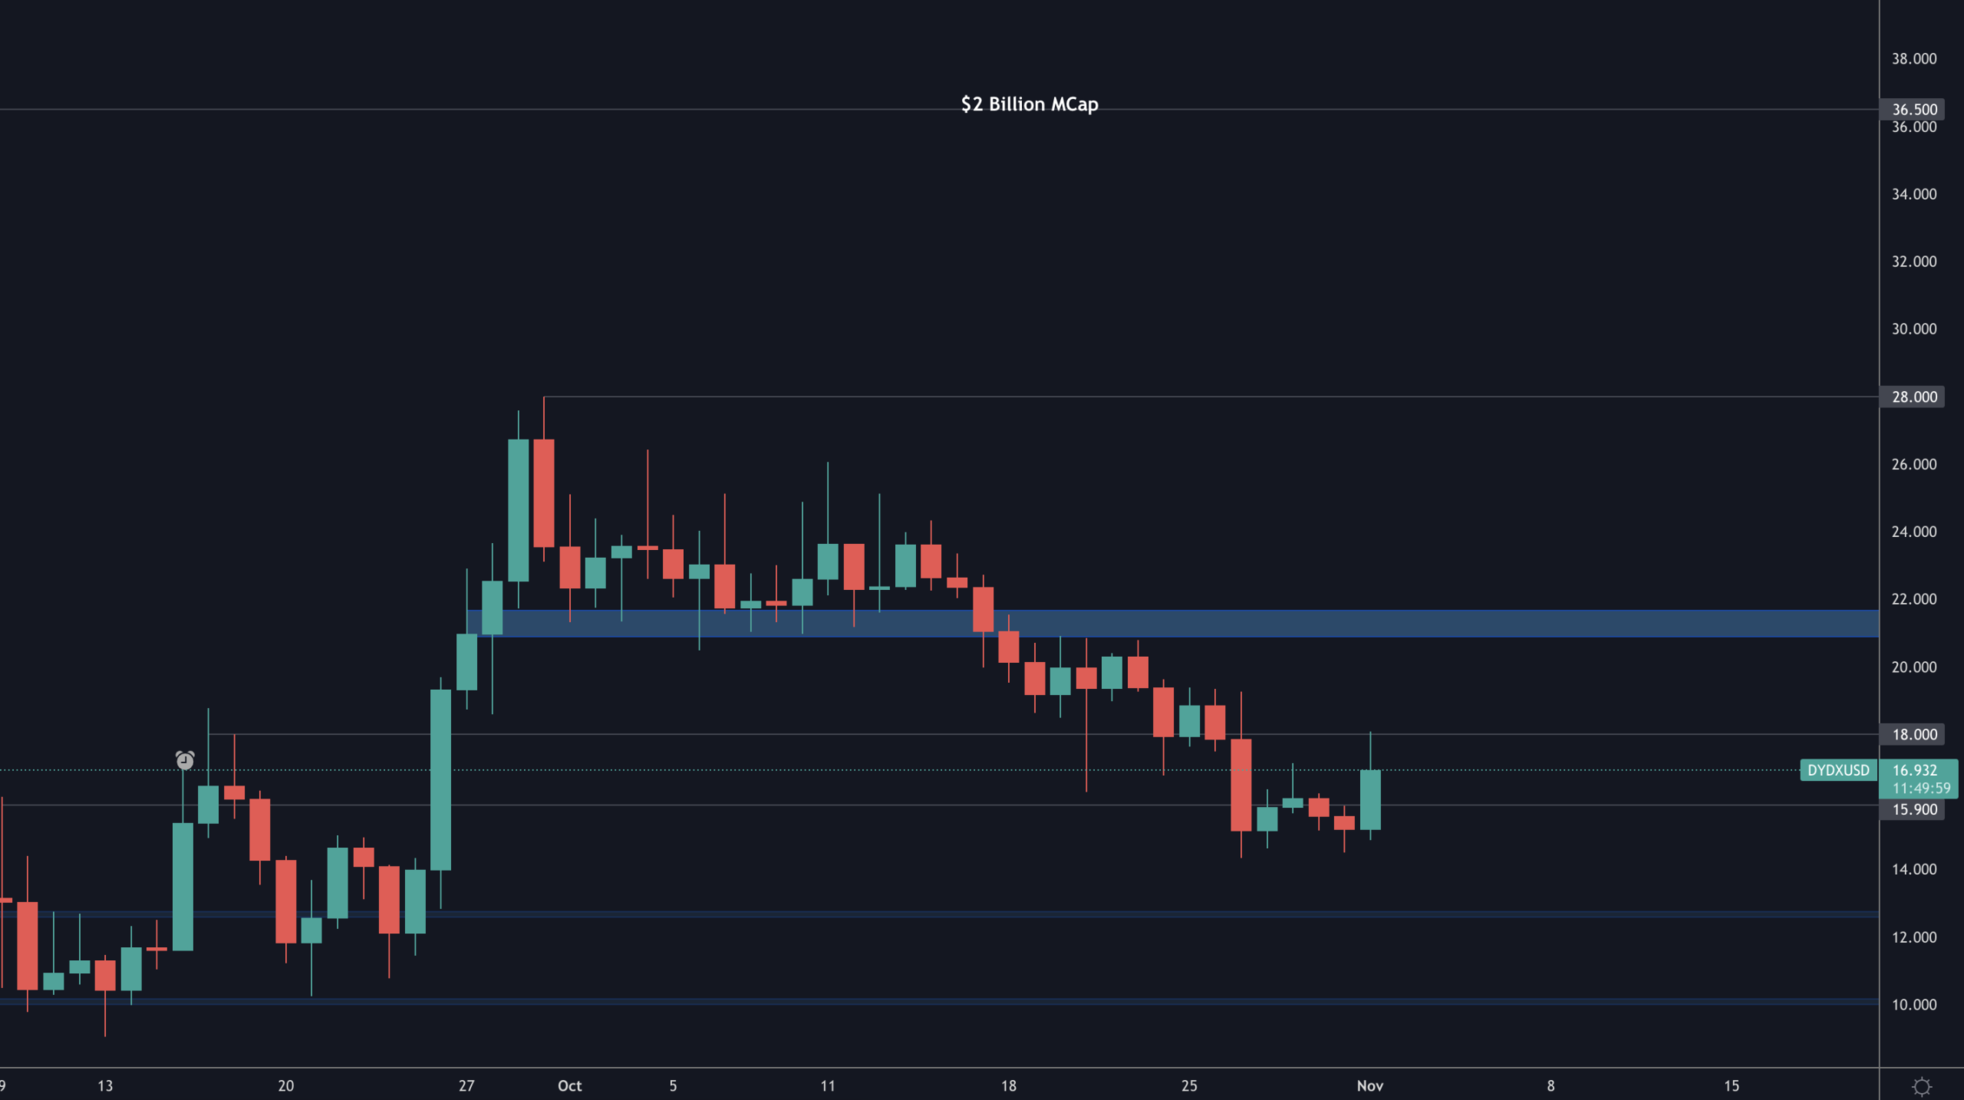
DYDX is looking to reclaim $15.90, if it does then the next reclaim we'll look for is $18. Overall, by end of year we project we'll see a $36.50 DYDX which sets it at a $2B valuation.
Disclaimer: Not financial nor investment advice. Any capital-related decisions you make are your full responsibility.
Recommended from Cryptonary


