Save 23% ($351) & Get a Free 1-1 Call with our Team ⏰ : 0d 2h 59m 45s

DeFi is still taking the world by storm and Ethereum remains the main contender as $1 Billion worth of USDT was moved from Tron to Ethereum. On a similar note, DOT tokens the native asset of Polkadot went live and soared very quickly!
Market Sentiment
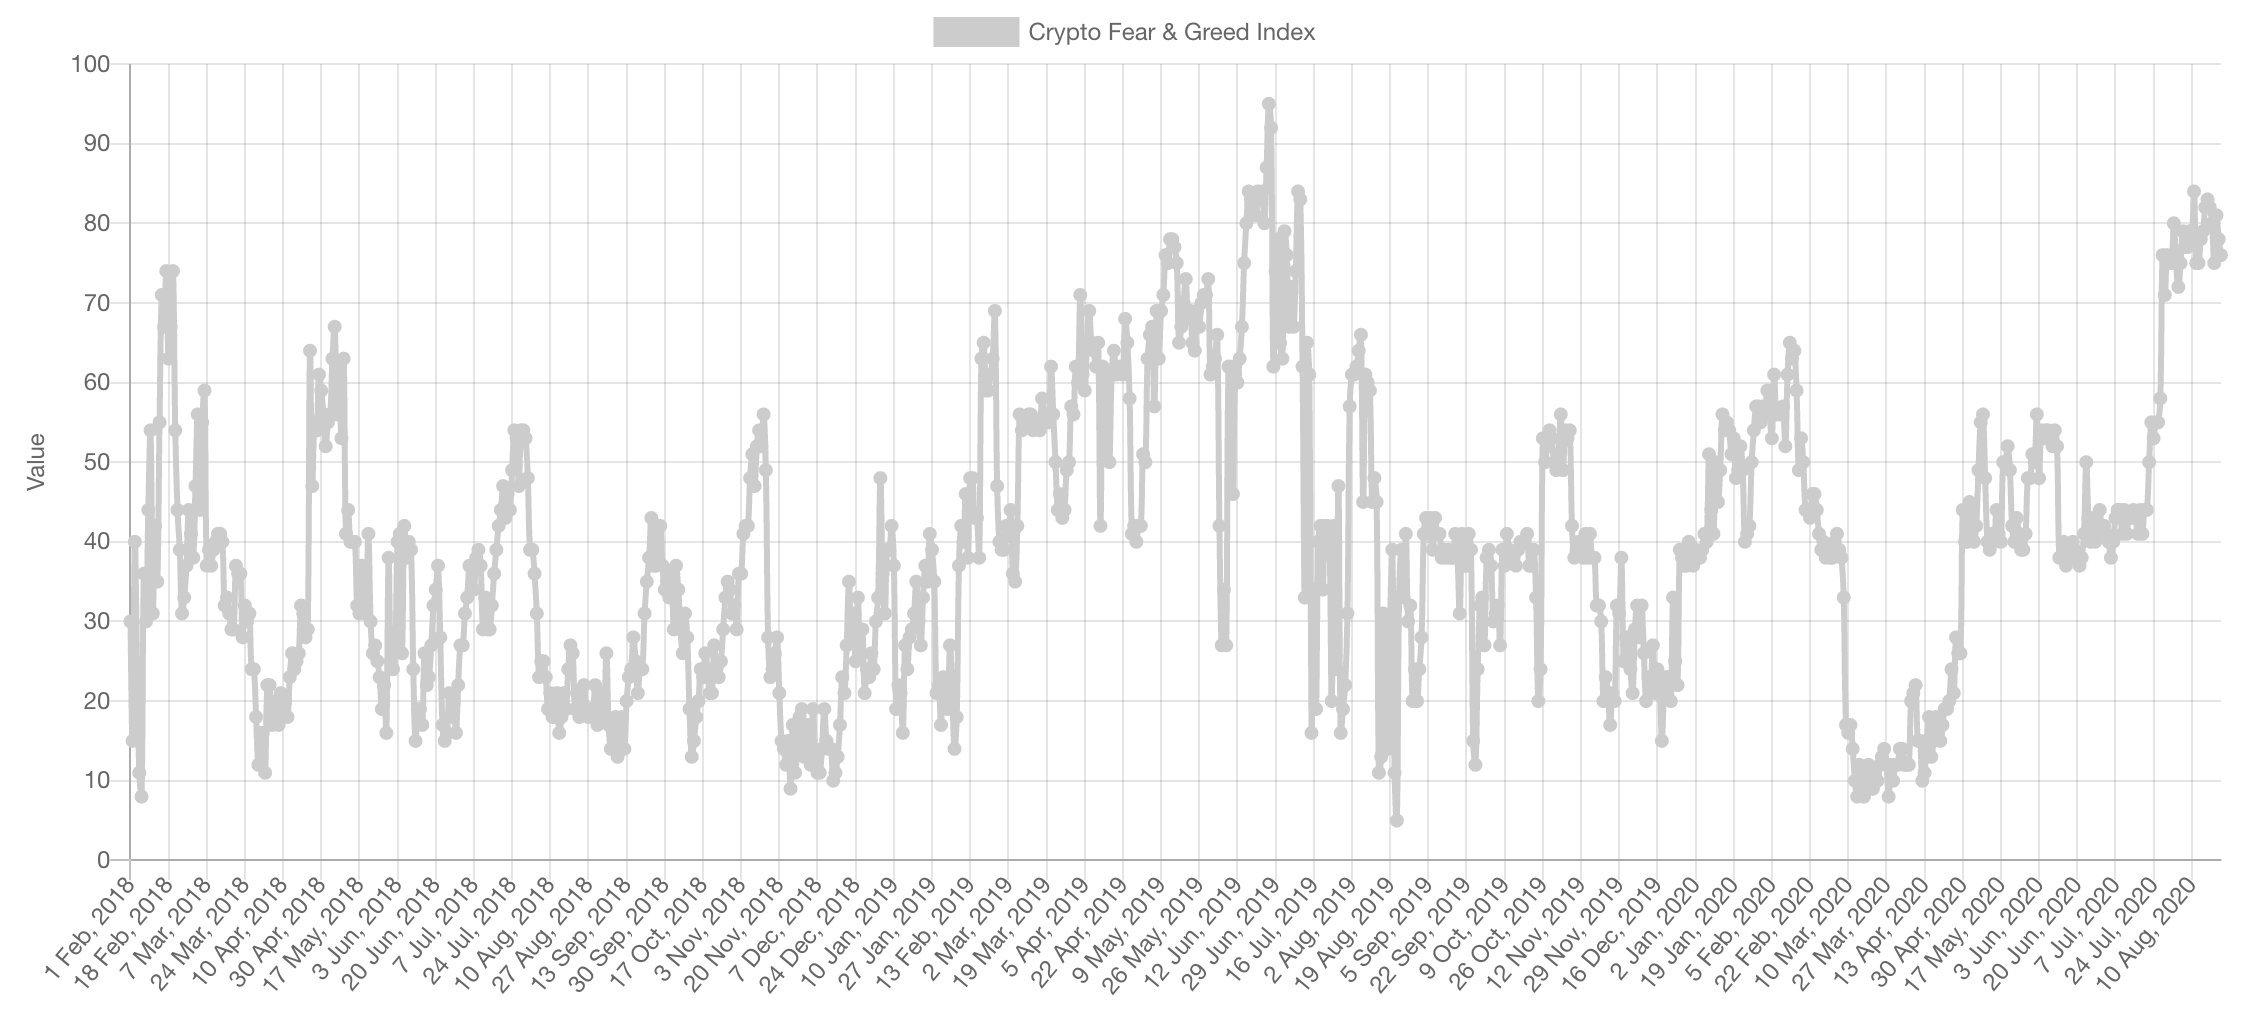
As shared last week, market sentiment is extremely high which is typically a sign that a pullback/correction is incoming. The only problem with the set of data presented is that it lacks history. There is no data back from 2016/17 where the market was in continuous bull-mode and how long the sentiment remained in greed/extreme greed for. This might very well have been similar to how the RSI can remain overbought for weeks on end while the market keeps going higher. For that reason, the weight we are giving to this piece of data has dropped slightly; it remains relevant but slightly less.
Trading Volume
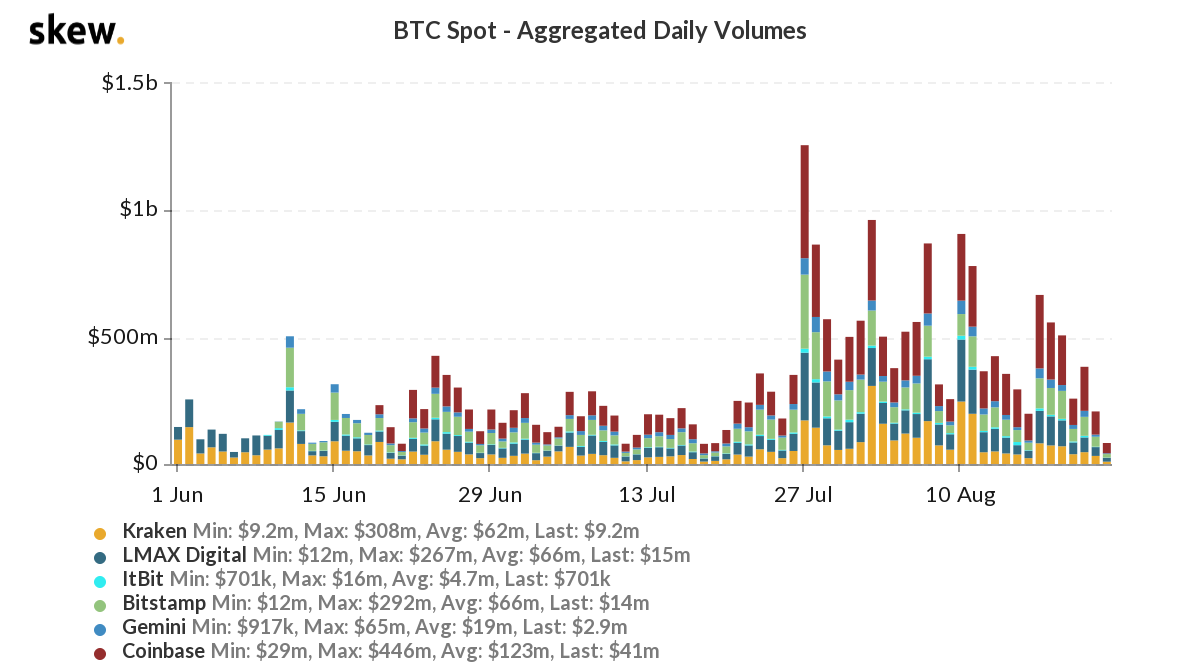
Spot volumes have dried off, especially for Bitcoin as it has entered a period of consolidation after a period of expansion. Which was the next expansion happens will be up to the charts as we’ll see below but this is indicatives of the calm before the next storm.
Market Indices
Total Market Cap
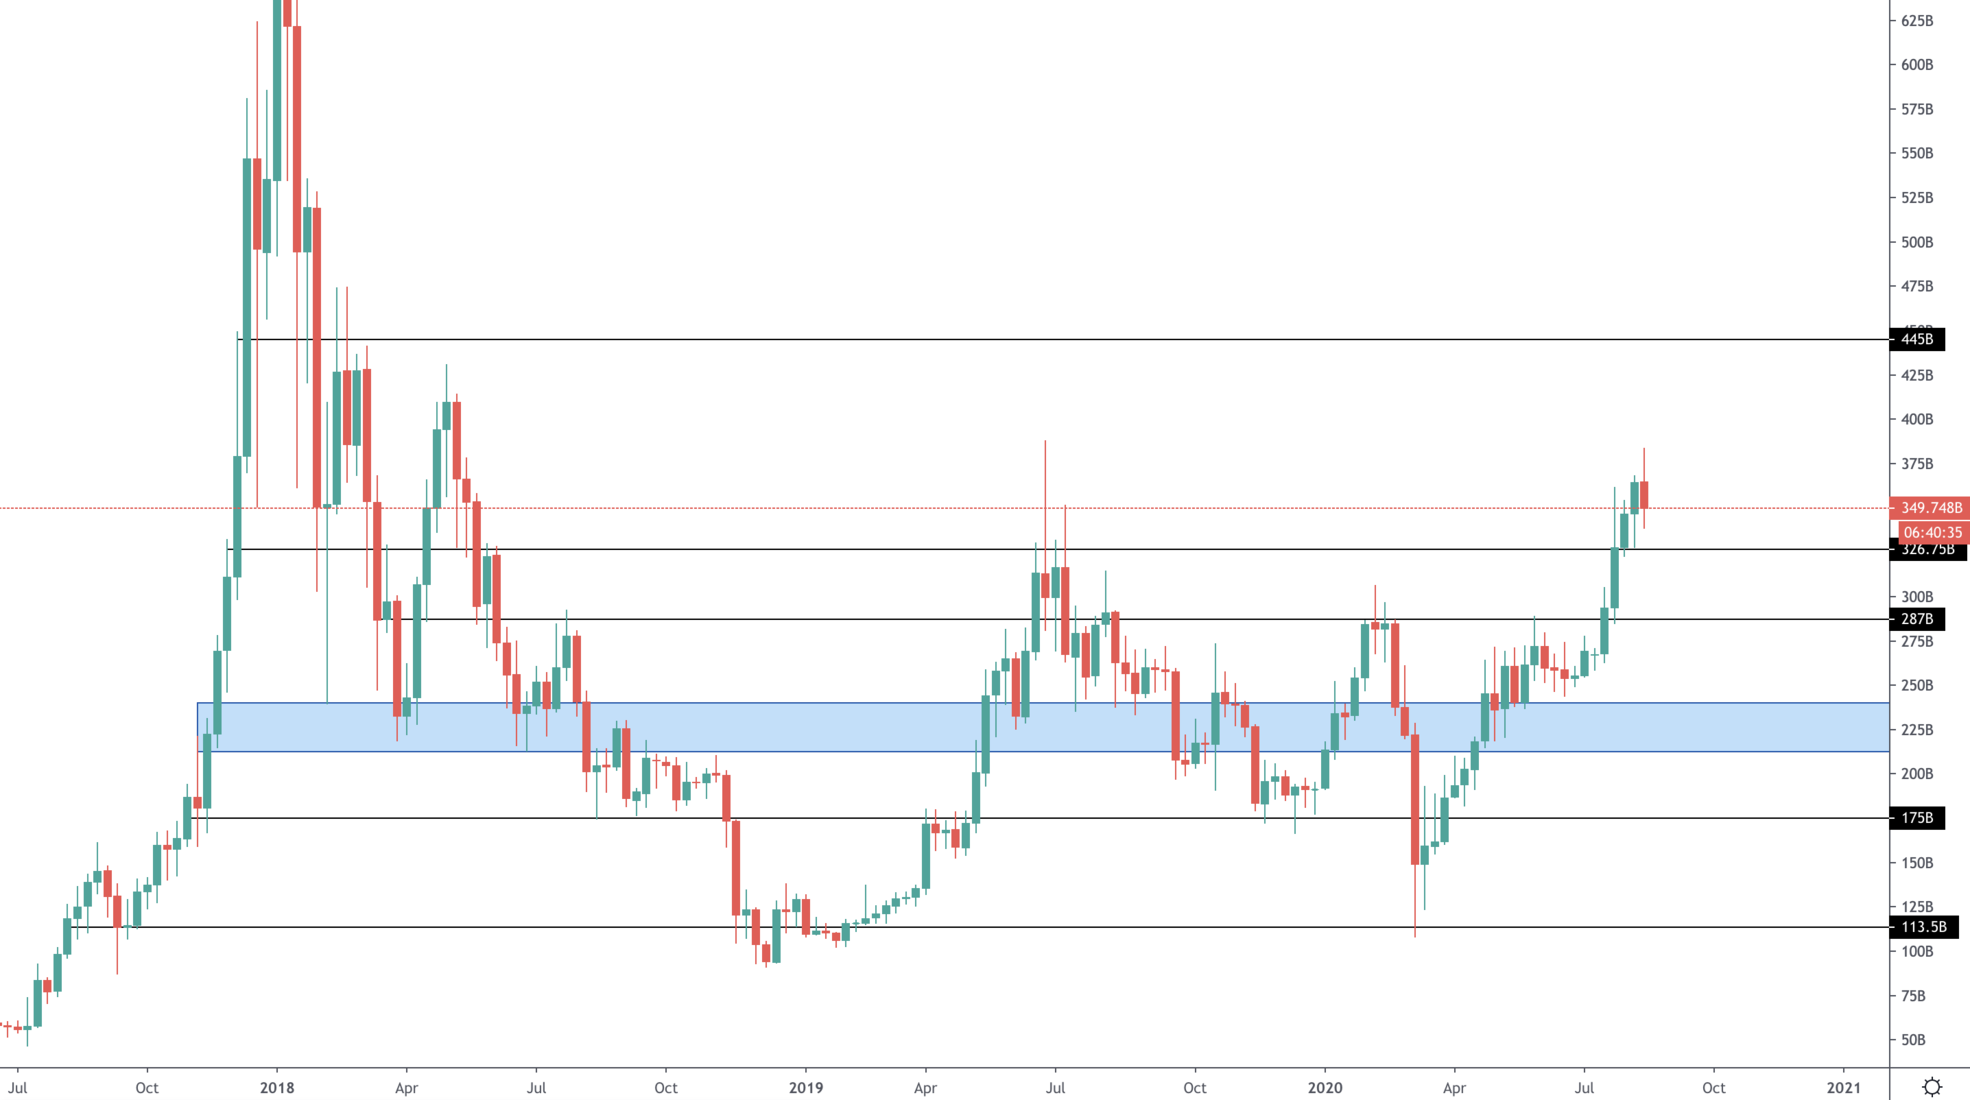
As explained in “Weekly Technicals - Volume 18”, a rejection off the previous high set in June 2019 was very likely and it did happen. Now that pullback may push price down to $325B but the trend is clearly bullish and even if prices were to dip we are going to be buyers. The fact that both the weekly and monthly closure highs were overtaken, is a very bullish sign for us.
Altcoins Market Cap
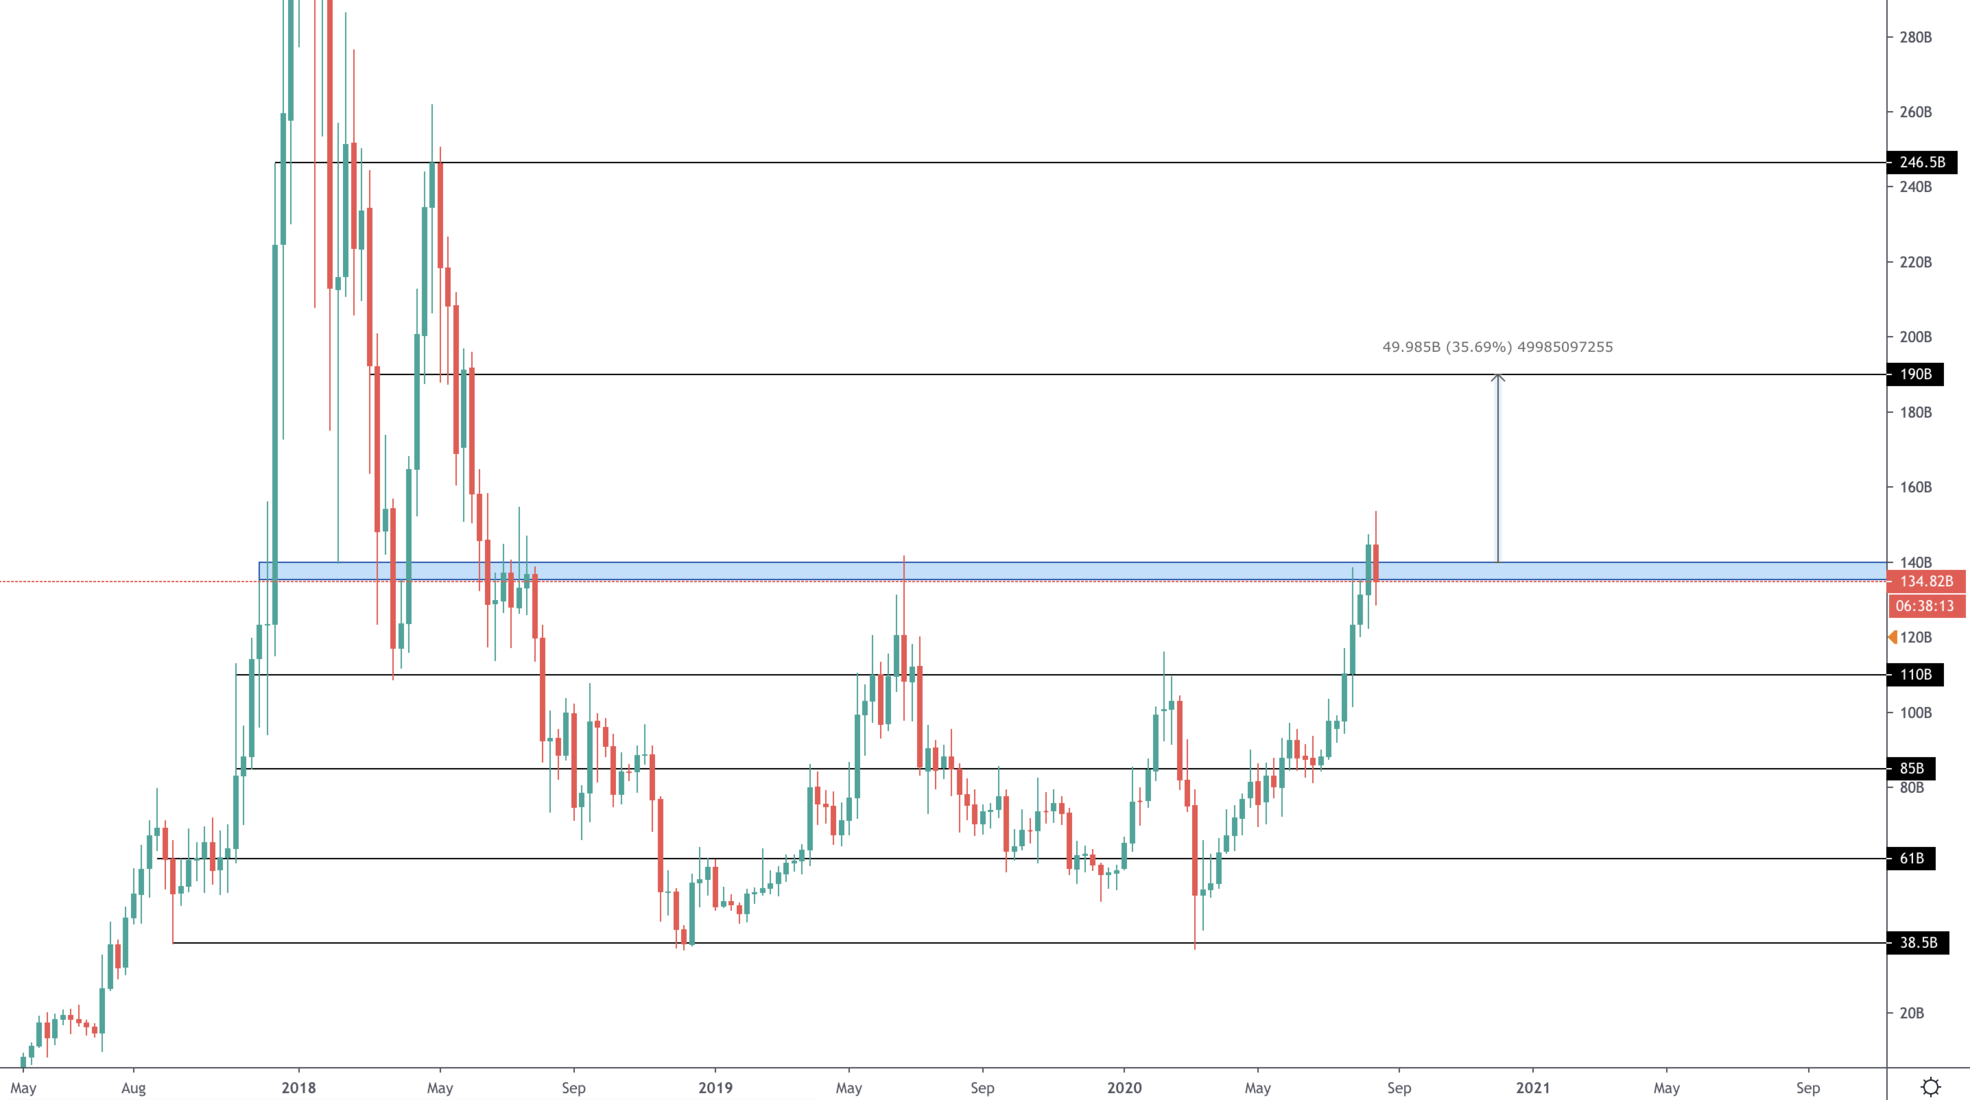
Long story short: previous high overtaken, dip into resistance turned support. If Bitcoin pushes down harder then $110B will be the next level of high interest for us.
Bitcoin
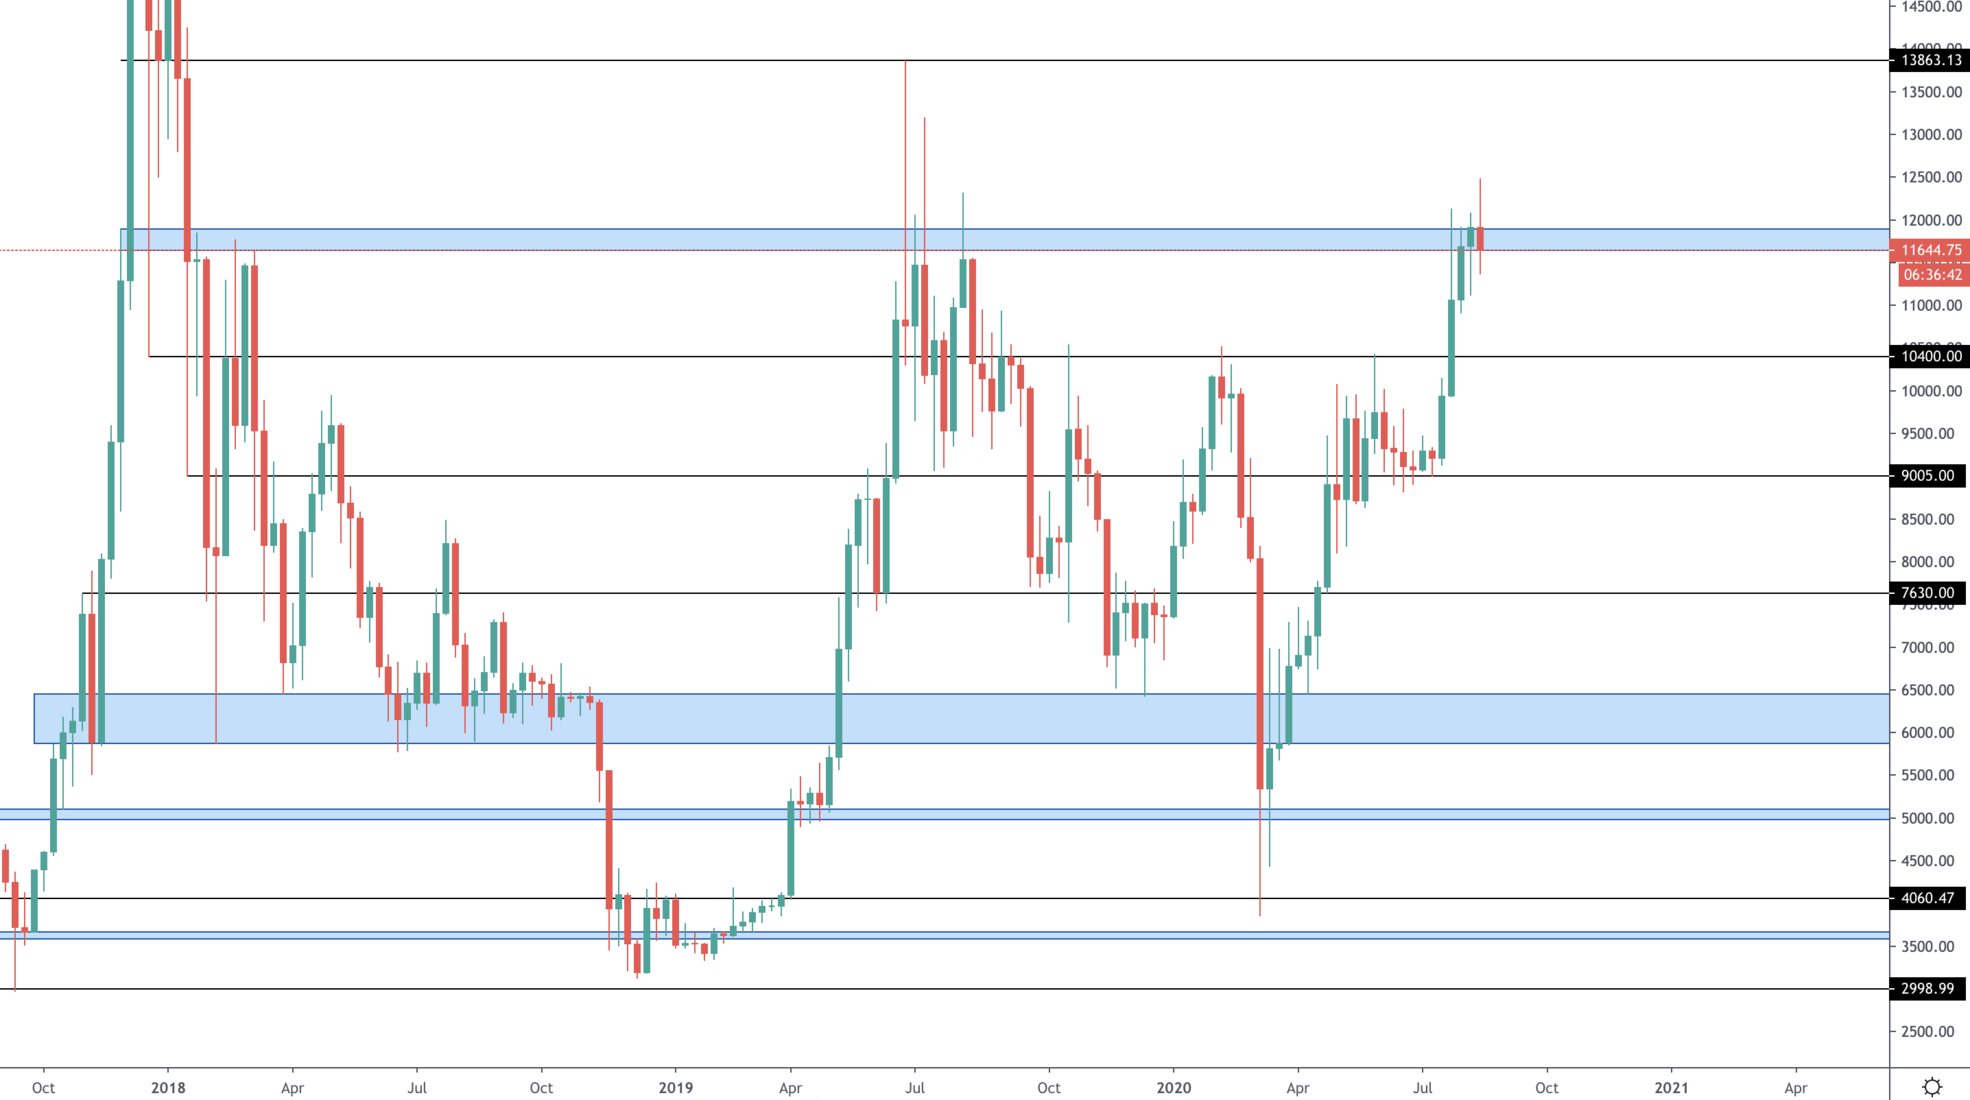
Bitcoin’s chart is a thing of beauty to be honest. The 2019 weekly closure highs have been overtaken and being retested. The only unfavourable aspect of this chart is the fact that there is a CME gap at $9,600 which have statistically filled in the past. But given the trend, if that happens it may present a unique buying opportunity. Important to note that the market is currently indecisive as we’ve explained to our Pro members. Trading this environment is risky which is why we’ve been reducing our size and protecting the very valuable profits we’ve pulled from the markets in the past few weeks.
Ether
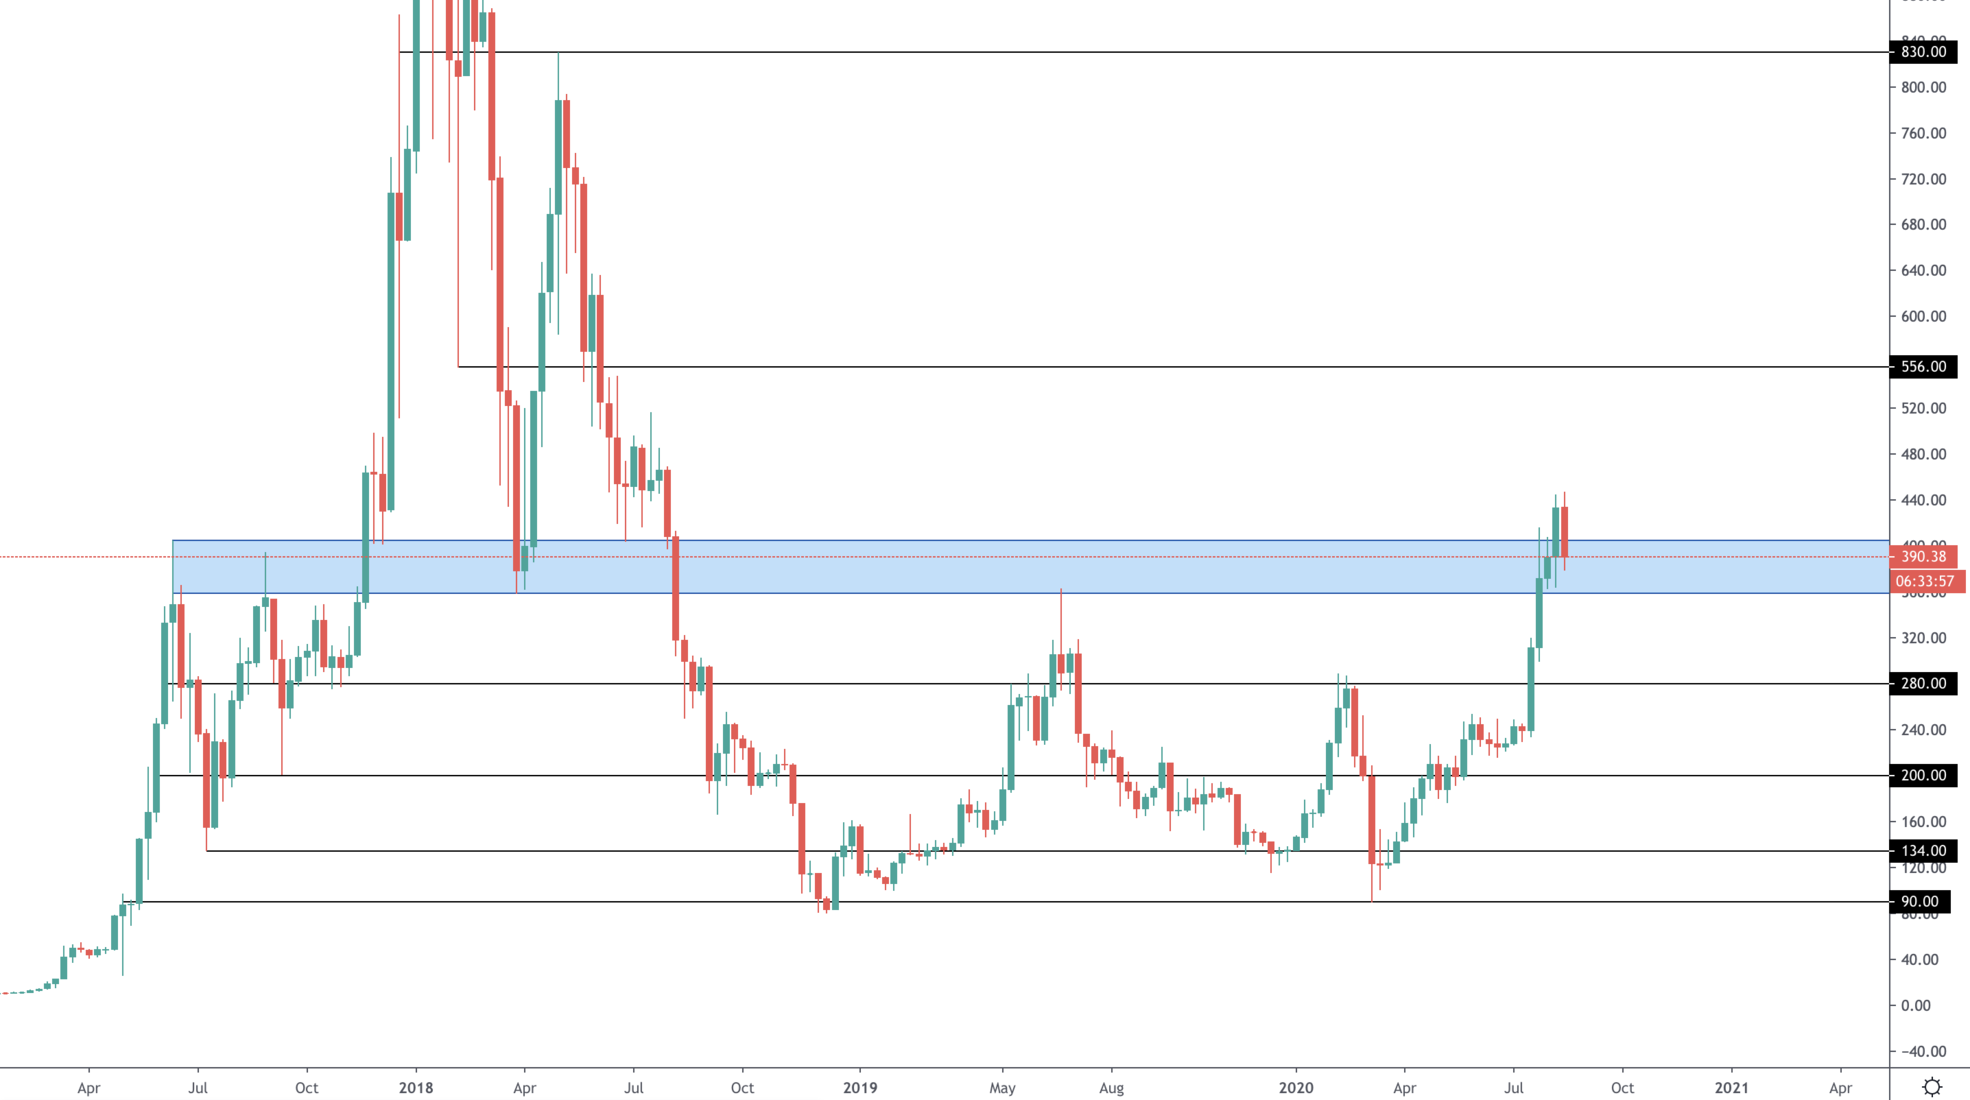
Our current bias on ETH is very bullish and it is the asset we are most eager to buy dips on shall they happen. The $405 break is crucial for this bull-run and a true milestone we’ve been waiting for since last year.
Recommended from Cryptonary


