Save 23% ($351) & Get a Free 1-1 Call with our Team ⏰ : 0d 2h 59m 43s

Like a ship stranded, today's crypto market is undecided, and traders are adrift in the search for profits. With bitcoin range bound and correlations breaking down, conviction has gone overboard.
In today’s market direction report, we start with a short video analysing macro trends and providing guidance on navigating toward potentially favourable winds. Alright. Let's dive into the charts and see where the markets may be headed.
TLDR
- Macro headwinds persist, keeping markets uncertain.
- Bitcoin is stuck range-bound and struggling to hold support.
- ETH is seeing some buyers, but the momentum is still weak overall.
- SOL found support, but it still needs strong confirmation.
- Bear flag forming on THOR to point to further downside.
- Mixed signals for RUNE as a key resistance point lie ahead.
Disclaimer: Not financial or investment advice. You are responsible for any capital-related decisions you make, and only you are accountable for the results. “One Glance” by Cryptonary sometimes uses the R:R trading tool to help you quickly understand our analysis. They are not signals, and they are not financial advice. Any capital-related decision you make is your responsibility and yours only.
BTC | Bitcoin
From a macro viewpoint, there are three main topics to be aware of today.The first of these is the conflict in the Middle East. It remains the most significant short-term headwind for risk assets because further escalation could have more global consequences. These could have a ripple effect that impacts markets “closer to home”.
The second is the Producer Price Index (PPI) data out today. PPI is expected to come in at 0.3%, well below last month’s 0.7%. The Fed would see the PPI coming lower as a positive development.
The third is today’s Fed-speak, along with the FOMC Minutes from their last meeting. It’ll be interesting to see if the more dovish tone we got from Monday’s speakers continues.
Recent Fed-speak indicates that they believe the bond market has done some of the tightenings for them, and therefore, another rate hike in November is likely not needed. The FOMC Minutes may highlight this.
Looking at Bitcoin’s chart, we can see that Bitcoin has moved back down overnight to the key horizontal support level of $27,100, and the price continues to fight in that area.
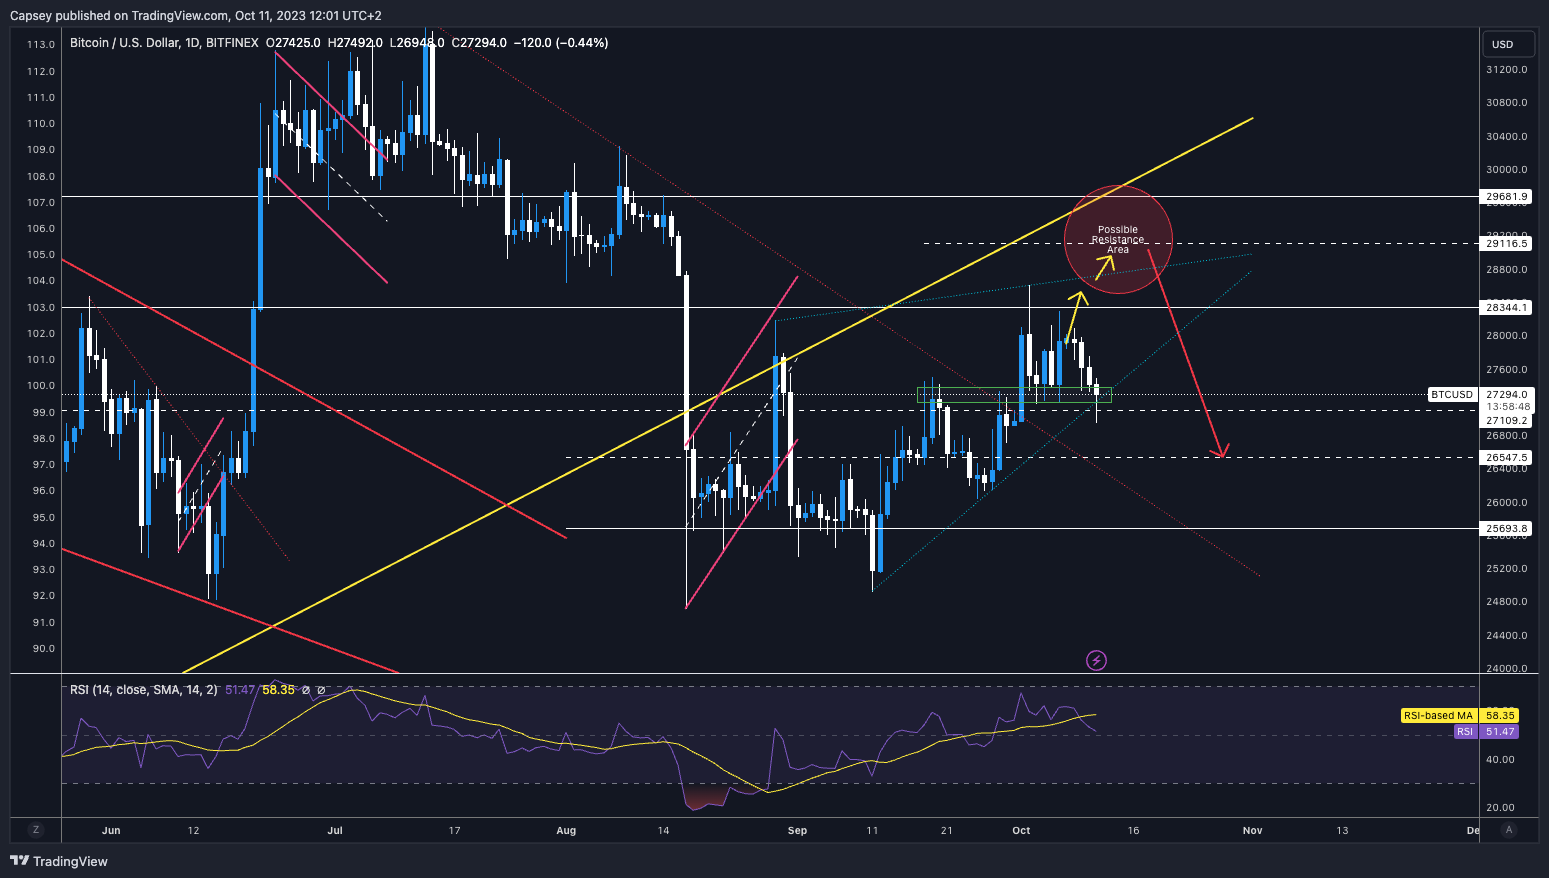
With this move down, we’ve seen the open interest increase (the amount of leverage being taken out). Also, the funding rate is meaningfully positive - many new longs have opened positions.
What surprised us is that the S&P has moved up 3.5% in this trading week, yet Bitcoin has moved down 3.2%. A break of the correlation and not a positive break from the Bitcoin viewpoint.
Conclusion on trading BTC
The macro backdrop remains fragile; therefore, you should reduce exposure to risk assets. Price-wise, Bitcoin is currently fighting at a key level - the $27,100 to $27,300 horizontal support. We have previously identified this level as a major area of liquidity, which again should help that level hold up as support.Bitcoin and crypto, in general, do look shaky here, particularly when you see the S&P move meaningfully higher and Bitcoin essentially doing the opposite.
We’re still range-bound between the $27,100 to $28,300 level. And with the macro headwinds we currently have, it would be unwise to be trading in any meaningful size.
We’re personally waiting for a break of the range ($27,100 to $28,300) to consider any trades. It’s wise to note that the liquidation heatmap shows many long liquidations, just under $26,000. These large liquidation levels are usually a magnet for price.
Action
- Remain on the sidelines for now rather than taking up new positions in BTC until there is a break of the range or indicators are less mixed.
- Watching closely to see if buyers come in at the $27,100 area; from Wednesday morning’s action, so far, some buyers are stepping in.
- All-in-all, things remain mixed, and our level of conviction about Bitcoin moving in a specific direction is low.
ETH | Ethereum
ETH is at the low end of its range. However, it appears that buyers are now stepping in at the low end of this range at $1,550.Technical analysis
We’re now seeing some buyers step in at the major horizontal support of $1,550. It’s important that this gets some follow-through and heads higher. ETH is out of the local uptrend, but if buyers can step in (they initially look as if they are), then ETH could head back up to retest the underside of the local uptrend line where there is also confluence at the $1,625 local horizontal resistance. If we do head back to this price point, we feel this may act as too strong a resistance, and this could lead to a larger move lower.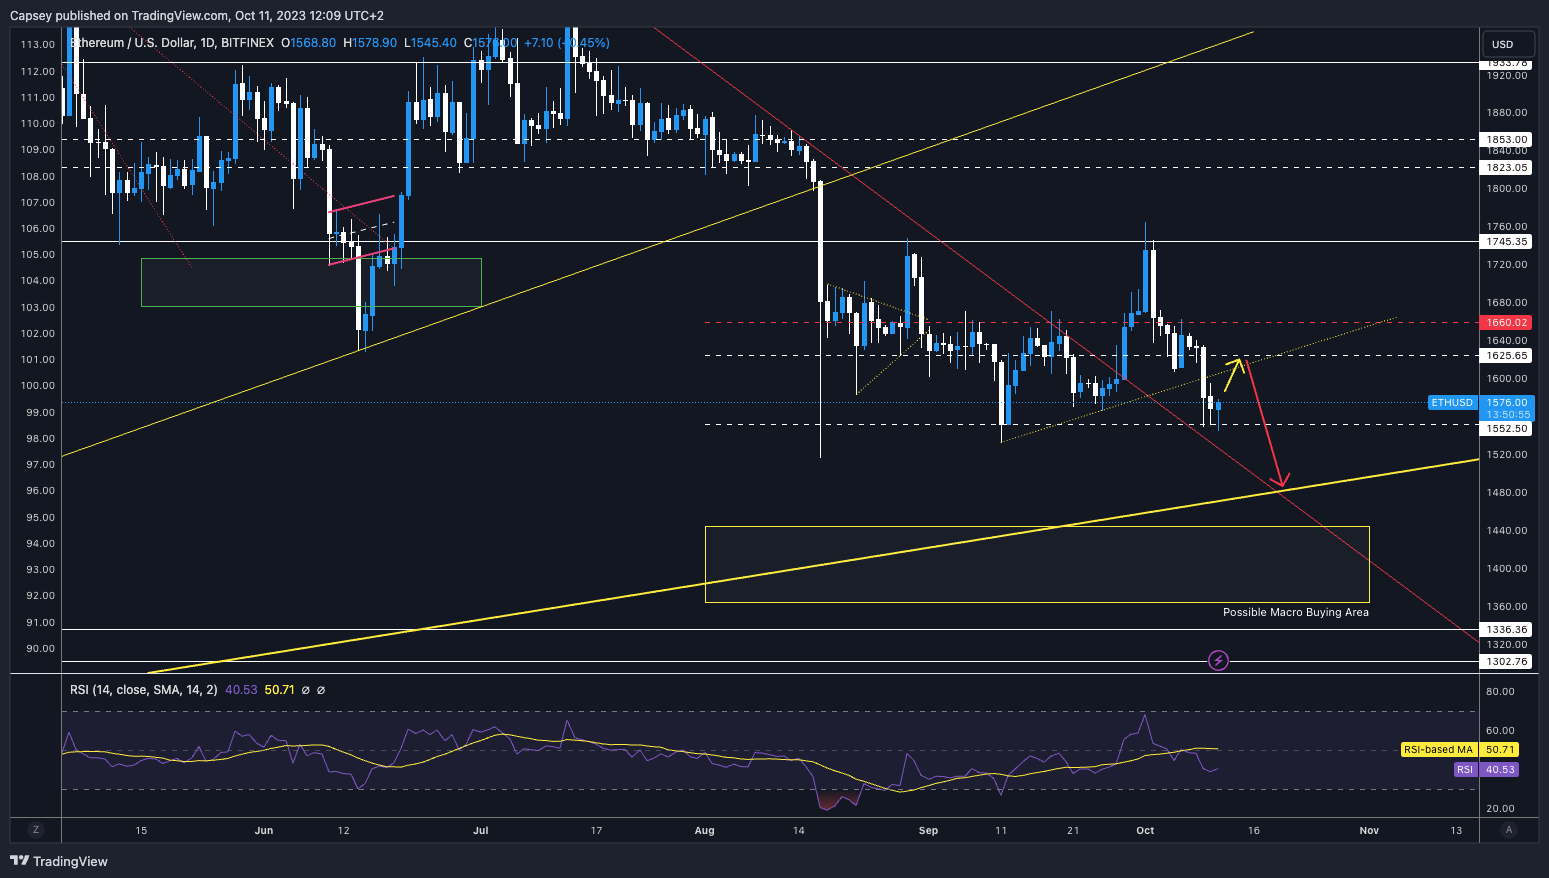
RSI and funding rates
The RSI is at 40, so it’s still in middle territory, and therefore, there is room for a move higher or lower, so there is no clear signal from this.Regarding the funding rates, we’re relatively positive across the board. So, the feeling is that this could help ETH move back to and retest the $1,625 level.
Conclusion on trading ETH
We think ETH still looks weak here, but we’re closely watching to see if buyers step in at the $1,550 horizontal support. So far, it’s been an okay response.Ultimately, the price action of the past week has been weak, and therefore, we don’t have any real conviction in ETH here, despite the fact we may get a small relief bounce up to, say, $1,625 in the very short-term.
Action
- We’re still just watching. If there is a clear breakout of Bitcoin’s range, that should drive ETH; otherwise, ETH loses its range.
- The first point of major interest for us would be if the price moved down into the yellow box at the $1,400 area.
SOL | Solana
SOL is beginning to find some support here, having bounced off the $21.86 horizontal level for a third straight day.Technical analysis
We’re still in the broadening wedge, and SOL has seen buyers come in at the $21.86 horizontal support. What we now need is to see buyers come in and push the price higher, to potentially then retest the $23.40 level. This will likely be fuelled by BTC and ETH moving higher, so it’s important to keep tracking them to assess if buyers are stepping in.
RSI and funding rates
The RSI would support a move back higher here - SOL will likely do a retest/relief bounce higher. The RSI is at 55, with the RSI MA at 63. Therefore, a move higher would be a retest of the underside of this RSI MA, which may be the rejection point in the very short term.Funding rate-wise, SOL is deeply negative, indicating that there are a lot of shorts. A short squeeze is on the cards here. A move up to the early $23 area would wipe out some of these shorts, which you’d like to think would reset the funding rate to a more healthy/neutral level. Then, we may consider shorts in the $23 to $24 region.
Conclusion on trading SOL
Like BTC and ETH, SOL has found support at its local support level, but it now needs buyers to come in to push the price higher.So far, we’ve seen evidence of buyers but nothing substantial. This is, therefore, at a point where we may get a small relief bounce, but we don’t expect SOL to go up 20-40% from here in the short term.
Action
- We would be a seller of rallies and aim to re-accumulate in the coming months at much lower prices.
- For now, we’re interested in SOL for a trading opportunity. If SOL can get back to $24.00, this would be the area for shorts, assuming funding rates have reset. The more degens among you may even wish to take a long position from the current price of $22.19 up to, say, $23.00.
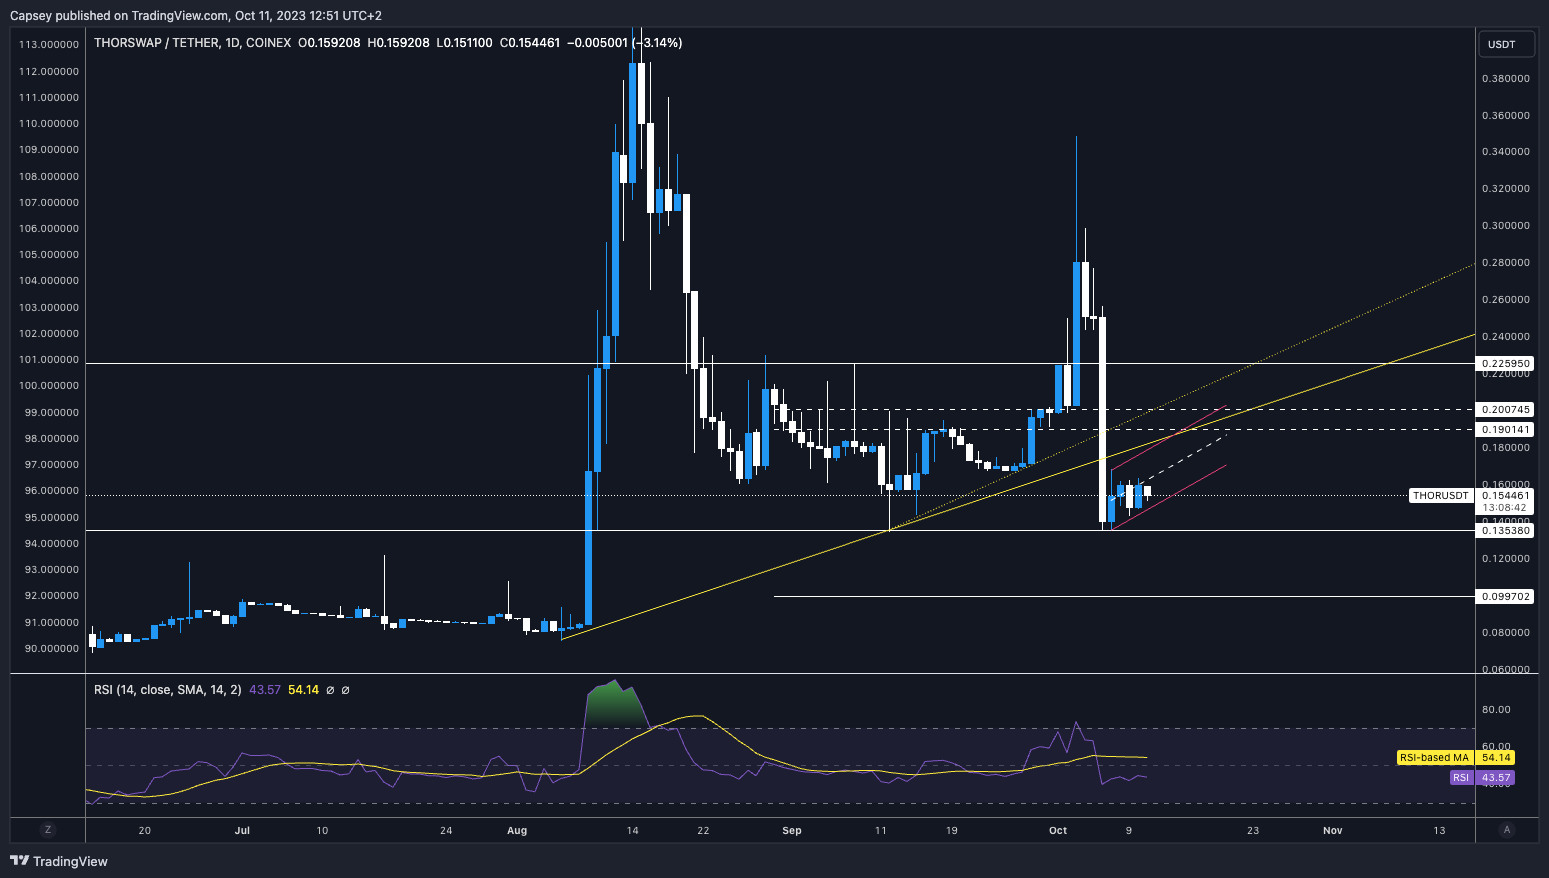
THOR | THORSwap
THOR presents a phenomenally volatile play, but the technical analysis is relatively clear on THOR here.Technical analysis
After the 50% price drawdown last week, THOR has now formed a bear flag - usually, they break down, pushing the price lower.A break of the bear flag would take THOR to $0.135; the key is if this level holds. If it holds, there’s hope for a bounce from that area. If it cannot hold, we expect THOR to drain over the coming weeks/months, with a minimum price target of $0.11.
RSI and funding rates
The RSI is at 43, so there is certainly room for this to go lower, giving more credibility to a possible breakdown of THOR here.Conclusion on trading THOR
THOR looks like it’ll break lower here, with $0.135 being a minimum target. The key will be if $0.135 can hold up.Action
- Clear bear flag pattern here. The expectation is that this breaks down to $0.135.
- For those that hold a big bag of THOR, it may be wise to scale out of some of your positions to free up some USDT and then wait to accumulate more THOR in the coming months at prices that are 10-30% lower than the current price.
RUNE | THORChain
We saw some buyers finally step in yesterday, and RUNE’s price got a small bounce off of the $1.61 horizontal support but has now found resistance at the local level of $1.68.Technical analysis
We need to see these buyers follow through and get RUNE back above the local resistance of $1.68. You’d hope a positive move in BTC and ETH could drive RUNE higher, but if they struggle, RUNE will also likely struggle.It’s possible that RUNE is forming a bear flag here. We need more days of price action to see if this formation happens.
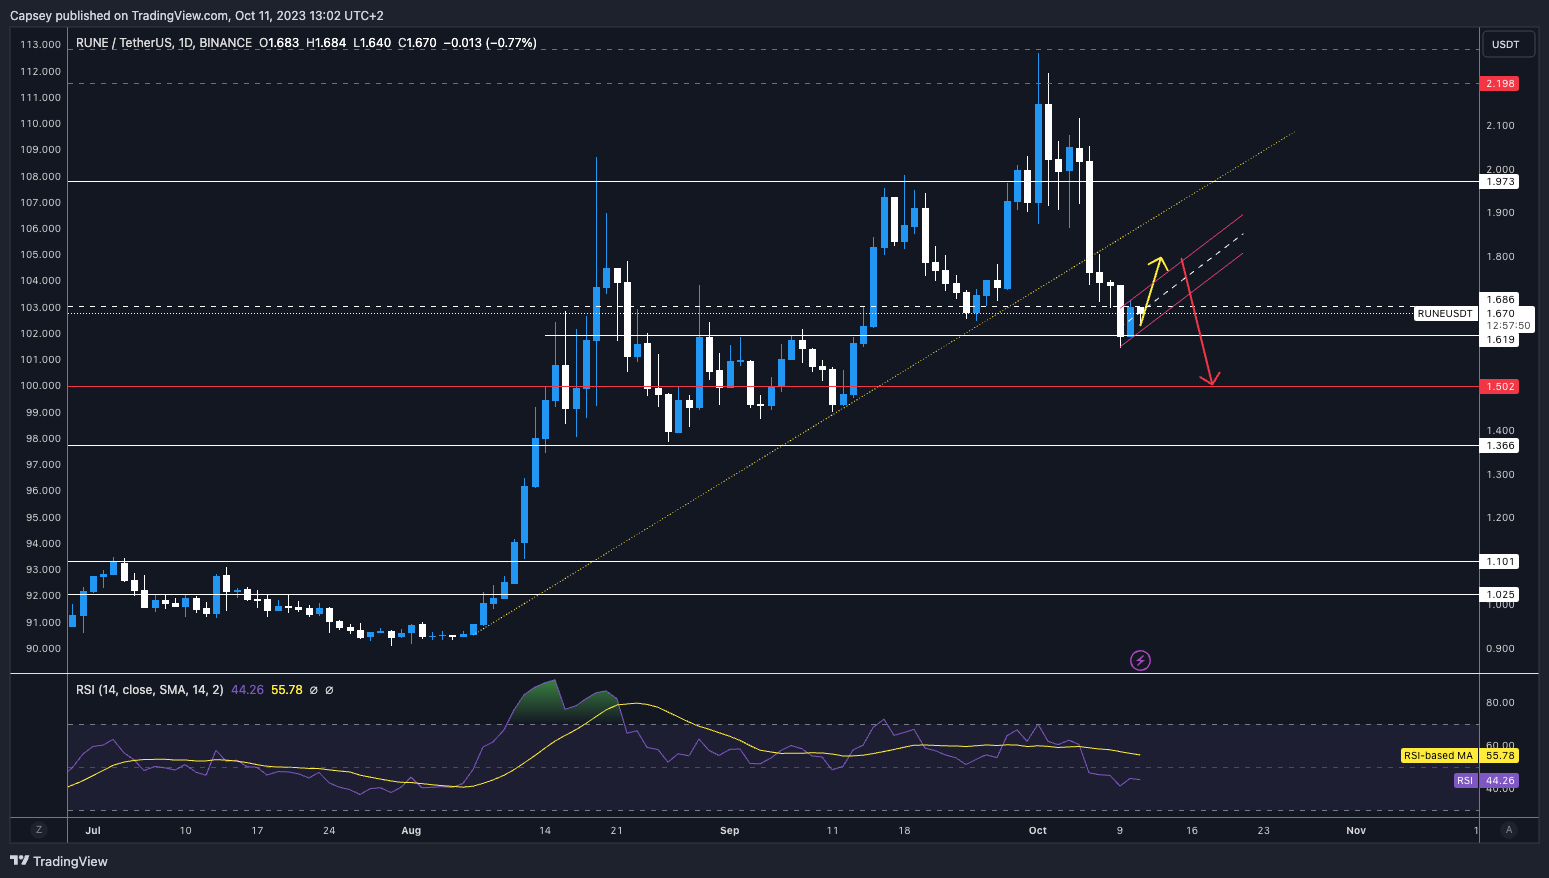
RSI and funding rates
With the RSI at 44, there is more room for this to go in either direction. There are no bullish or bearish divergences as of yet.The funding rate is positive but does not indicate too many longs either.
Both of the above are mixed and don’t provide any clear bias. We need to be aware of both, but no indications here.
Conclusion on trading RUNE
We need to see if there is follow-through from buyers and if we get the formation of a bear flag. It is important to get back above the local horizontal resistance level of $1.68Action
- We are not doing anything here, although if we held a big spot bag of RUNE, we’d still look to offload some of my size into the $1.75 - $1.80 level.
Cryptonary’s take
And that wraps up our analysis on today’s BTC, ETH, SOL, THOR and RUNE.In times like these, when conviction is low, caution must prevail. Though tempting trades may appear, holding a steady course allows us to make rational decisions. You don’t want to FOMO into trades – even if staying on the sidelines means you miss a few opportunistic trades; you can’t afford to fall into the scarcity trap.
The future holds more trades with clear-cut upside ahead – the most important thing today is to ensure that you aren’t unnecessarily burning through your trading capital. Better trades are just around the corner; when those opportunities return, you’ll first hear about them from us.
Cryptonary OUT!
Recommended from Cryptonary


