Save 23% ($351) & Get a Free 1-1 Call with our Team ⏰ : 0d 2h 59m 43s

In the unpredictable world of crypto, the answers aren't always clear. But the charts often provide useful guidance.
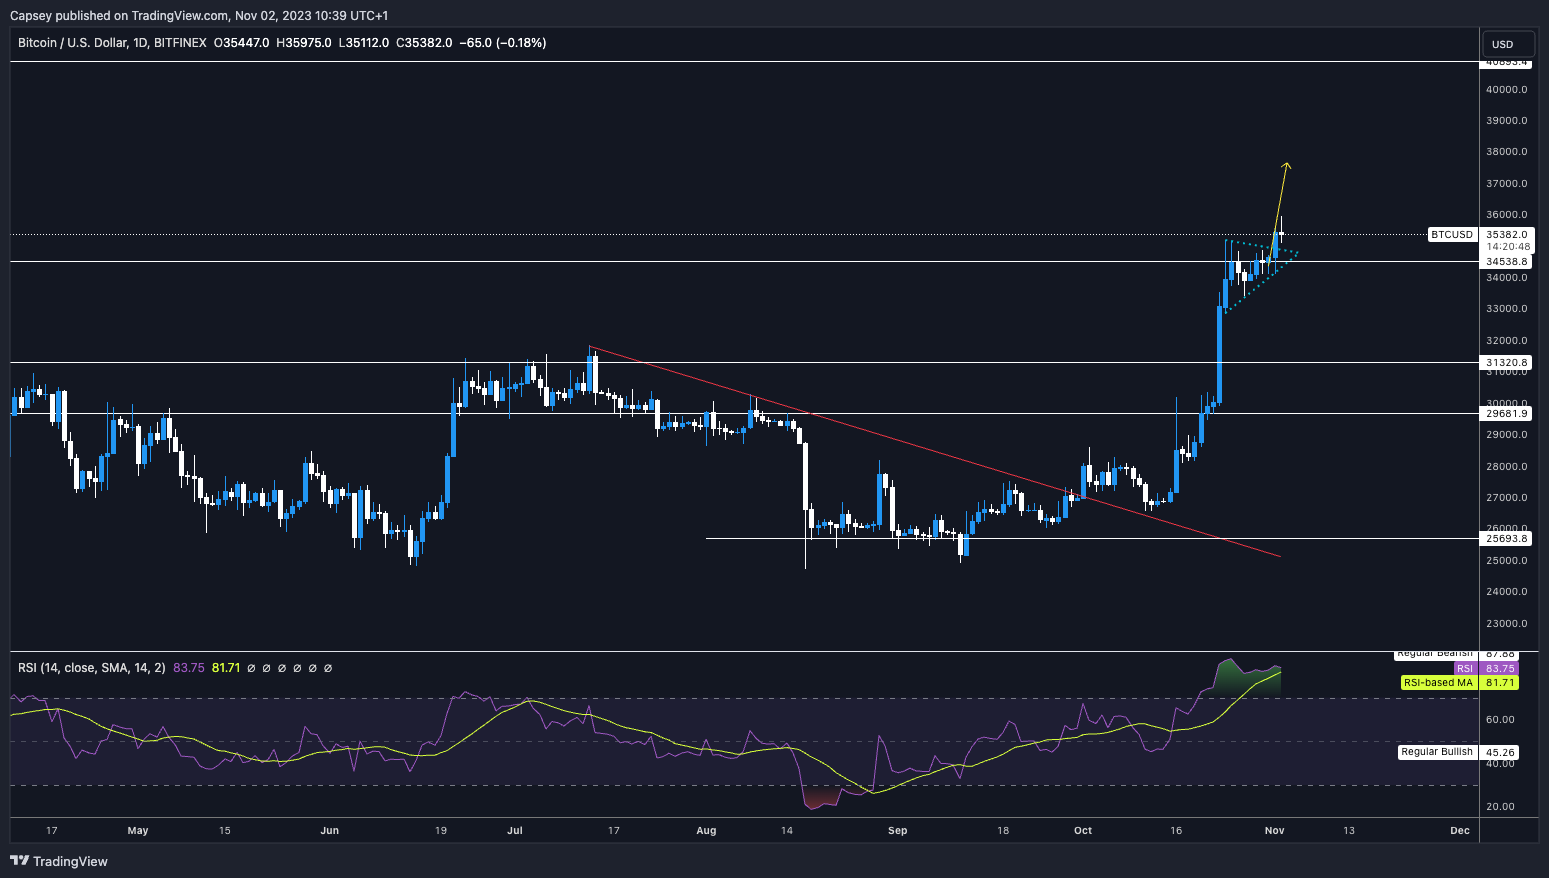
TLDR
- Bitcoin attempted a breakout from $34,500 but faltered around $36,000.
- Technical indicators like RSI and funding rates signal caution.
- We advise against new long positions and recommend that you await a more substantial pullback.
Disclaimer: Not financial or investment advice. You are responsible for any capital-related decisions you make, and only you are accountable for the results. “One Glance” by Cryptonary sometimes uses the RR trading tool to help you quickly understand our analysis. They are not signals, and they are not financial advice.
Technical analysis
BTC held and consolidated around the $34,500 level while building inside the bull pennant. Late yesterday, BTC managed to break out from the bullish pennant and test the $36,000 area. We felt BTC would break to the upside to push to a higher price target of around the $37,000 to $38,000 area.Unfortunately, BTC only tested $36,000. It immediately rejected at that level, and we are back in the mid-$35k range.
Does BTC continue to push higher, or is this the end of the current rally? Should we now expect a deeper pullback? Let’s turn to the RSI.
RSI and funding rates
The RSI is now giving us more significant information. On the daily chart, we remain heavily overbought (83 on the daily timeframe). On this most recent move up in price, we have formed a bearish divergence for the first time. This is a higher high in price and a lower high on the oscillator. This could see price have a more meaningful pullback.Currently, the funding rate is very positive. This is the most positive it’s been since this move-up began a few weeks ago. Alongside this, open interest is also very high. This indicates that the futures market is overheated here, which is usually not positive for price.
The RSI and the market mechanics suggest we should be cautious here.
BTC 1D
Cryptonary’s take
Despite the overall price action being positive and BTC breaking out from its bullish pennant, the breakout was somewhat underwhelming.We can now see several bearish indicators showing up– that’s our clue on the need to be somewhat cautious on this move higher.
The odds for an upside move were relatively high before the breakout of the bull pennant. Now, the odds of a further move higher from here are much closer to 50/50. Therefore, we should be somewhat cautious.
Action
- Odds of further upside for BTC have decreased following a breakout that was somewhat weaker than expected.
- We wouldn’t look to add new longs/buys here, and we would wait for more meaningful pullbacks before considering fresh longs/buys.
- Our medium-term target for BTC is still north of $40,000 to $42,000.
Recommended from Cryptonary


