Save 23% ($351) & Get a Free 1-1 Call with our Team ⏰ : 0d 2h 59m 44s

In this report, we’ll dissect Q1’s price action and predict how the market will perform in Q2. Let’s dive in!
TLDR
- Bitcoin and the Total Market Cap are at resistance. They’ll likely go down in early Q2, but then rise higher!
- Ether closed last month’s candle above $1740. This suggests $2000 could (and likely will) be tested in Q2.
- RUNE, SNX, and DYDX closed March above support. They will need to hold these levels on the weekly timeframe if they are to go higher in Q2.
- PENDLE is on a rampage - expect $0.52 in Q2 (38% away from its current price).
- SYN closed right into support, so holding $0.90 on the weekly timeframe is necessary to keep upside on the cards.
- HEGIC perfectly retested the $0.01590 - $0.01815 support area in March. Holding this area as support is crucial for further upside. We believe HEGIC might be an outperformer during Q2.
- THOR closed March under support ($0.20). During Q2, it will head to $0.13, the nearest support level.
- MINA closed March under support ($0.79). We should expect downside in April.
Disclaimer: Not financial or investment advice. You are responsible for any capital-related decisions you make, and only you are accountable for the results.
Total Market Cap (Monthly)
The Total Market Cap index represents the entire cryptocurrency market. We track this index to understand where the market is now and predict where it will likely go next.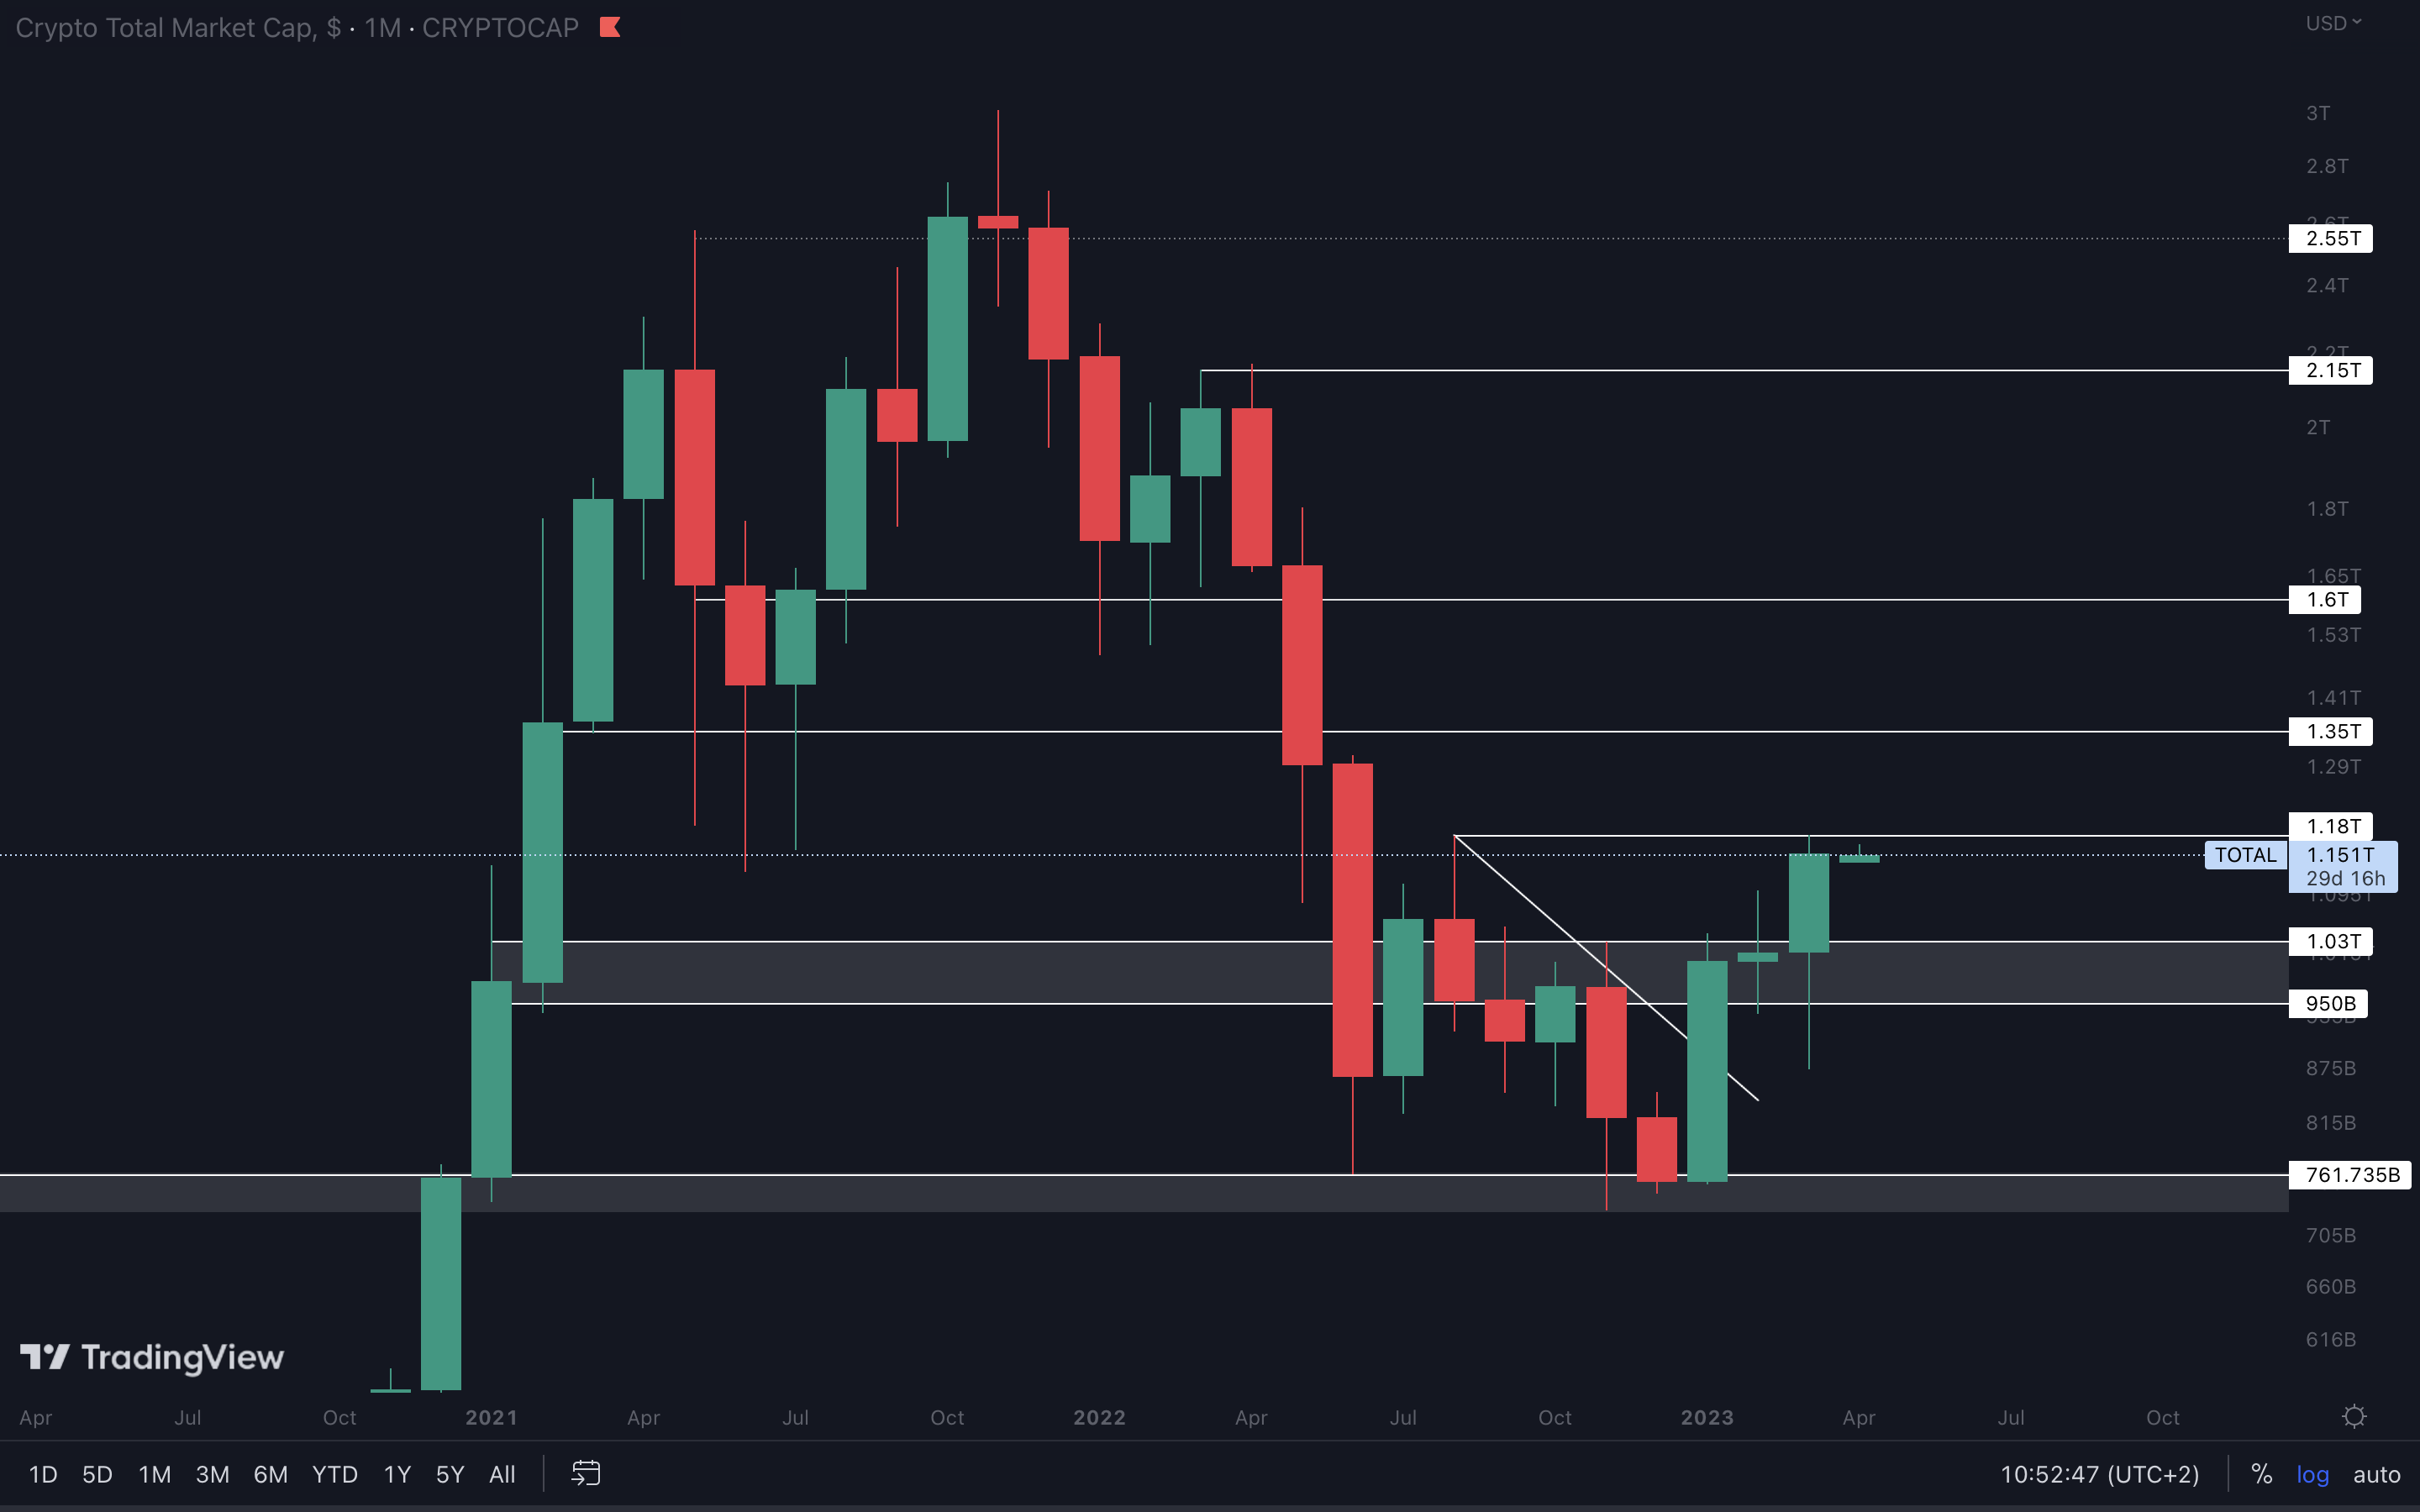
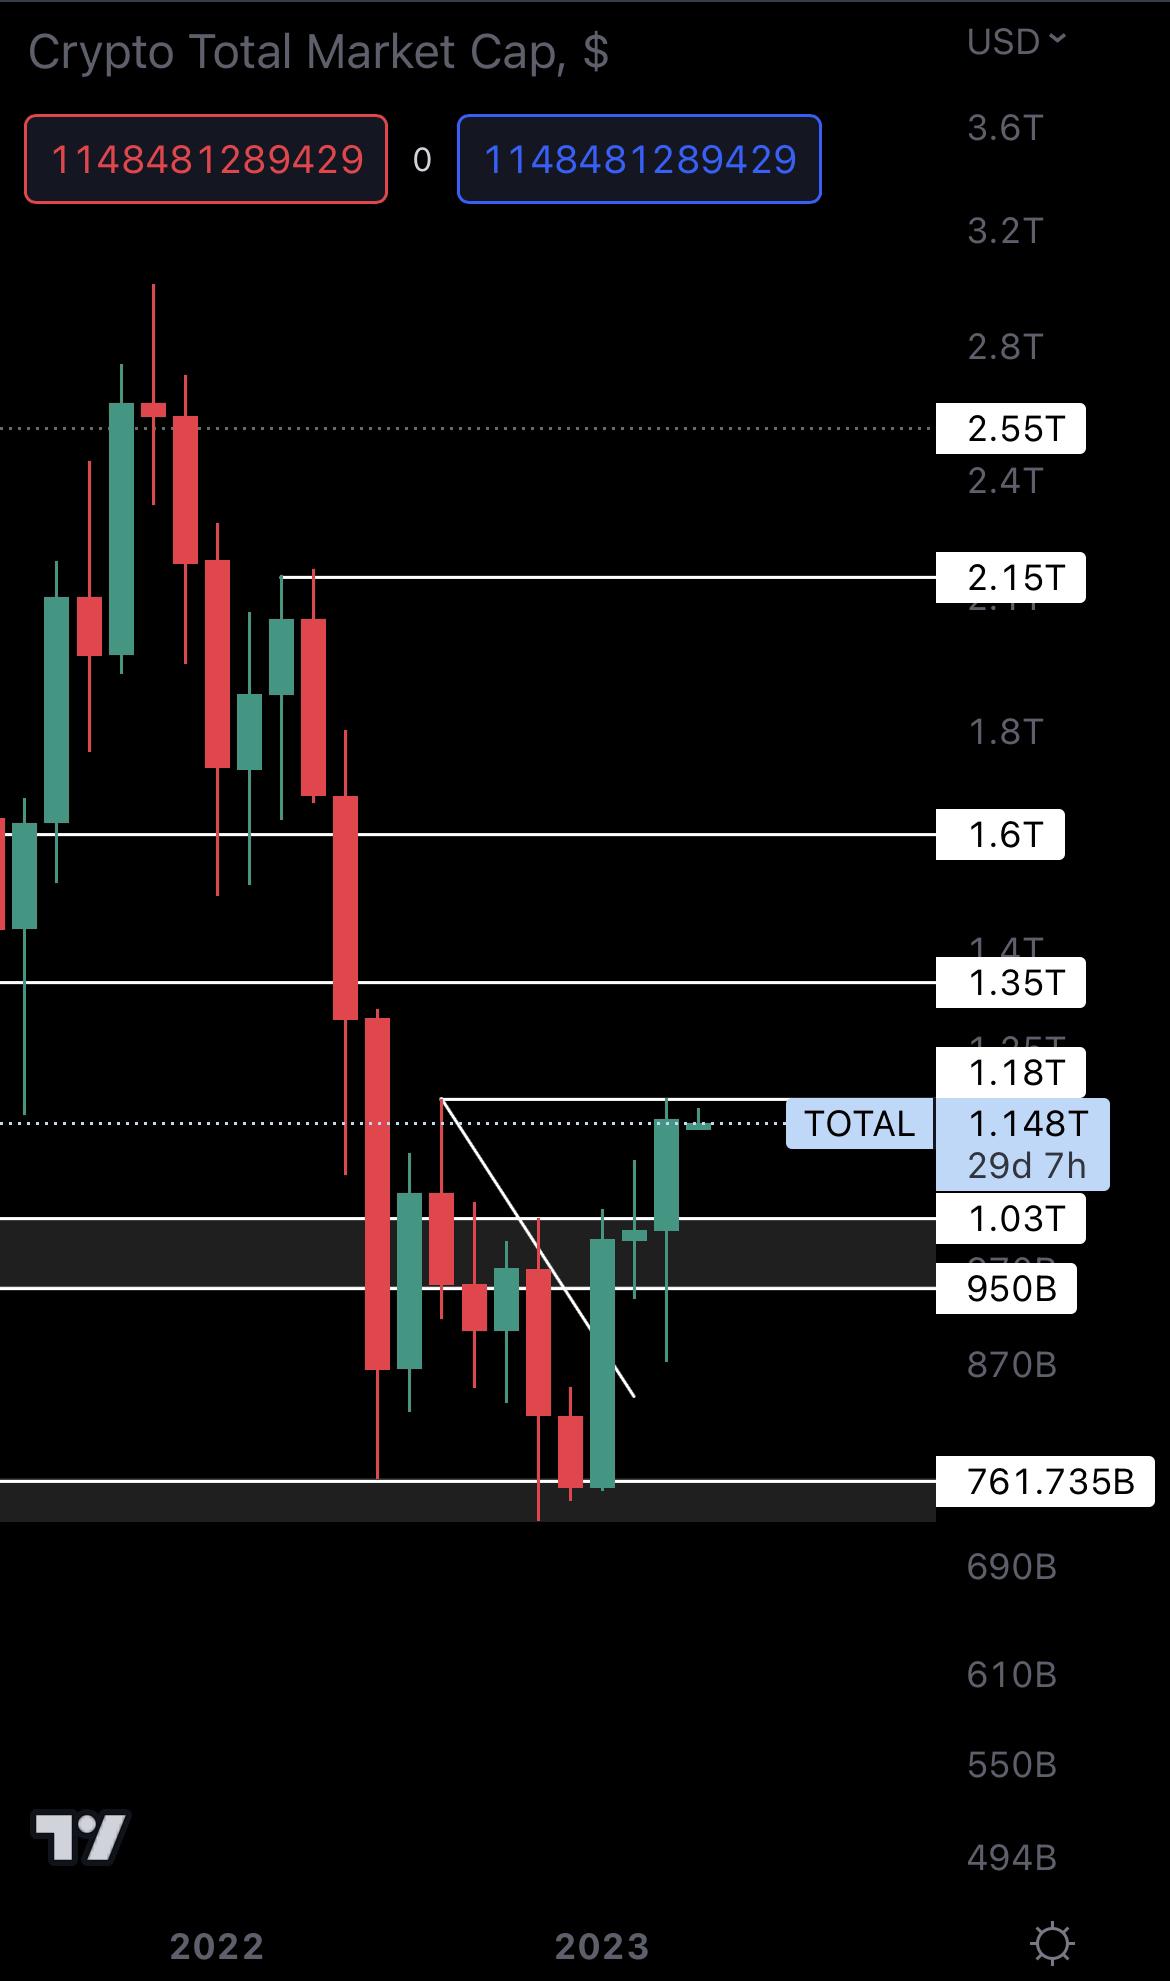
What a quarter for the crypto market! We hope our alpha helped you to make money. After all, that’s the goal! The Total Market Cap closed March right under resistance. This aligns with our expectations for a pullback, and we could see the market go down in April. We don’t recommend buying anything right now, but instead waiting for the market to go down. That will give you lower entries to trade, or even accumulate from! From a technical standpoint, all timeframes are now bullish, so the only thing we can expect for Q2 is upside. Our take? The Total Market Cap will reach $1.35T in Q2.
Altcoins Market Cap (Monthly)
The Altcoins Market Cap index represents the entire evaluation of the altcoins market (all coins other than BTC).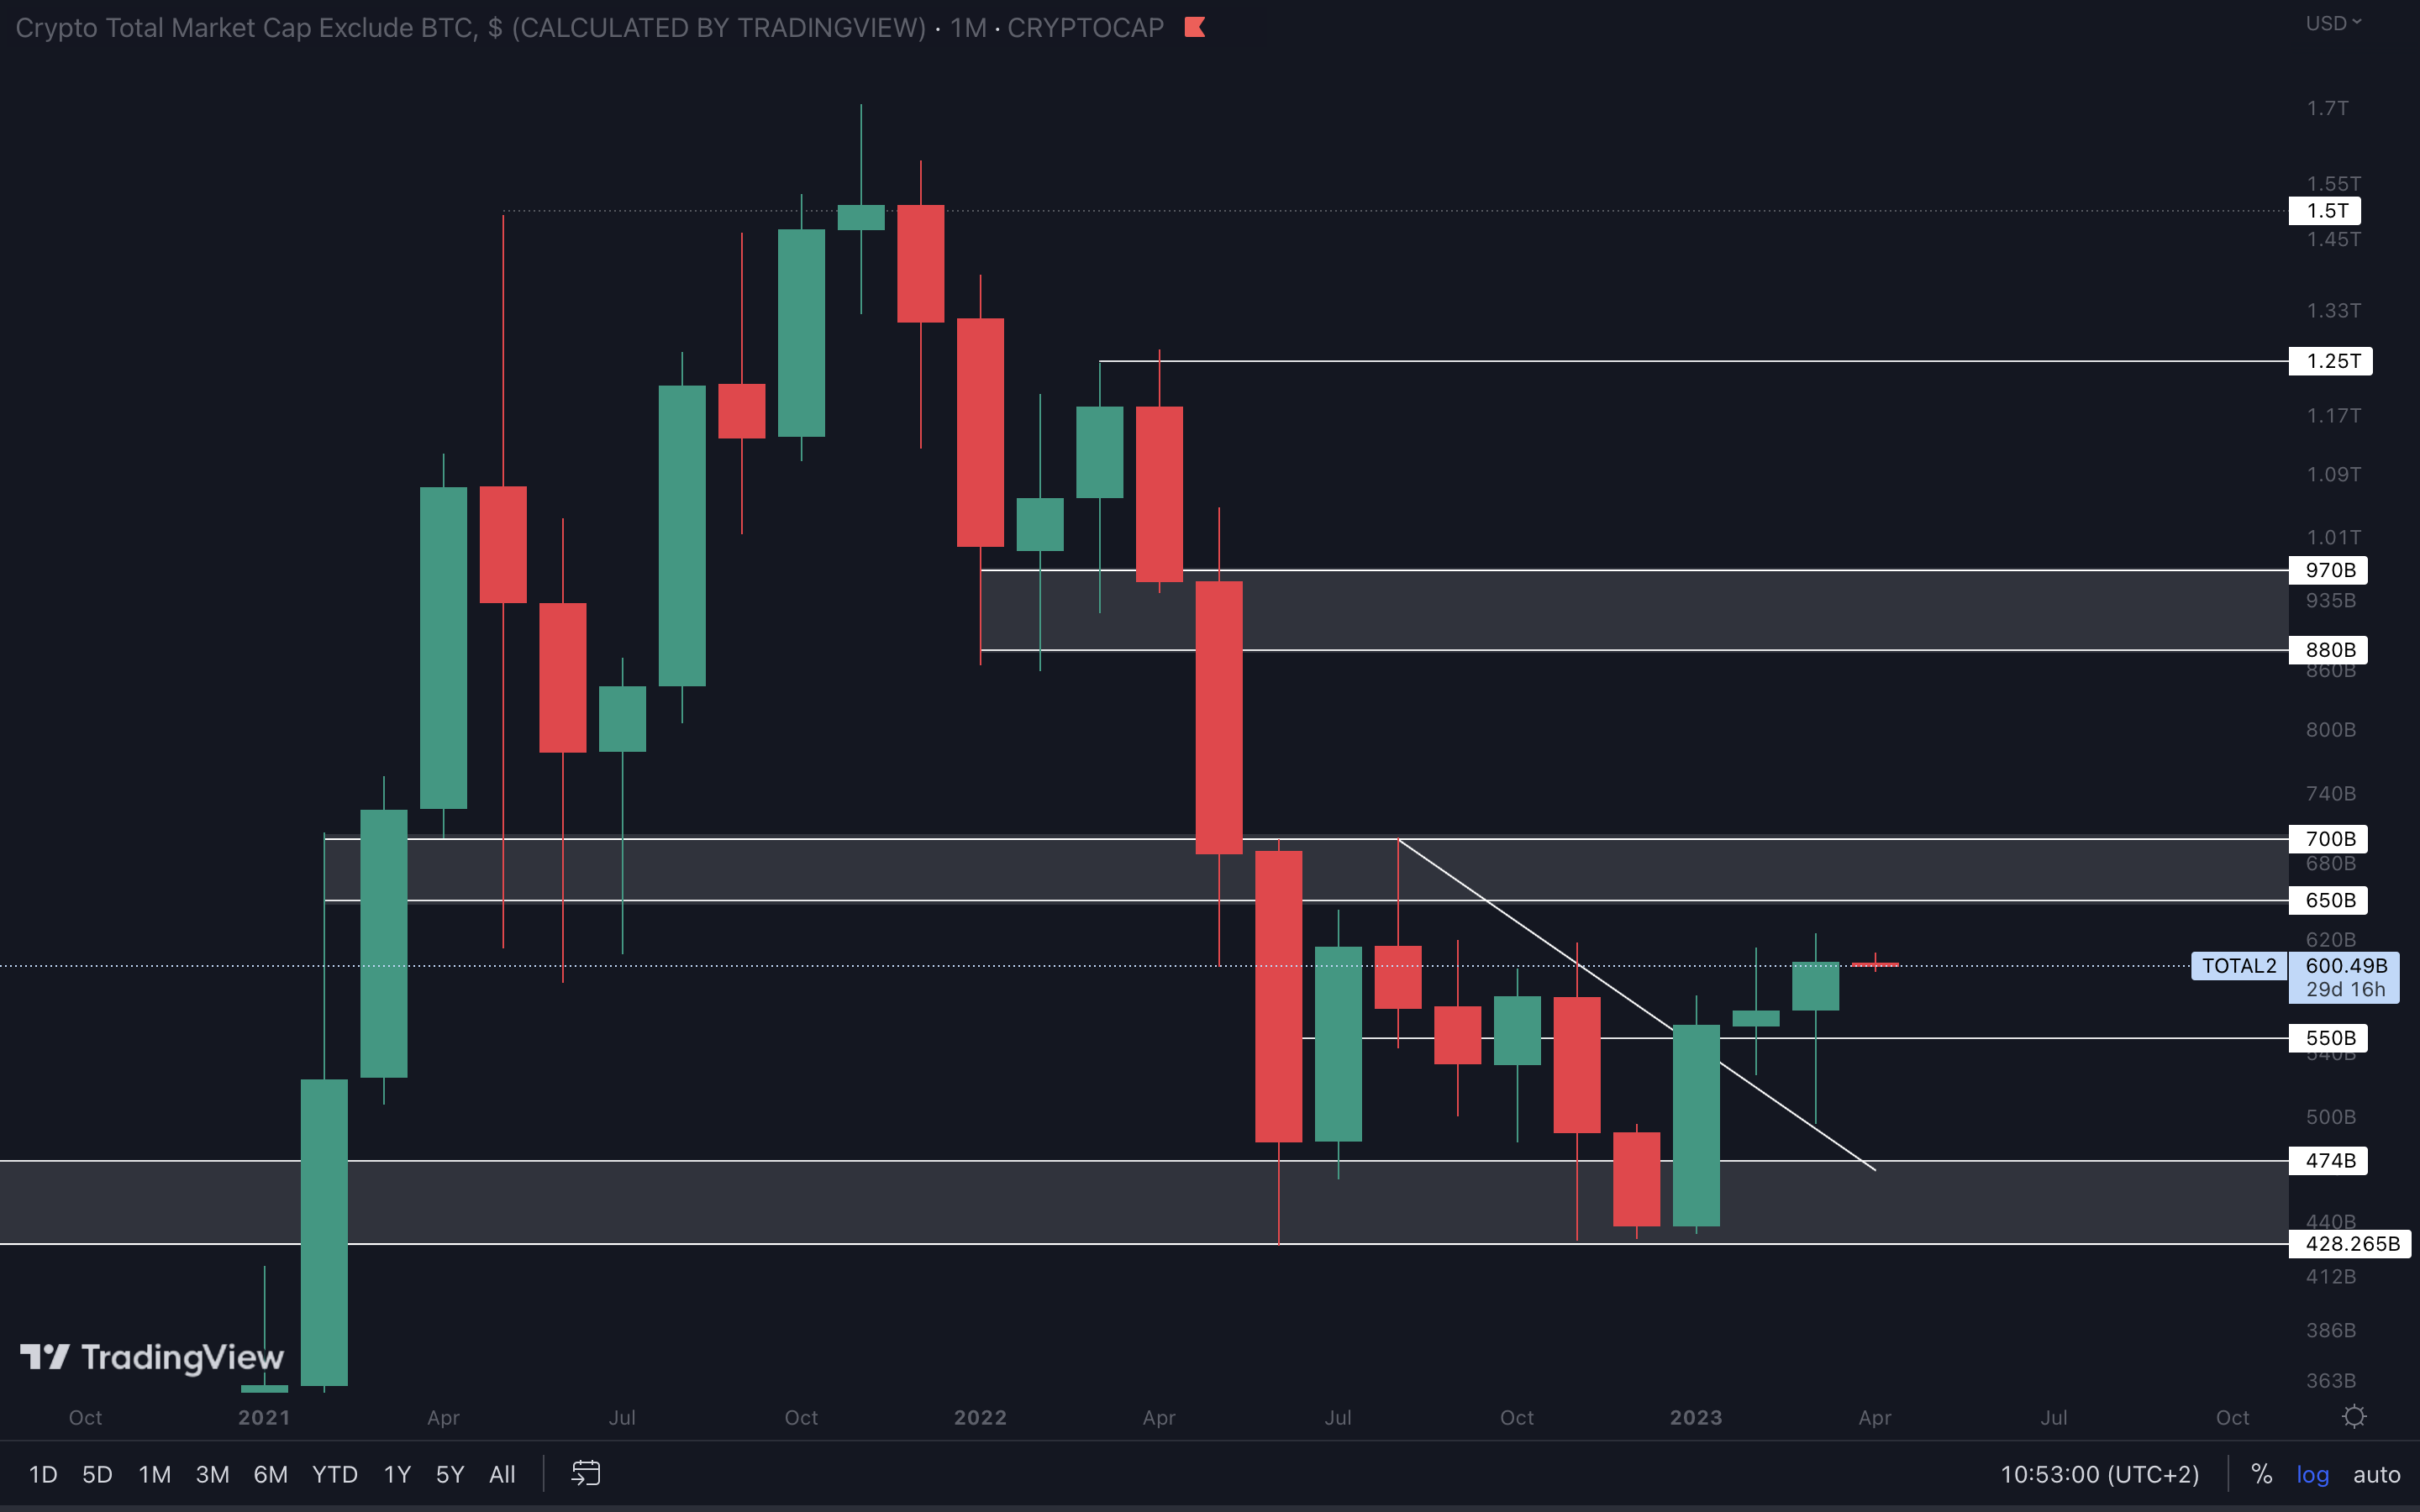
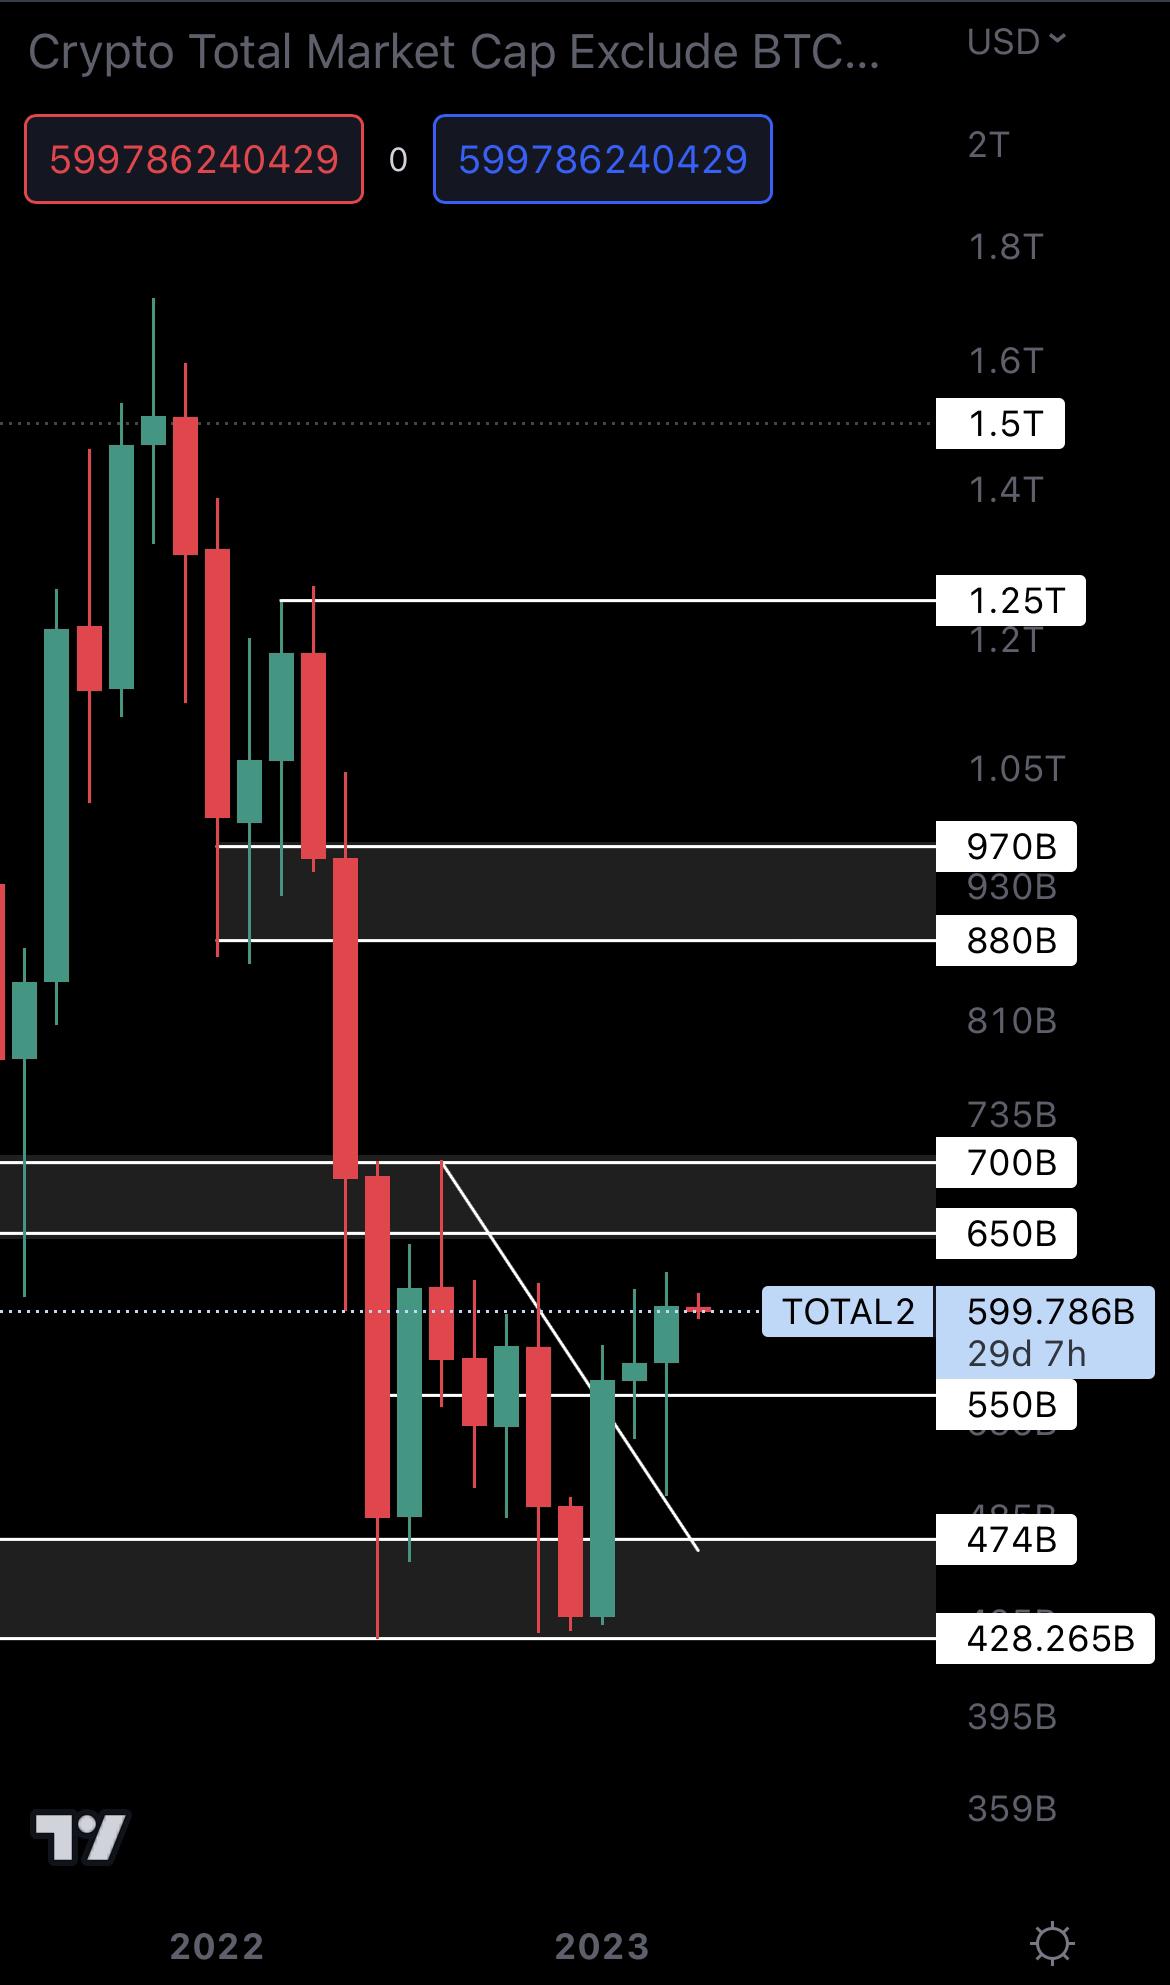
Despite experiencing selling pressure in March (as we can see in the wick), the altcoins market still managed to flip the monthly candle green and rise toward $650B, closing above $550B in the process. So, we now have $550B as support under the current price, which needs to be lost to invalidate the altcoins market from reaching $650B - $700B. We don’t believe that will happen. Instead, we think the index will reach $650B - $700B in the coming months.
Cryptonary's Watchlist
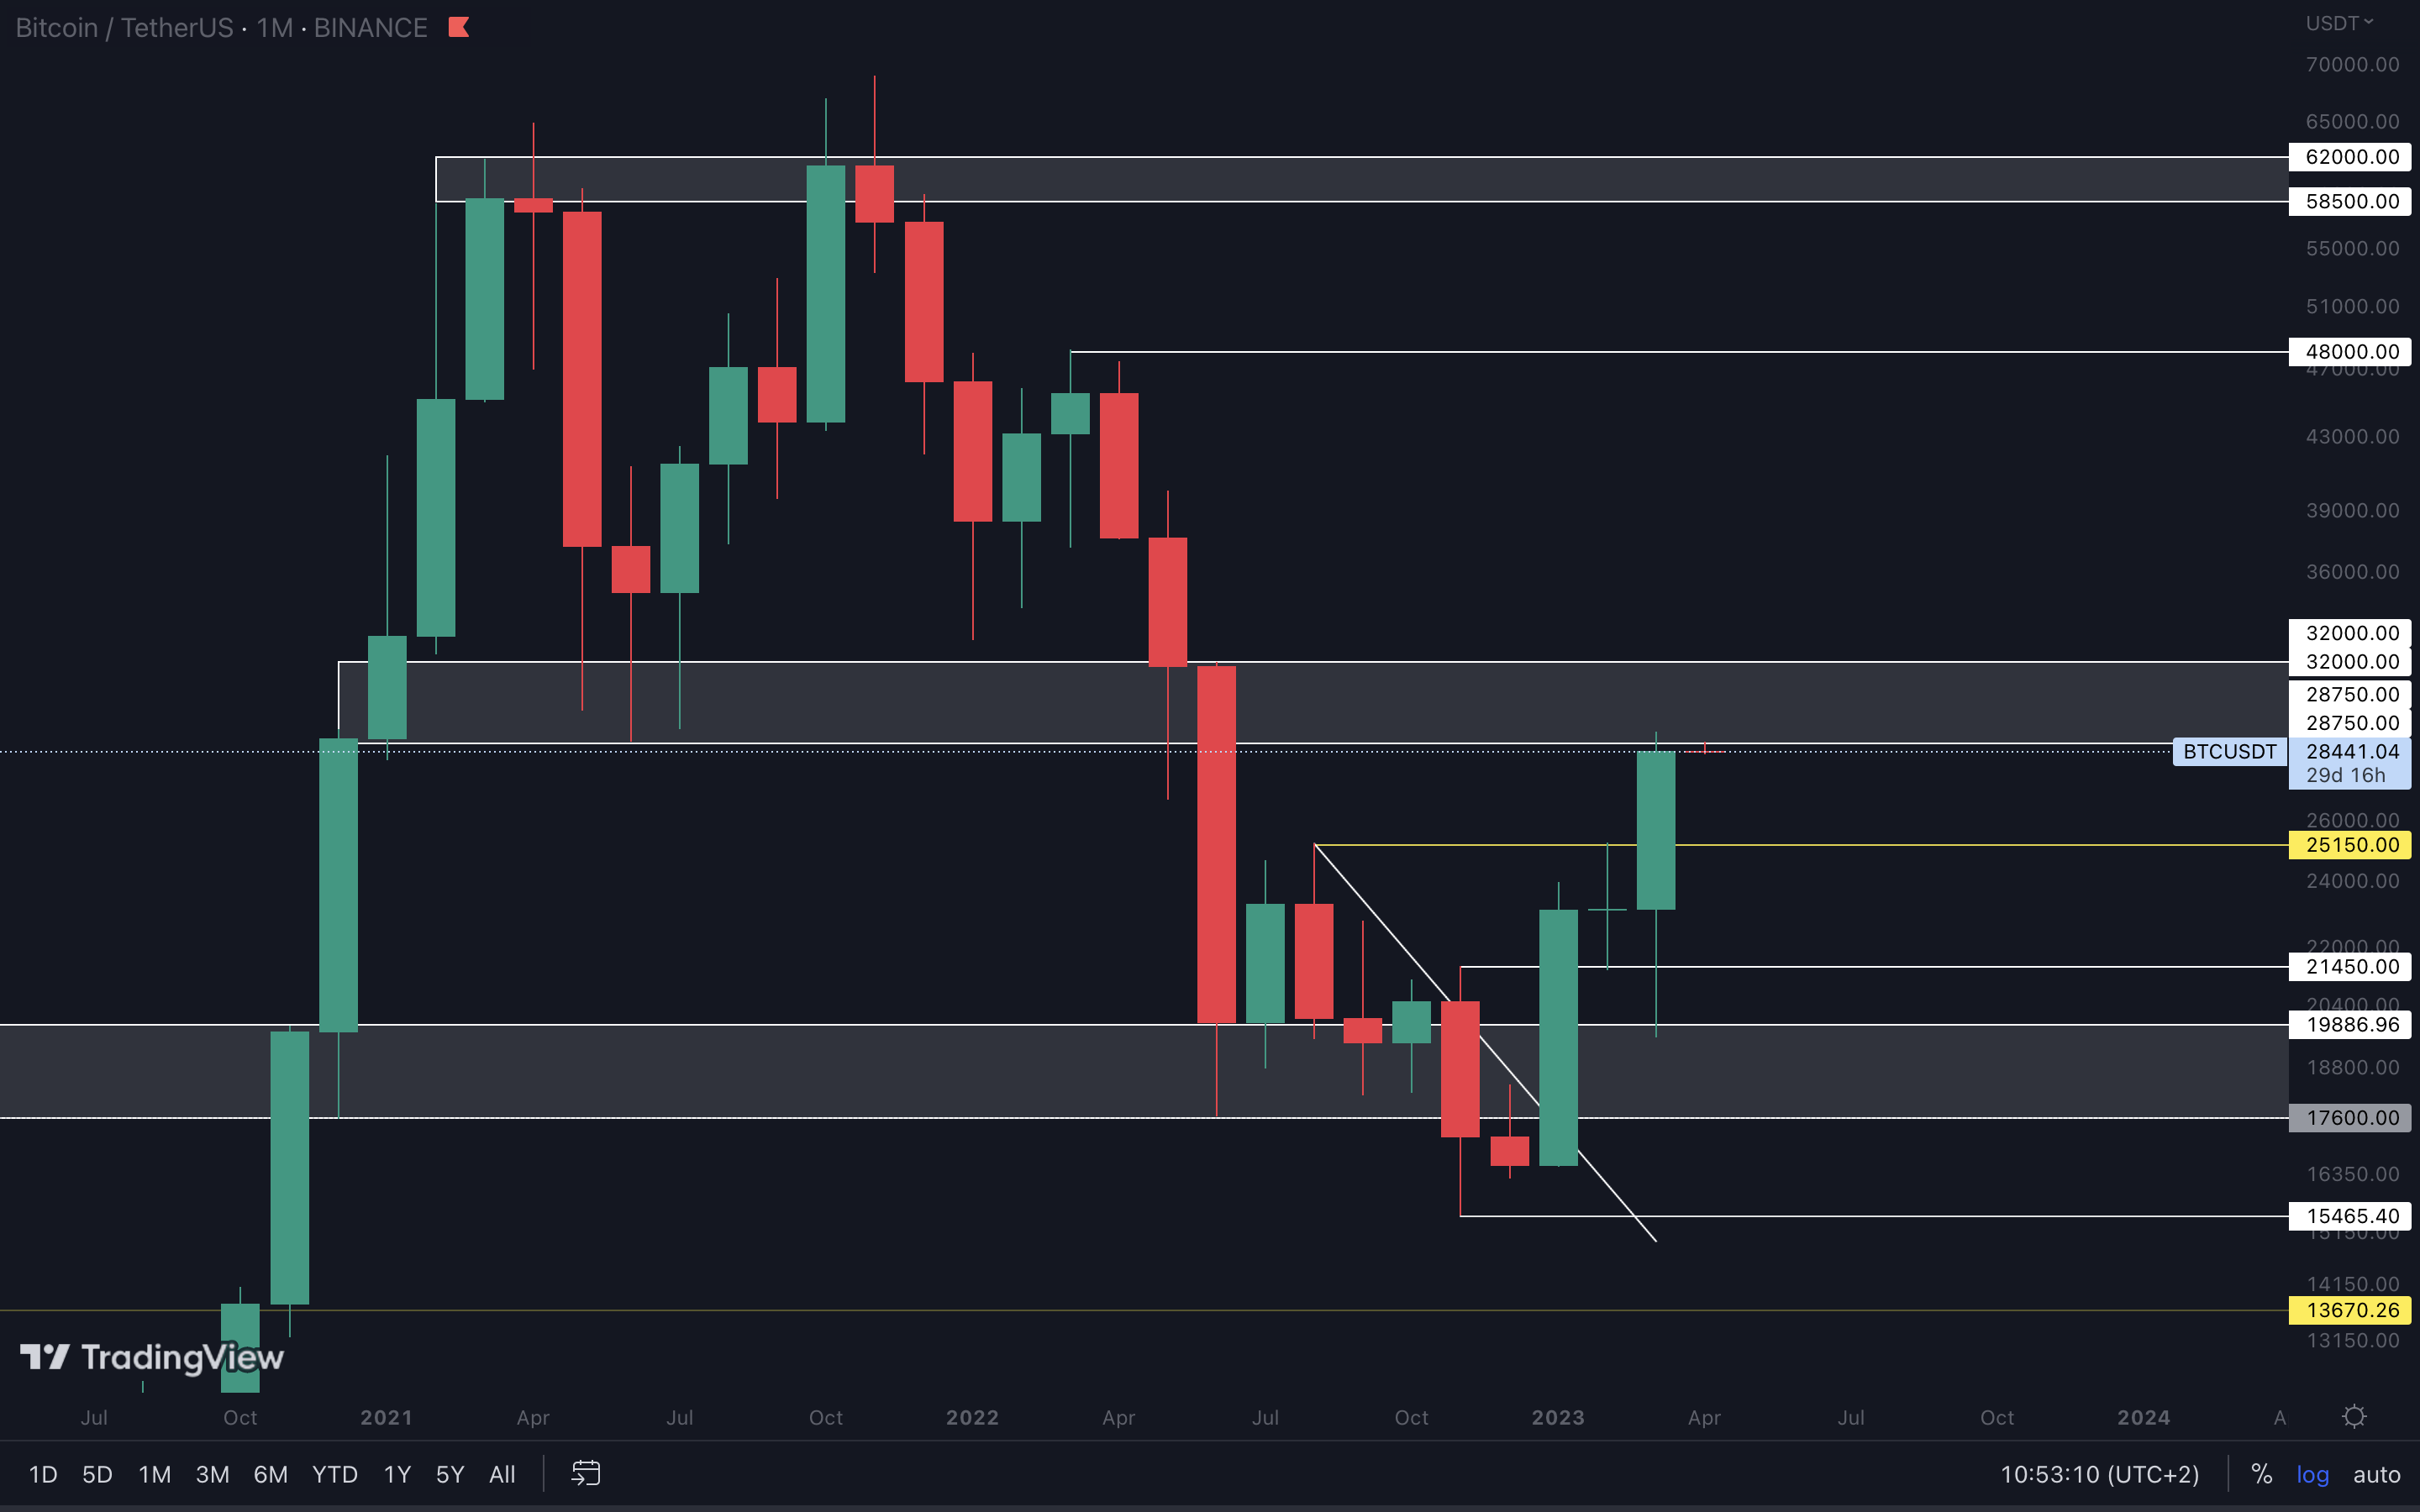
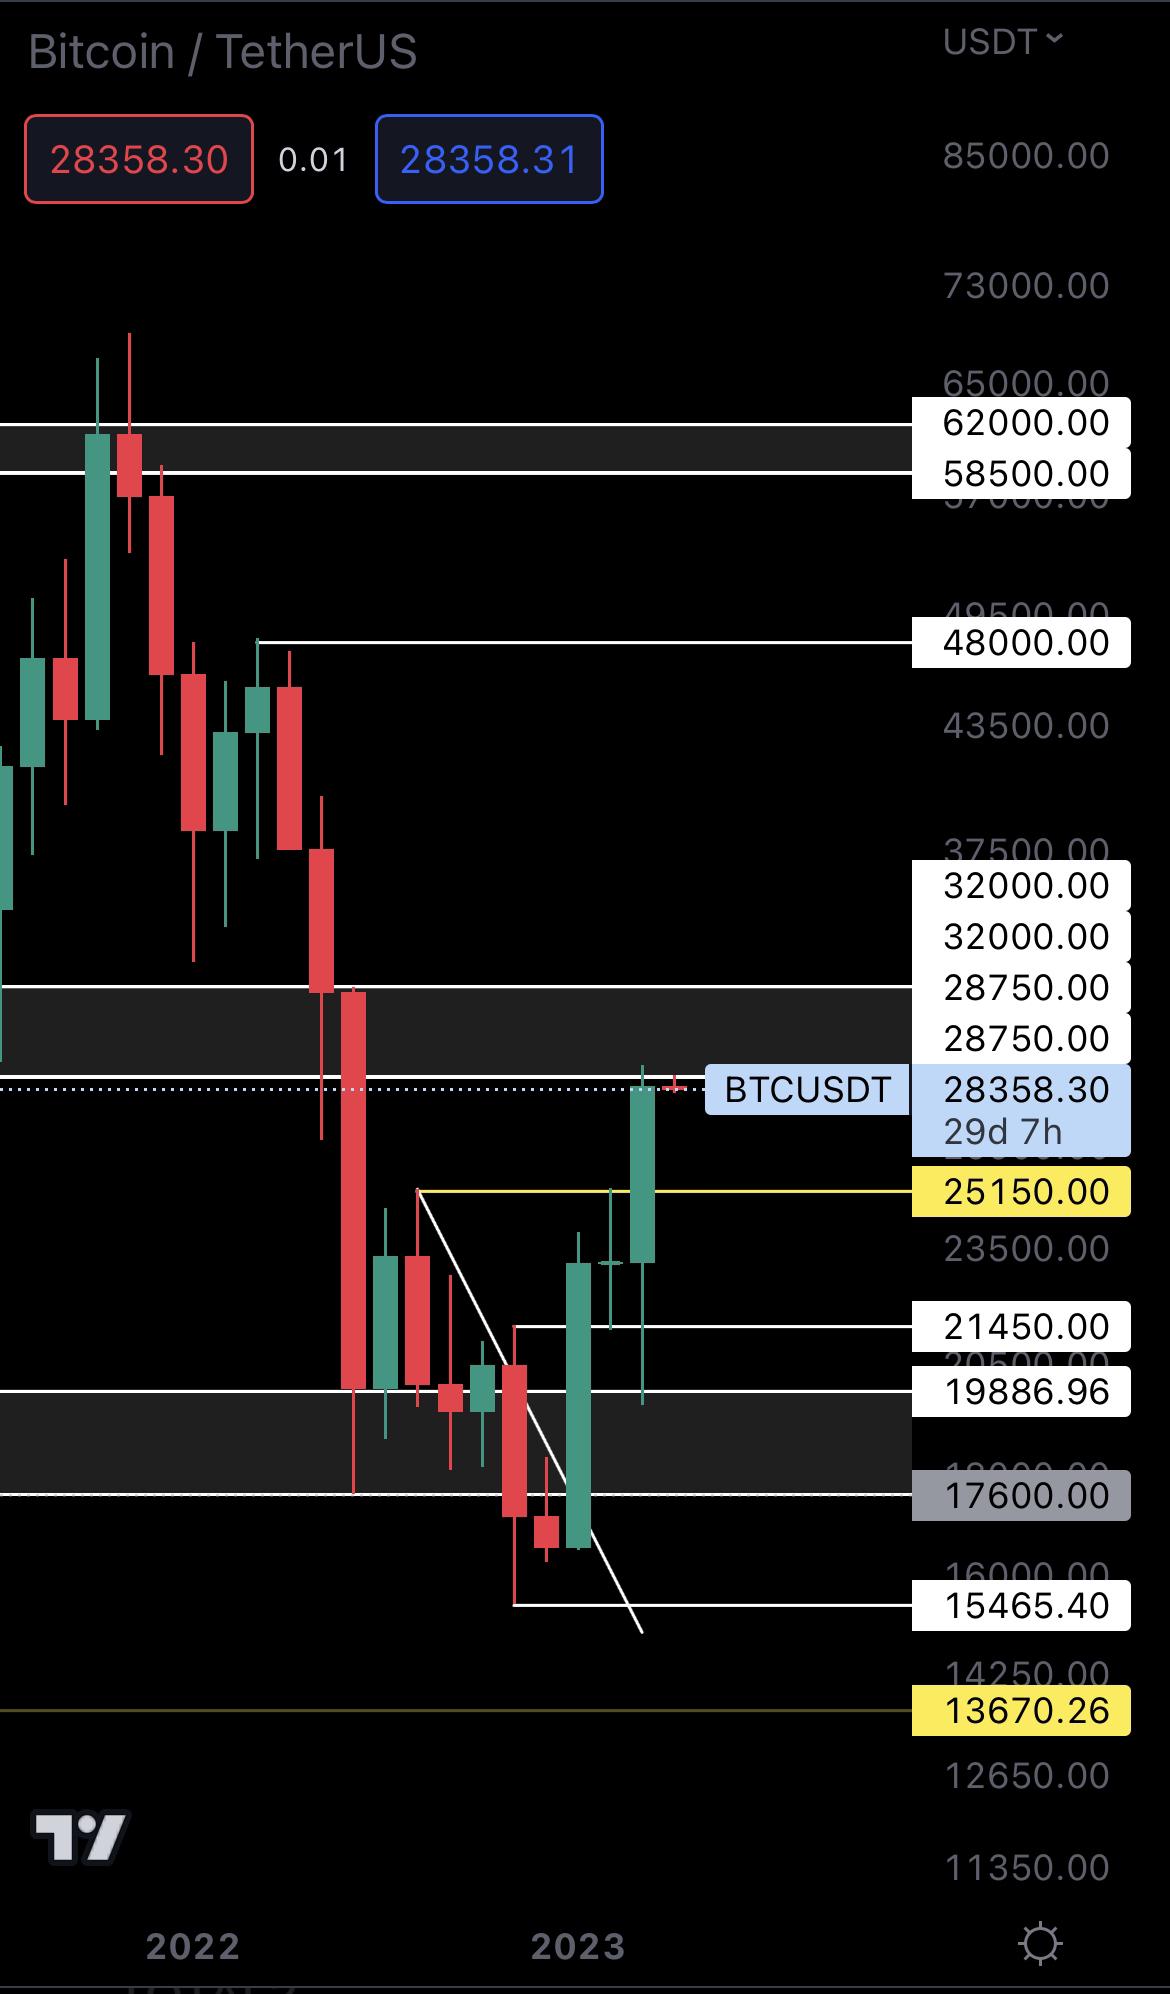
BTC | Bitcoin (Monthly)
ETH | Ethereum (Monthly)
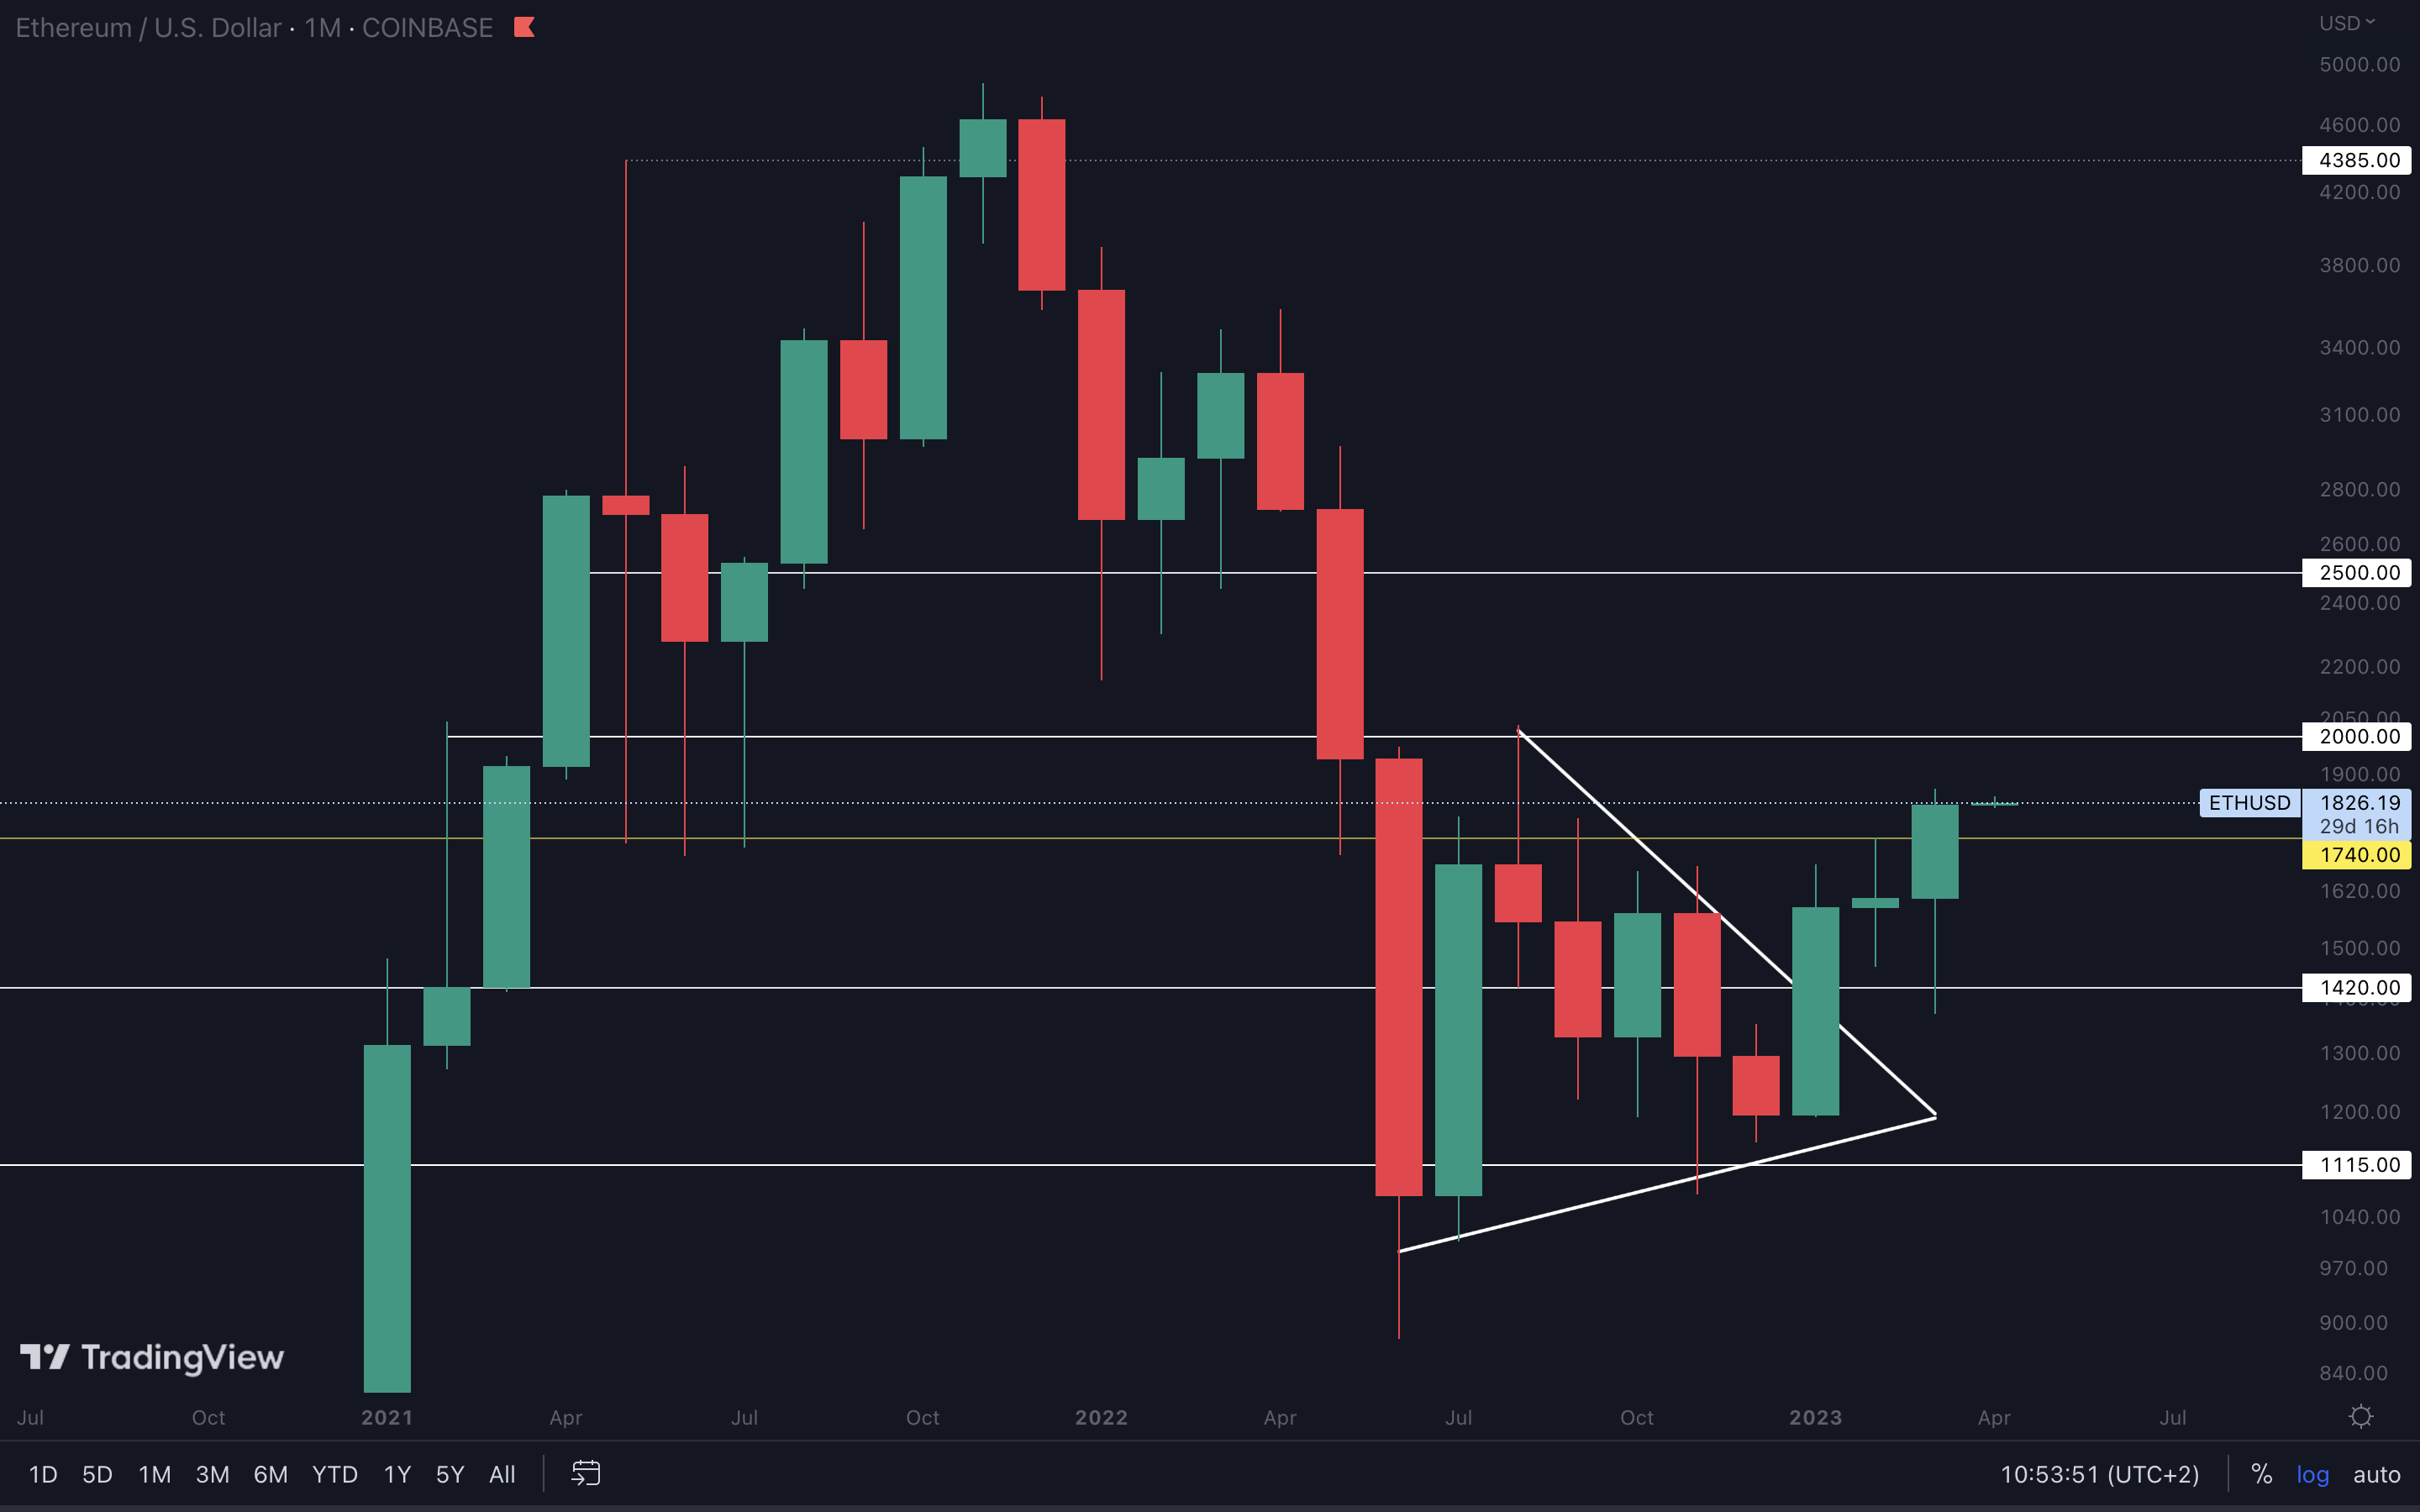
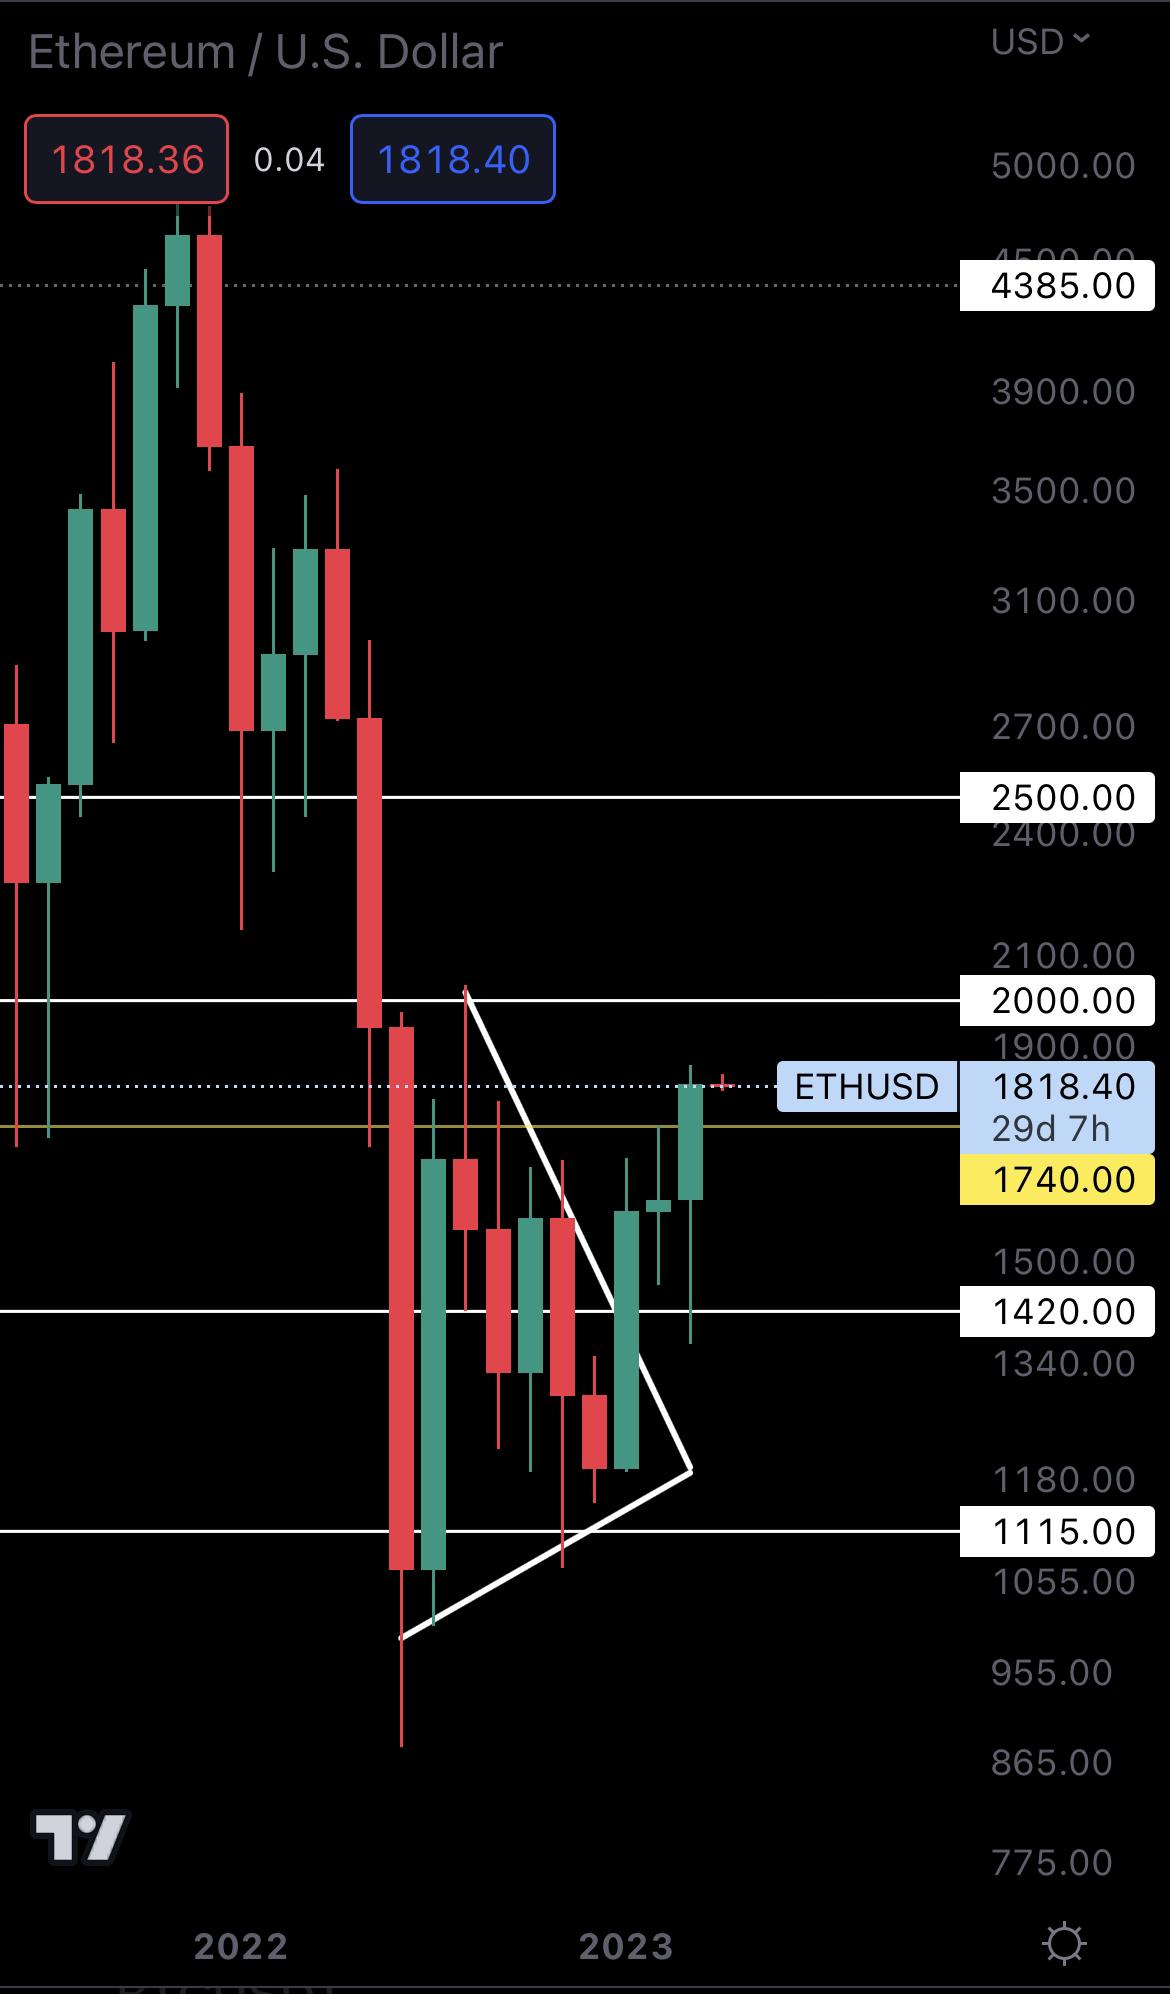
From a technical standpoint, Ether should have no issue in reaching $2000 in the next 3 months. In fact, the move is so small (in terms of percentages) that it is almost guaranteed. However, we have to link Ether’s price action to Bitcoin’s. If Bitcoin takes the pullback route and drops, Ether will likely lose $1740 as support on the weekly timeframe. However, this will not affect its trajectory to $2000, because we closed March above $1740. Only a monthly closure under $1740 would invalidate the move to $2000. A $35,000 - $40,000 BTC puts Ether at around $2500.
DYDX | dYdX (Monthly)
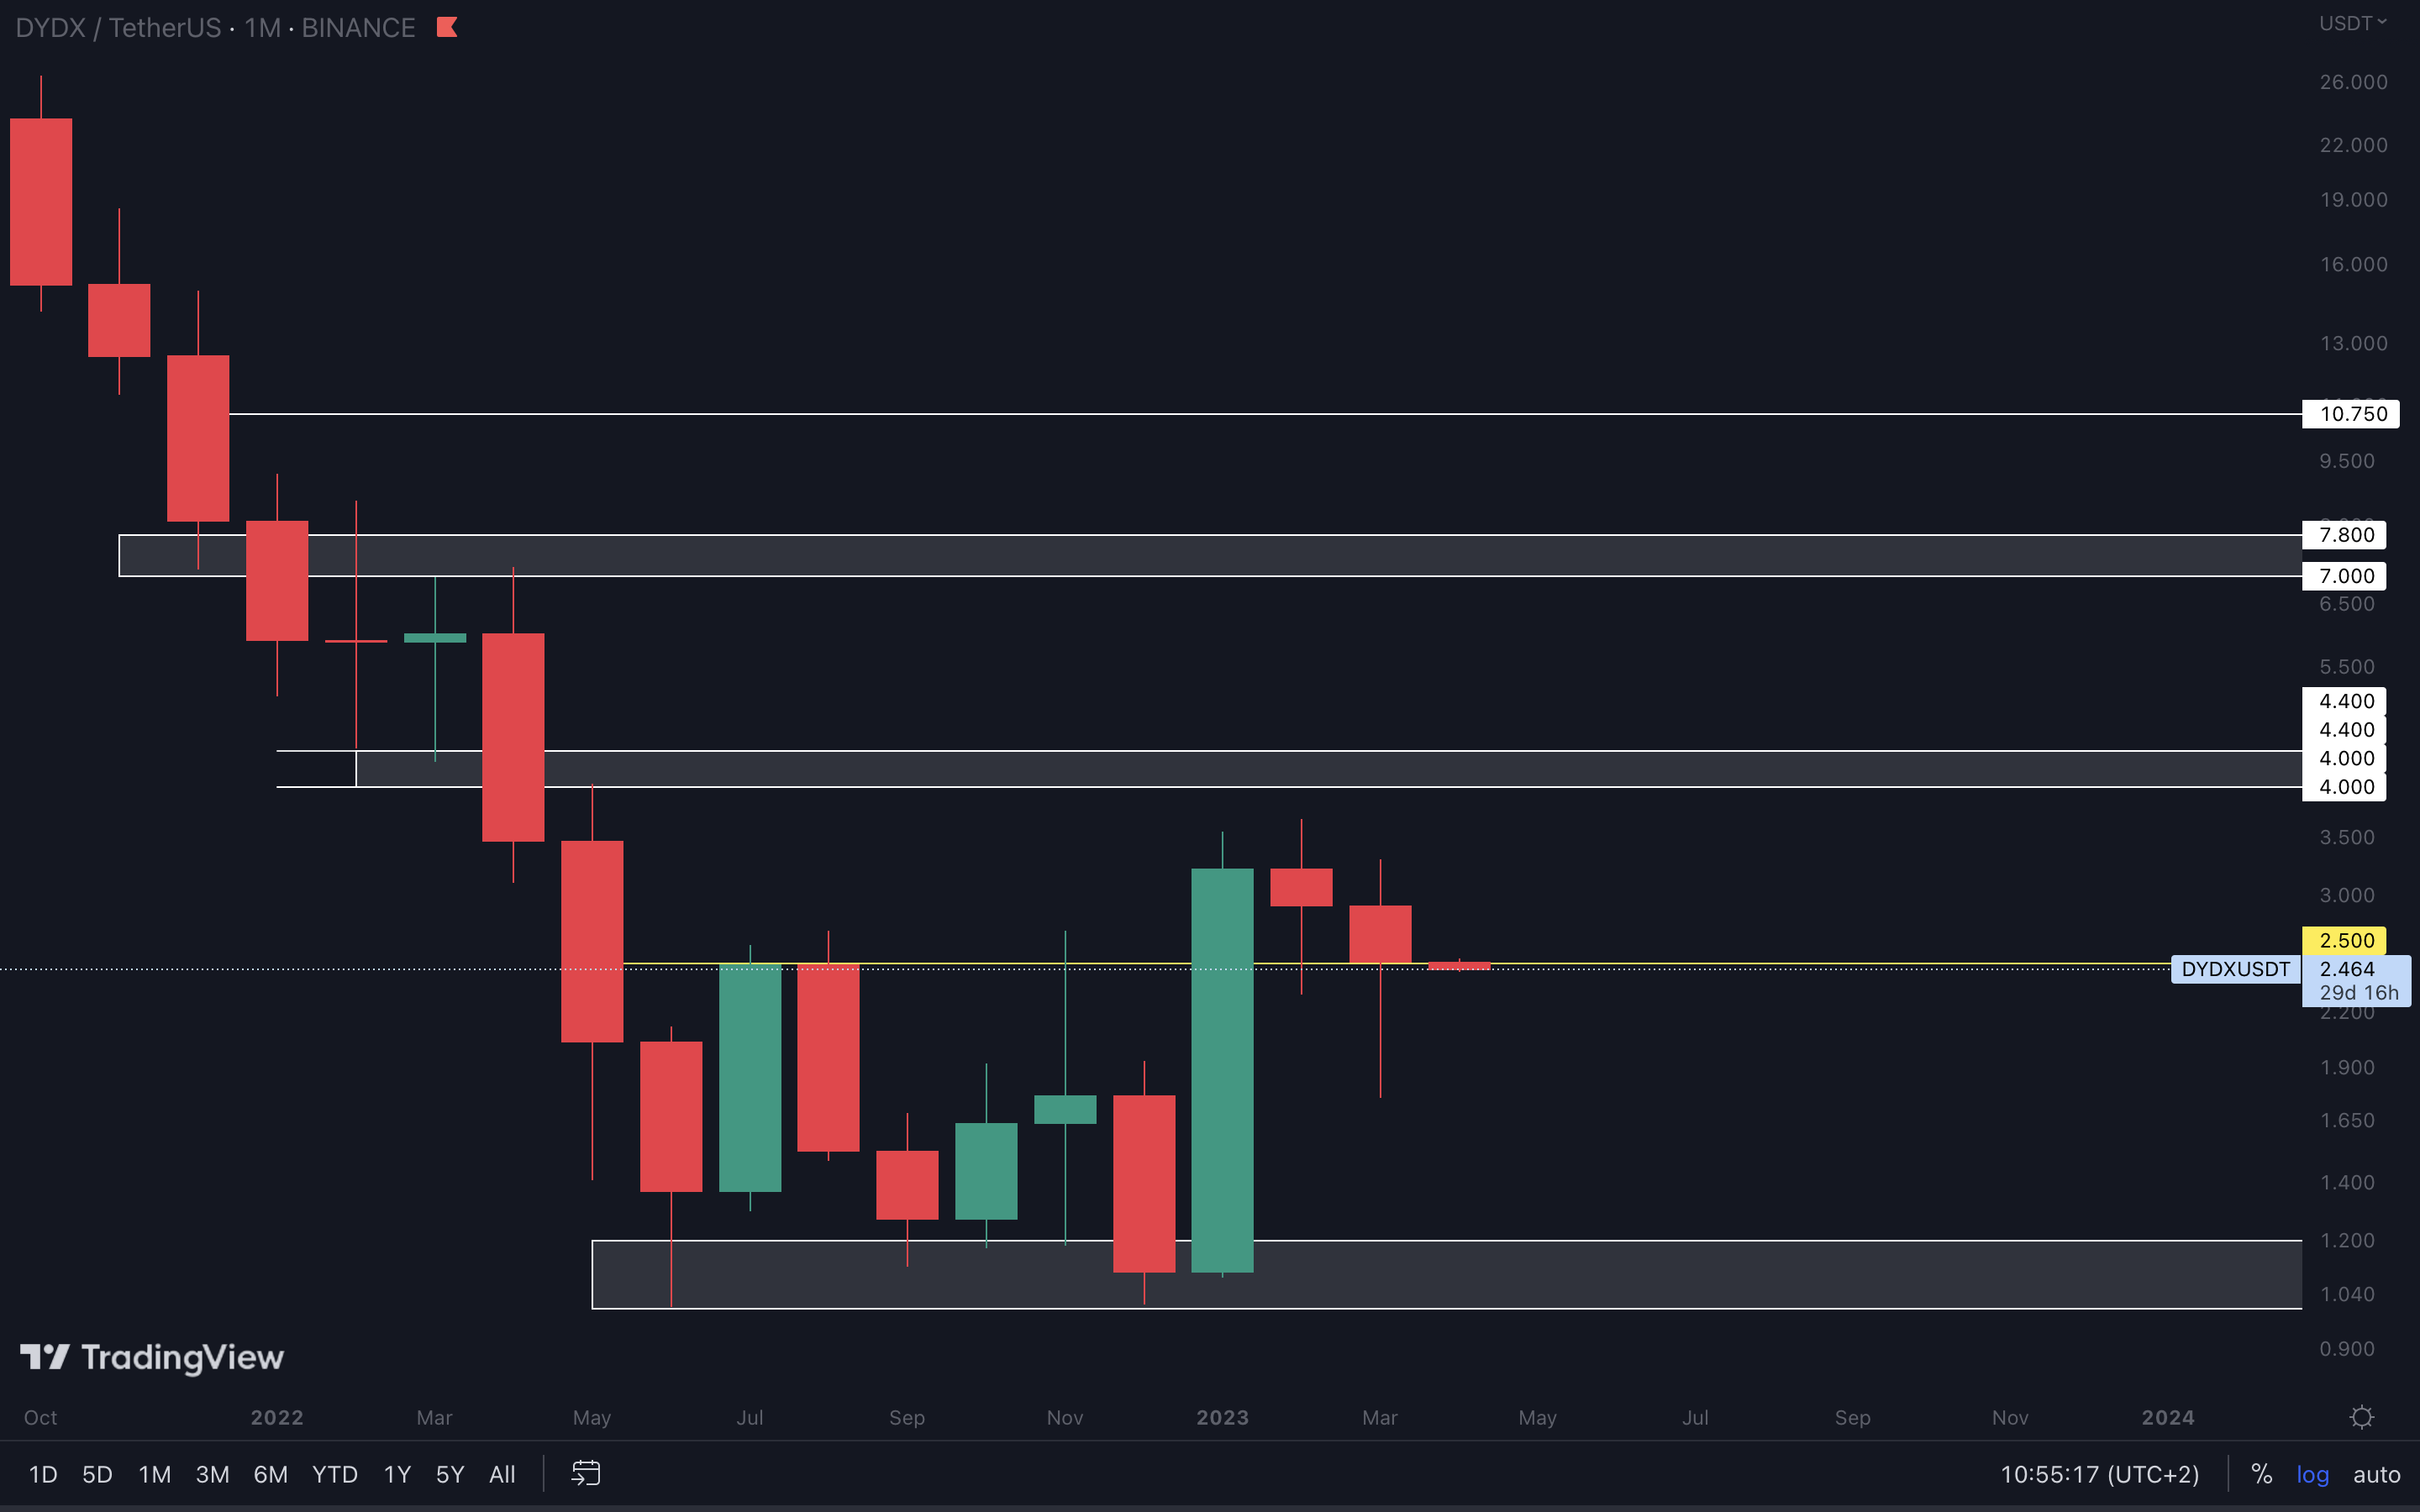
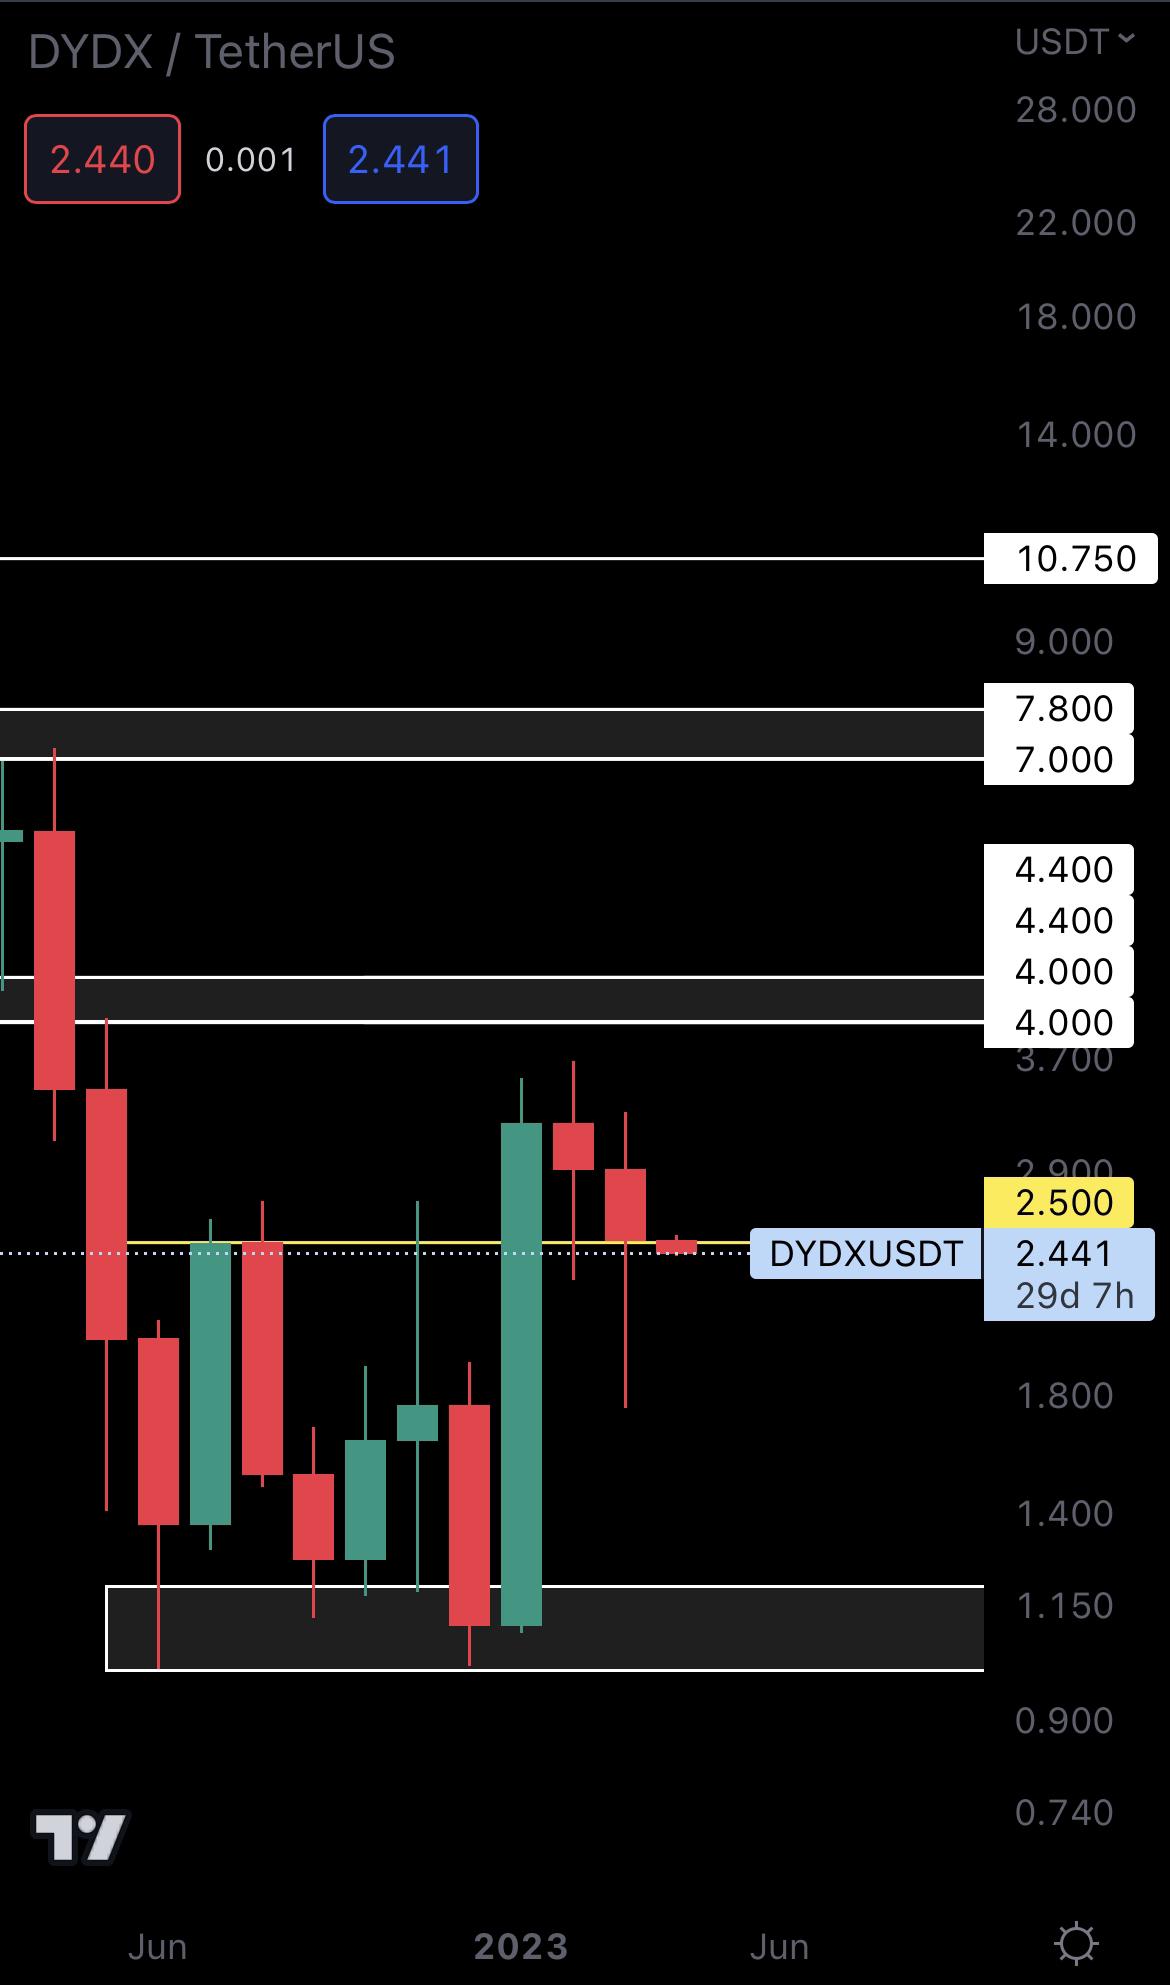
DYDX closed March above support ($2.50). This should prevent any further downside as far as the monthly timeframe is concerned. But, we’ll likely see this level lost on the weekly timeframe. Holding $2.50 on the monthly timeframe would open the door for $4 - $4.40 to be tested in Q2.
LDO | Lido DAO (Monthly)
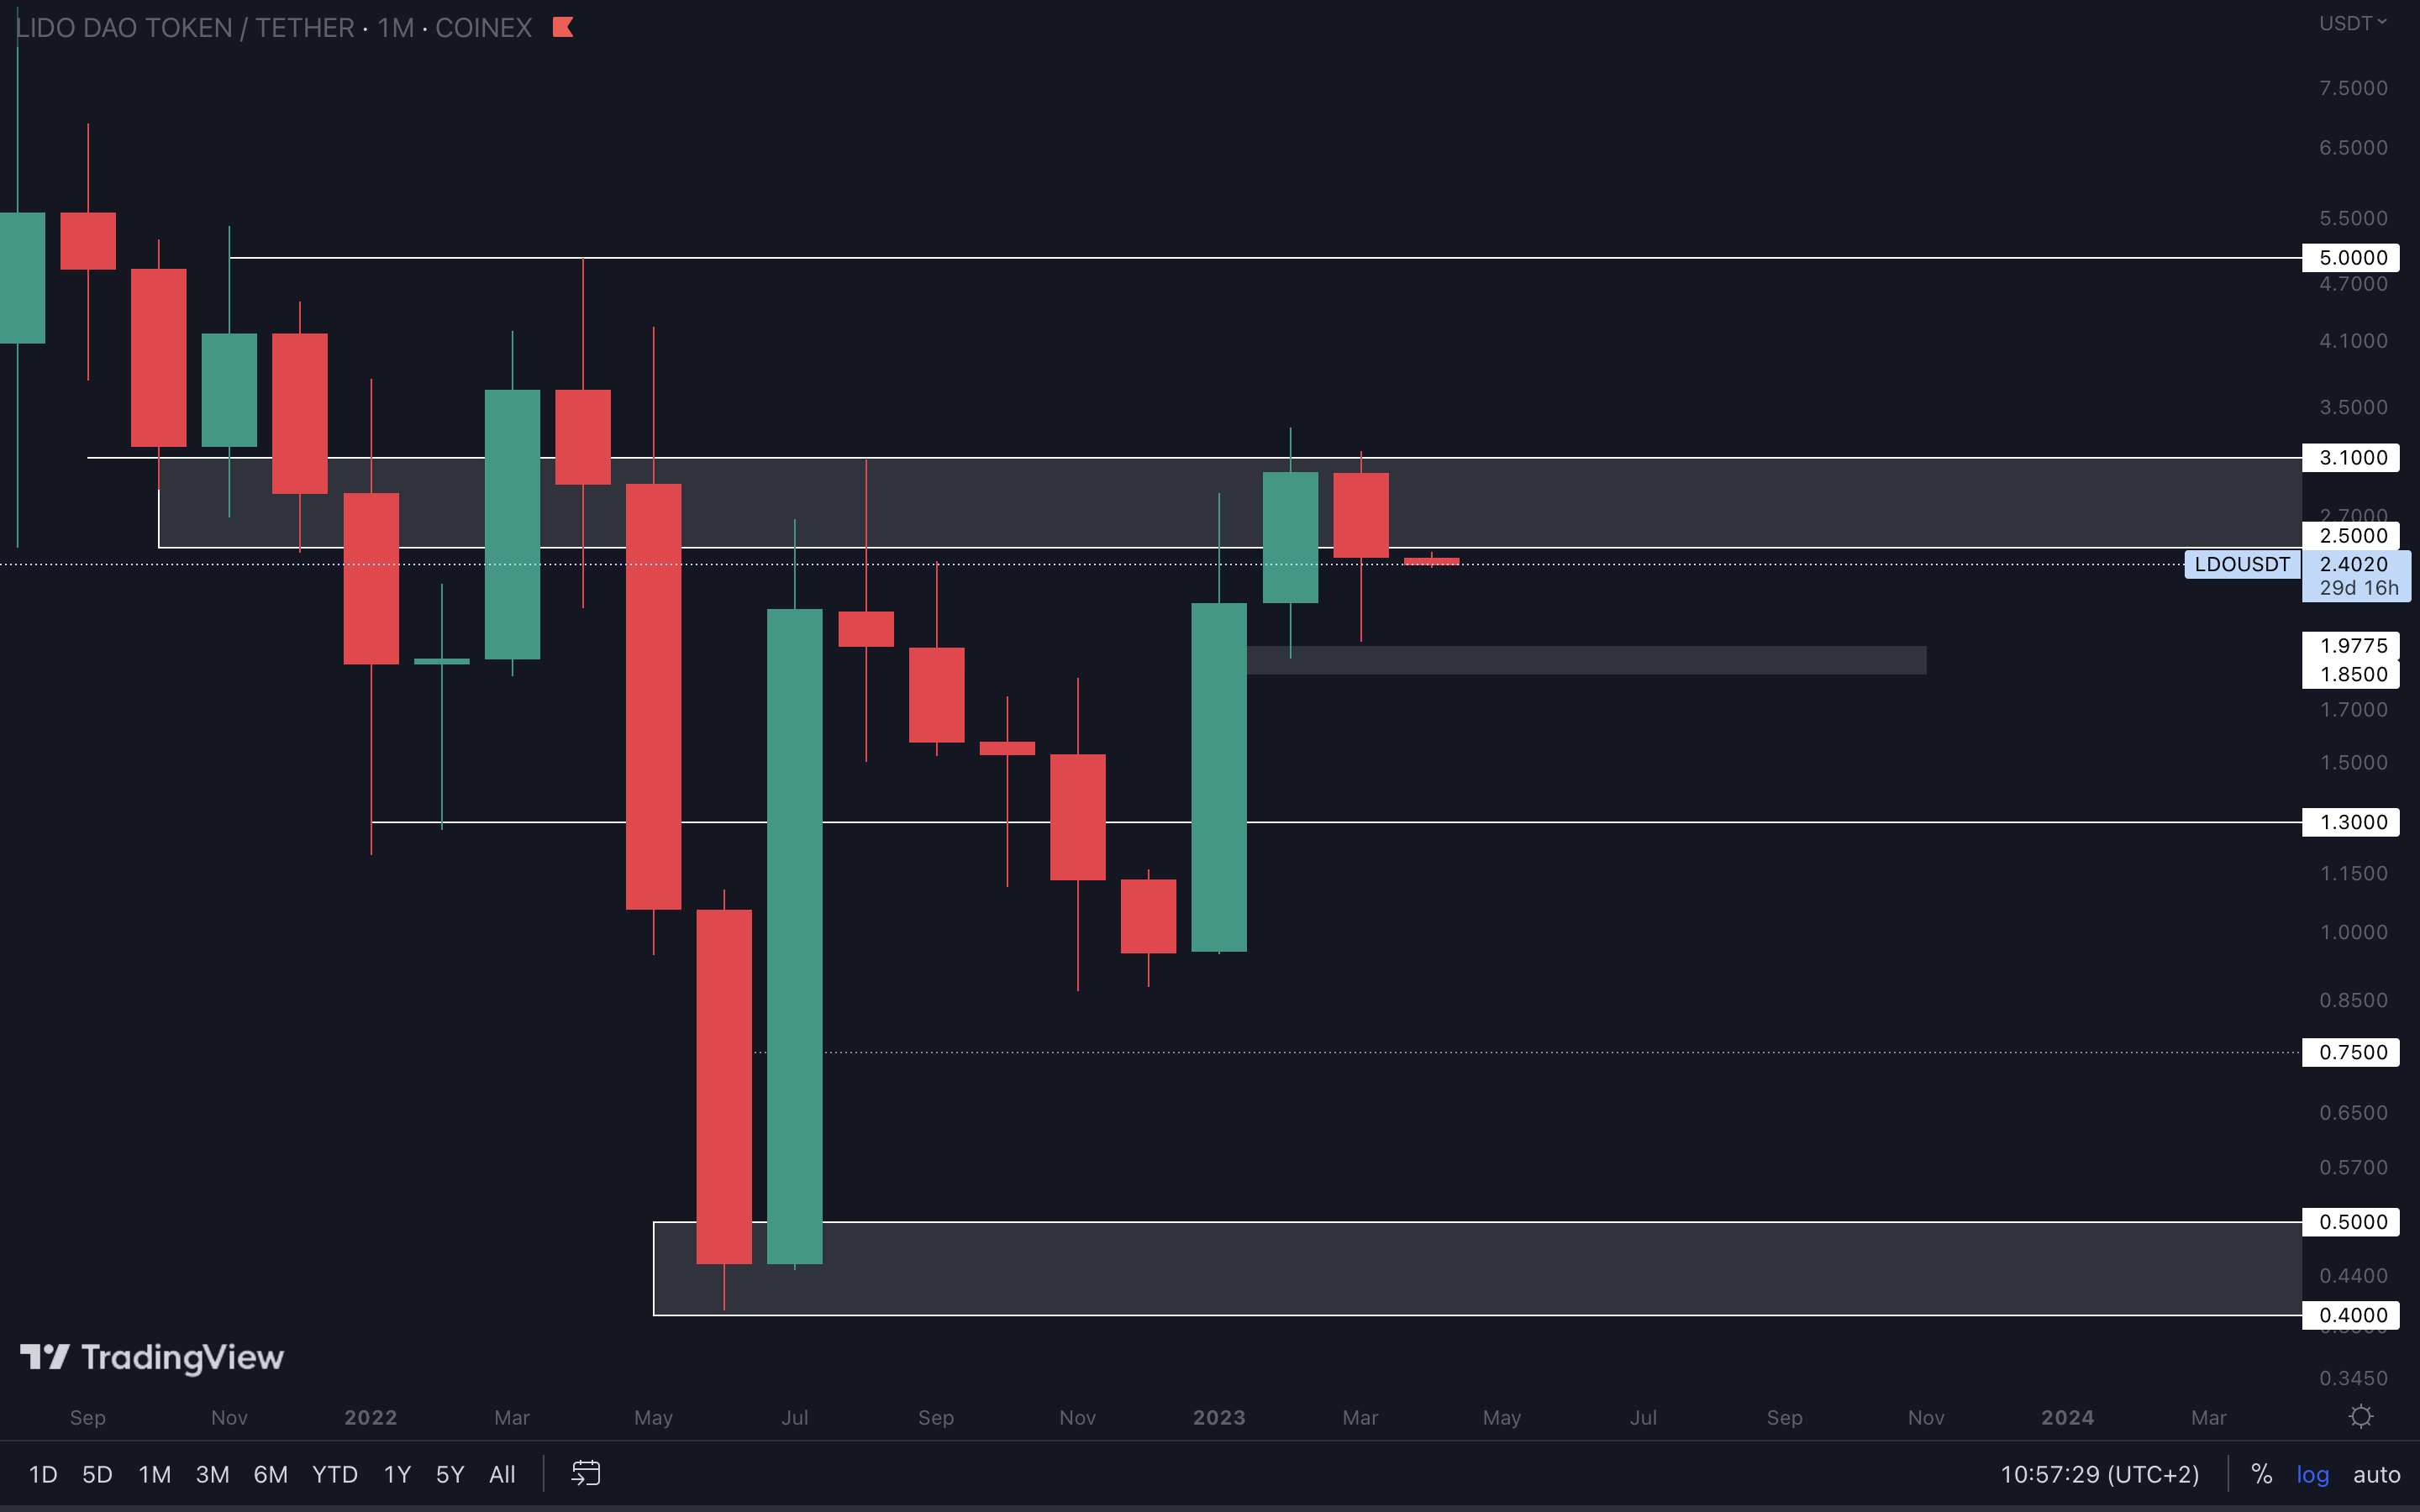
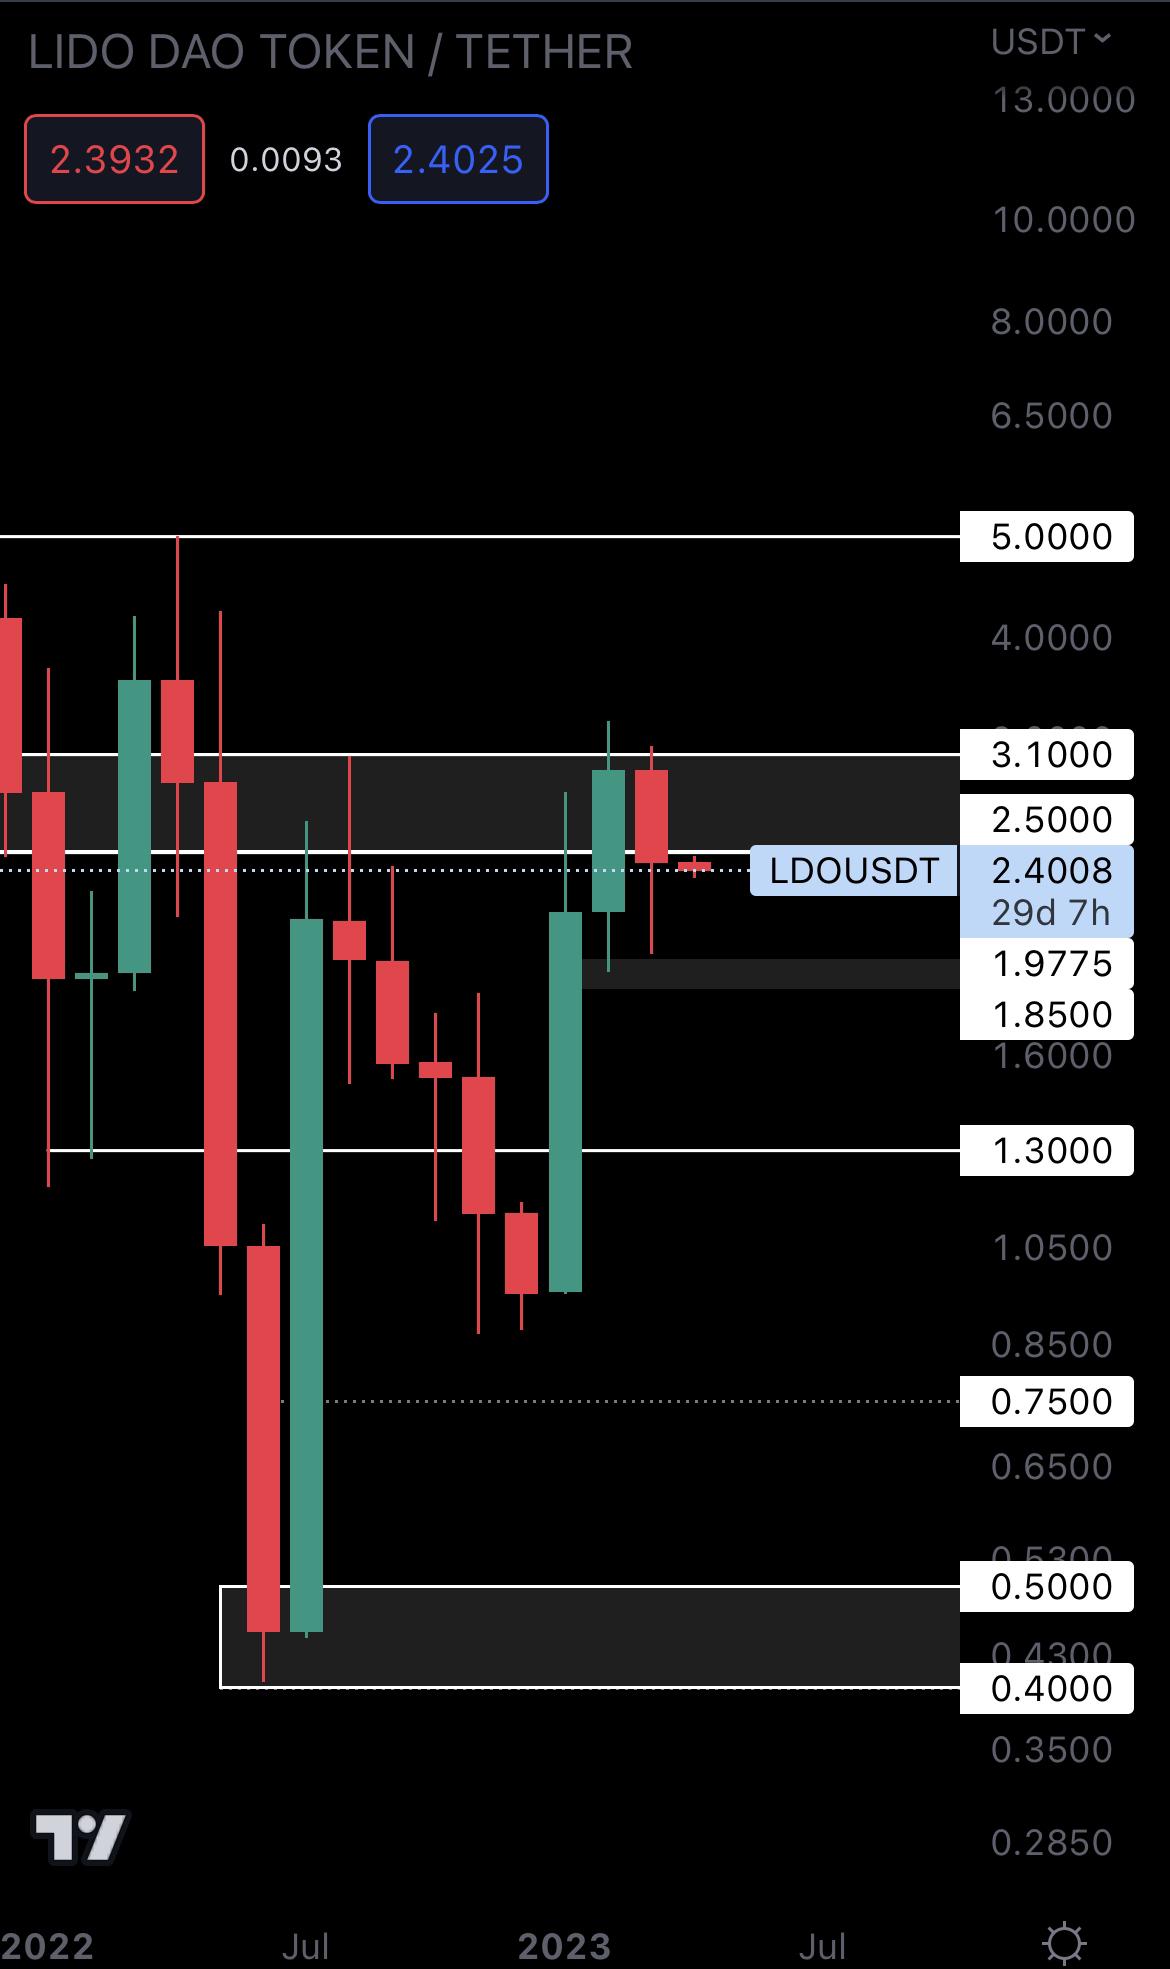
LDO got rejected from $3.10 last month, which resulted in a monthly closure under $2.50. From a technical standpoint, LDO will head back to the little grey box in April. That’s a local level that formed in Q1 after weeks of ranging.
For more upside to be confirmed here, we’ll have to see LDO close a weekly candle above $3.10. This would open the road for $5 to be tested in Q2.
HEGIC | Hegic (Monthly)
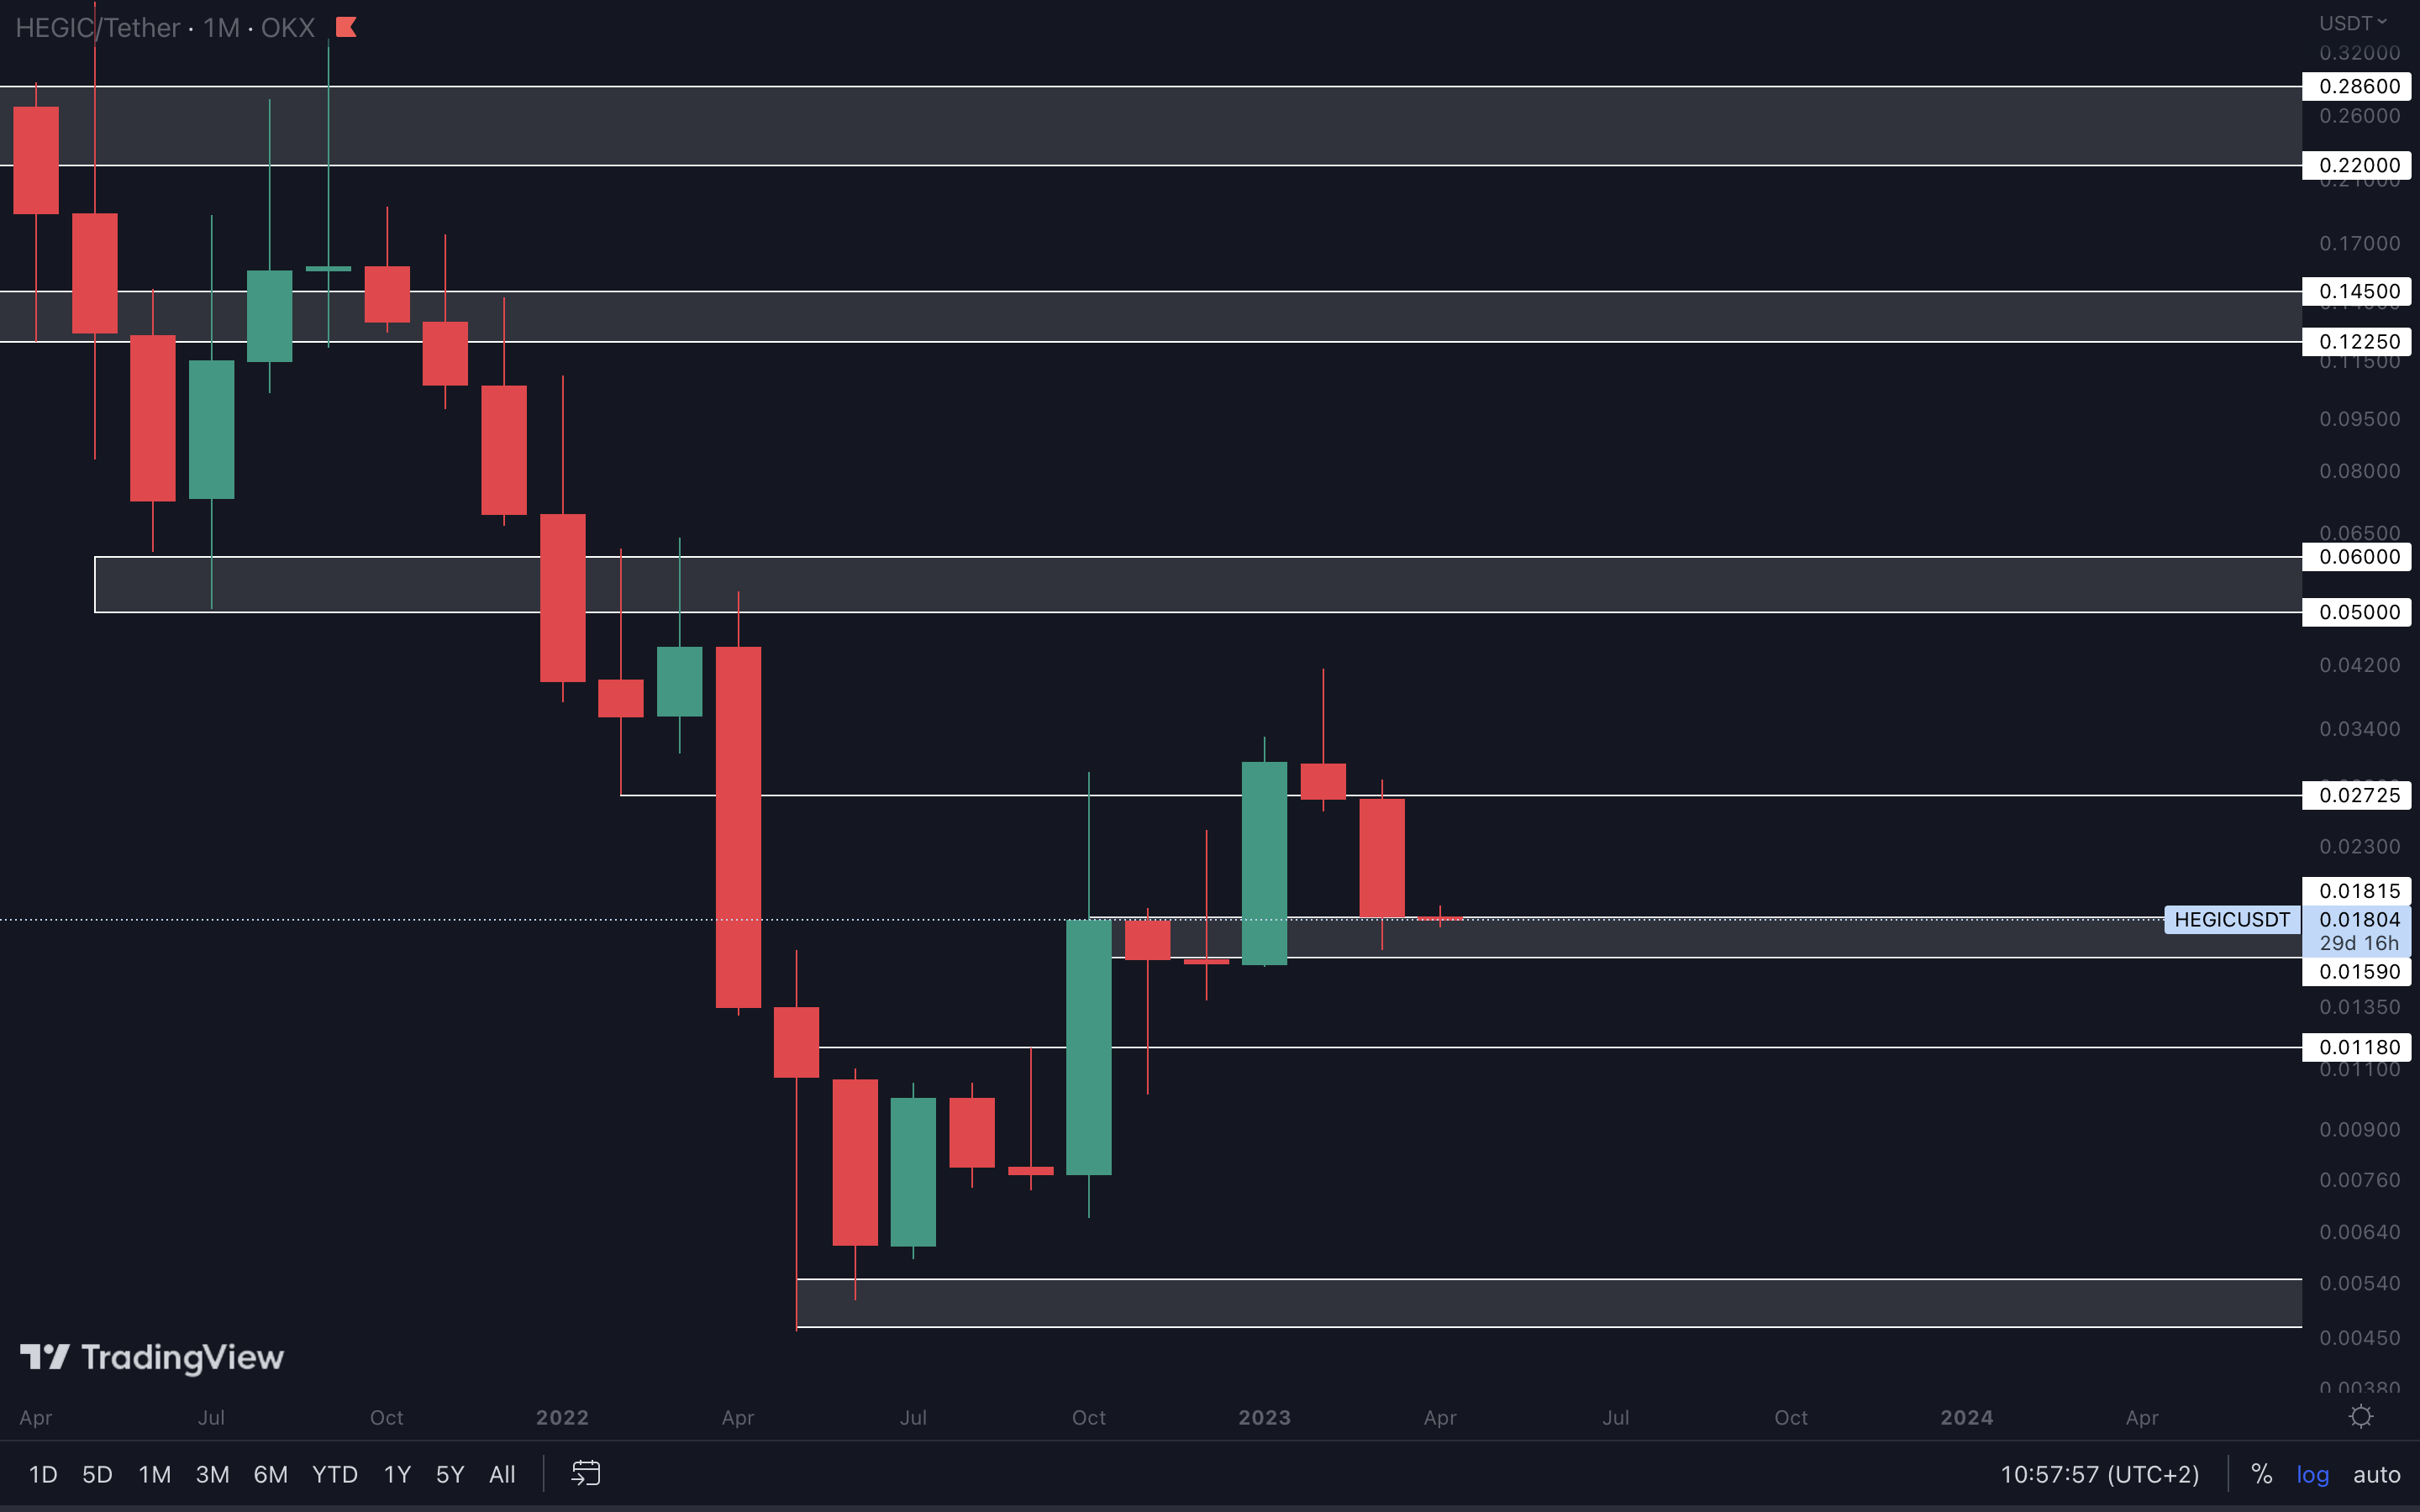
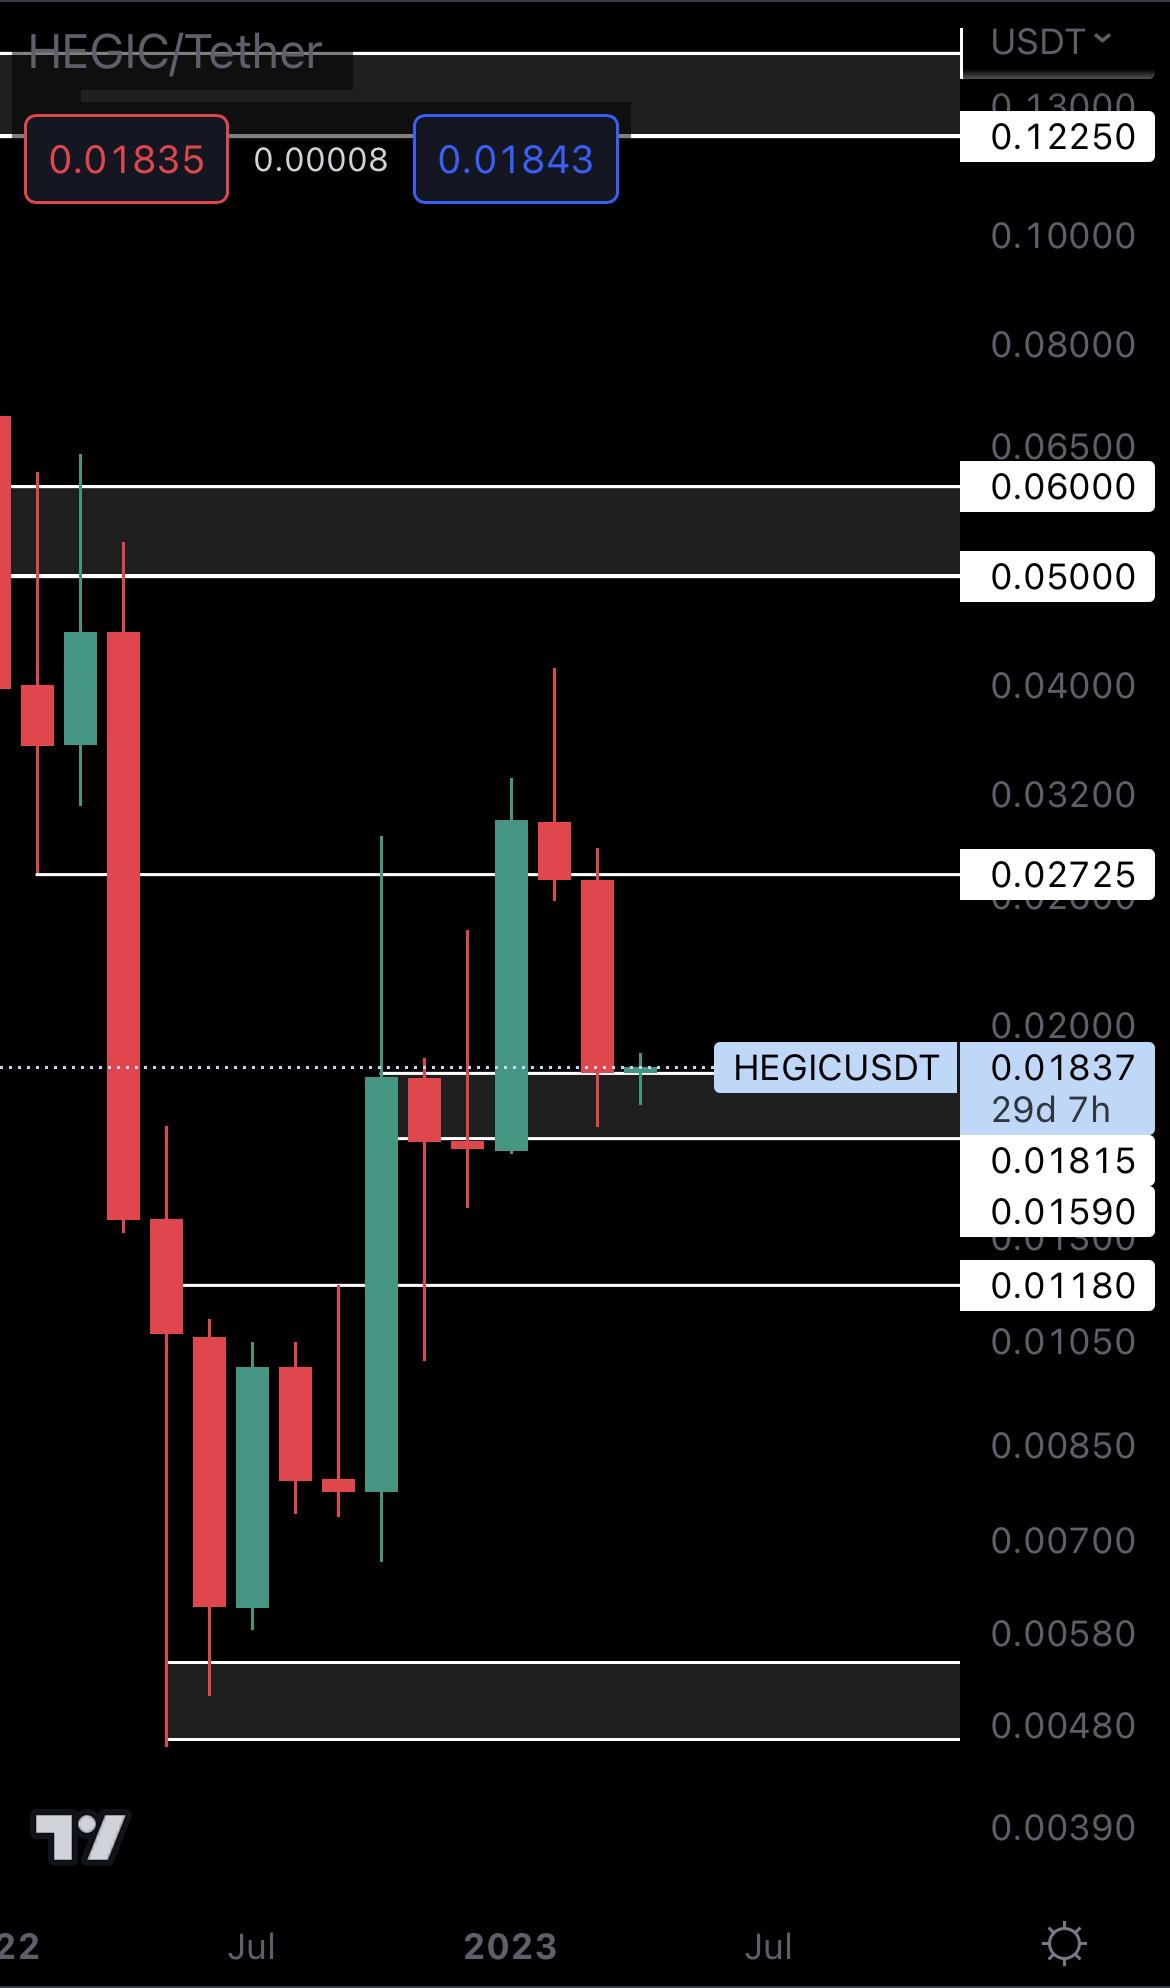
What you’re seeing on this chart is a perfect bullish market structure on the monthly timeframe, because the levels are respected to a tee. HEGIC went back to the $0.01590 - $0.01815 support area in March, and managed to close above it. Our analysis focuses on strong indicators - market structure, trends, and candles. The real stuff. They are the most powerful indicators and HEGIC ticks all boxes. For that reason, it should have no issue rising back to $0.02725 and above in Q2. That would make it a contender for this quarter’s “outperformer” title. However, we have to take an invalidation into consideration - if HEGIC closes a monthly candle under $0.01590, the move to $0.02725+ would be invalidated.
PENDLE | Pendle (Monthly)
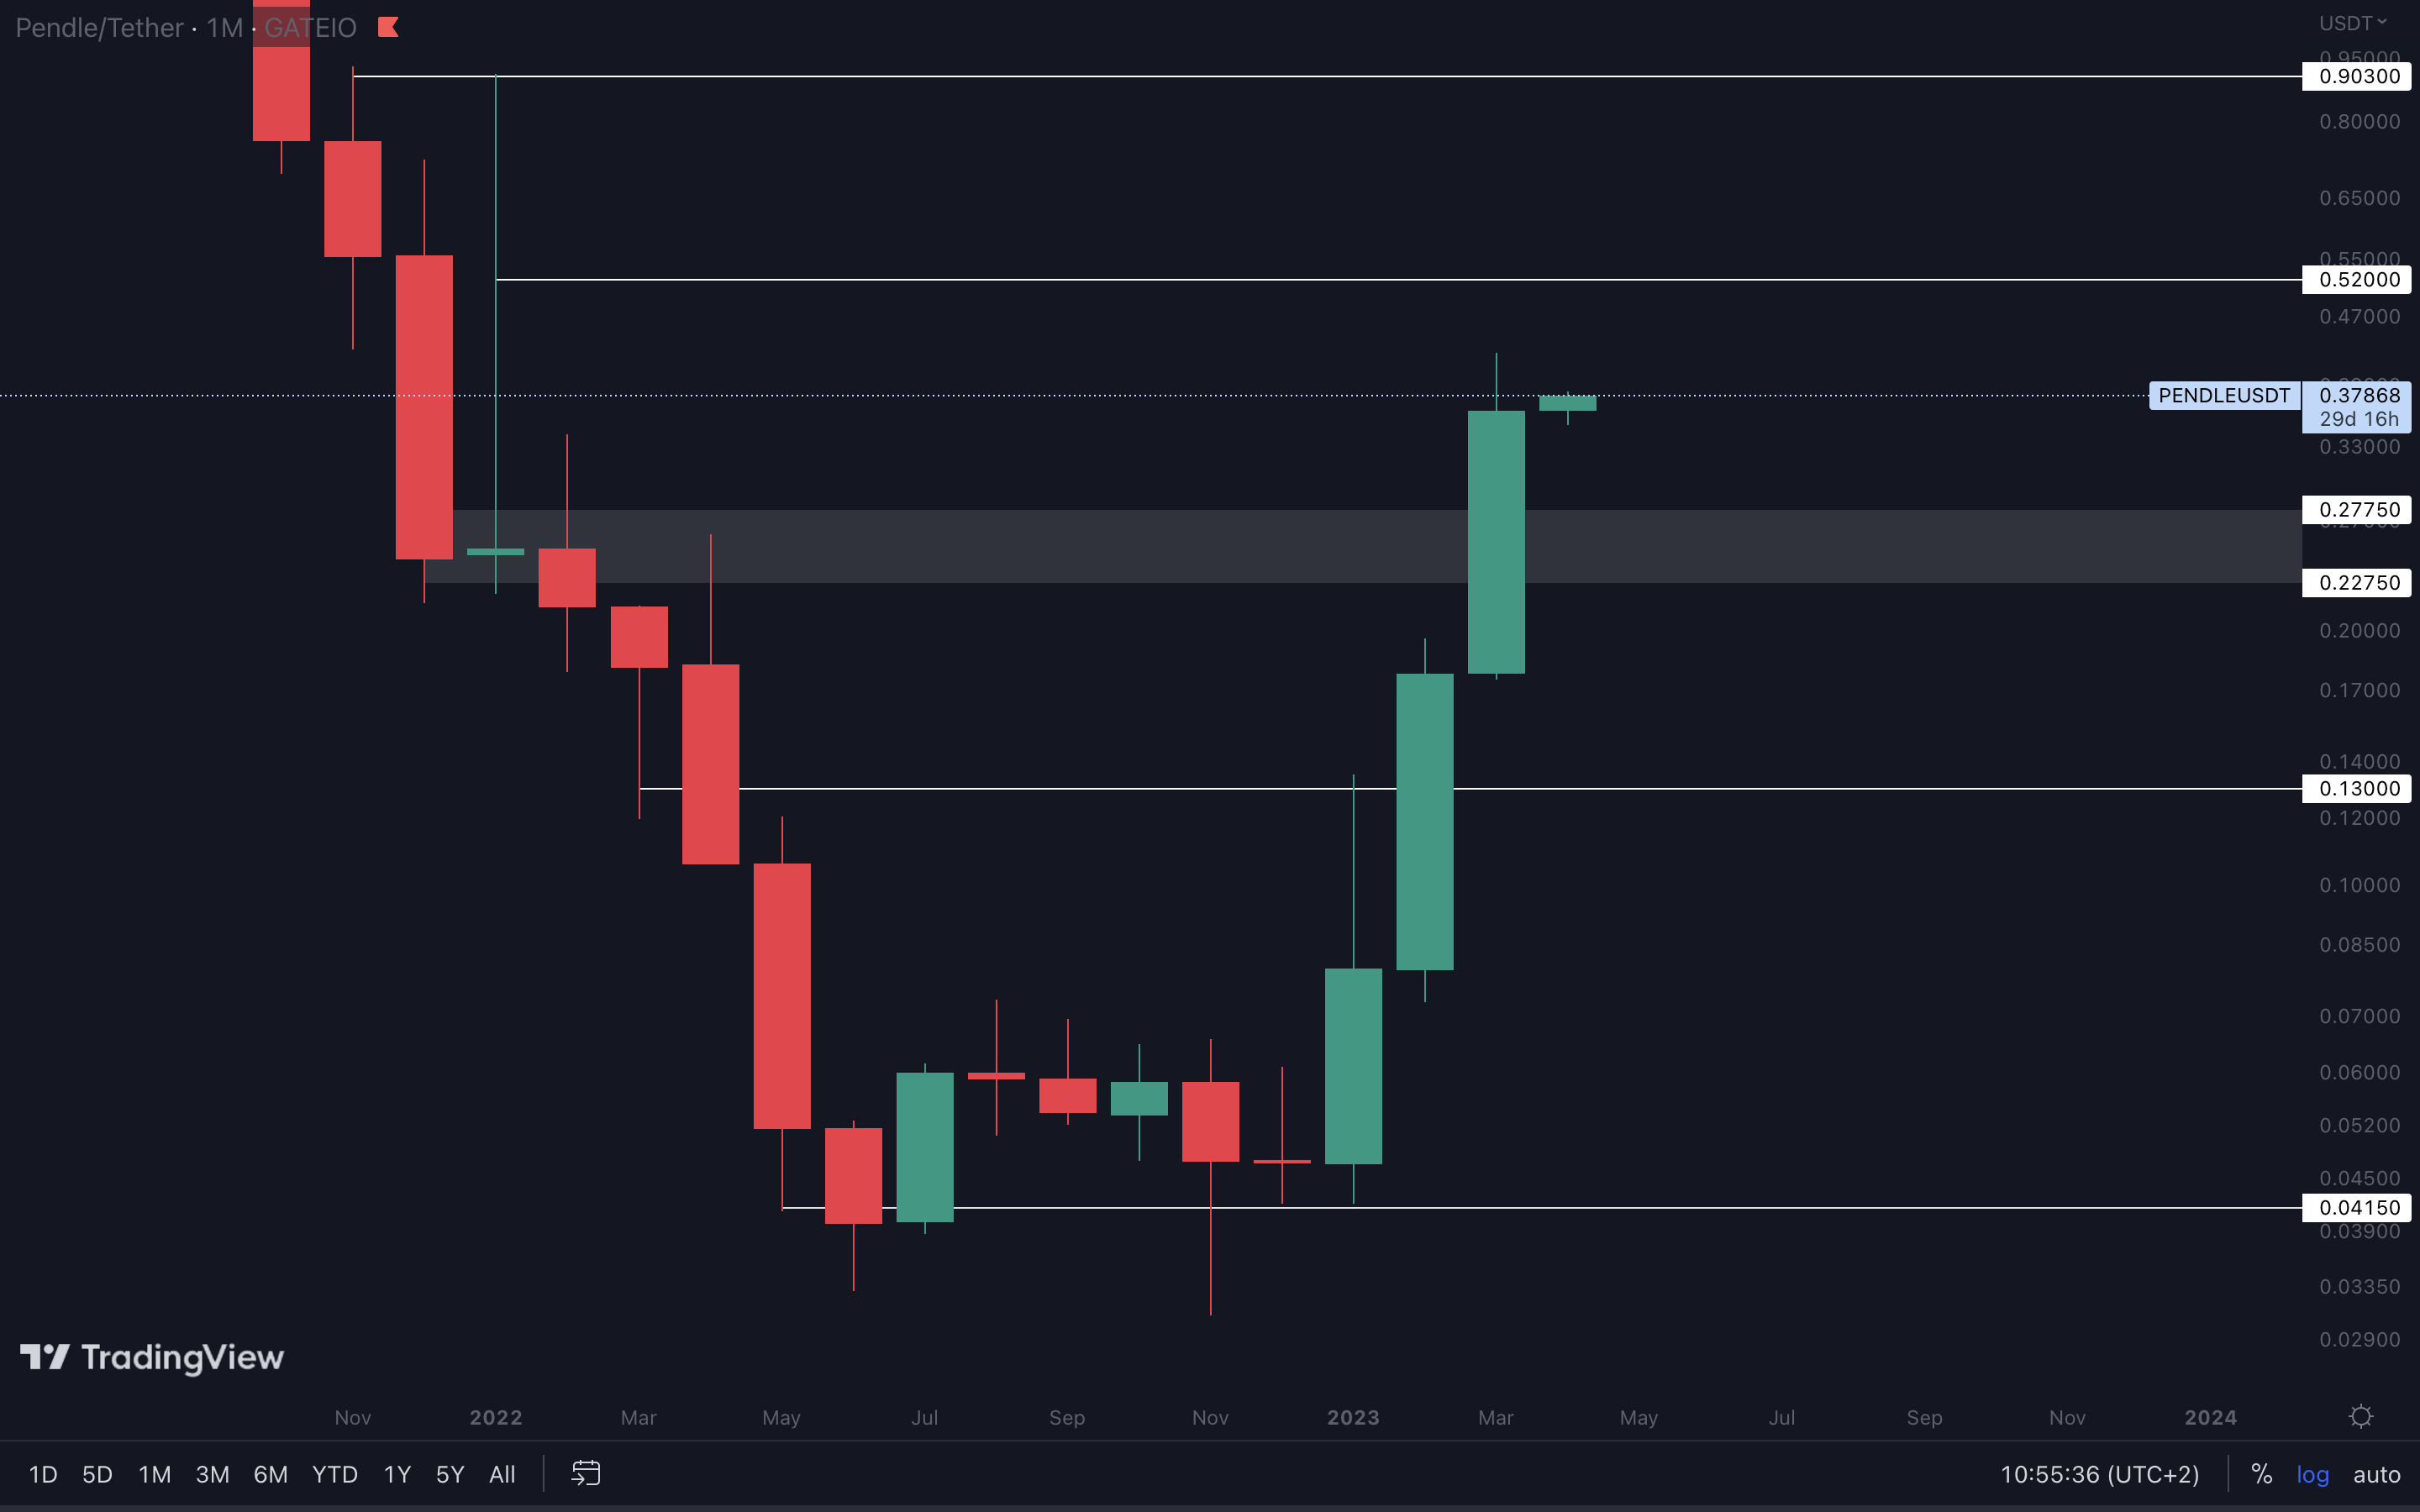
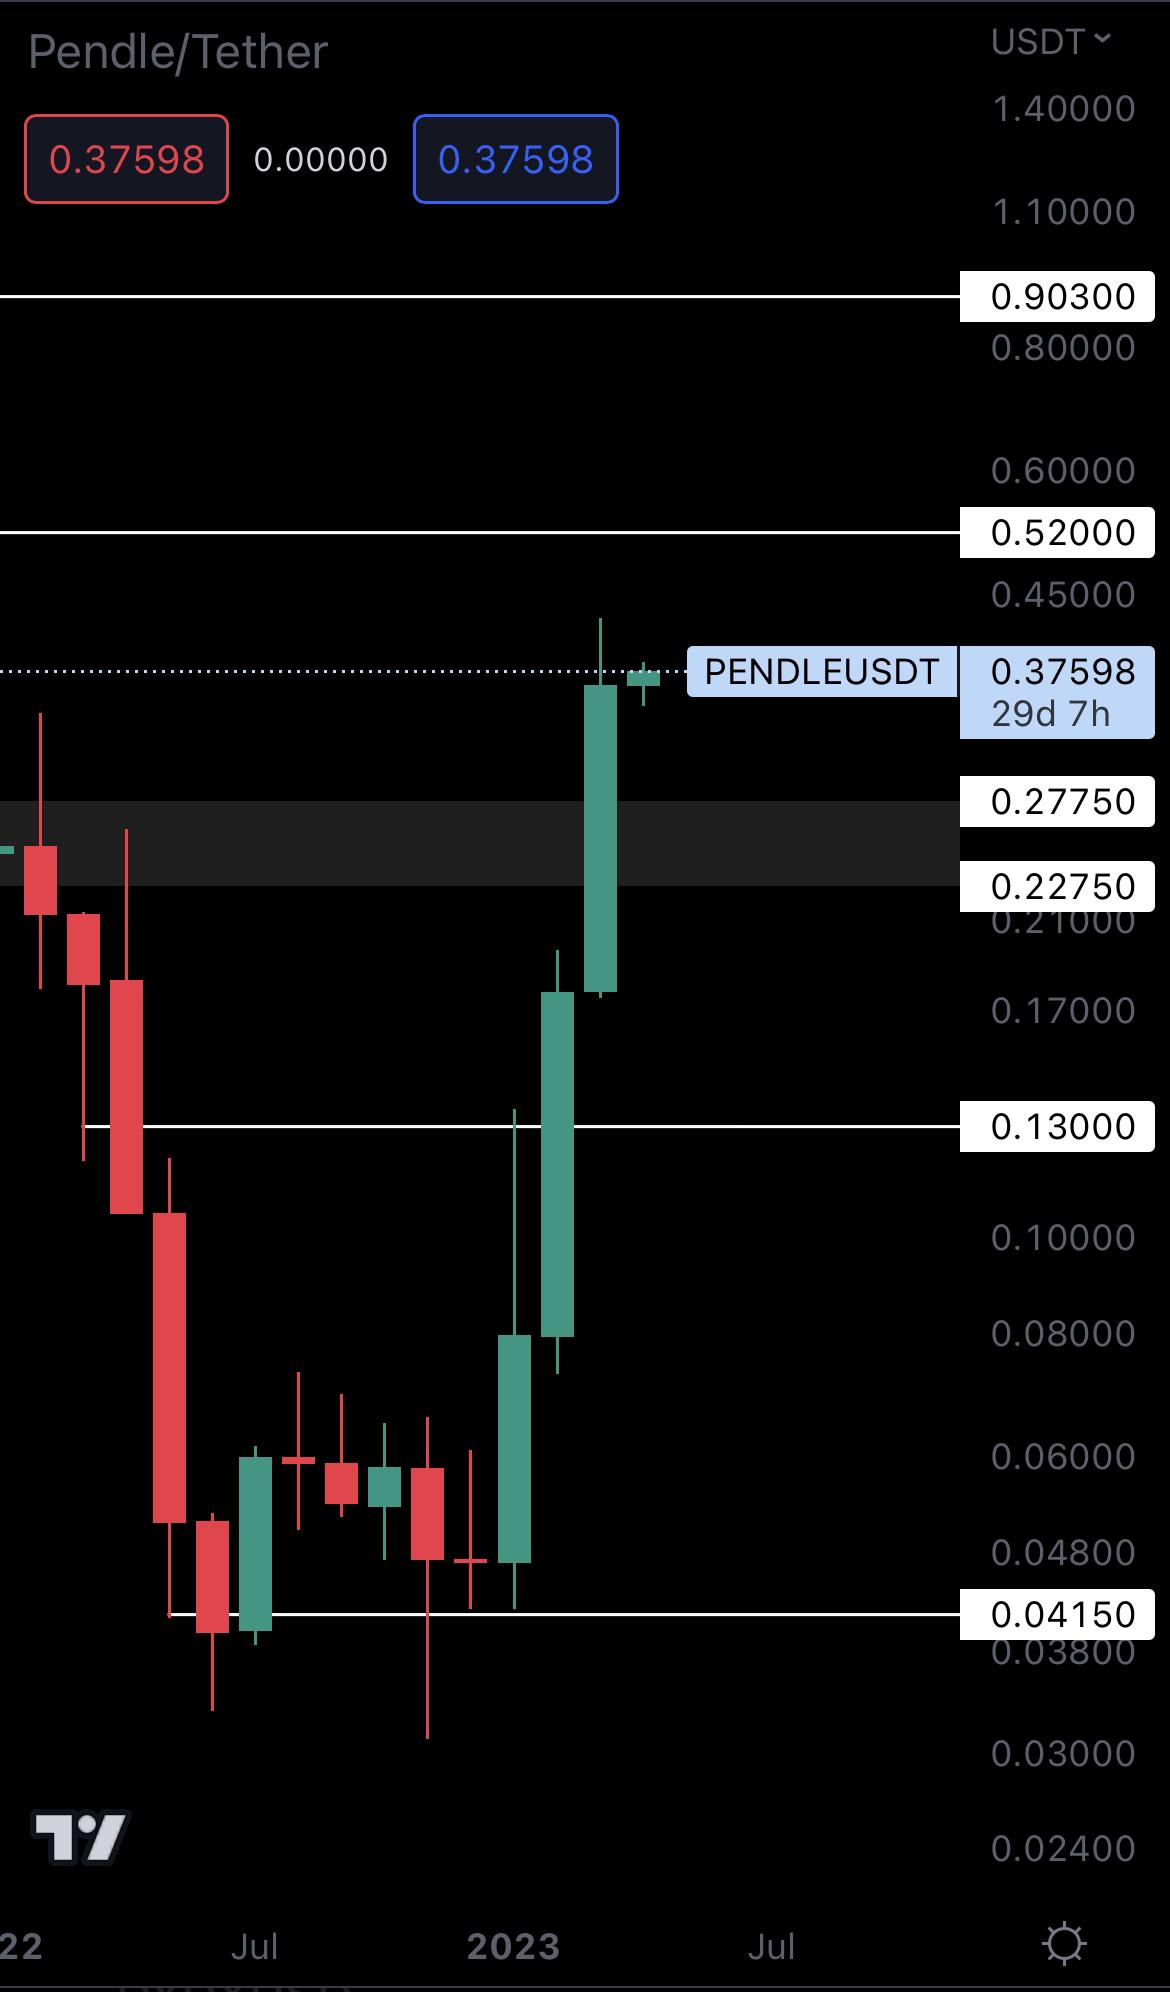
PENDLE closed above resistance ($0.27750 - $0.22750). Holding this level on the monthly timeframe will keep the door open for $0.52. We believe PENDLE will reach this level in Q2 as this is in line with our expectations for Bitcoin.
Cryptonary's Watchlist
DOT | Polkadot (Monthly)
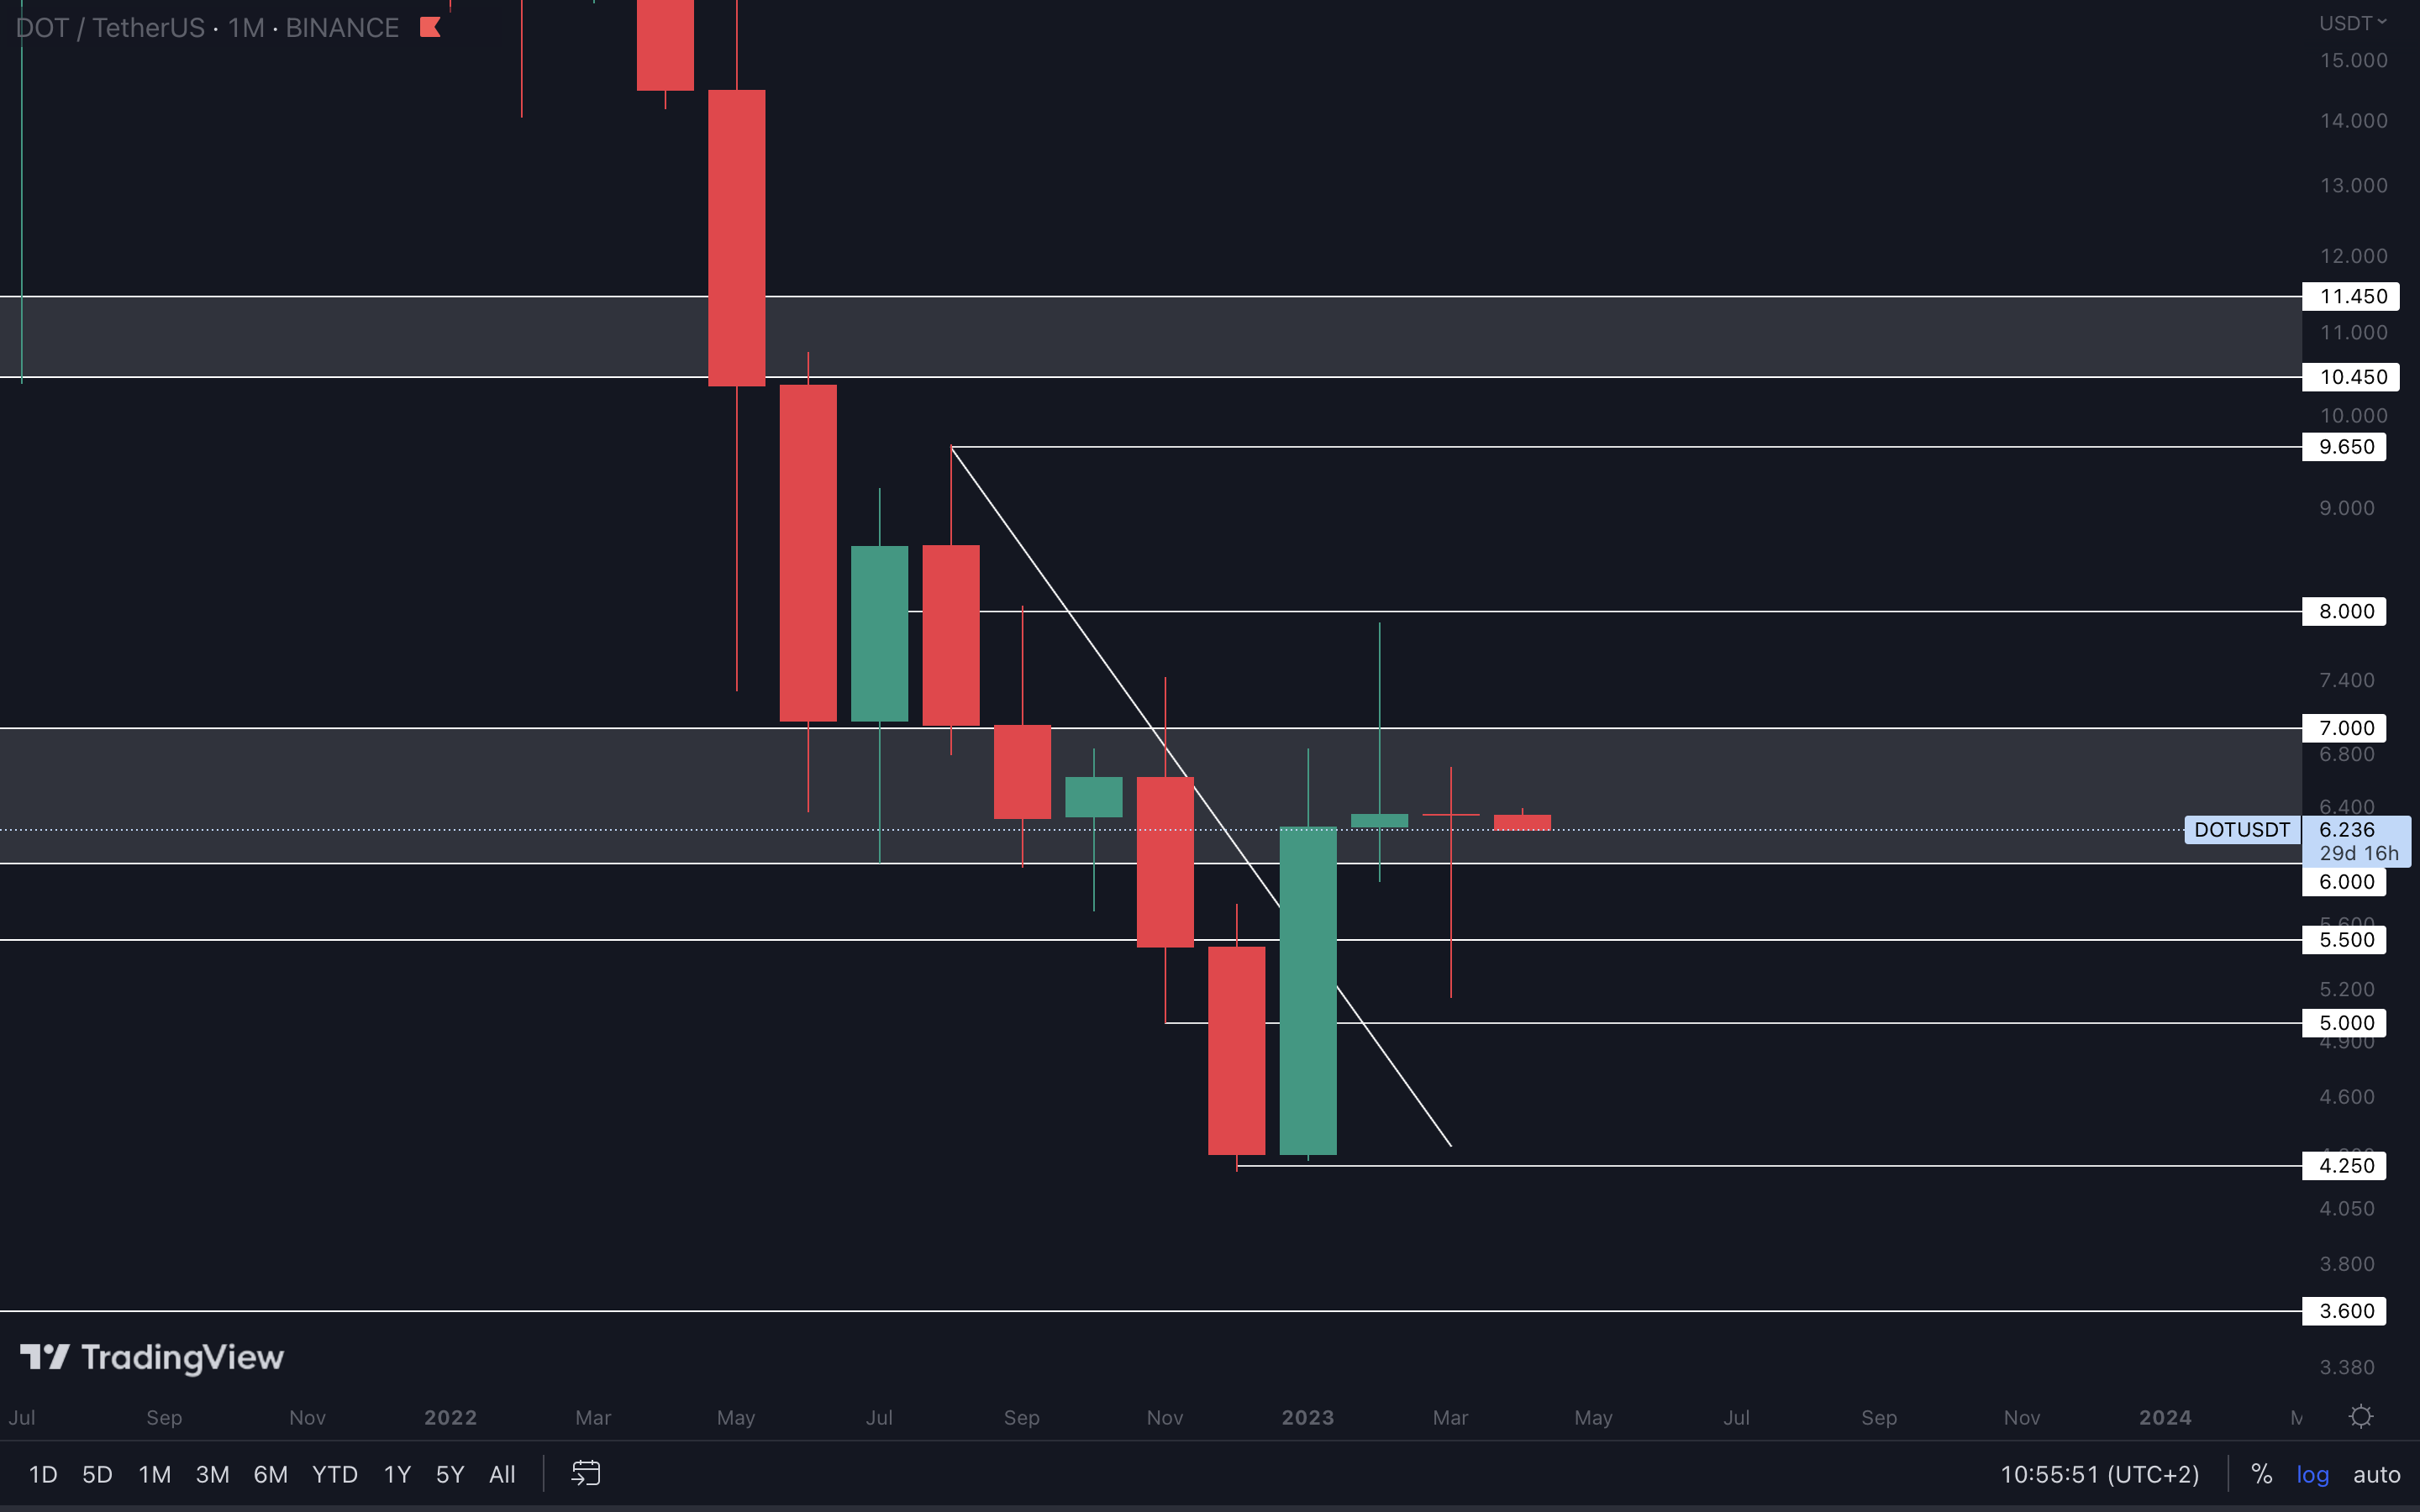
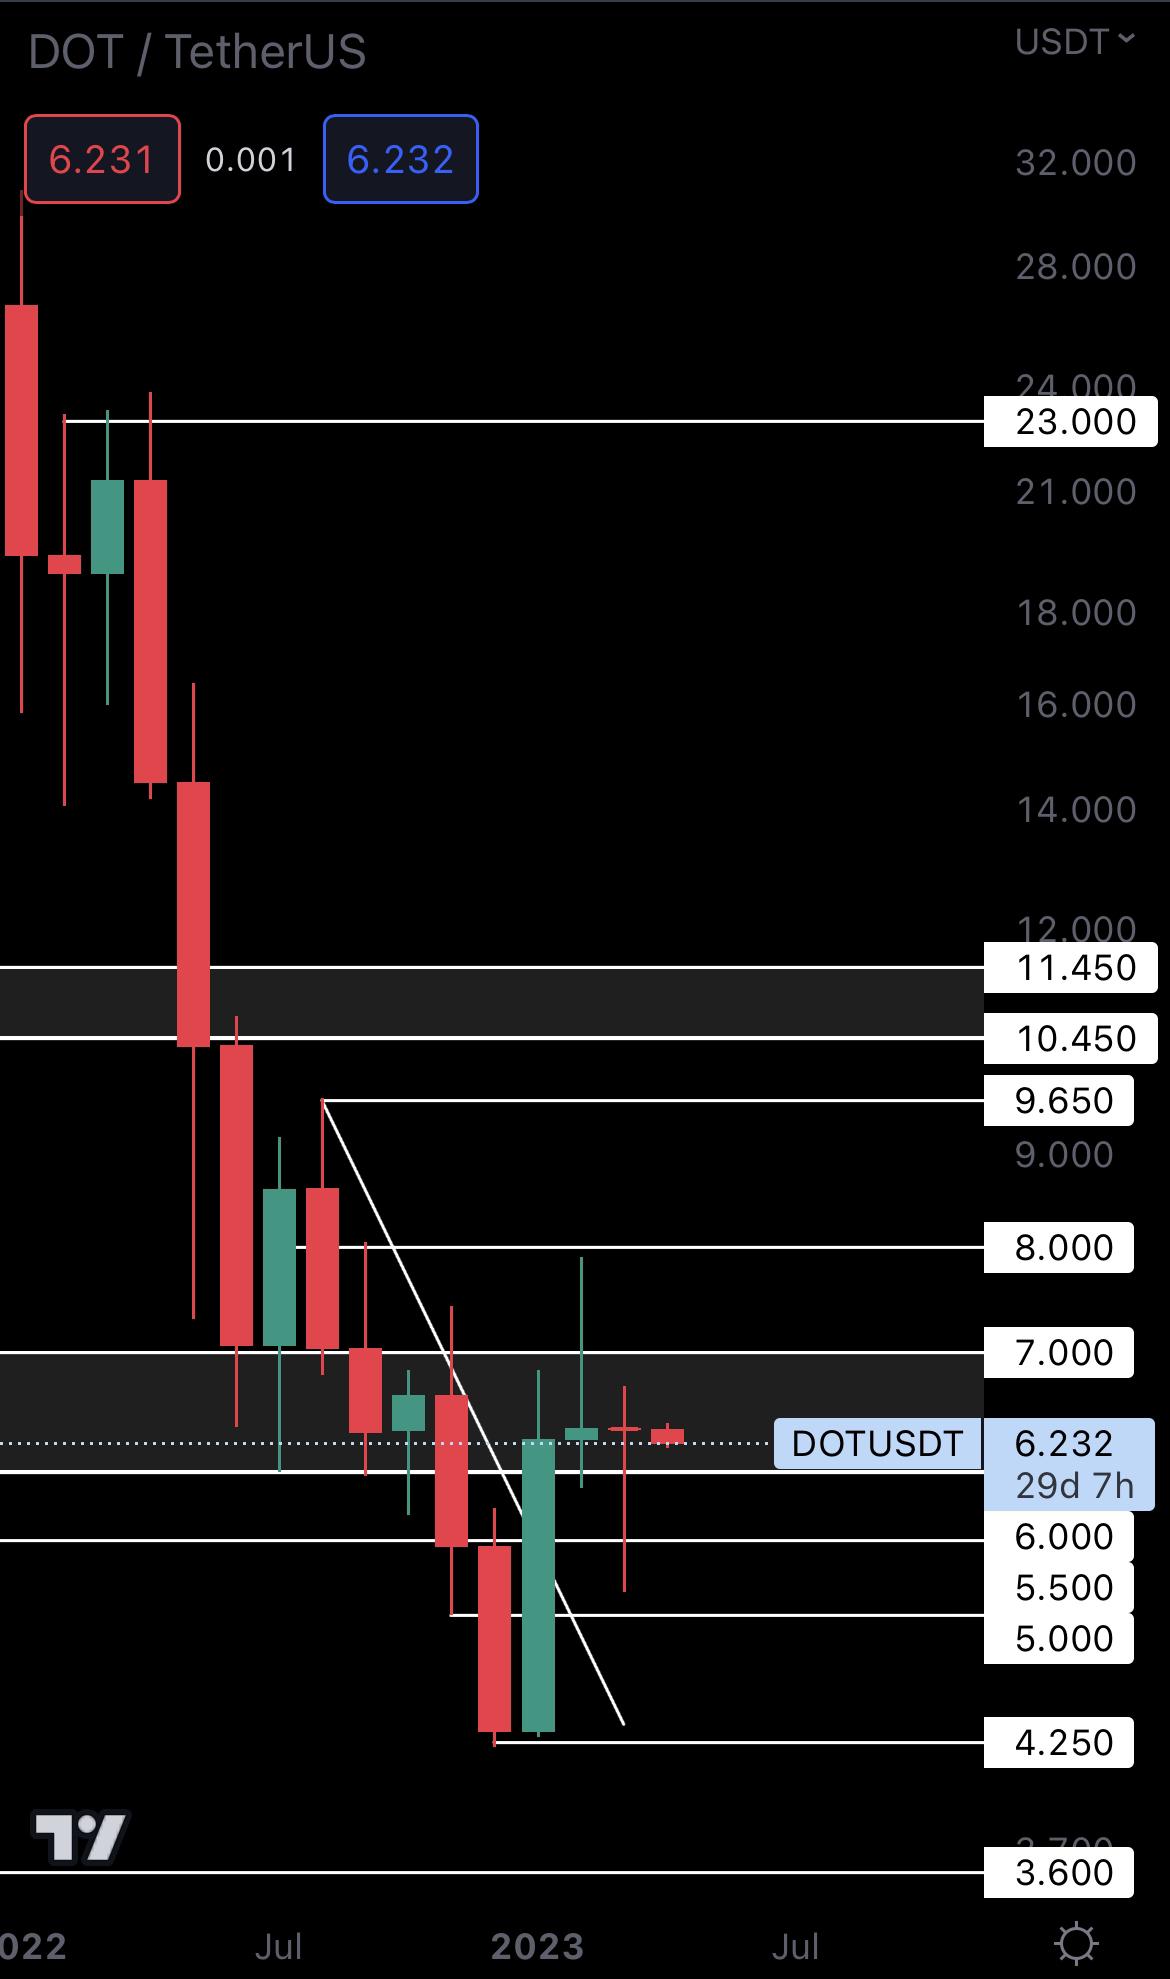
The last two months have been quite indecisive for DOT - short bodies and long wicks. For starters, this should be a sign to stay away from it and move your attention to better potential opportunities. During Q2, we’ll likely see this ranging continue because there isn’t a clear direction for DOT yet.
RUNE | THORChain (Monthly)
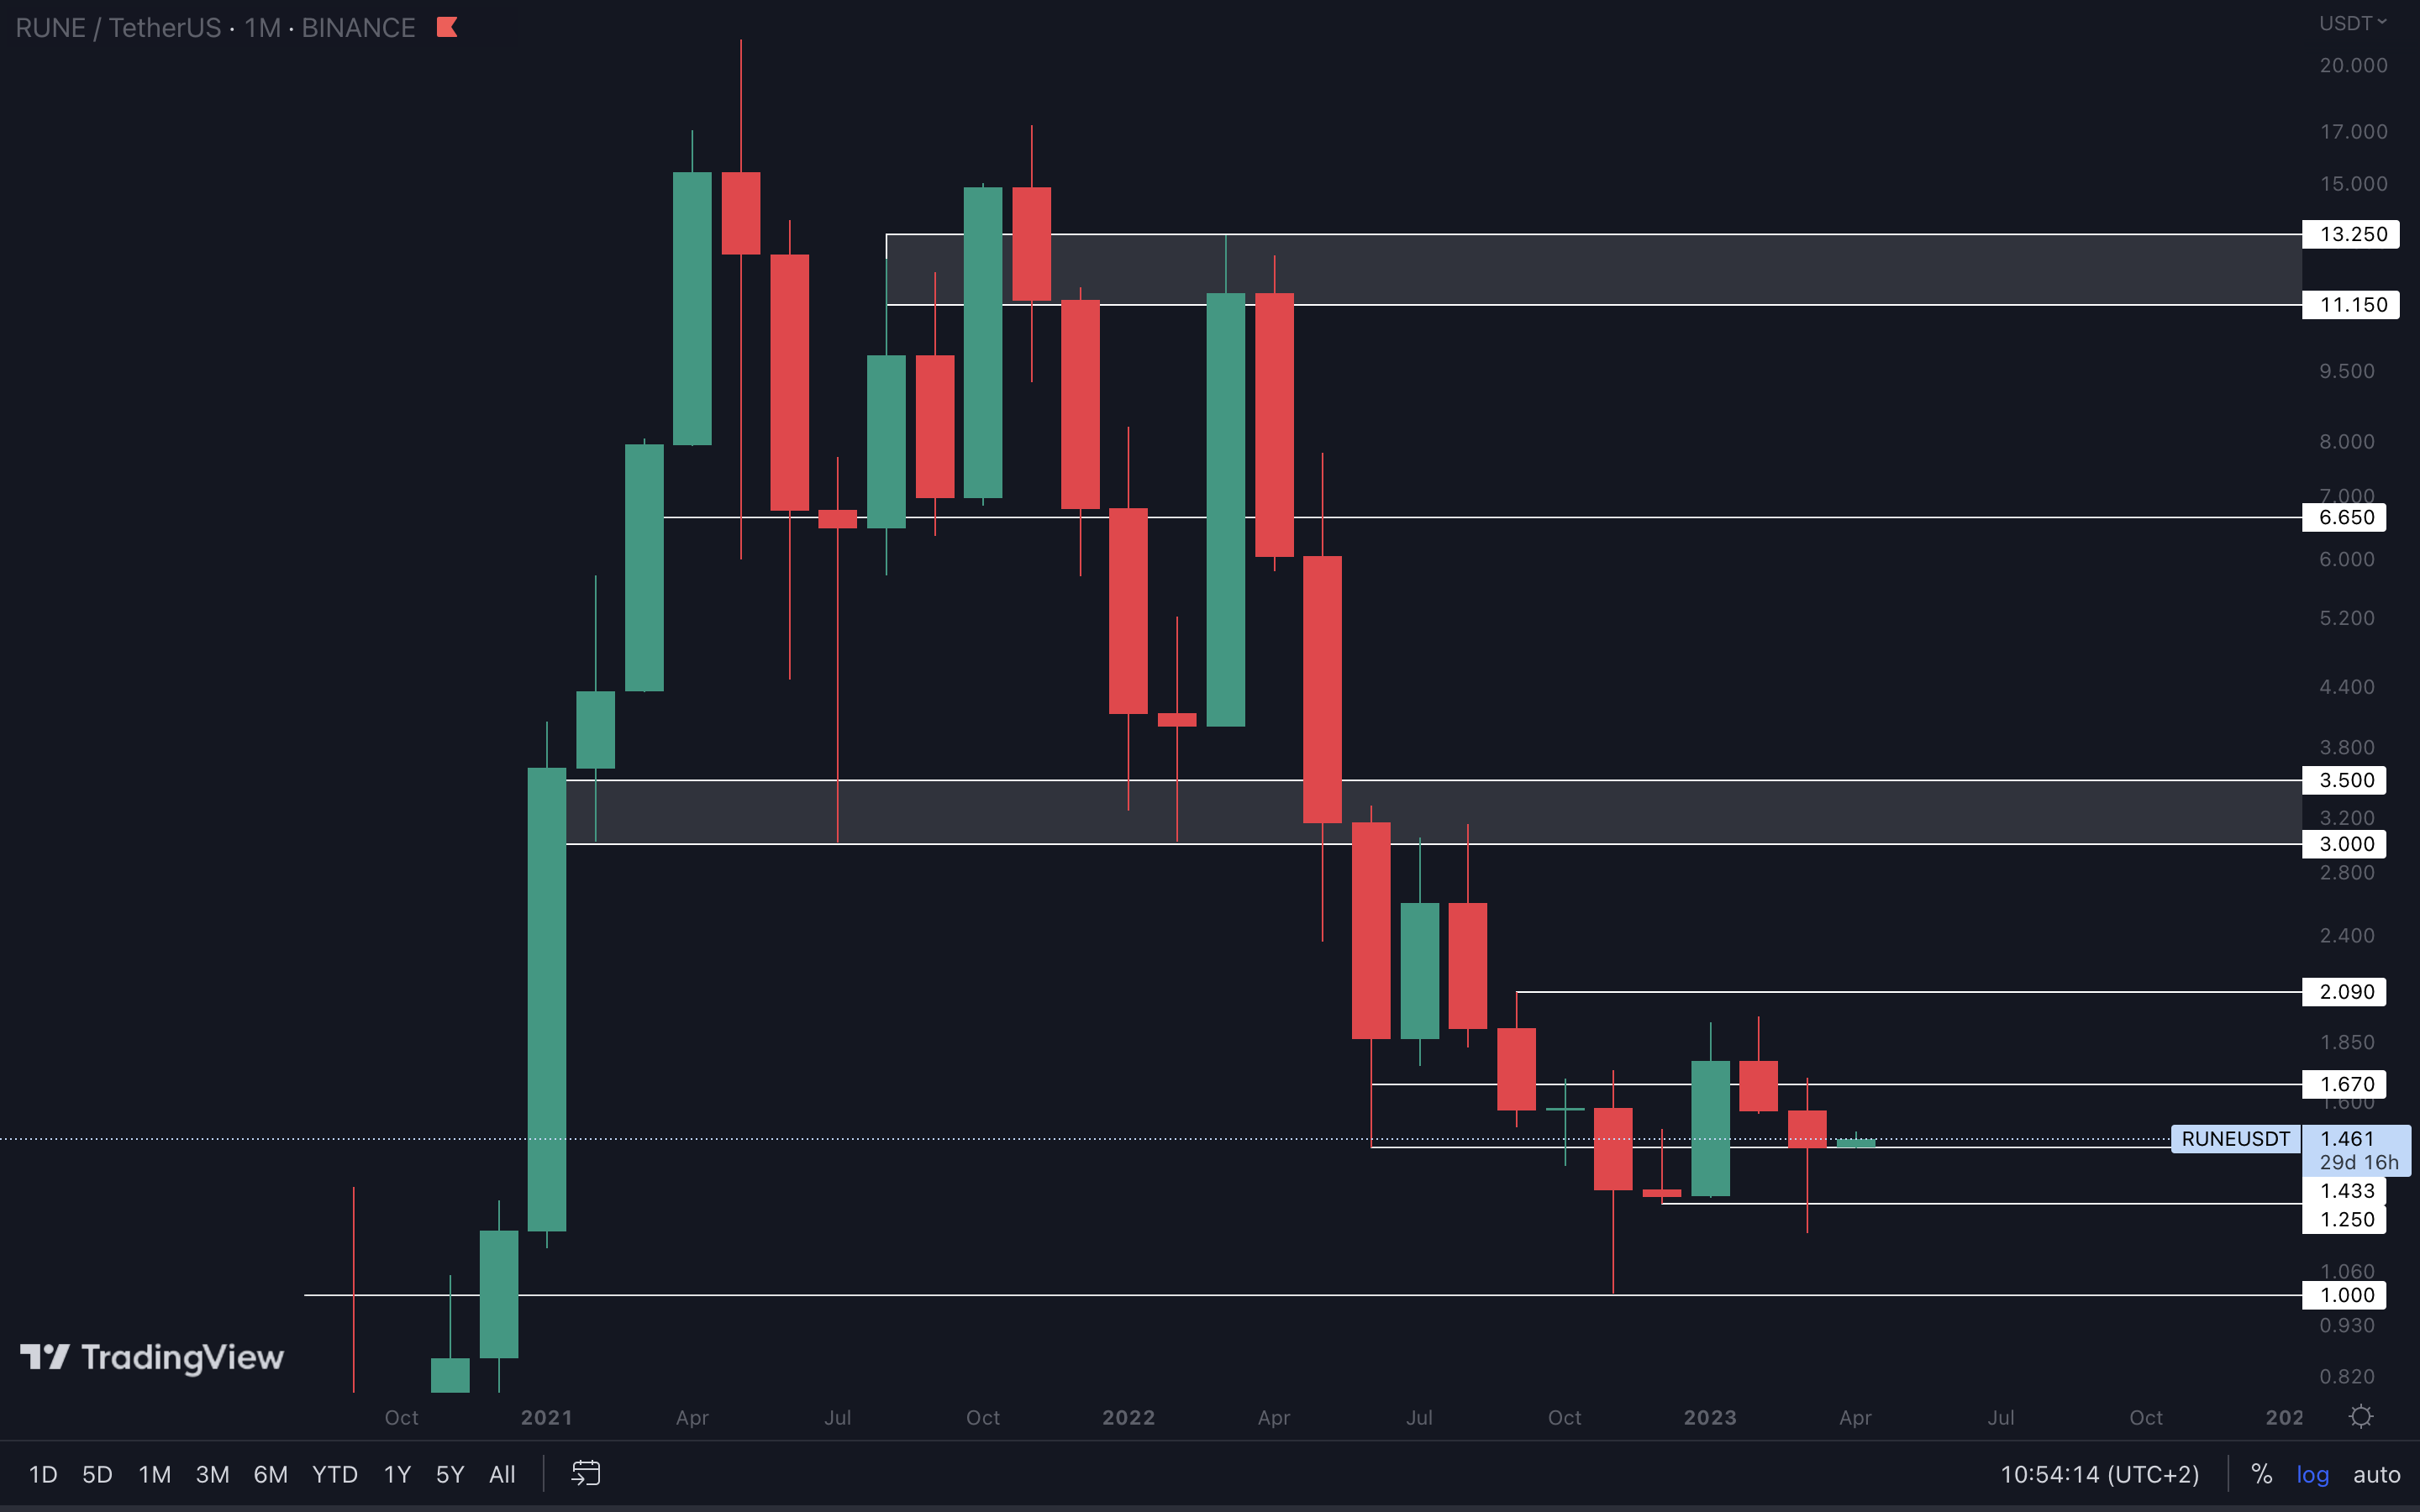
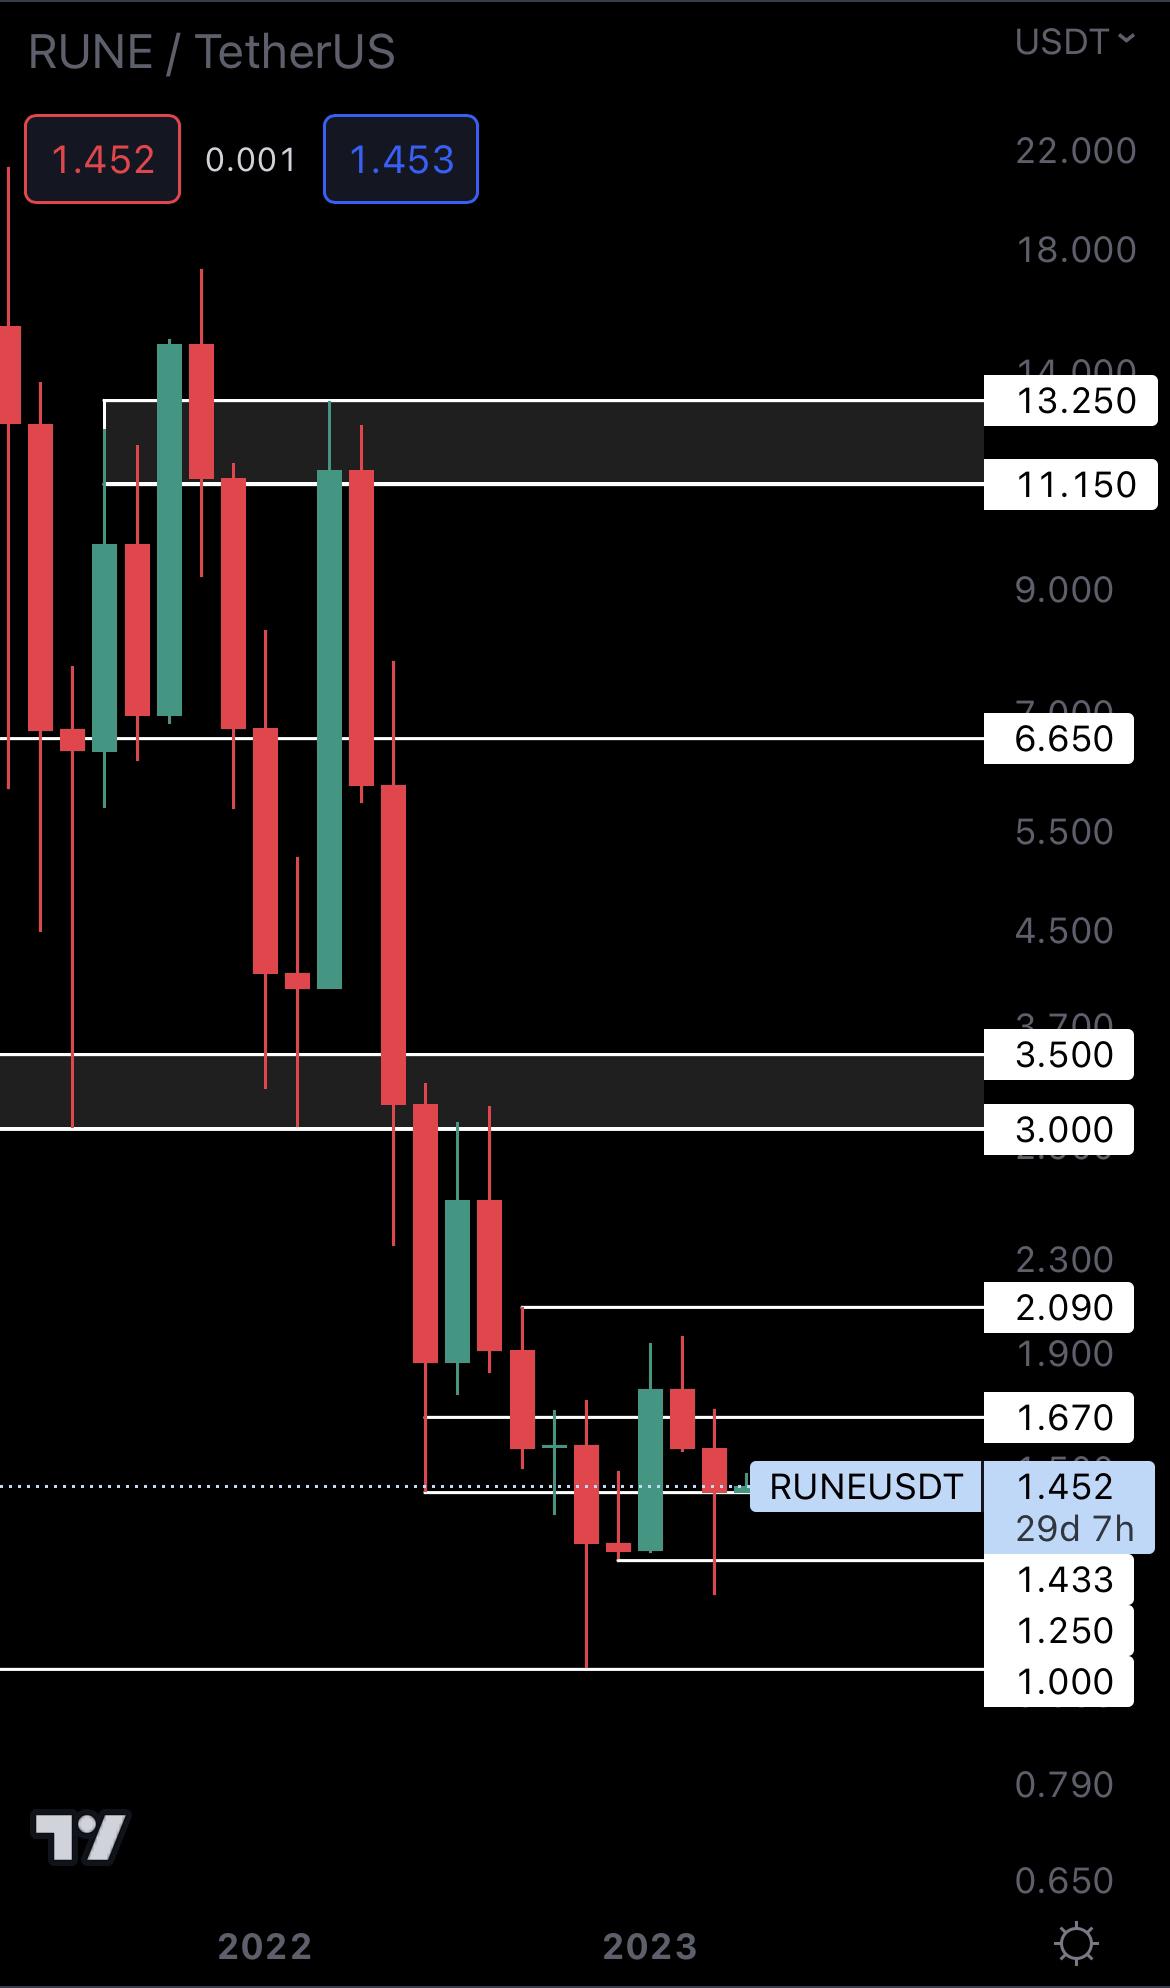
RUNE closed above support ($1.43) in March. It now needs to hold this level on the monthly timeframe for upside to continue. For the time being, holding $1.43 on the weekly timeframe gives RUNE a chance to reach $1.67 in April.
SOL | Solana (Monthly)
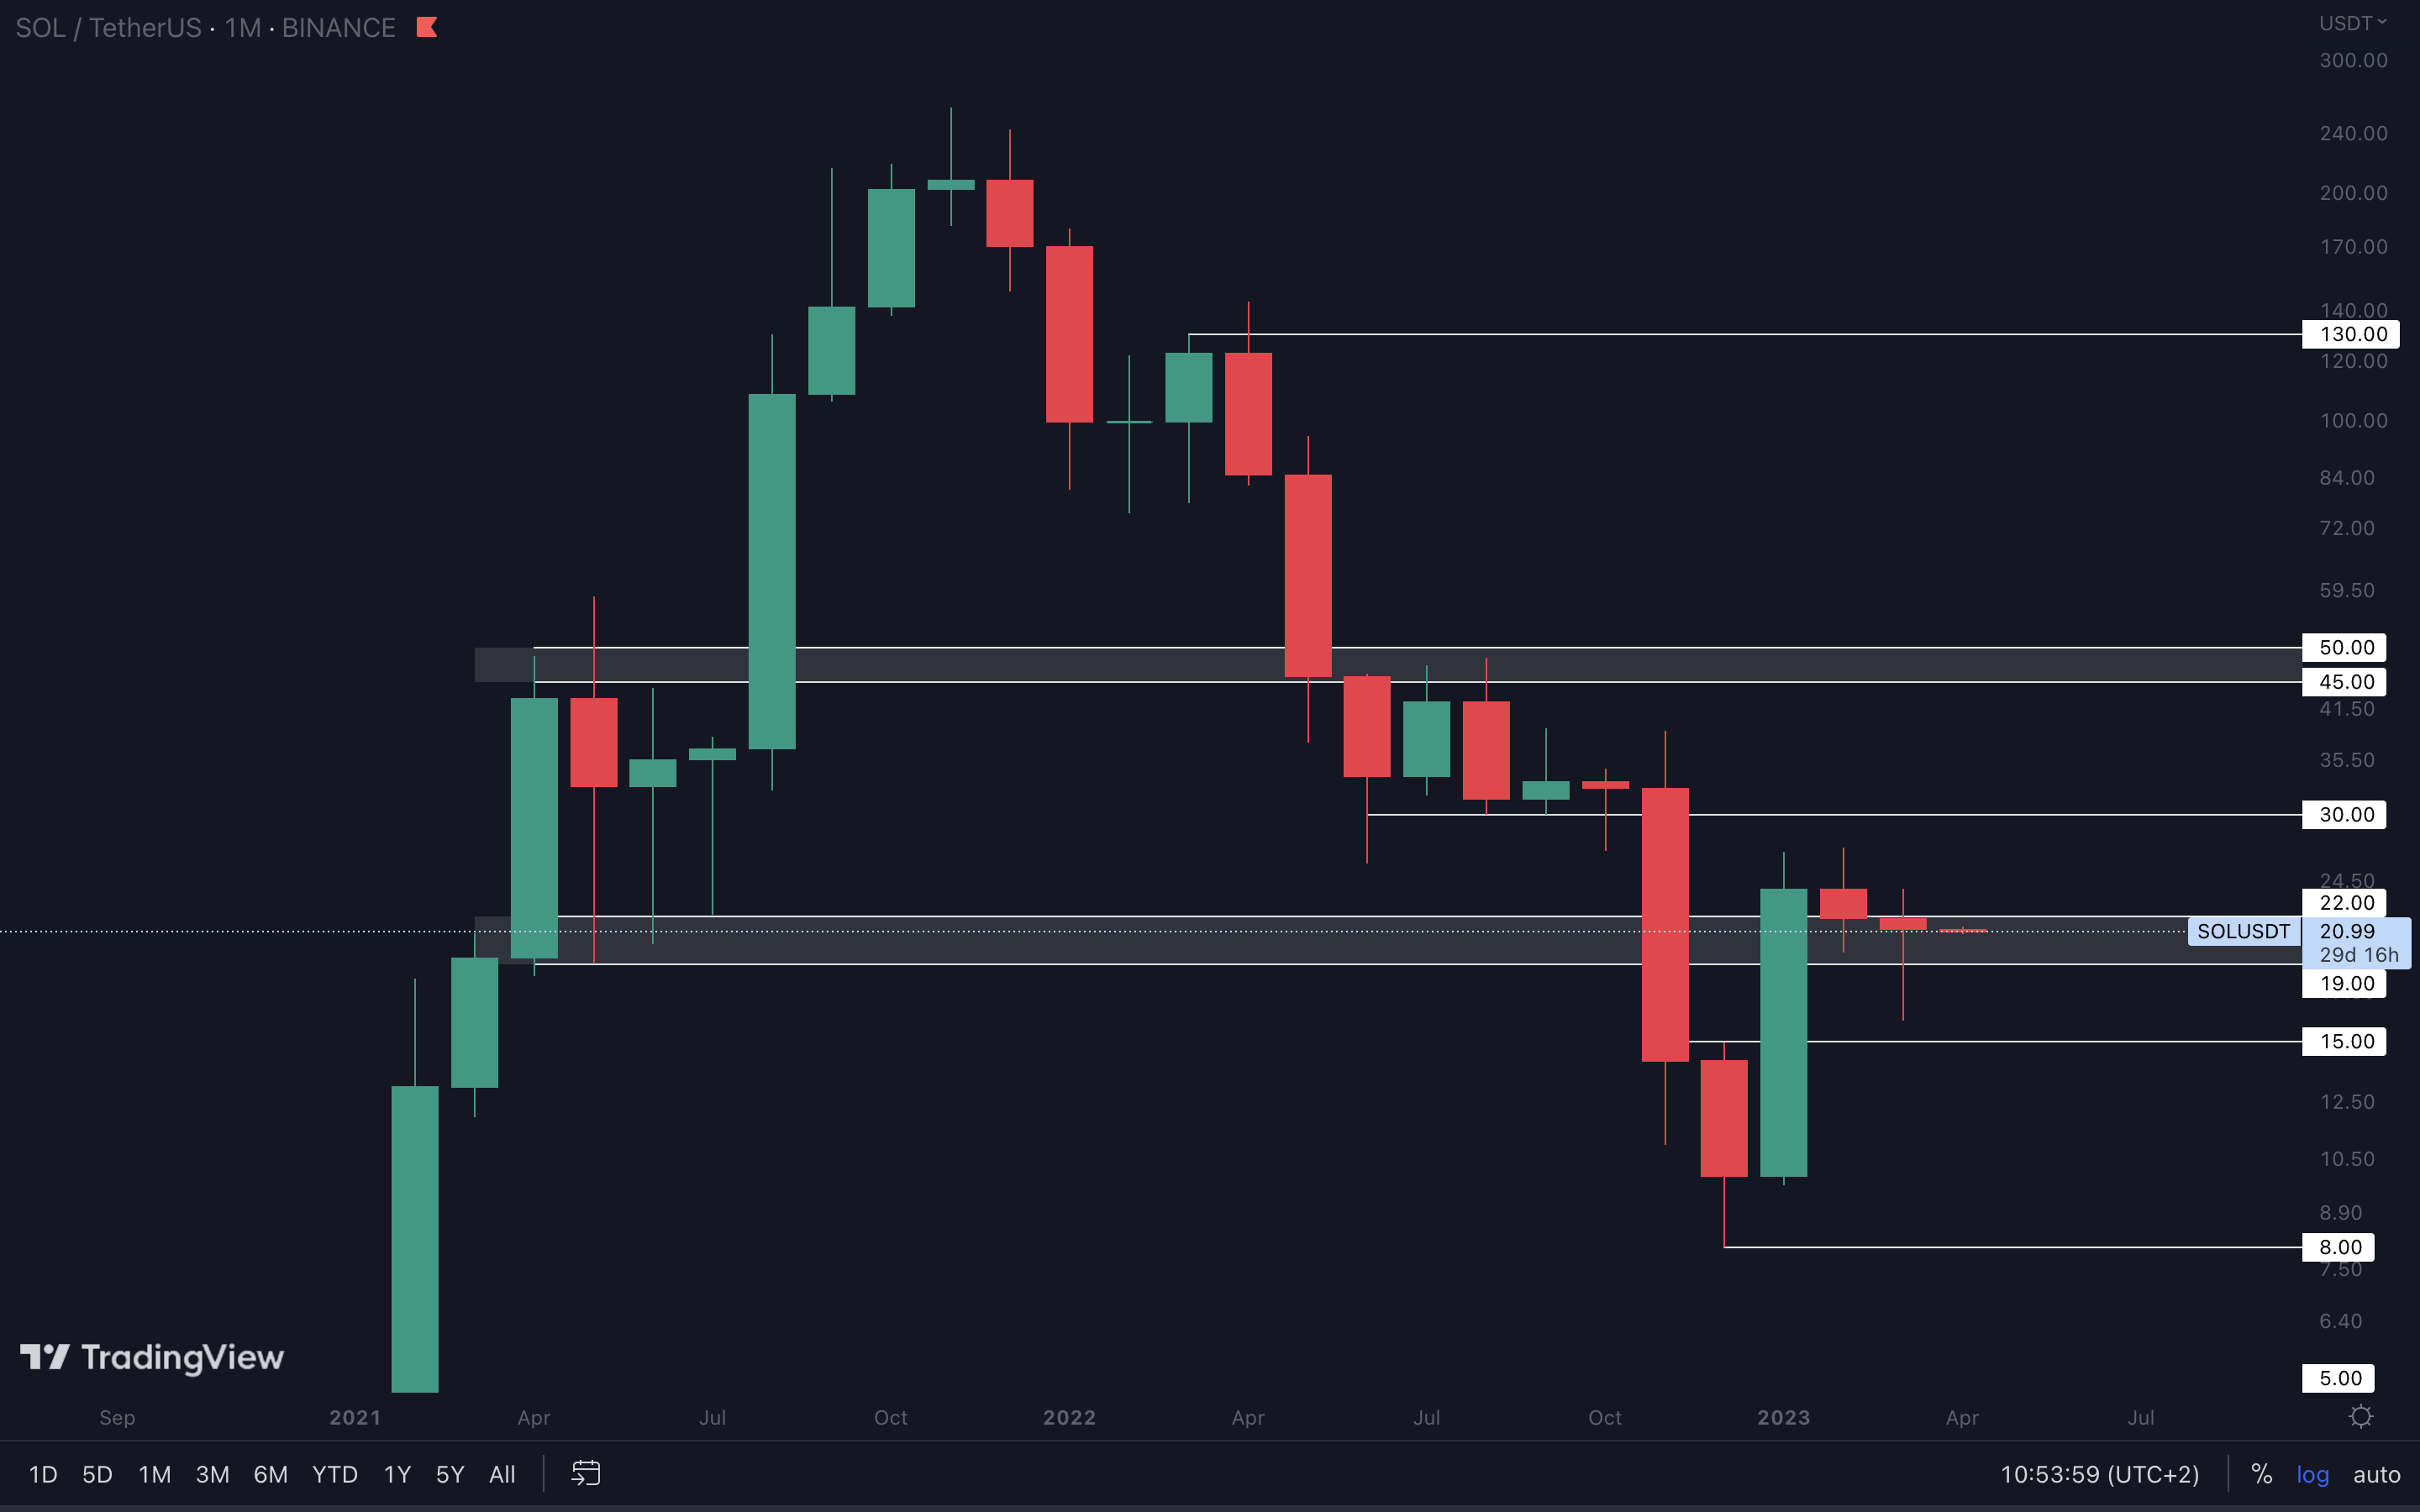
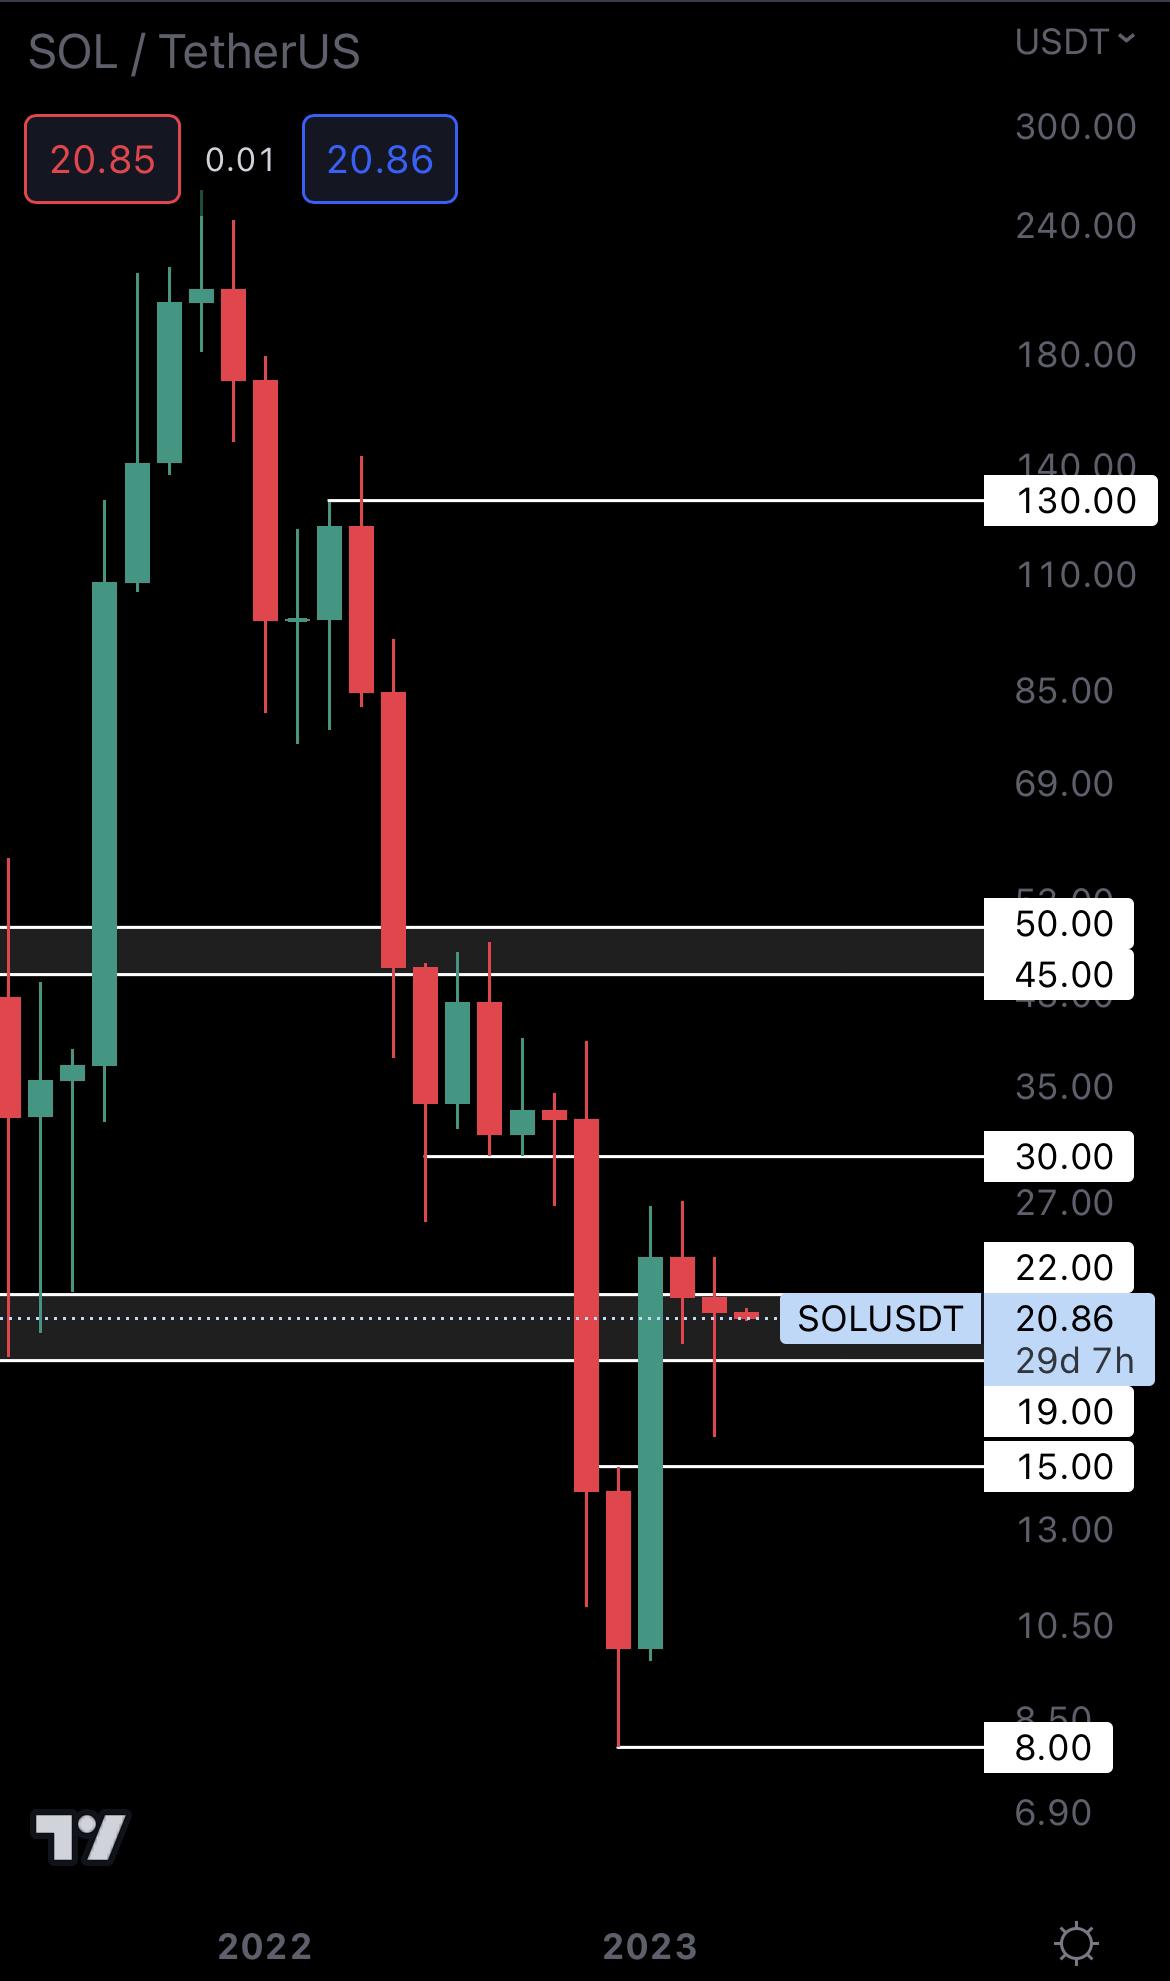
SOL is in a similar boat to DOT, and we don’t view it as a good opportunity at this time.
The asset has ranged around the $22 - $19 area for the past few months, so we’d want to see a weekly/monthly closure above or under these levels to confirm its next direction. For the time being, expect more ranging!
SNX | Synthetix (Monthly)
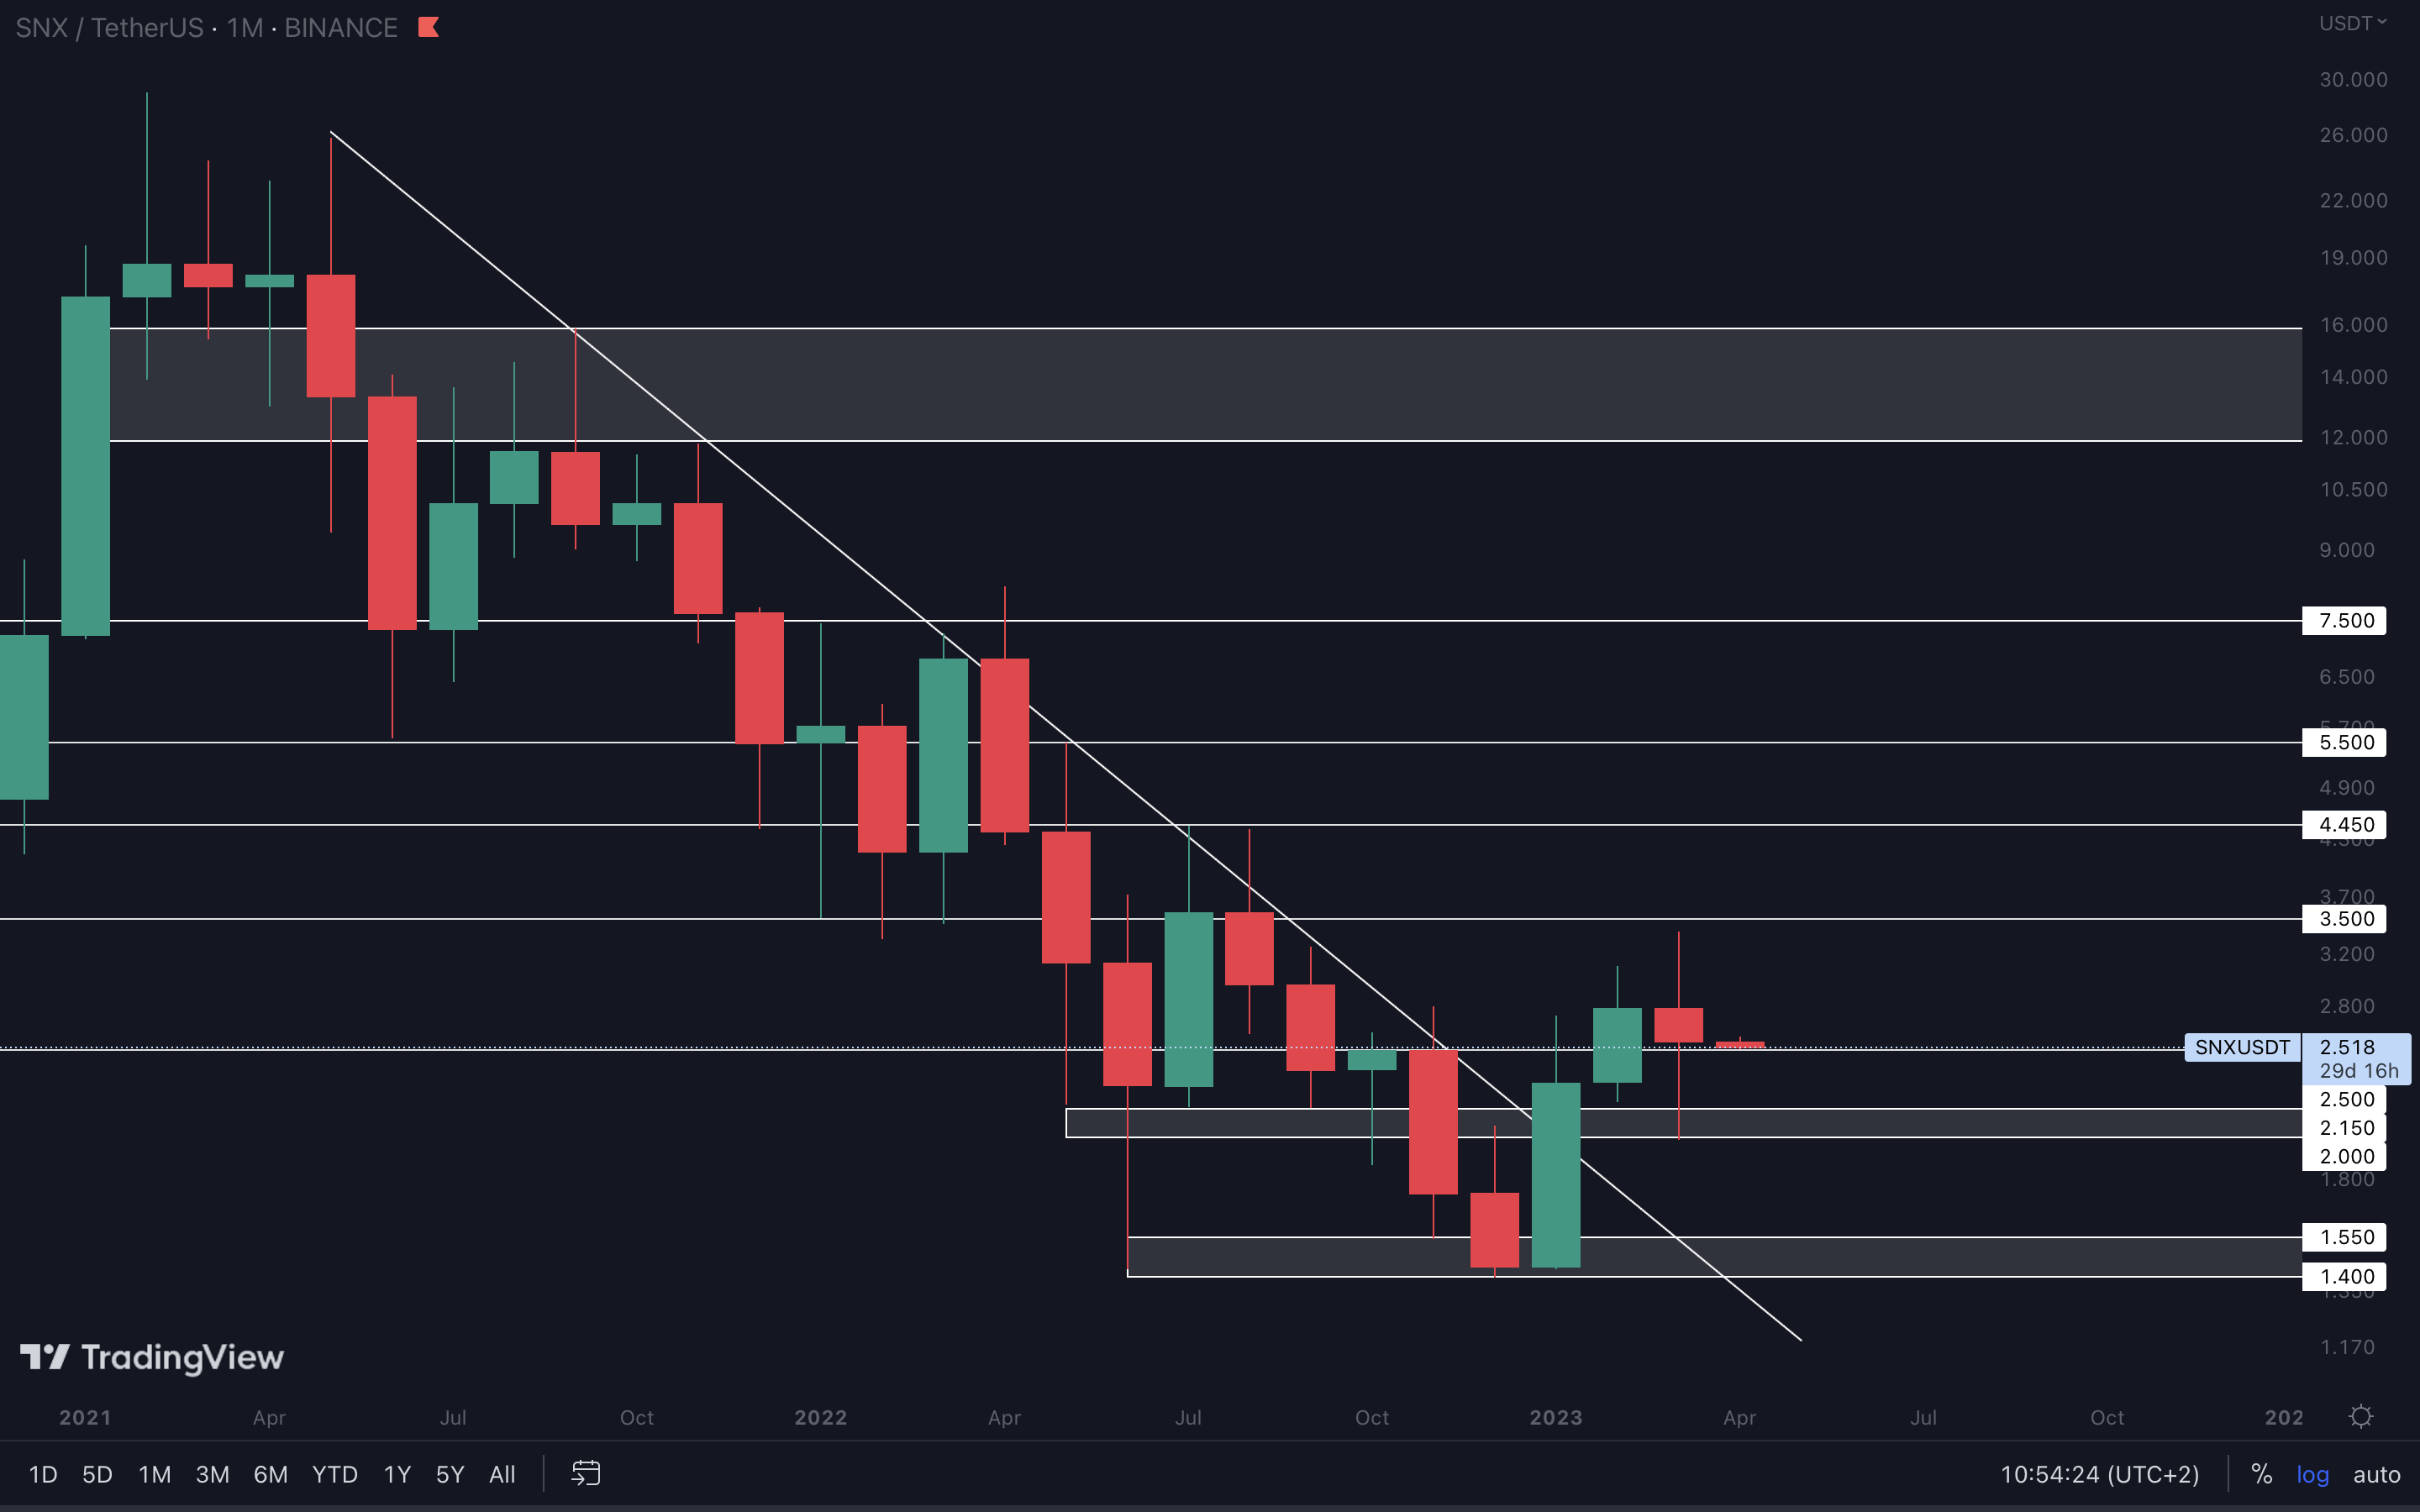
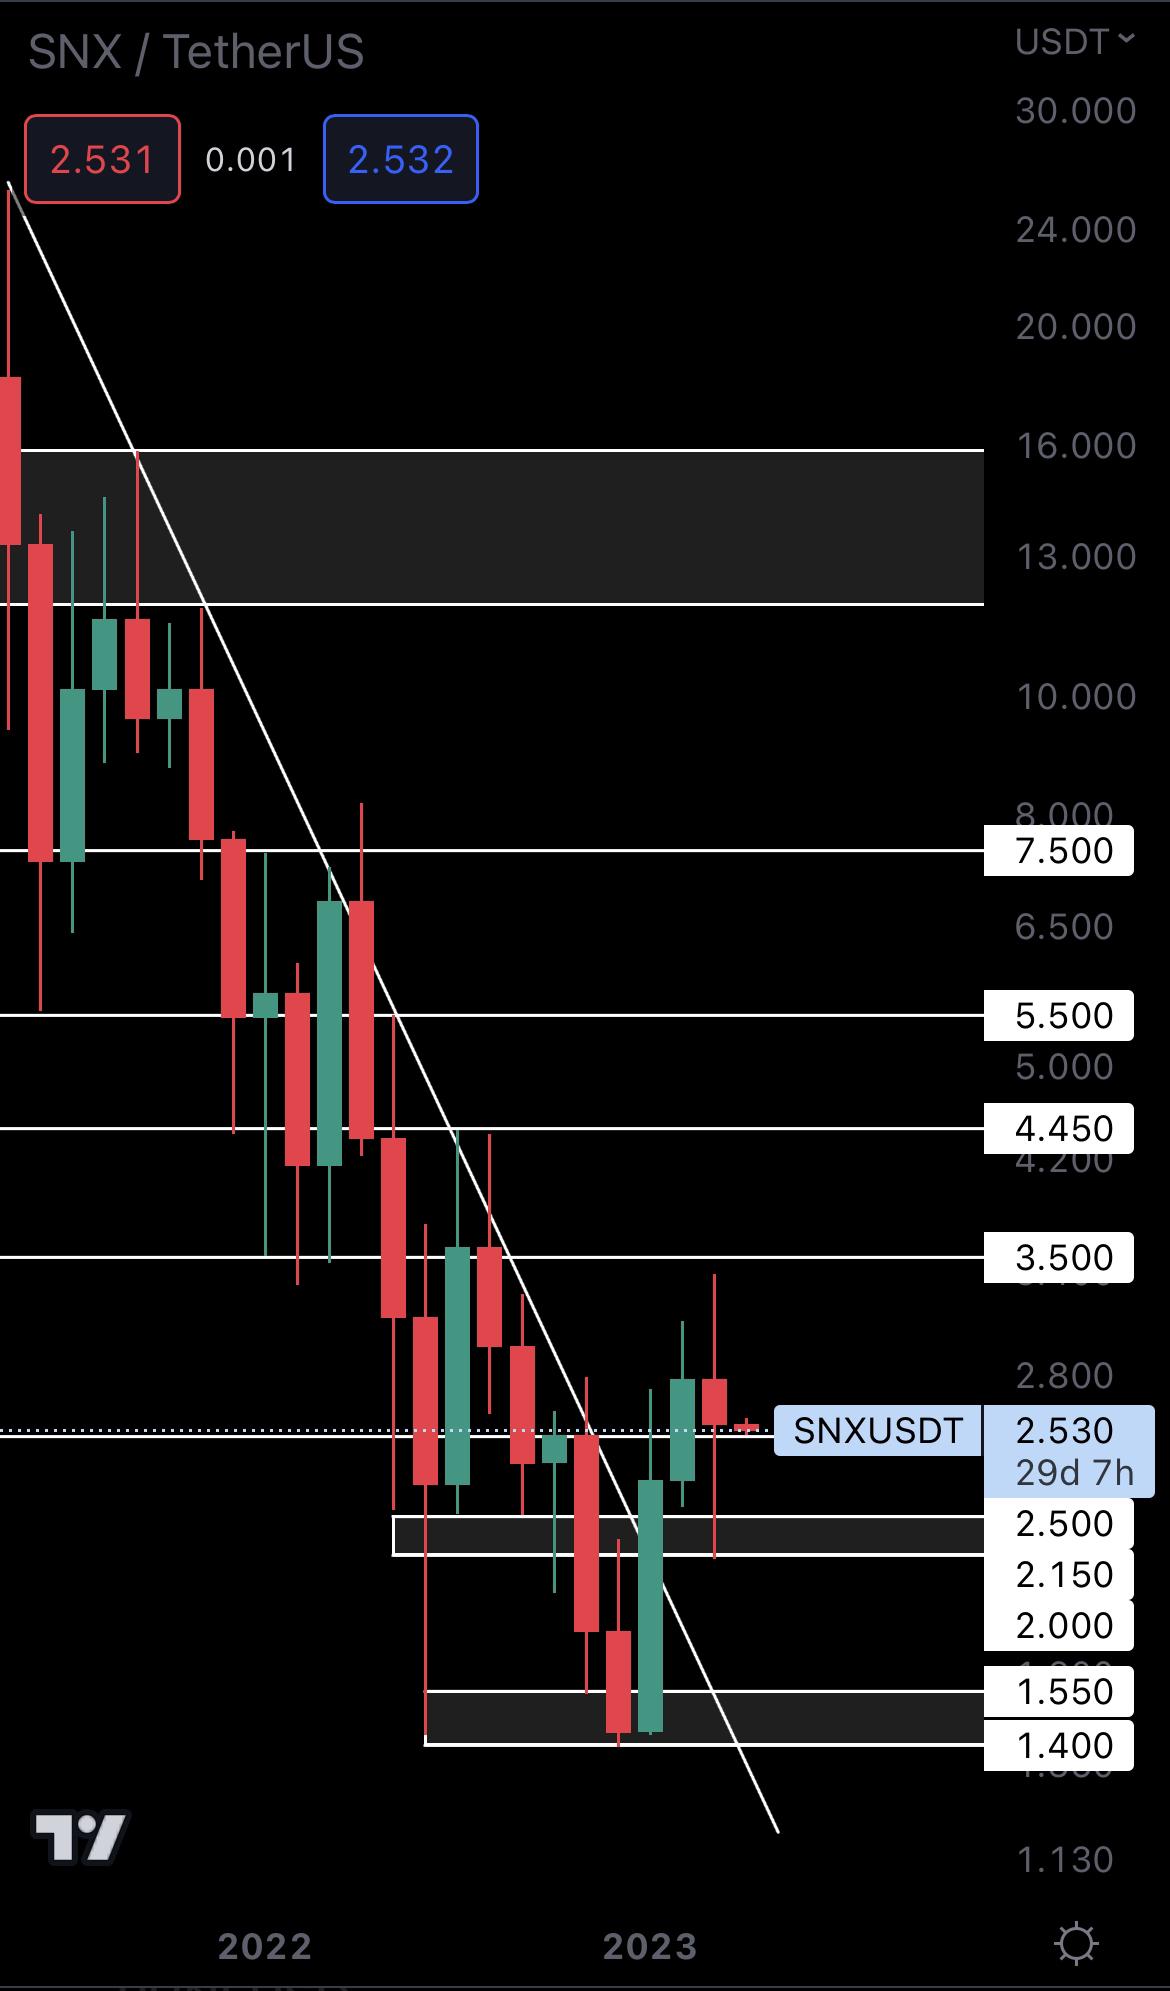 SNX closed above $2.50 two months ago, retested this level as support in March, and then closed above it. From a technical standpoint, this opens the road for $3.50 to be tested in the coming months.
When paired with our expectations for BTC, SNX could potentially reach $4.45 and $5.50 during Q2.
An invalidation of the above would occur if SNX closes a monthly candle under $2.50.
SYN | Synapse (Monthly)
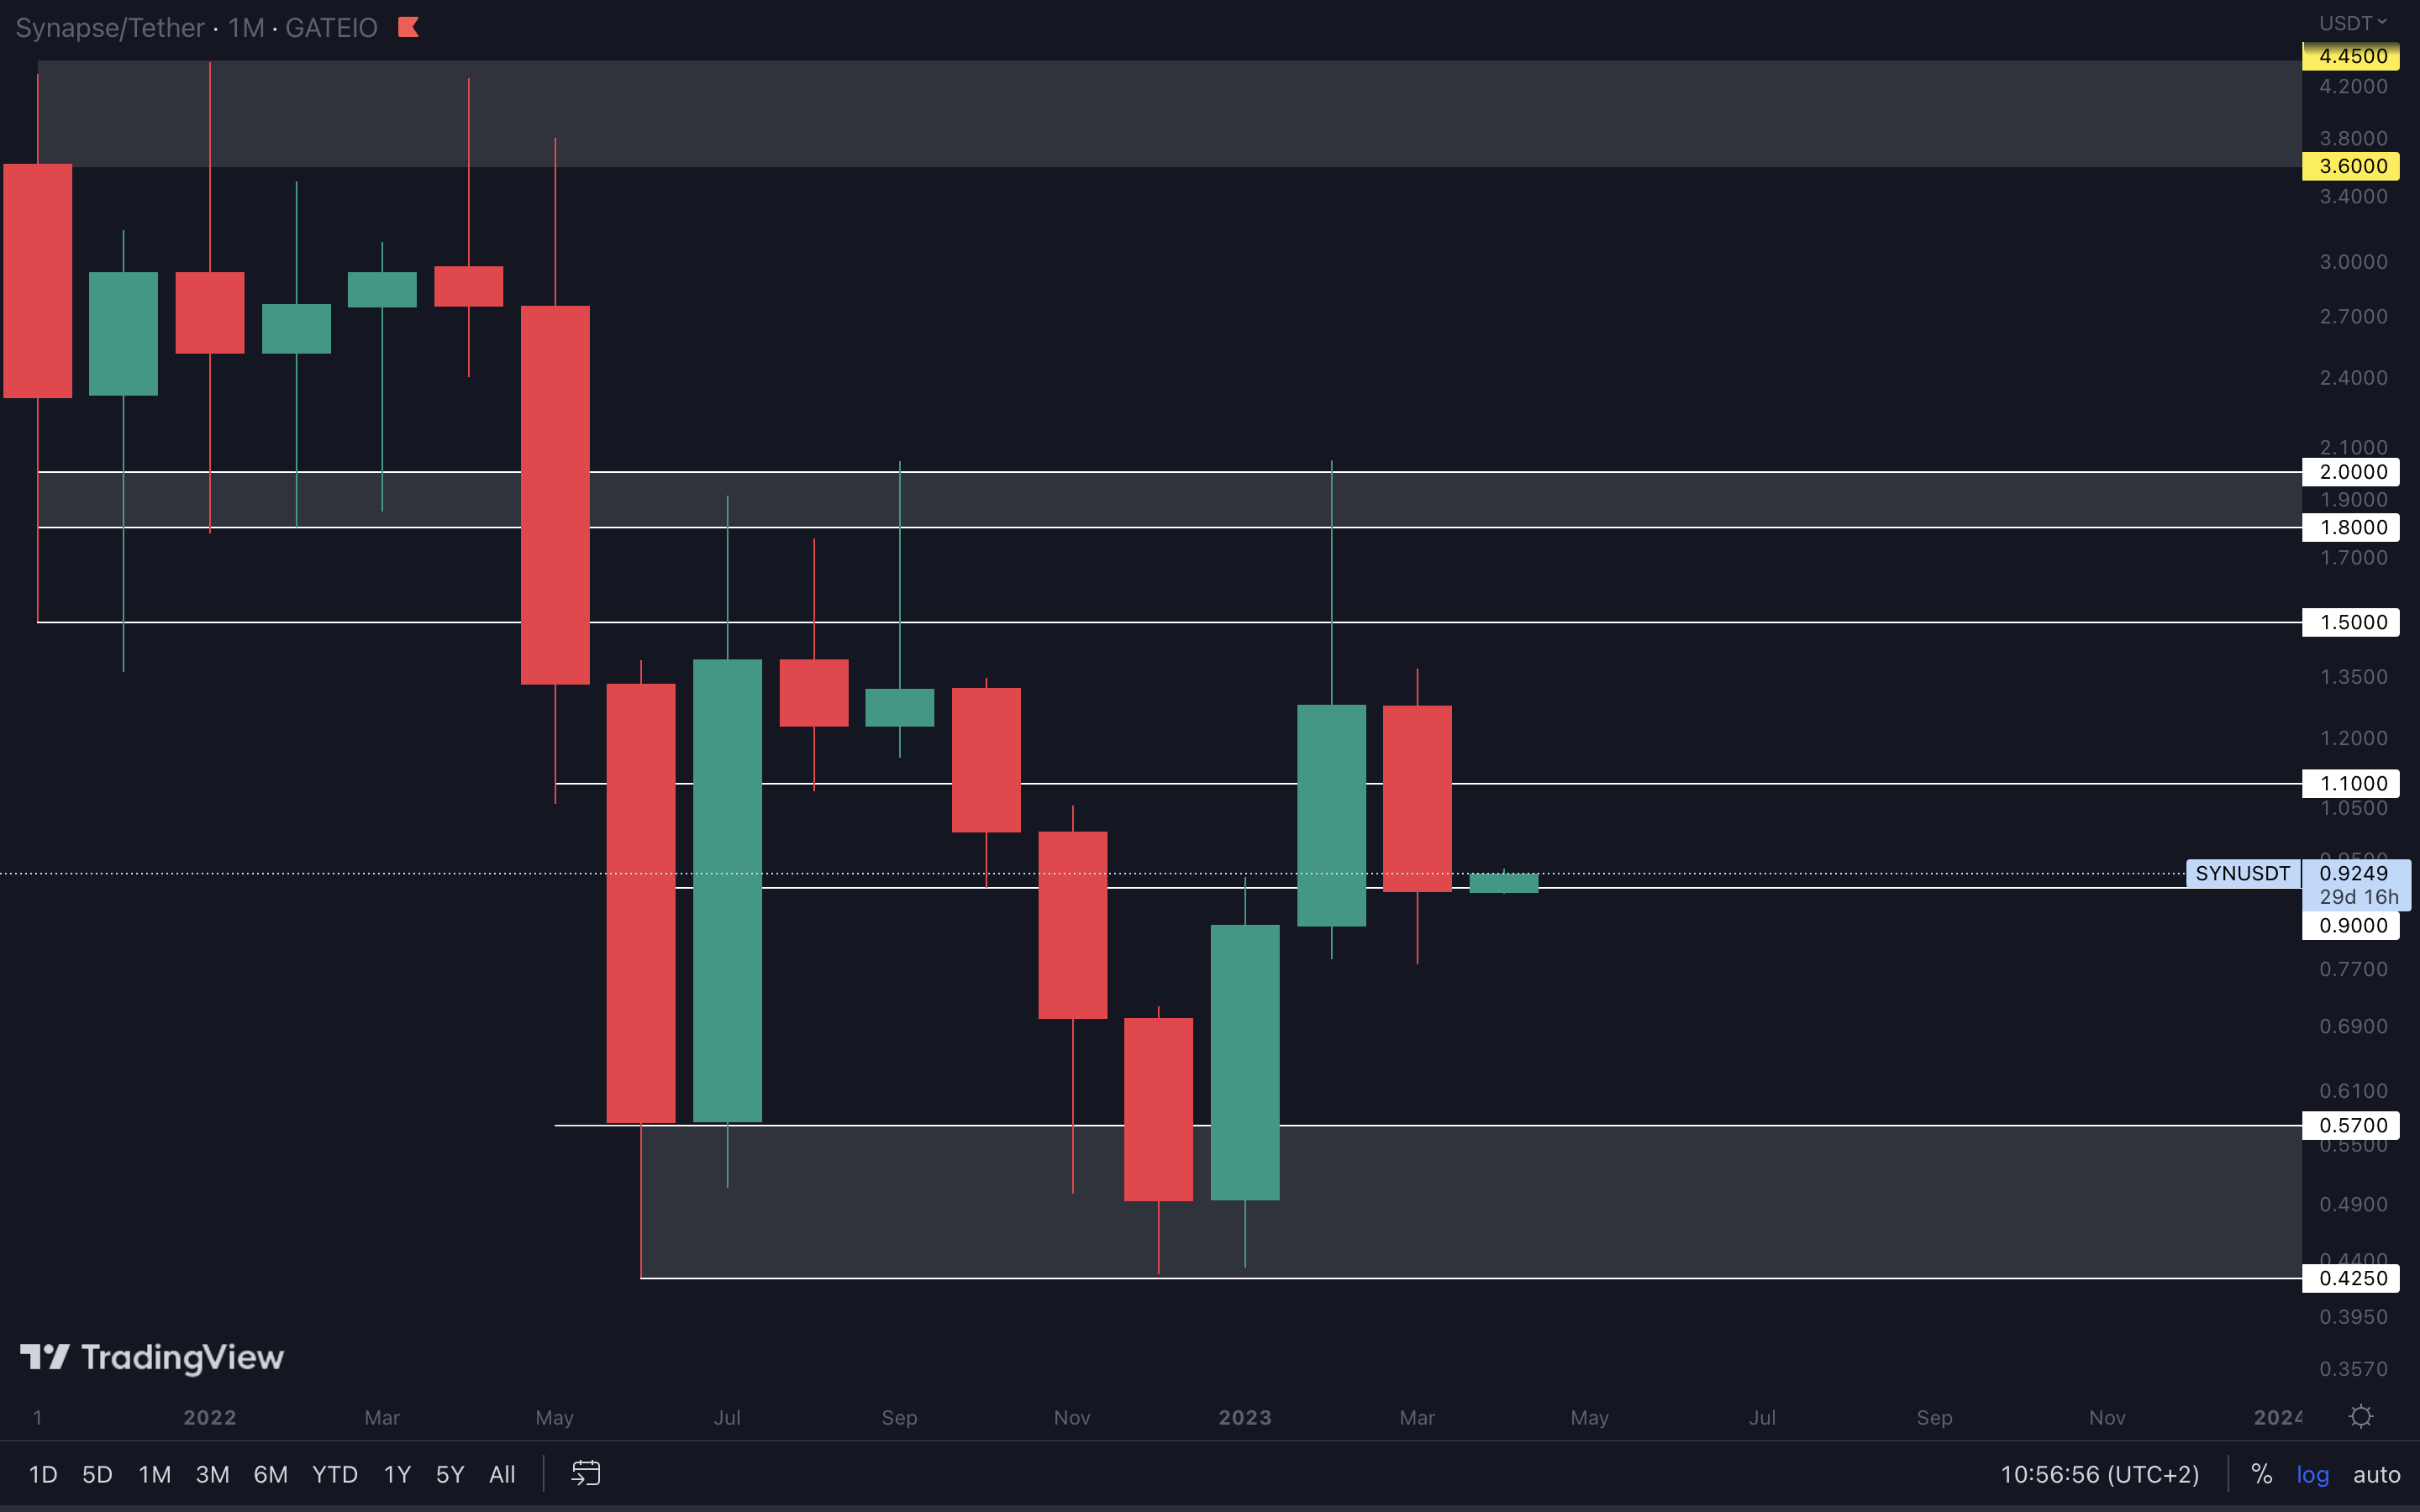
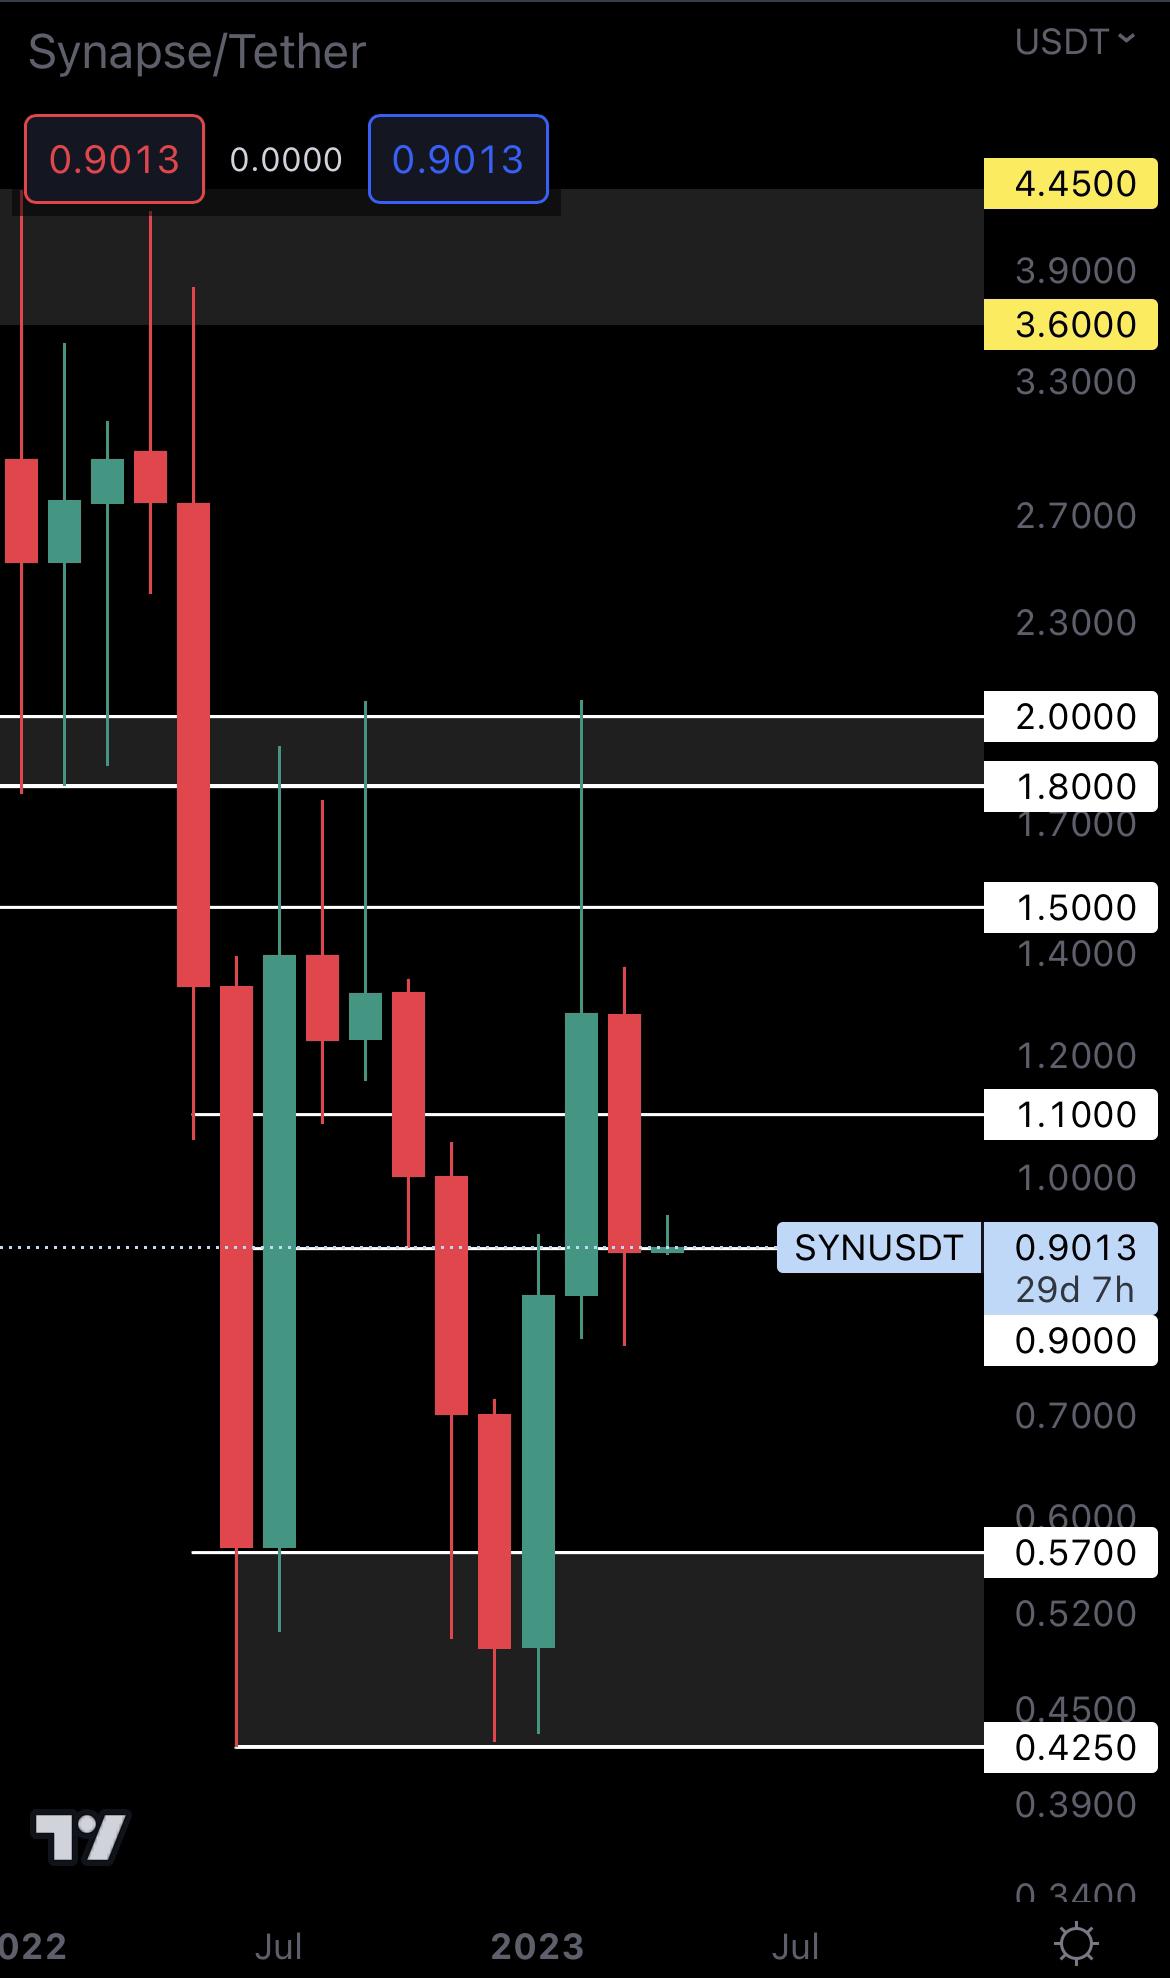 SYN closed March right into support, saving it from further downside. We’ll now need it to hold $0.90 as support on the monthly timeframe. Otherwise, it will drop to $0.57.
As long as $0.90 is held as support on the weekly and monthly timeframes, we could see SYN test $1.10. After that, it’s a simple process to the upside:
1. SYN breaks $1.10, holds it as support, and bounces toward $1.50. 2. SYN breaks $1.50, holds it as support, and bounces toward $1.80 - $2.
We’ll be paying more attention to SYN on the weekly timeframe in our Weekly Digests, because that will give us a better view at its price action in Q2.
MINA | Mina Protocol (Monthly)
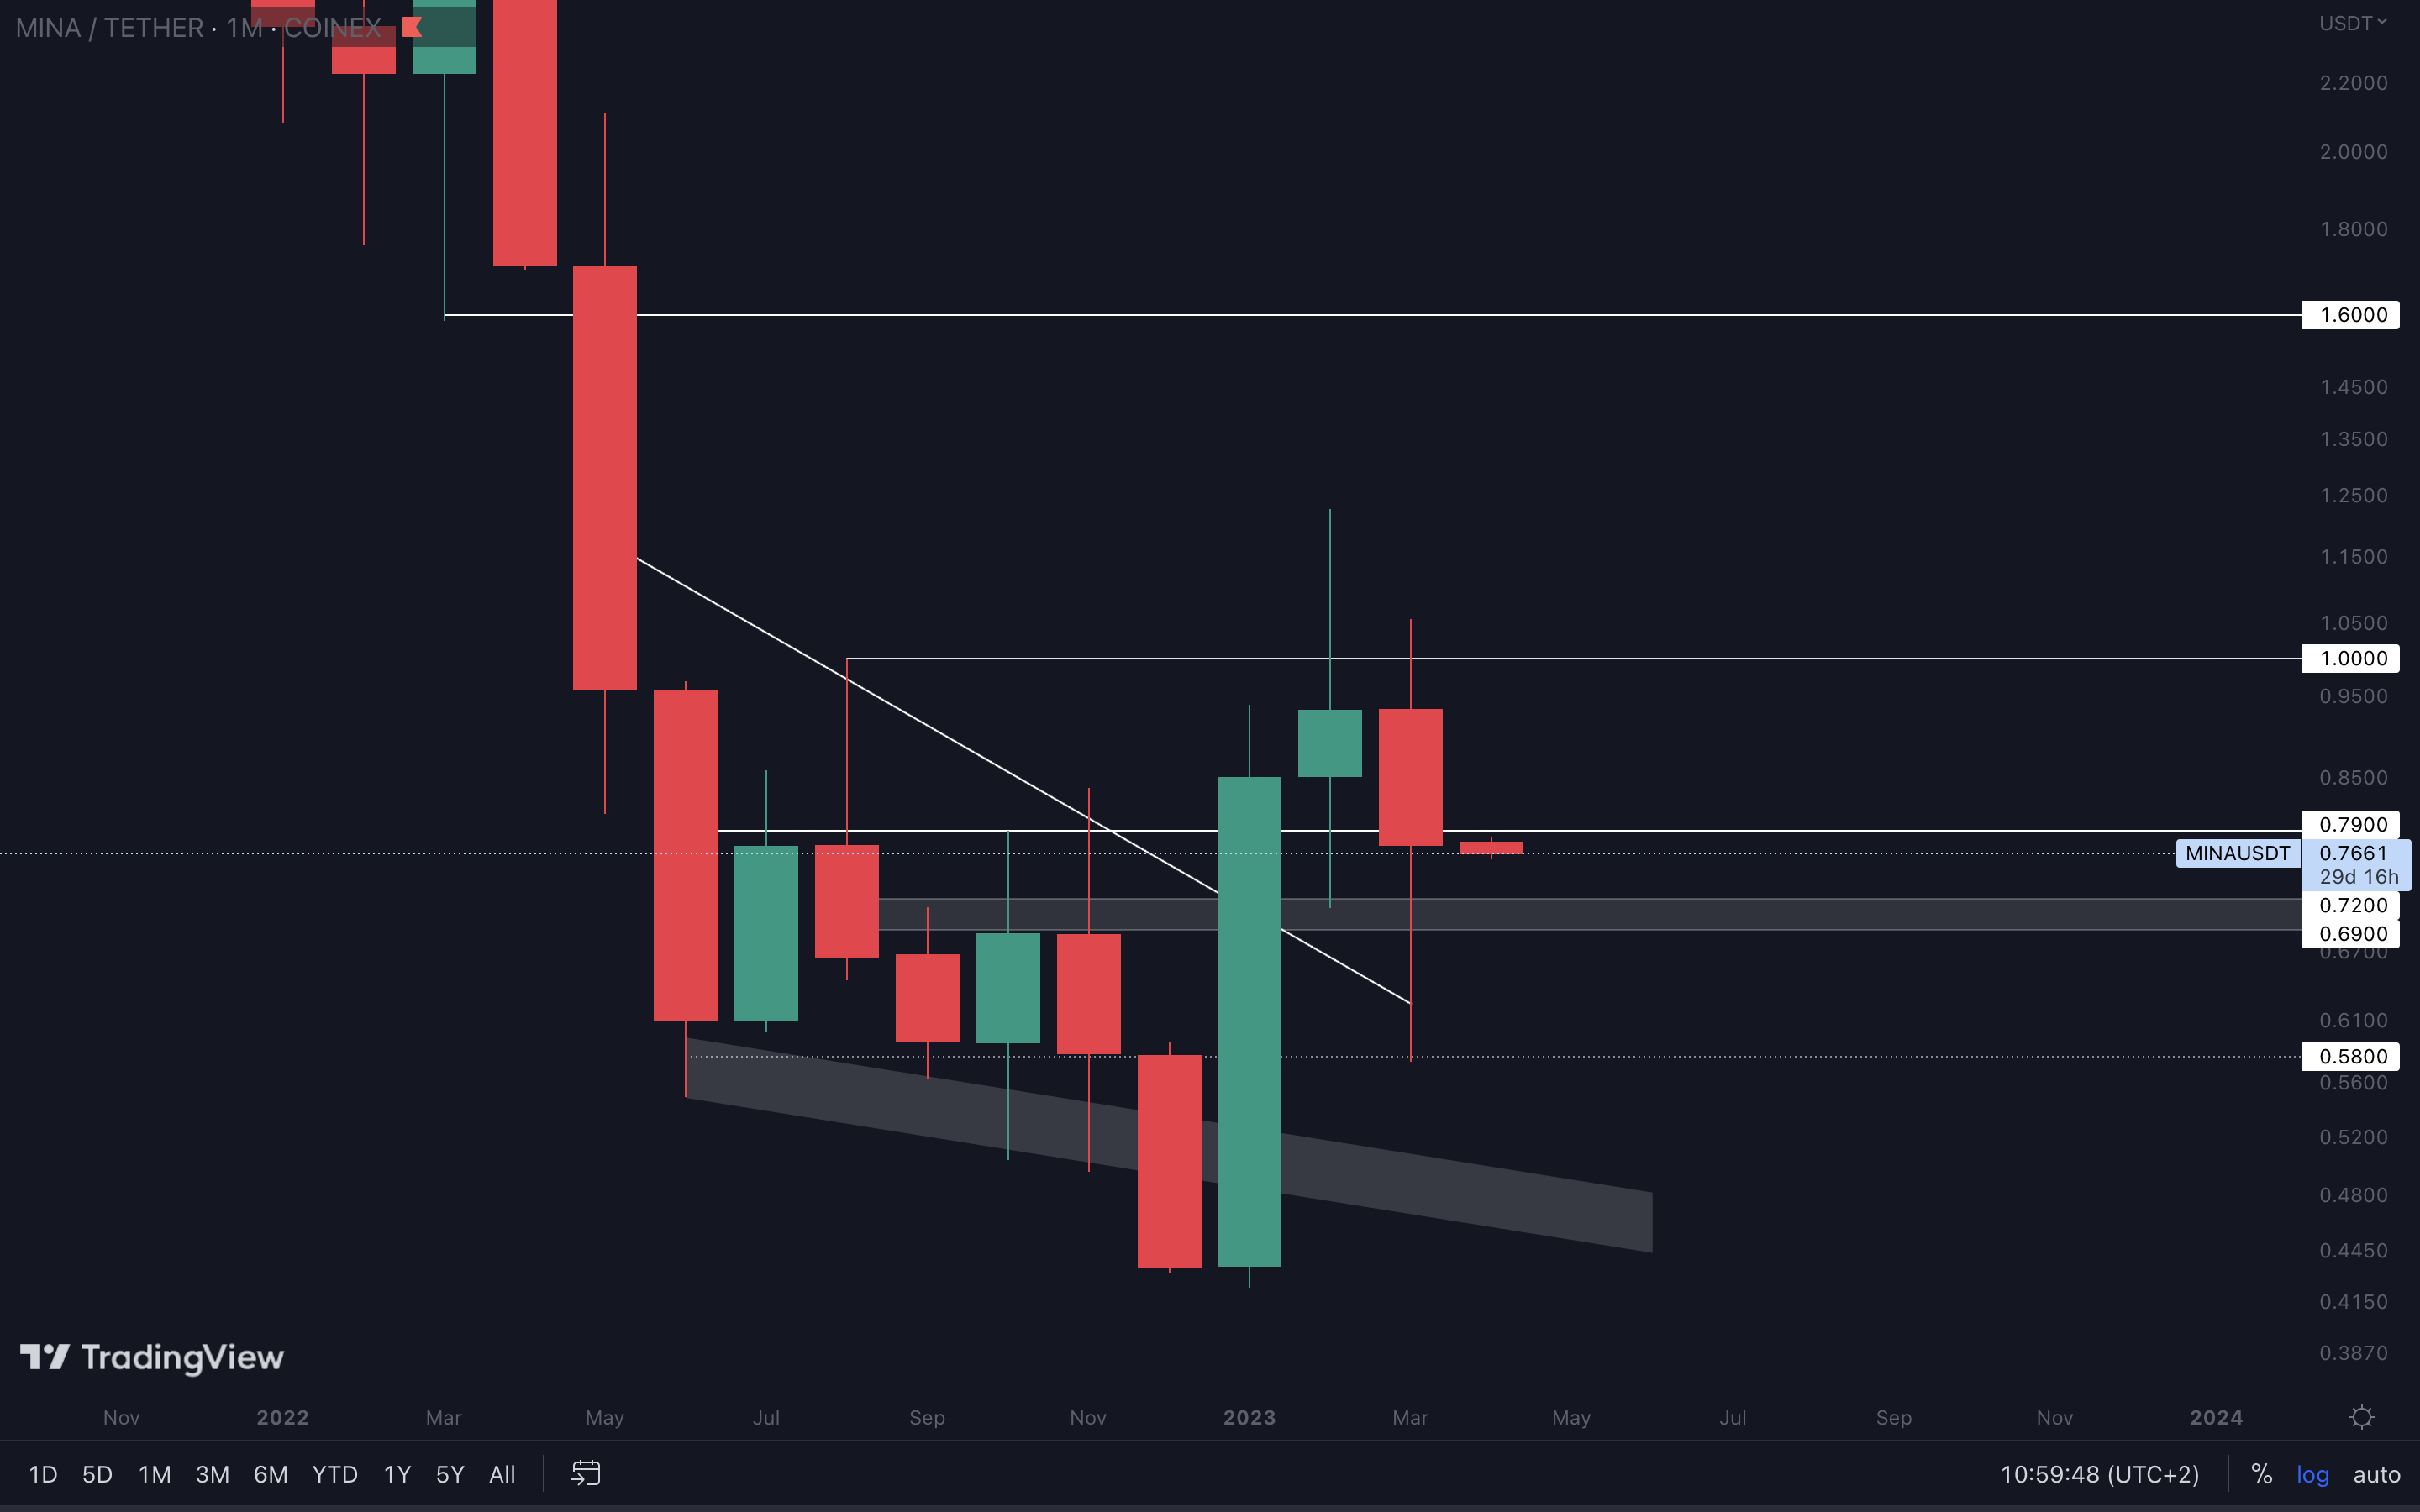
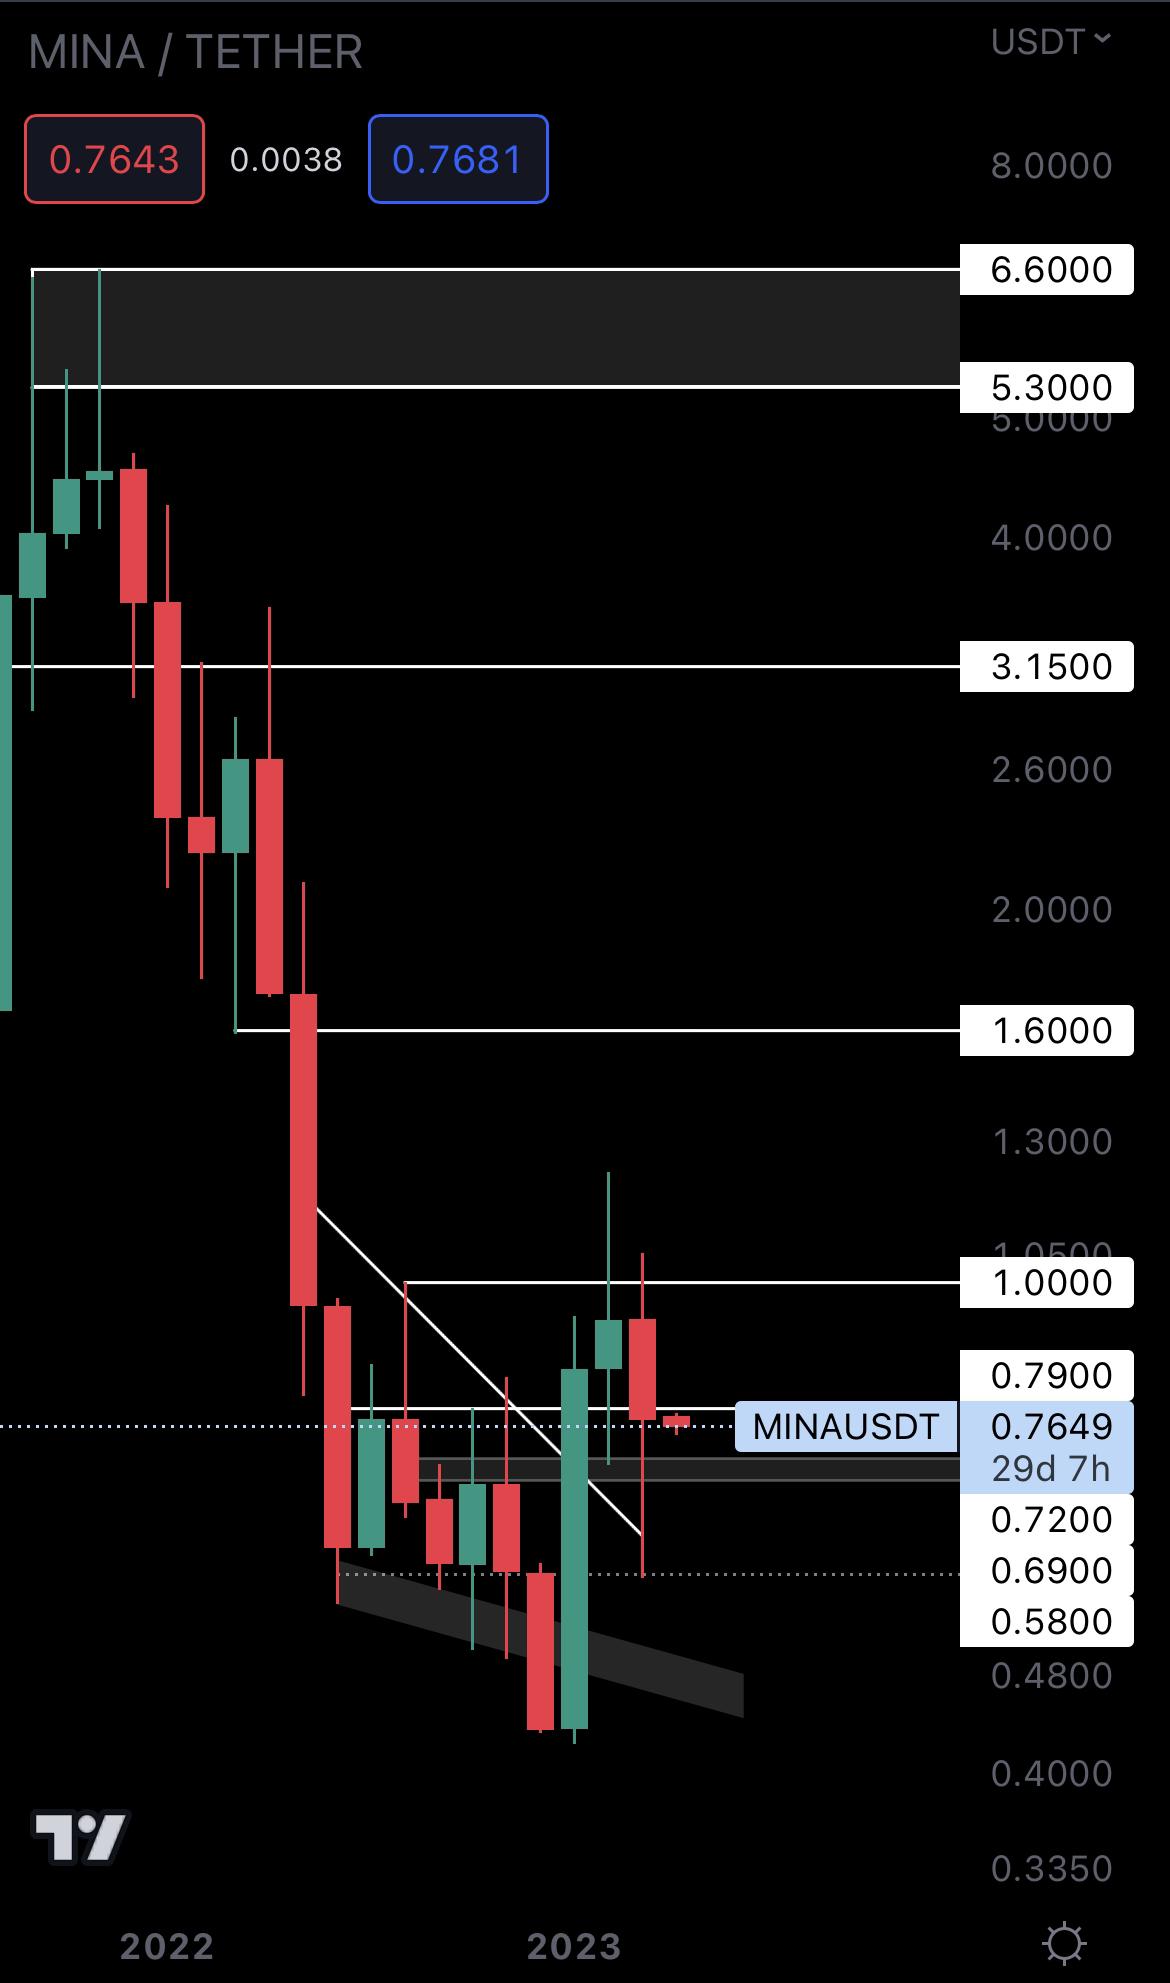
MINA closed last month’s candlestick under $0.79, so this level has now been flipped into resistance on the monthly timeframe. The asset will likely range between $0.79 and $0.69 on the lower timeframes (weekly and below) until either one of these levels is broken. As for Q2, MINA will follow Bitcoin’s price action, so we could easily see it break above $1 in the next three months.
ASTR | Astar Network (Monthly)
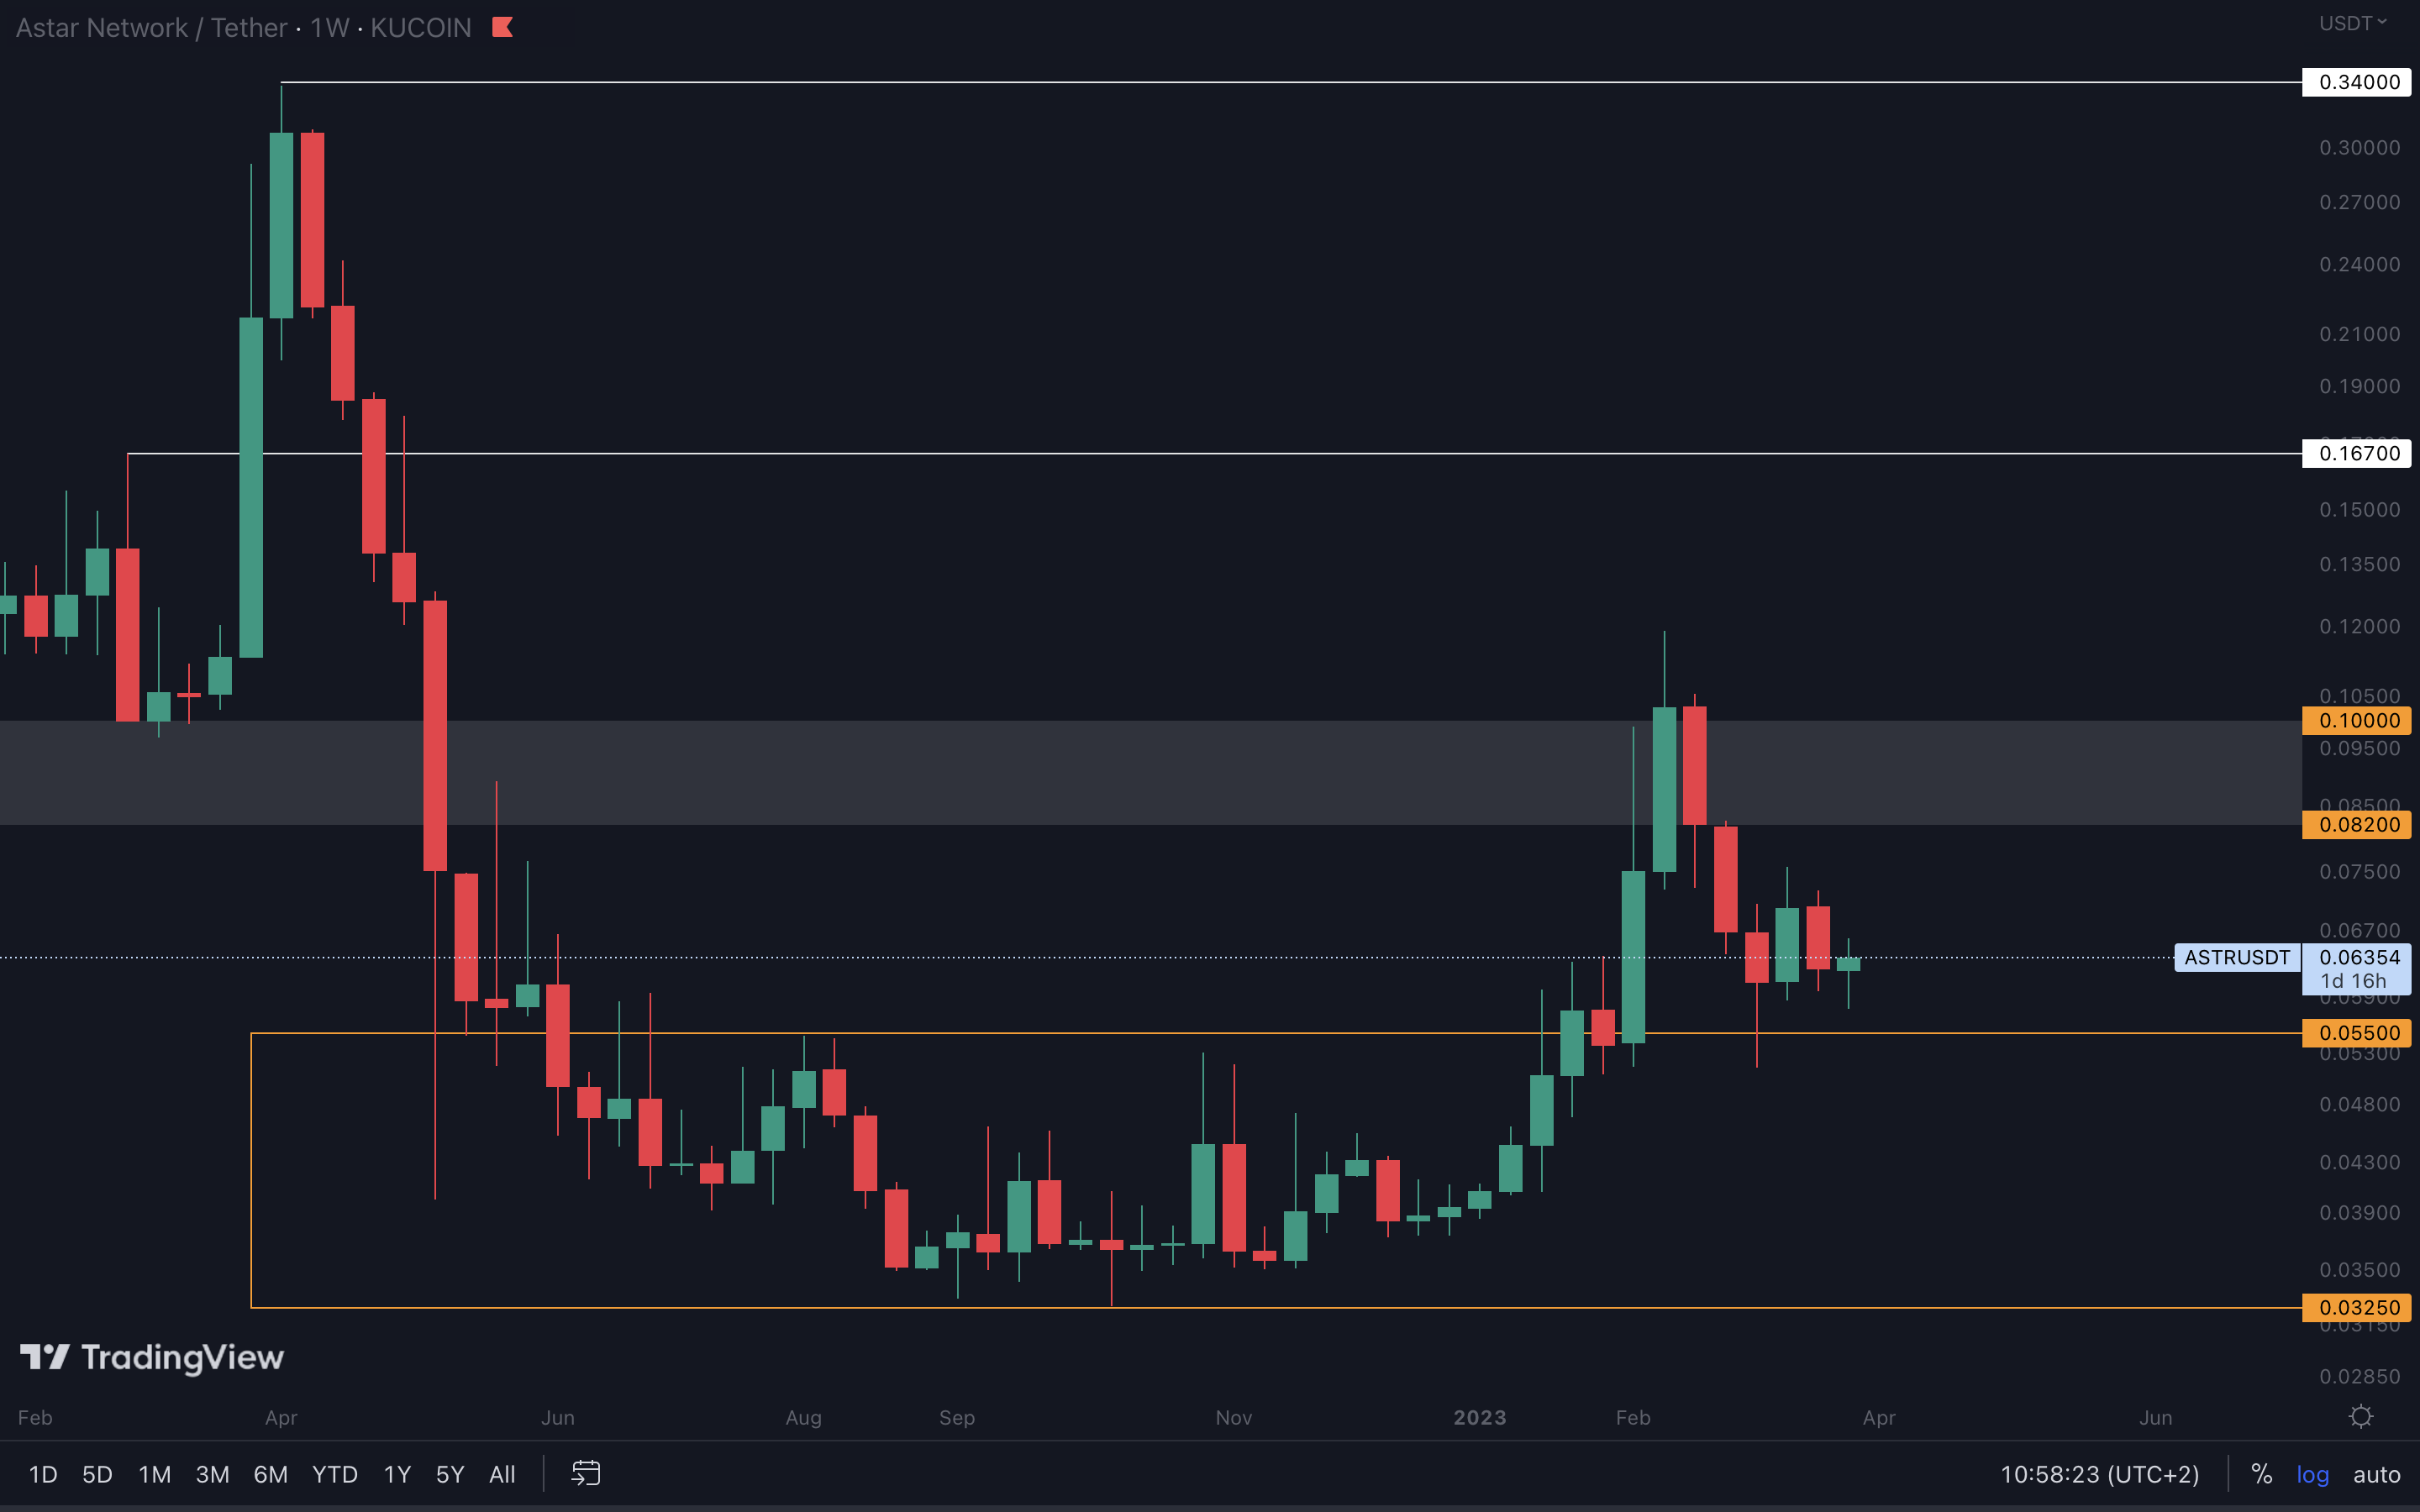
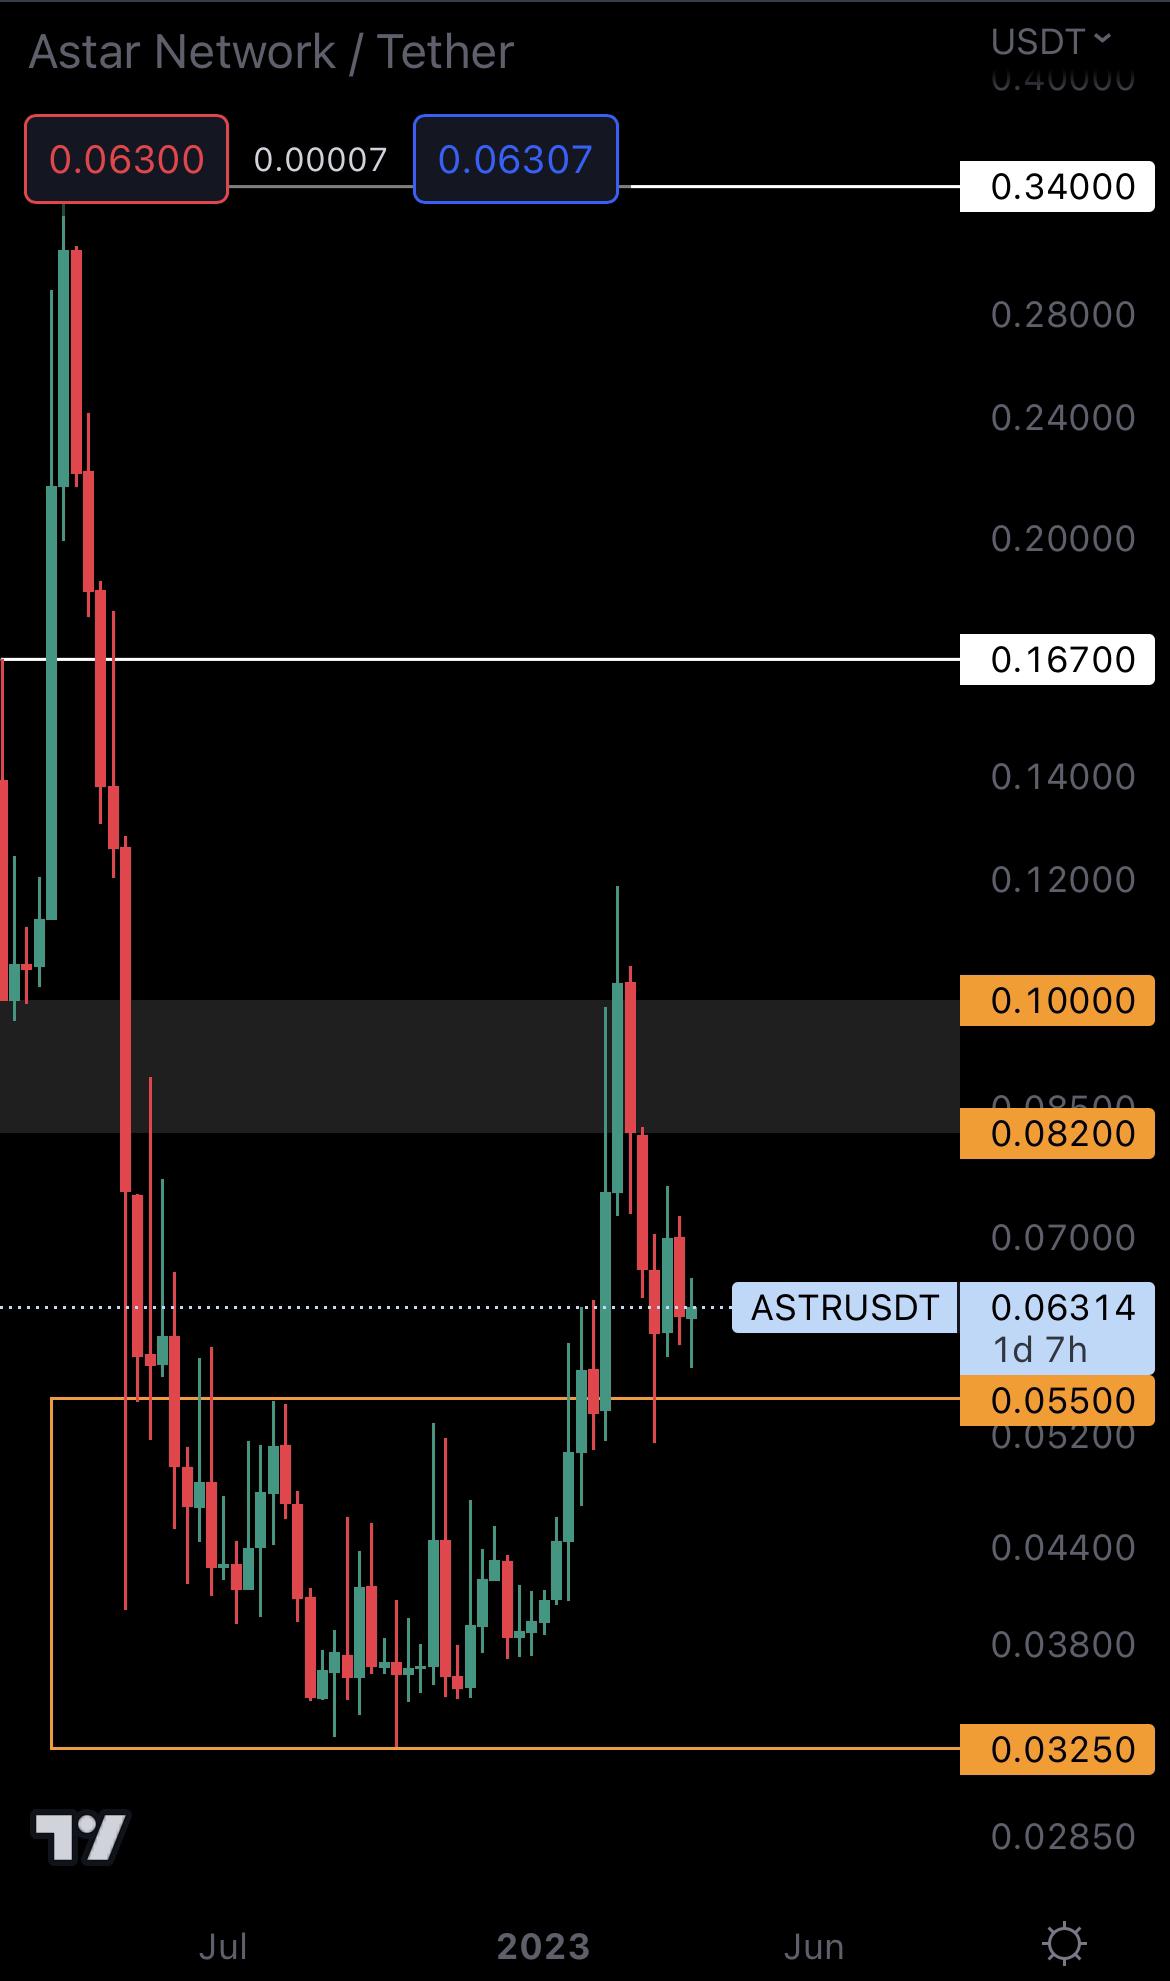
ASTR has been ranging above $0.05500 for a few weeks. If we pair it with the potential pullback on BTC, we could see ASTR drop back to $0.05500 in the coming weeks. As for Q2, ASTR will head to the $0.082 - $0.10 resistance area.
THOR | THORSwap (Monthly)
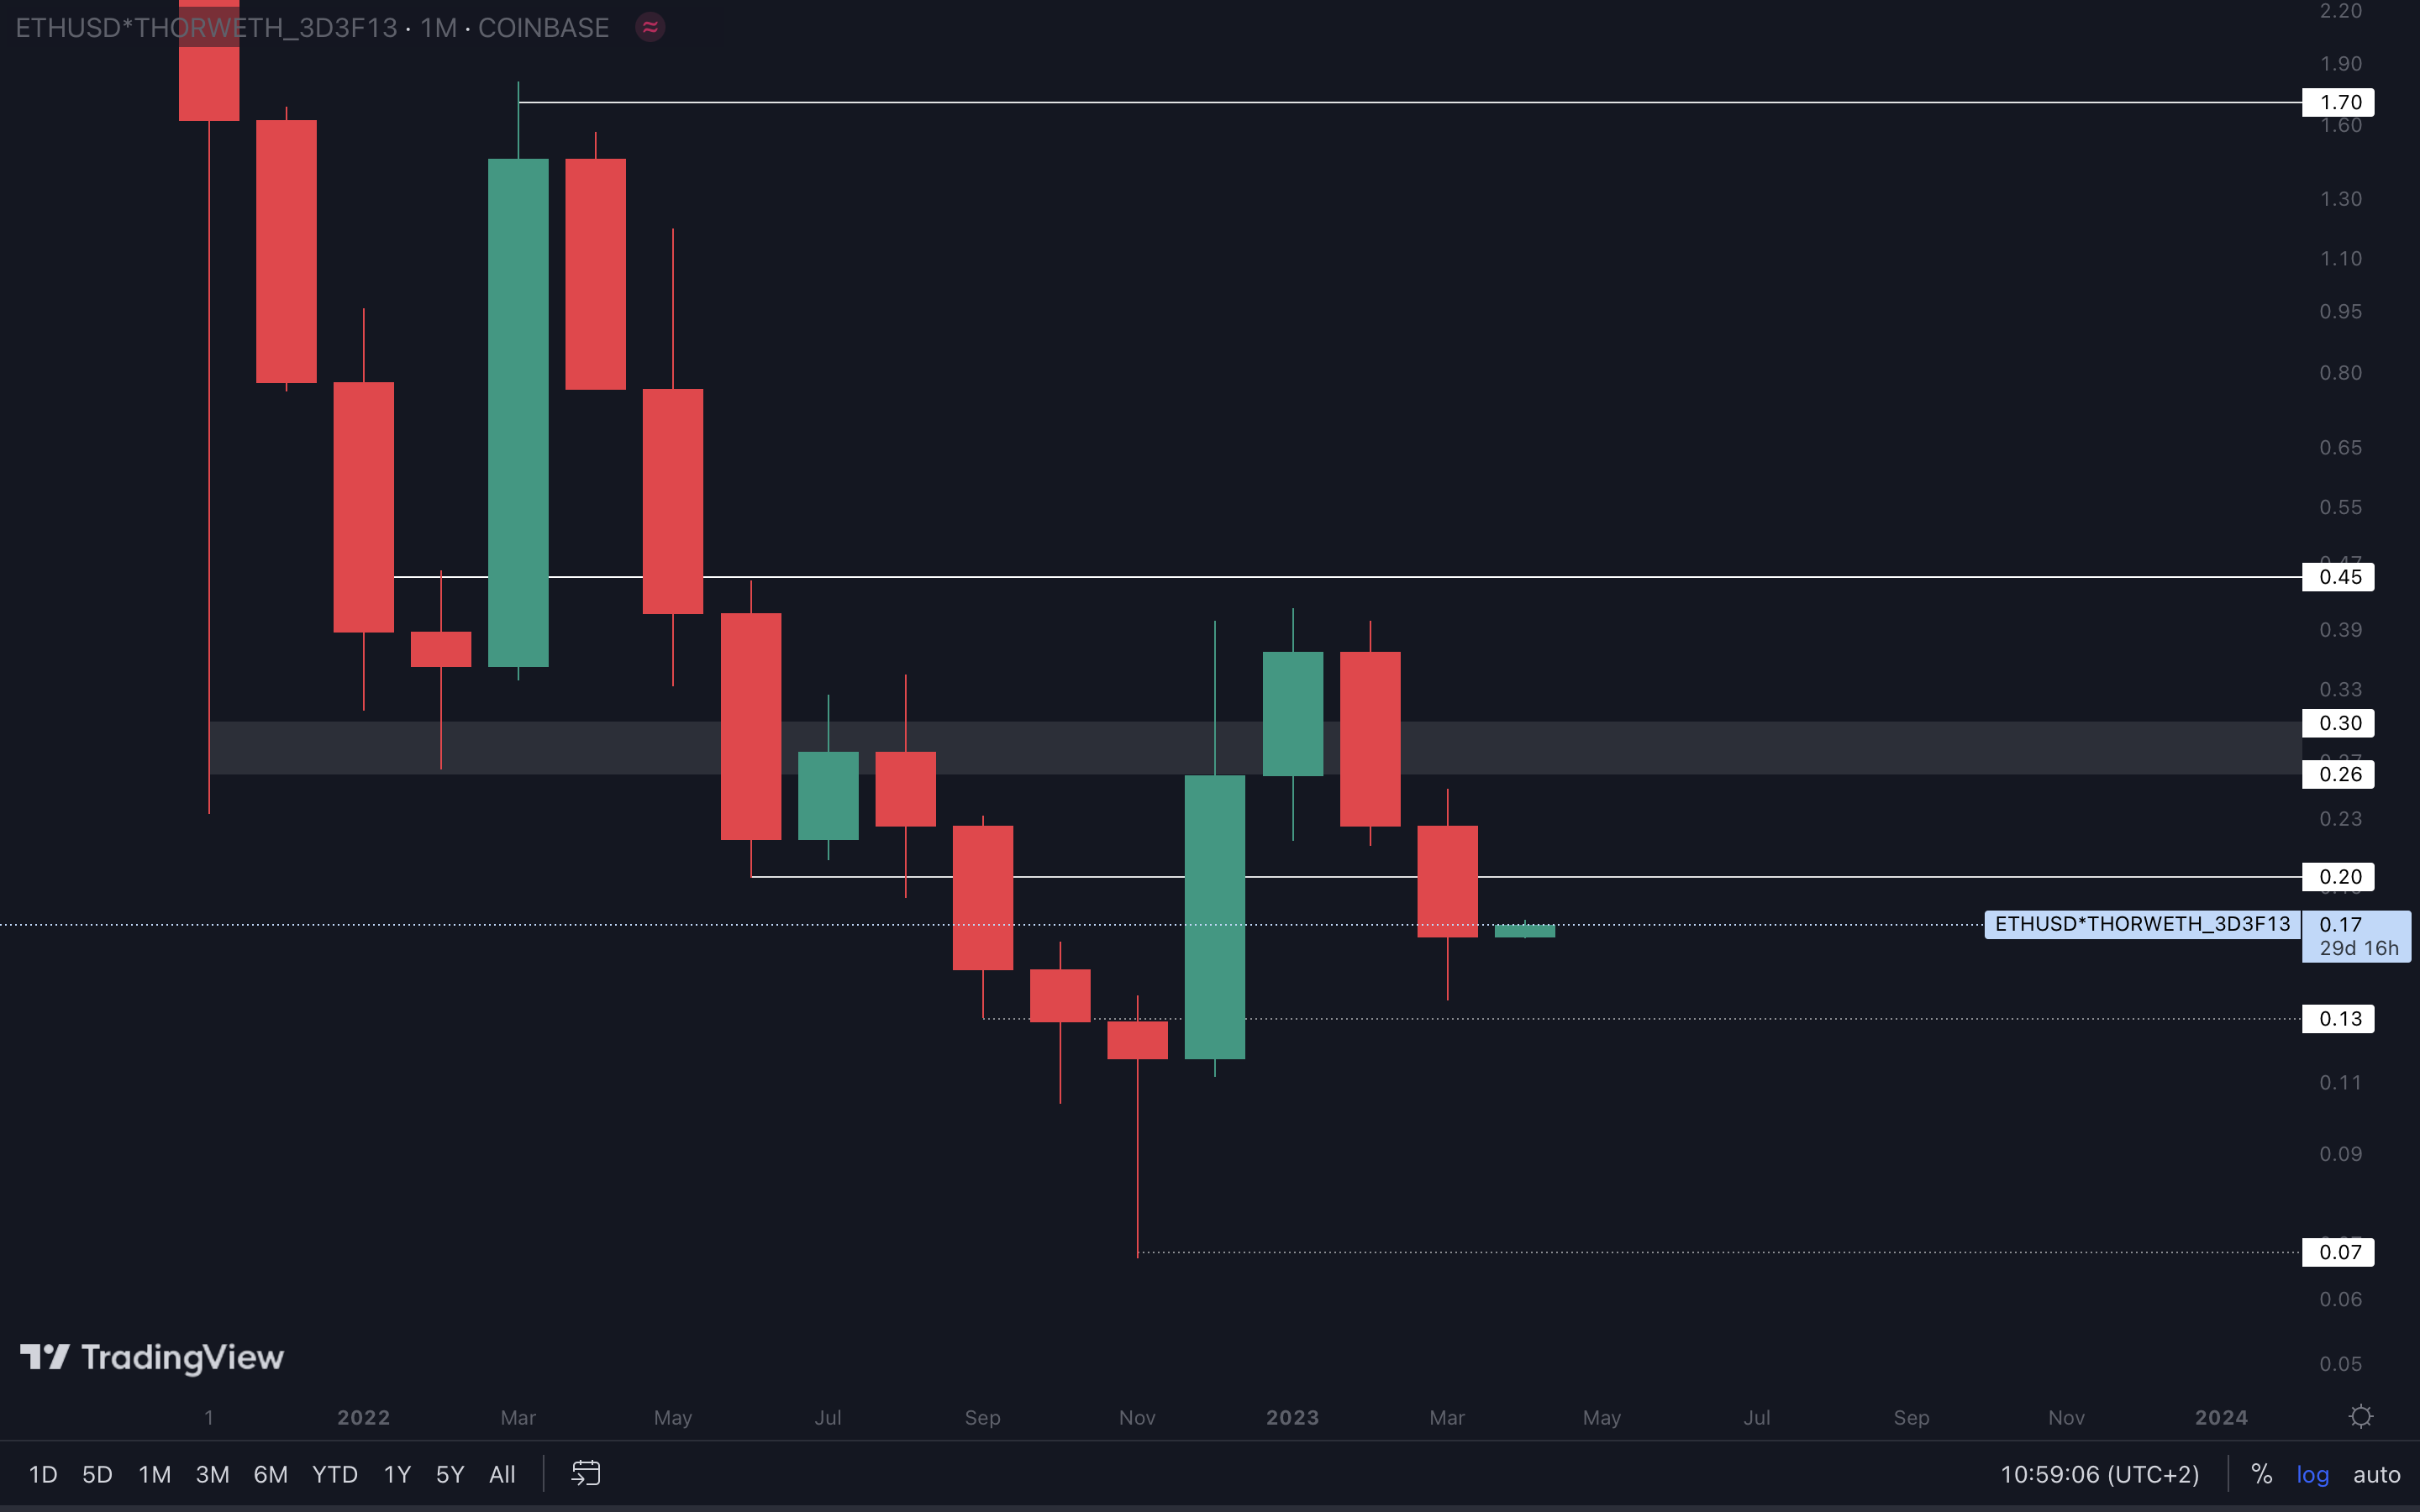
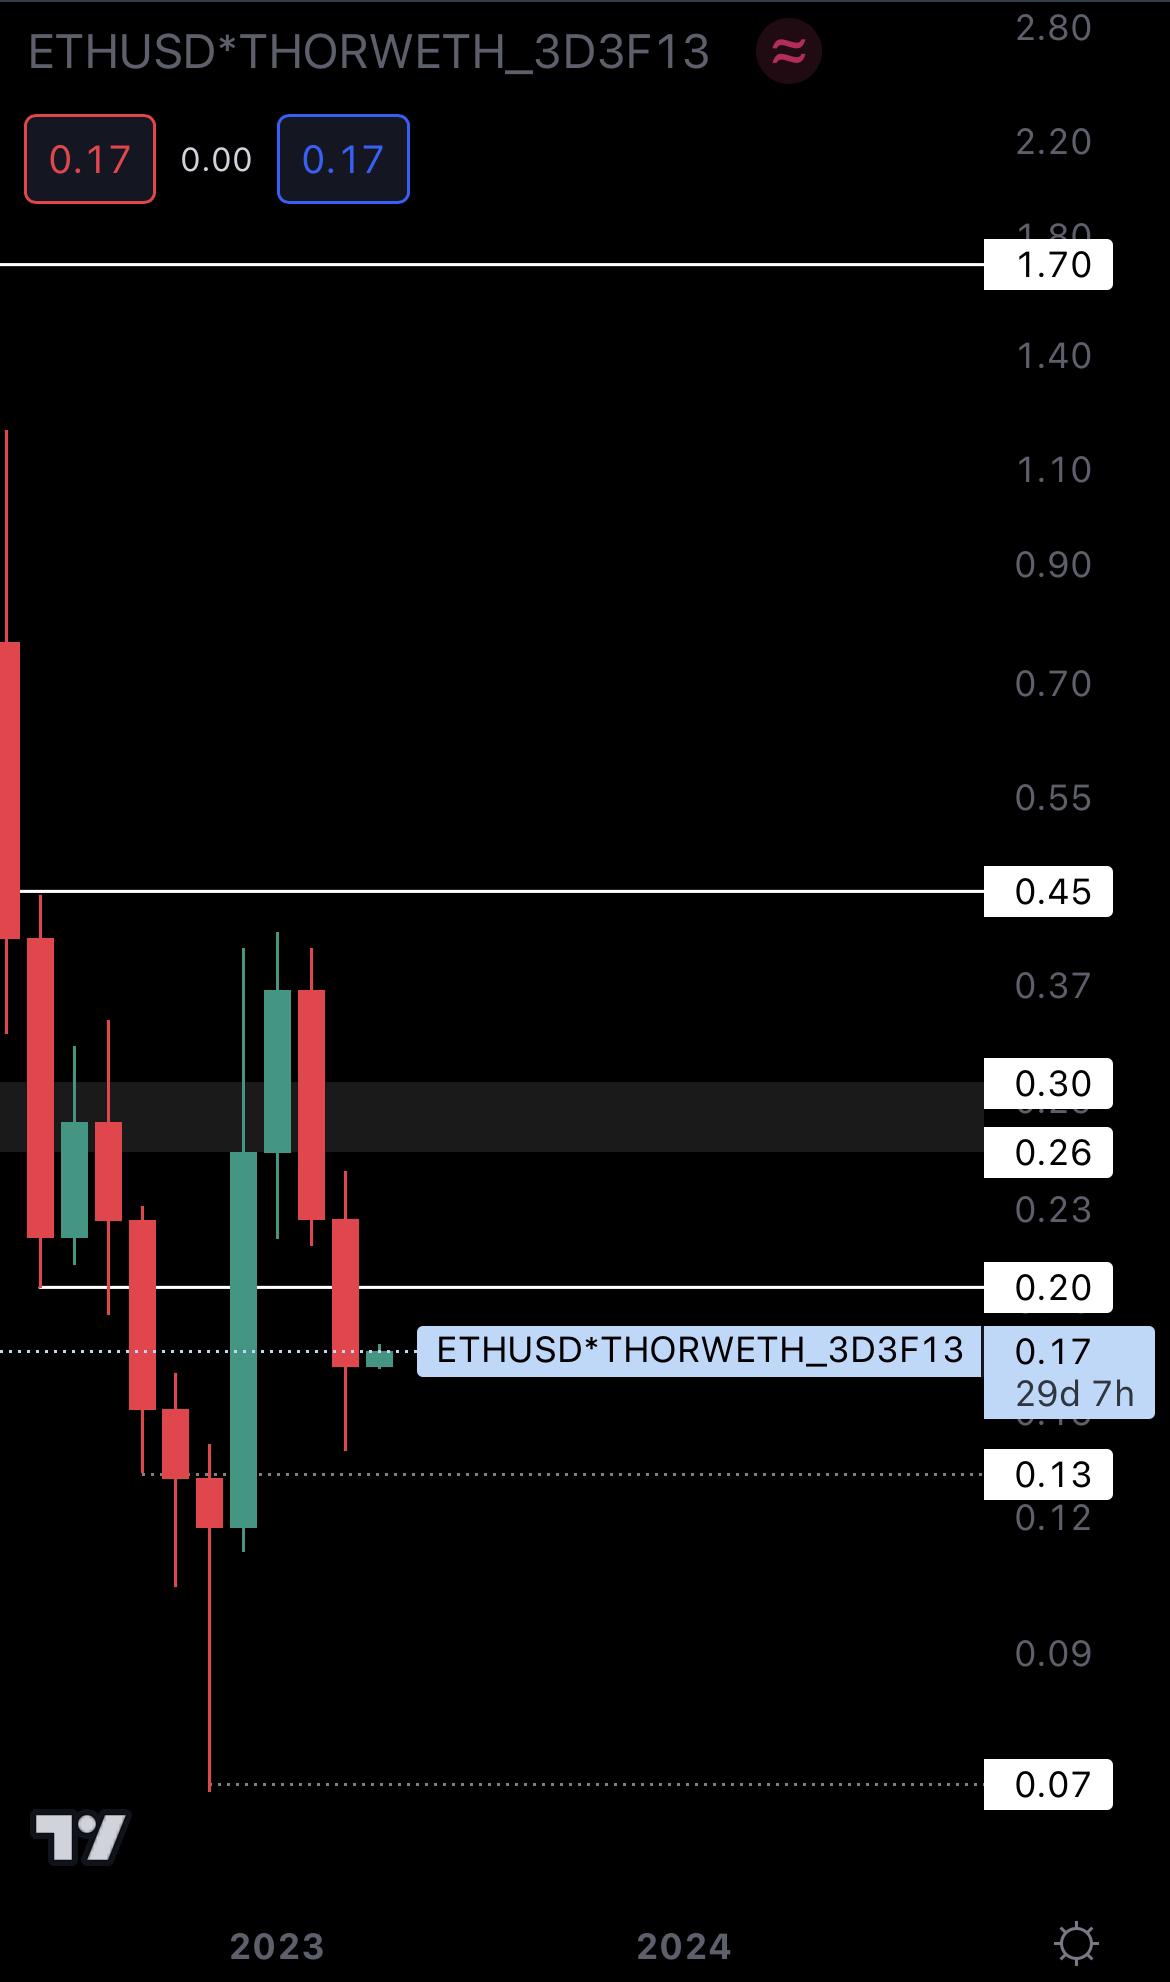
The last two months have been full-on bearish for THOR, so we should expect no less in Q2. From a technical standpoint, closing March under $0.20 puts THOR on track for $0.13.
OP | Optimism (Weekly)
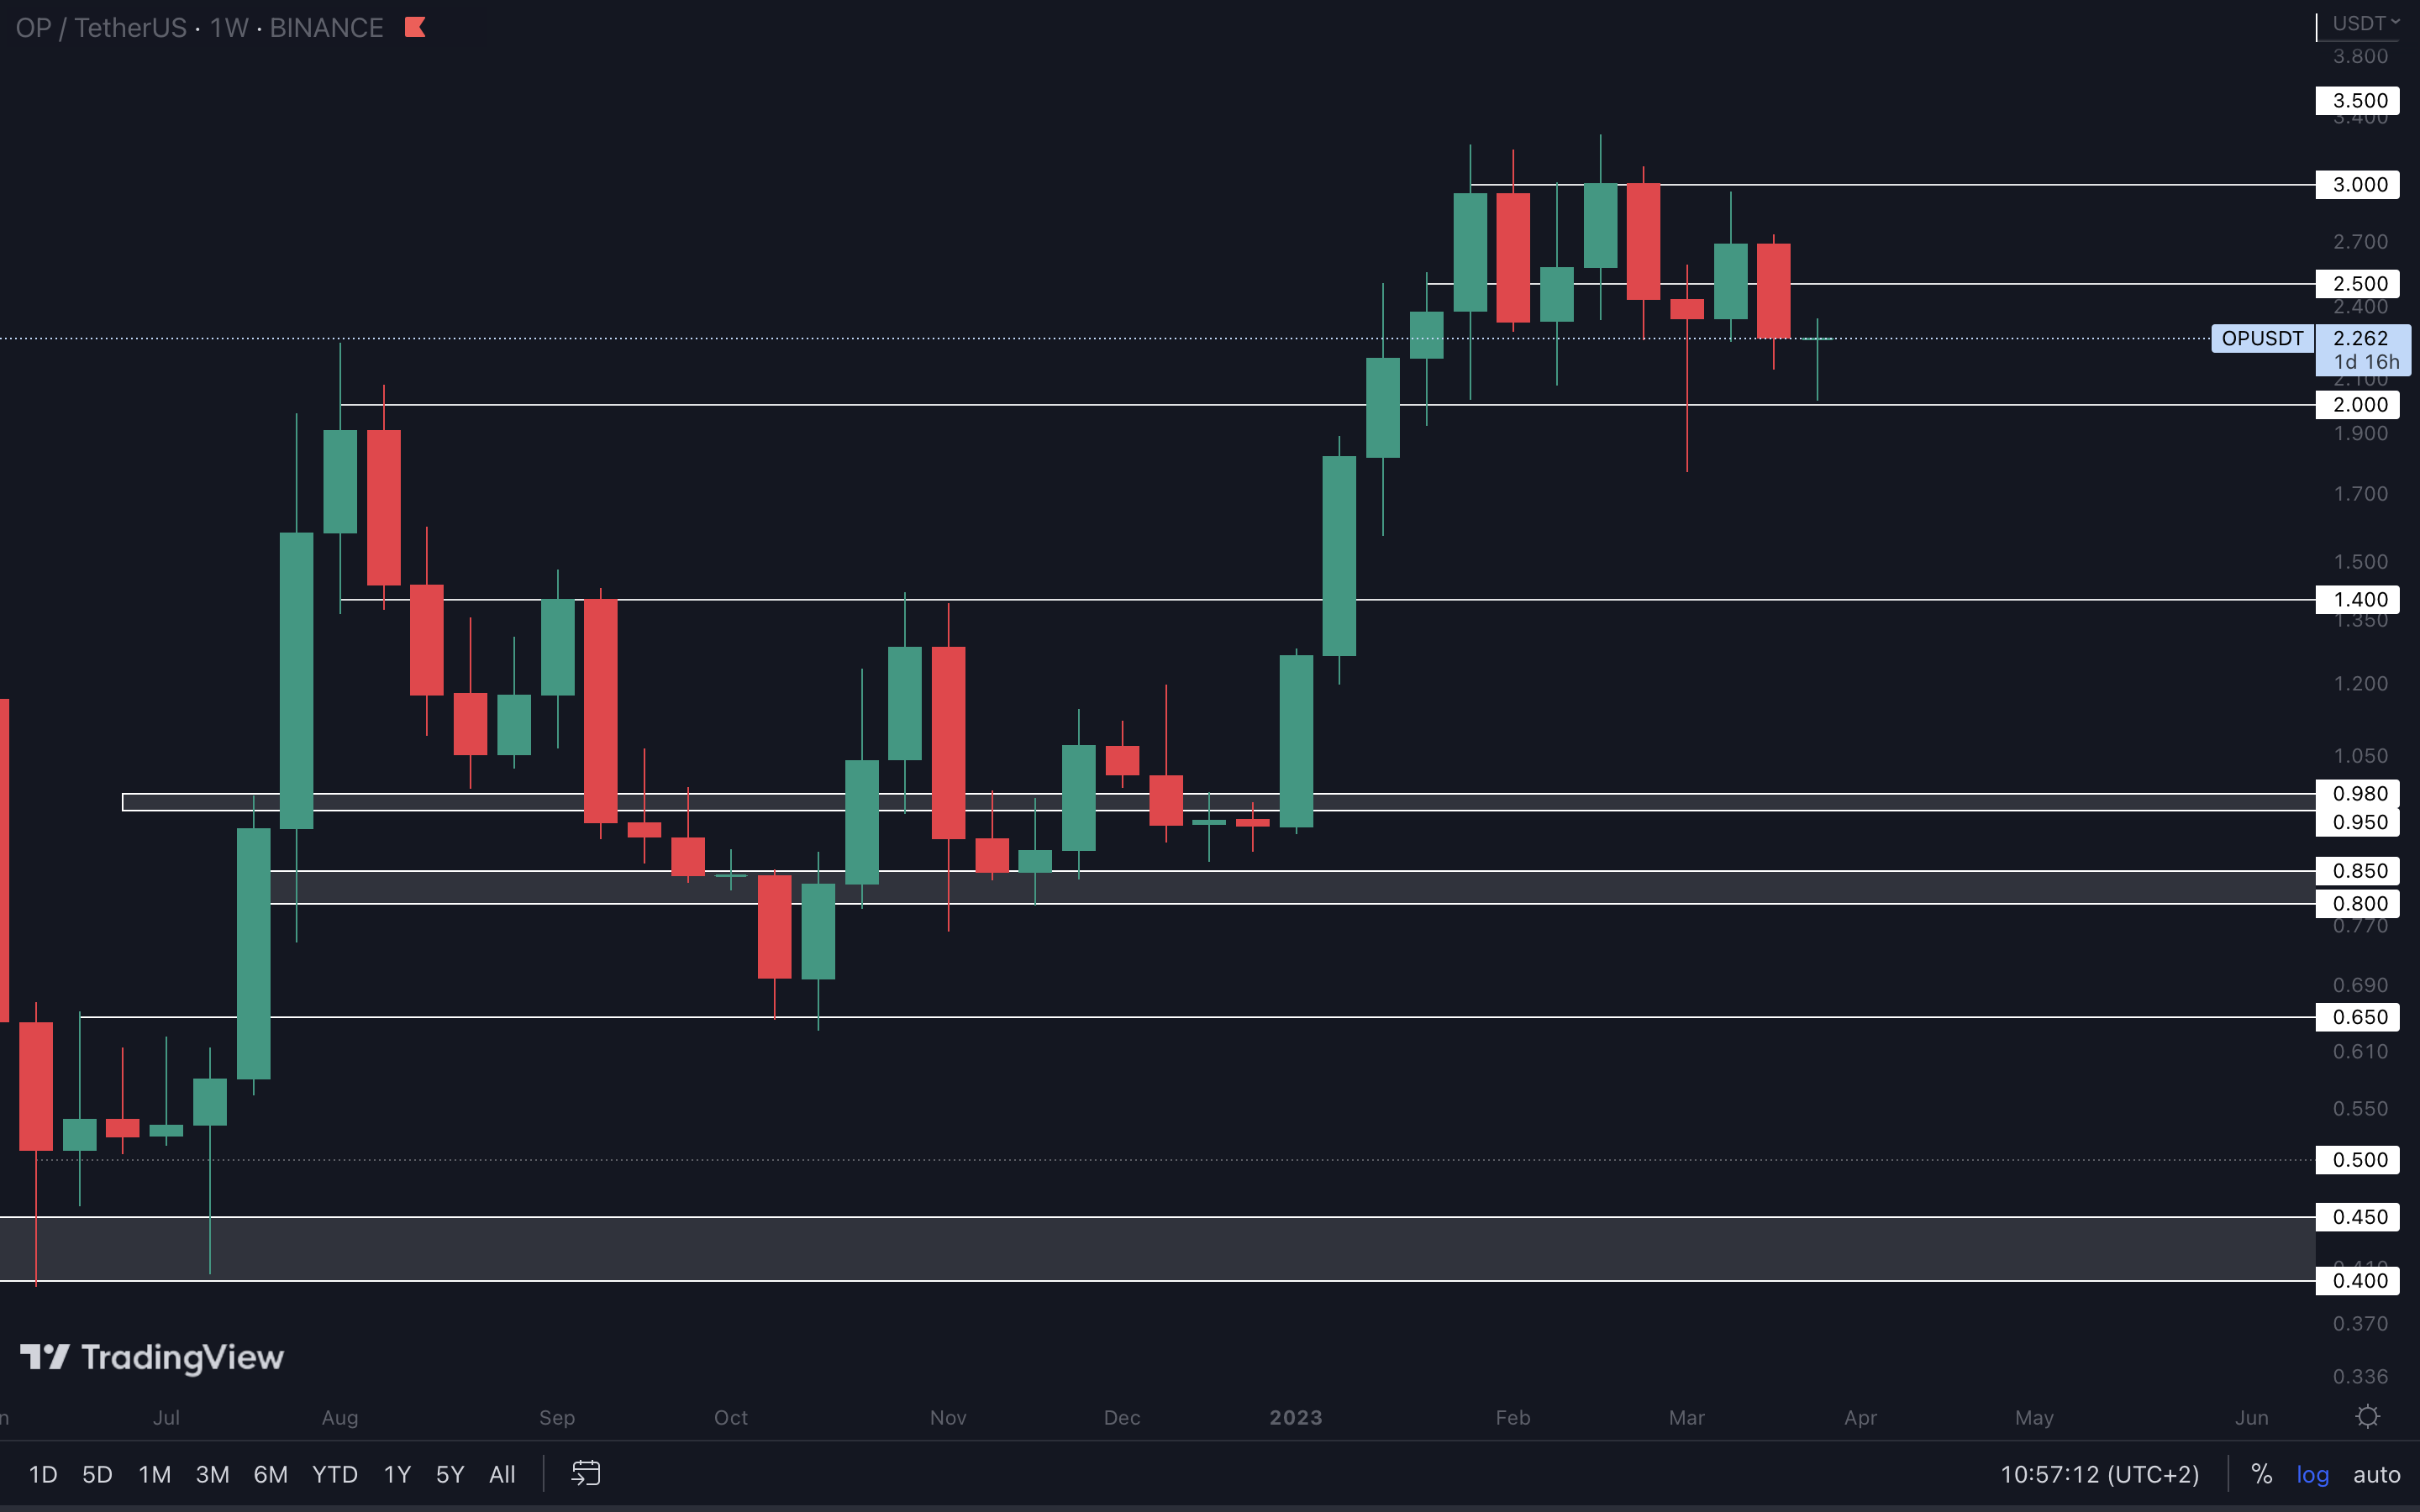
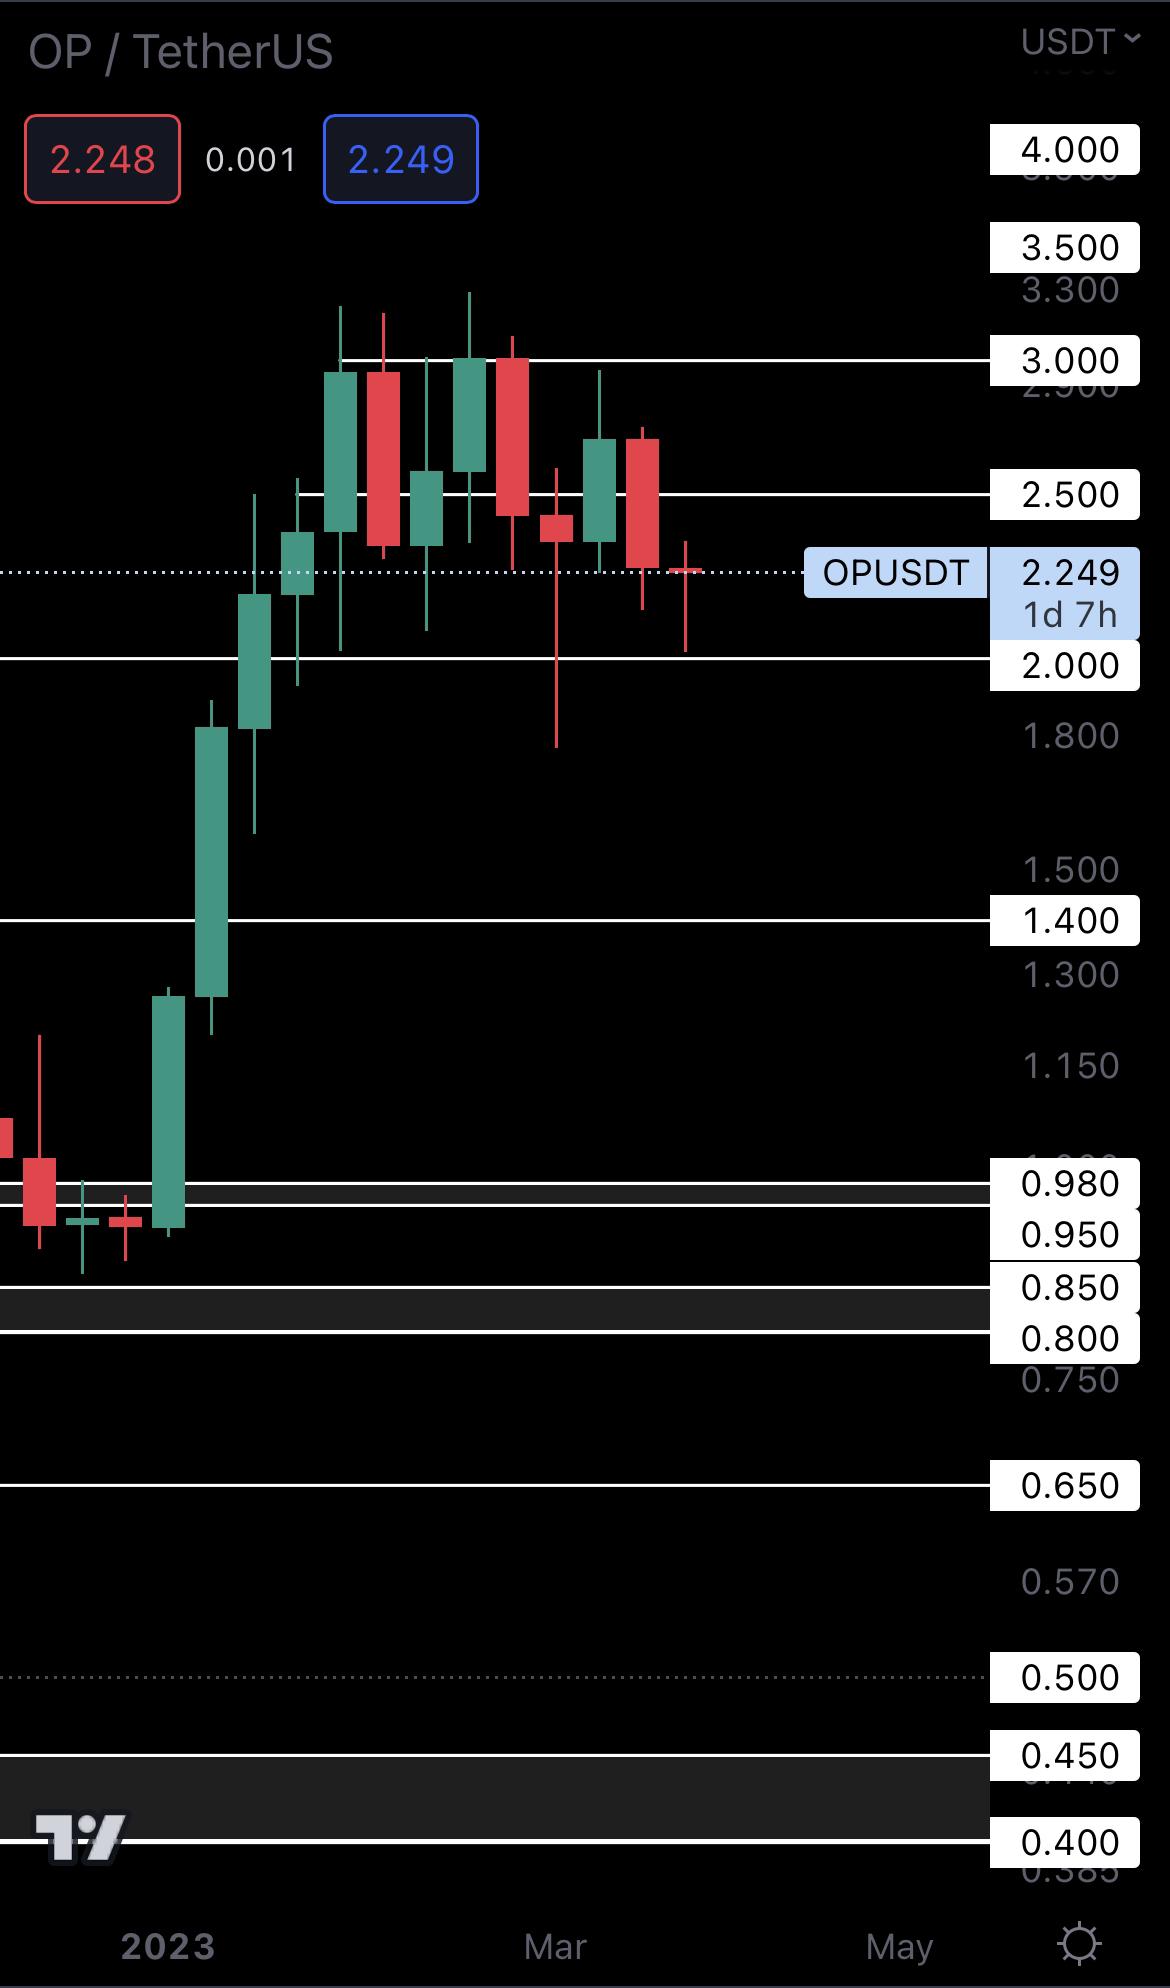
OP has been ranging between $3 and $2 for a few weeks. Something might be brewing here… We know OP is a volatile asset, and volatility isn’t a bad thing if you can use it to your advantage. The more volatile an asset is, the more opportunities will appear, and we believe OP will have plenty during Q2. However, the asset will continue to range between $3 and $2 for the time being, so our priority is waiting for a weekly closure above or under either one of these levels. As soon as that happens, we can start looking for entries.
Cryptonary’s take
We don’t believe the crypto market will give us the same returns in Q2 as it did during Q1, but the technicals suggest we are going to see some upside, and that’s always welcomed. The market is likely going to experience a pullback in April, range around support, and then continue the rally to $32,000 and above. If any changes occur, we will keep you updated so you can stay one step ahead of the market!Action points:
- Secure some profits and prepare to get in back lower. If that opportunity does not come, you’ll have reduced your exposure in the market, and that takes away unwanted risk.
- Wait before jumping back into the market, because it can go down in the short-term. Buying now could result in losses.
Recommended from Cryptonary


