Save 23% ($351) & Get a Free 1-1 Call with our Team ⏰ : 0d 2h 59m 44s
Will ETH pivot from a bullish breakout to a bearish retreat?
Ethereum's hand is being put to the test. With its price teetering at the edge of a critical resistance zone, every move could lead to a different path – a surge toward the coveted $2,000+ levels or a tumble back to the drawing board at $1,800. But what are the charts saying?

TLDR
- Ethereum is currently testing a critical resistance zone between $1,900 and $1,933.
- Recent breakthroughs above the $1,853 resistance mark a notable move.
- High open interest and overbought RSI point to the possibility of a correction.
- Despite the risks, we consider dips below $1,800 as attractive long-term entry points.
Disclaimer: Not financial or investment advice. You are responsible for any capital-related decisions you make, and only you are accountable for the results. “One Glance” by Cryptonary sometimes uses the RR trading tool to help you quickly understand our analysis. They are not signals, and they are not financial advice.
Macro analysis
The macro context follows through to all other assets that essentially trade with a high correlation to other risk assets.Technical analysis
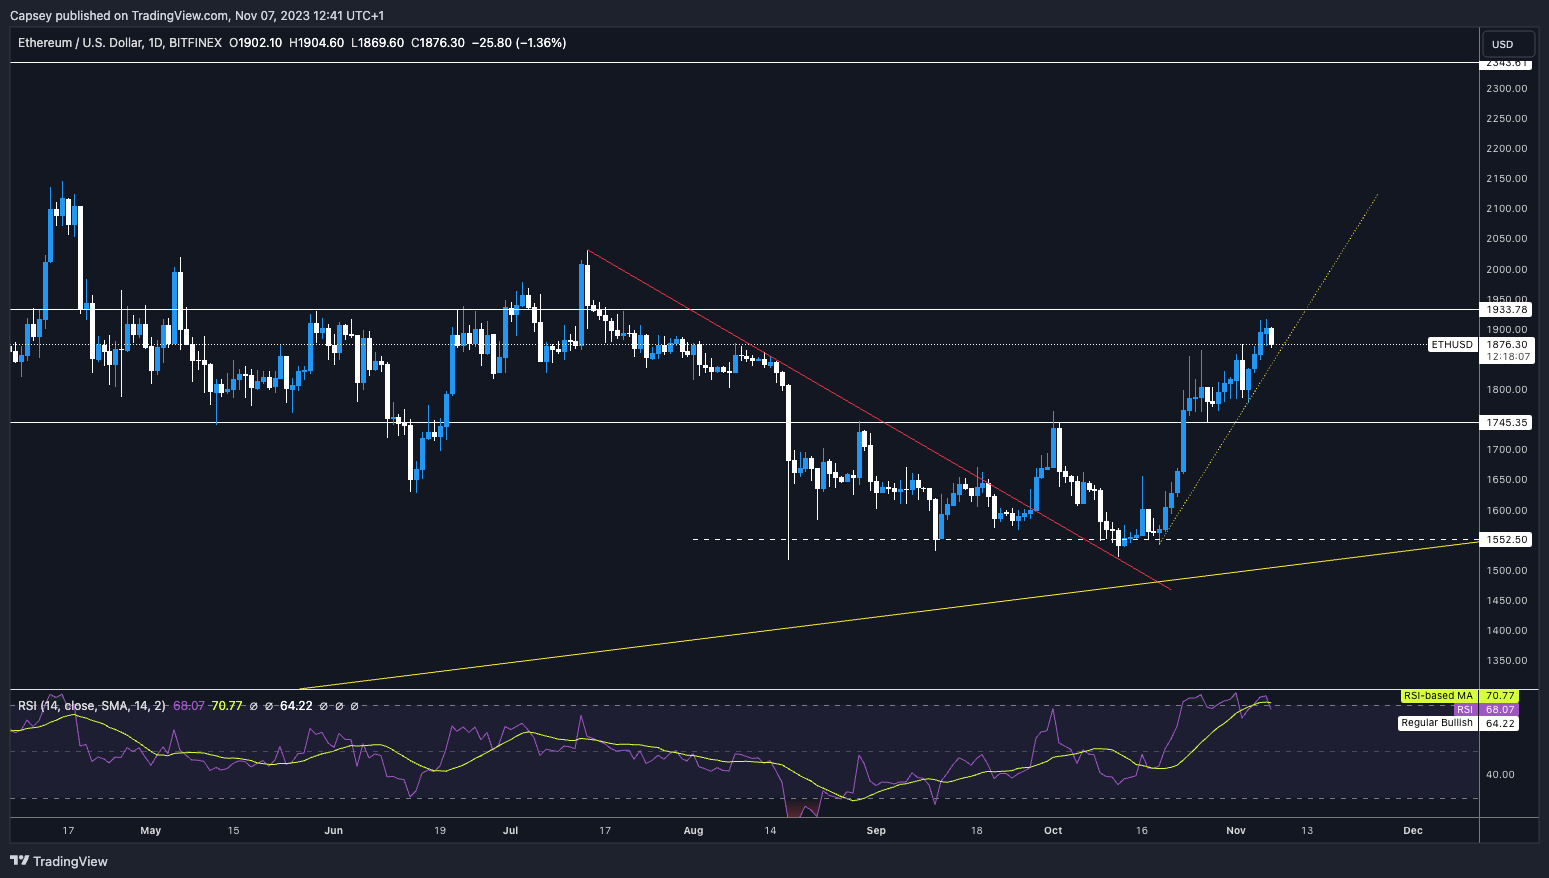
Regarding technical analysis, ETH is in a local uptrend. Today, price has come under some pressure, with ETH moving into the resistance area of $1,900 to $1,933 yesterday. The $1,933 is the next key horizontal resistance ETH needs to get above for further upside price action.Focusing on the 3D chart, we see that ETH has cleared the $1,853 horizontal resistance for the first time. The next resistance is at $1,933. A convincing break above this level and ETH will be primed to move up to $2,120 and then $2,340. However, it’s important that ETH holds the uptrend line, or a break beneath it could see $1,853 retested. A break below that would open the door for a move into $1,800.
ETH 1D
Market mechanics
The open interest for ETH remains at monthly highs - quite a lot of leverage.When we then look at the funding rate, we can see that it’s positive, but it has come off significantly more positive levels - this suggests that more market participants have ape’d into shorts here.
Alongside this, the RSI remains overbought, having put bearish divergences in on the daily, another suggestion that a pullback may be on the cards.
Cryptonary’s take
The above suggests that a pullback is on the cards unless shorts continue to ape in and a short squeeze ensues.We would exercise great caution here, but we would look to DCA into more significant moves lower. Anything sub $1,800 would be fantastic entries for ETH to hold for the long term.
Recommended from Cryptonary


