Save 23% ($351) & Get a Free 1-1 Call with our Team ⏰ : 0d 2h 59m 43s
Will March be boring for crypto? | March 6th
The market continues to throw indecision at us - market structures have been broken, and price actions are becoming choppier by the day. In this week’s report, we dive into the charts to see what we can expect for the rest of March.
Disclaimer: Not financial or investment advice. You are responsible for any capital-related decisions you make, and only you are accountable for the results.
TLDR
- We believe March will be a month of accumulation/consolidation. We’re not expecting extreme returns.
- Both Bitcoin and Ether remain in bullish market structures on the weekly timeframe. Unless that changes, we’re still confident higher prices will follow.
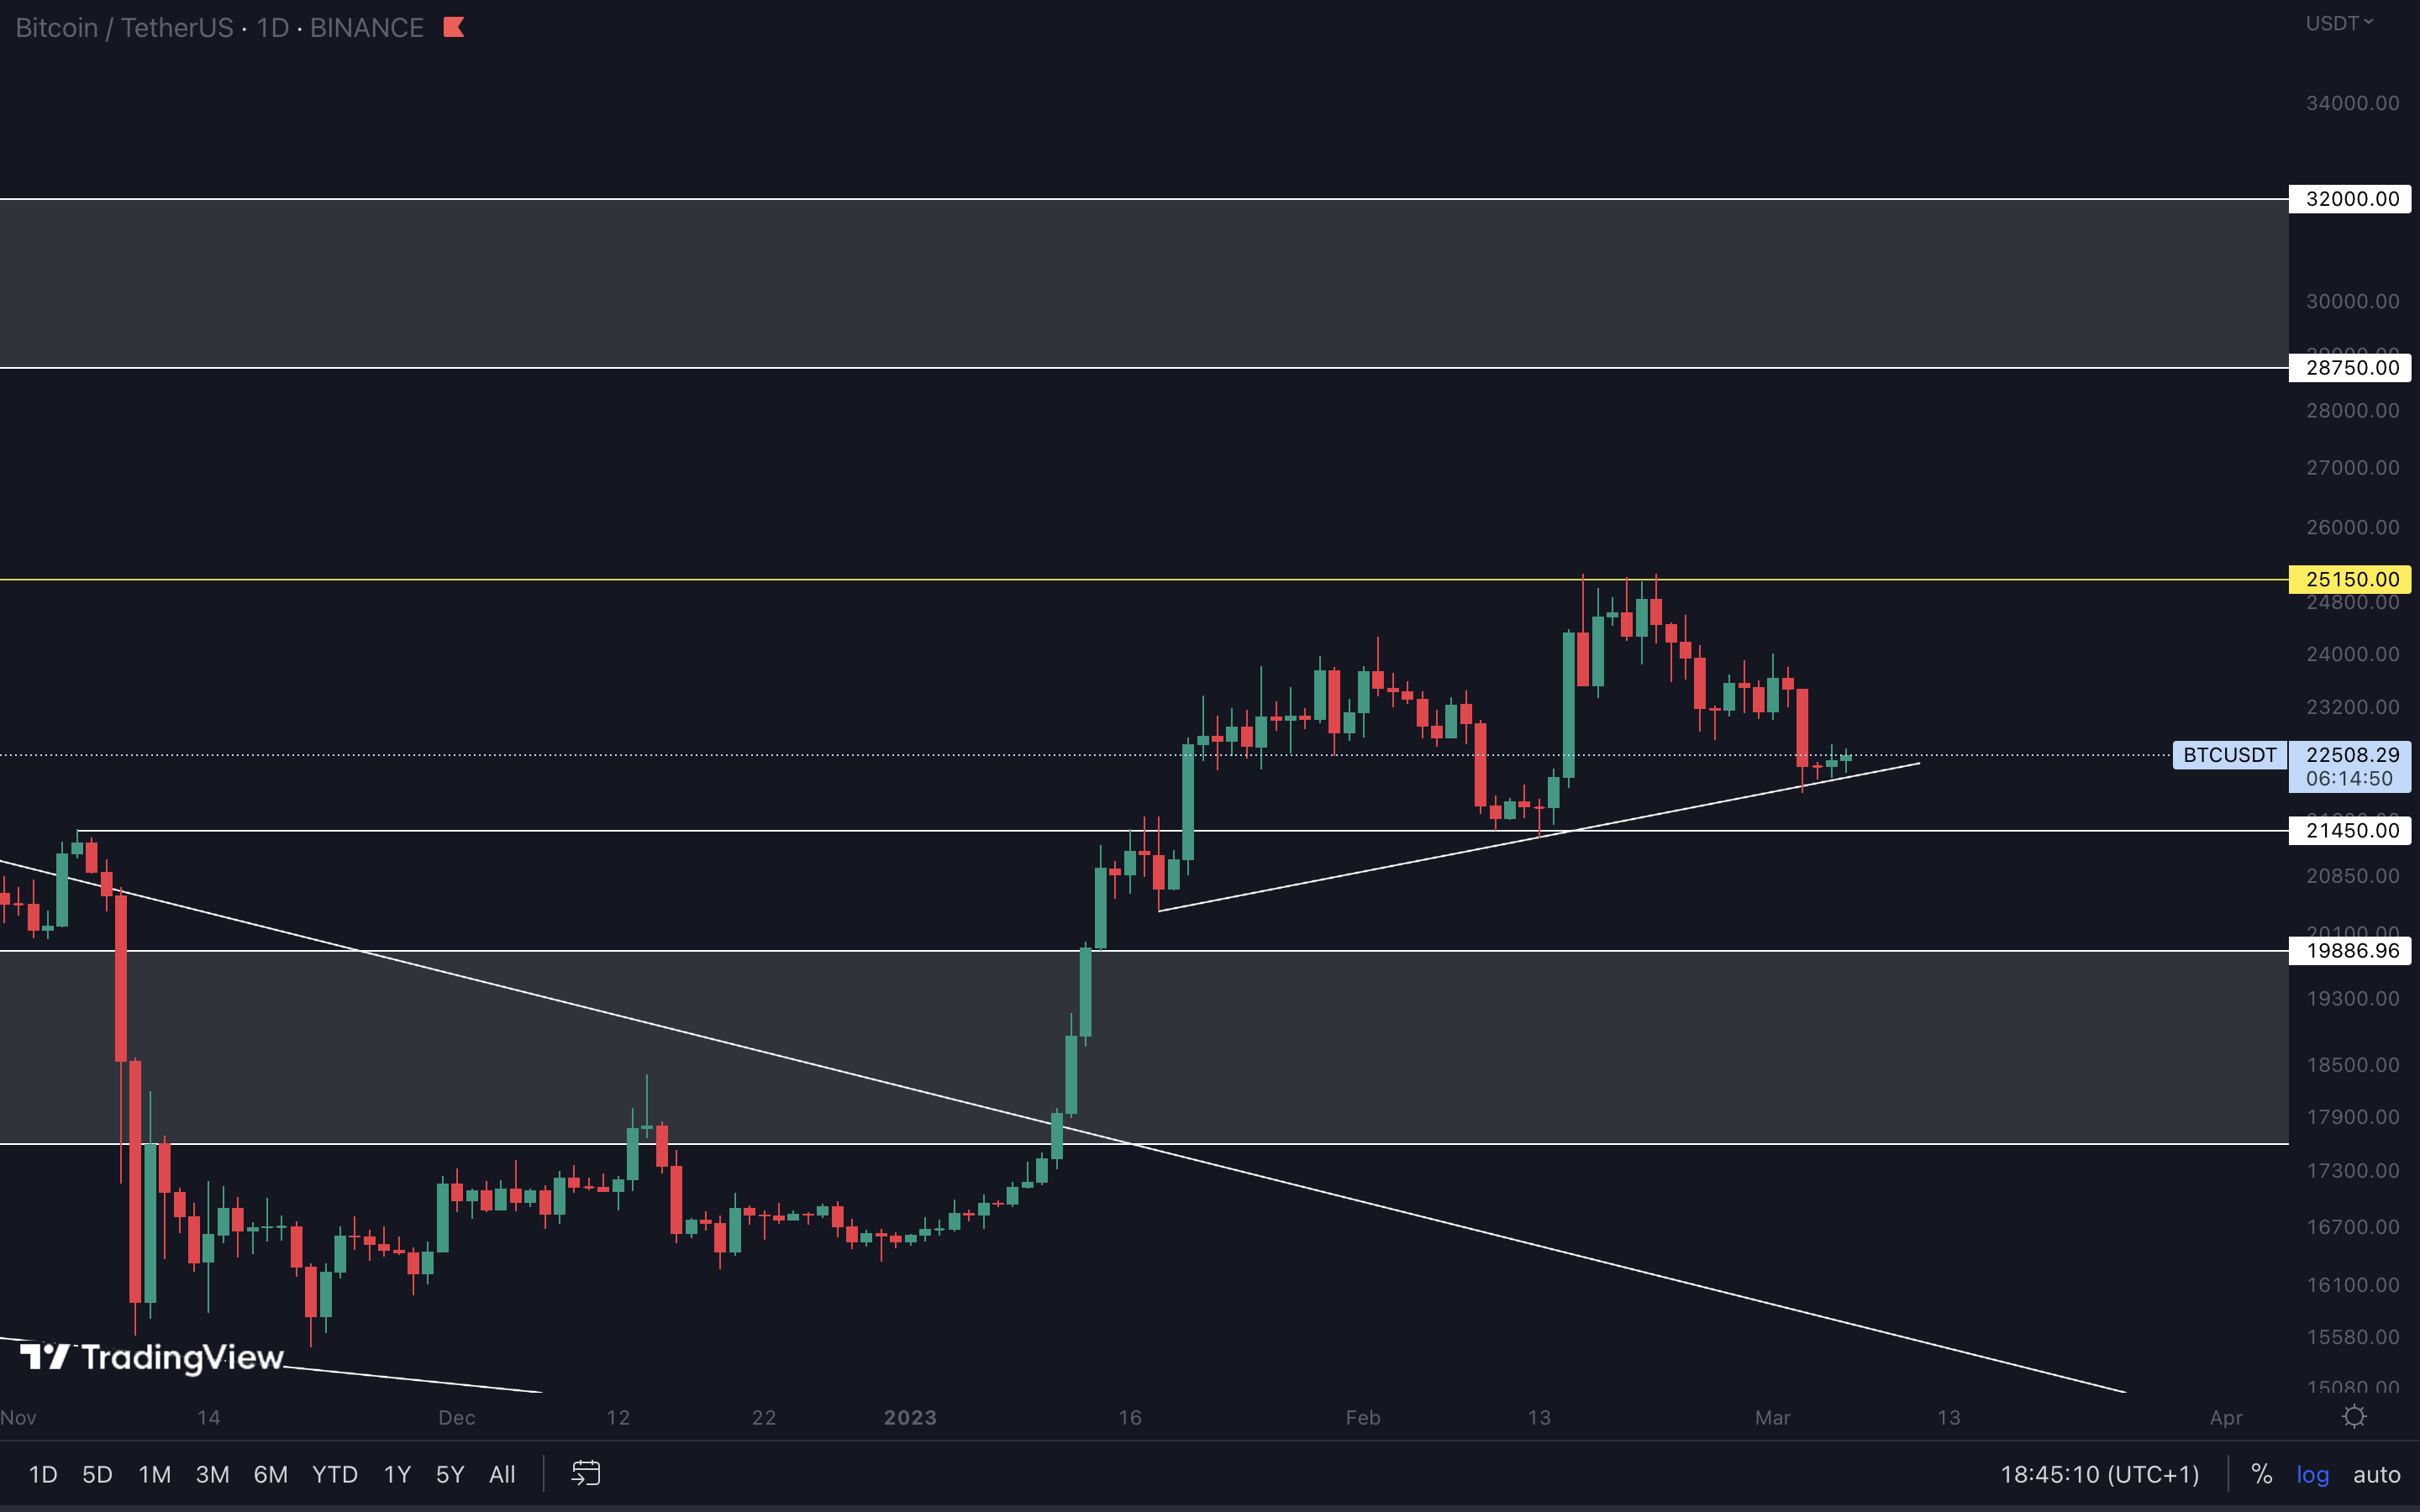
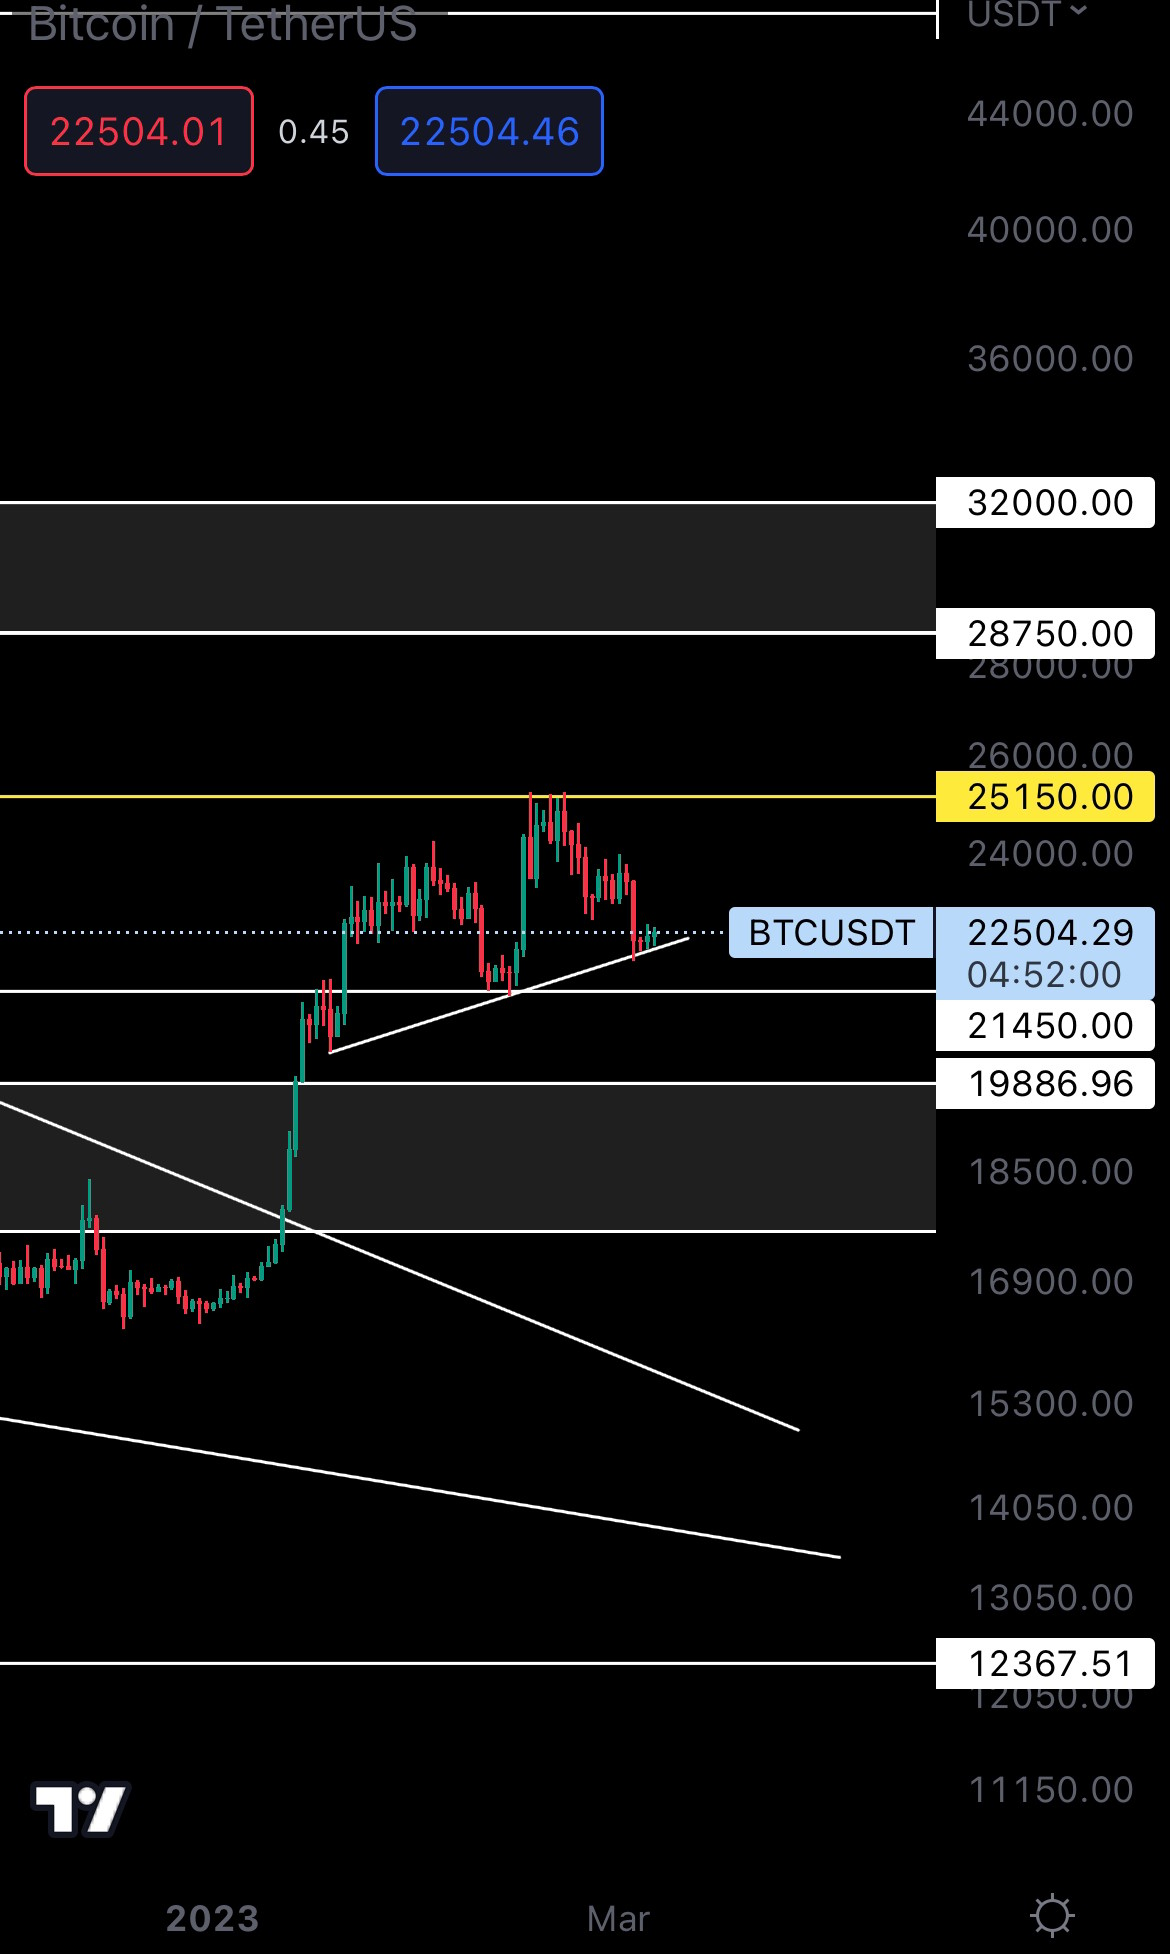
- Bitcoin is at support on the daily timeframe. We may see upside this week.
- RUNE is at support ($1.43). We believe this is a good level to buy from.
- SNX will likely reach our first target of $3.50 this week.
- The triple bottom on DYDX’s weekly timeframe has been invalidated. Until we see a weekly closure back above $2.50, DYDX is at risk of going down.
- HEGIC might form a weekly higher low at its current support area ($0.01590 - $0.01815), and today’s buying pressure backs this up.
Total Market Cap (Weekly)
The Total Market Cap index represents the entire cryptocurrency market valuation. We track this index to understand where the market is now and to predict where it will likely go next.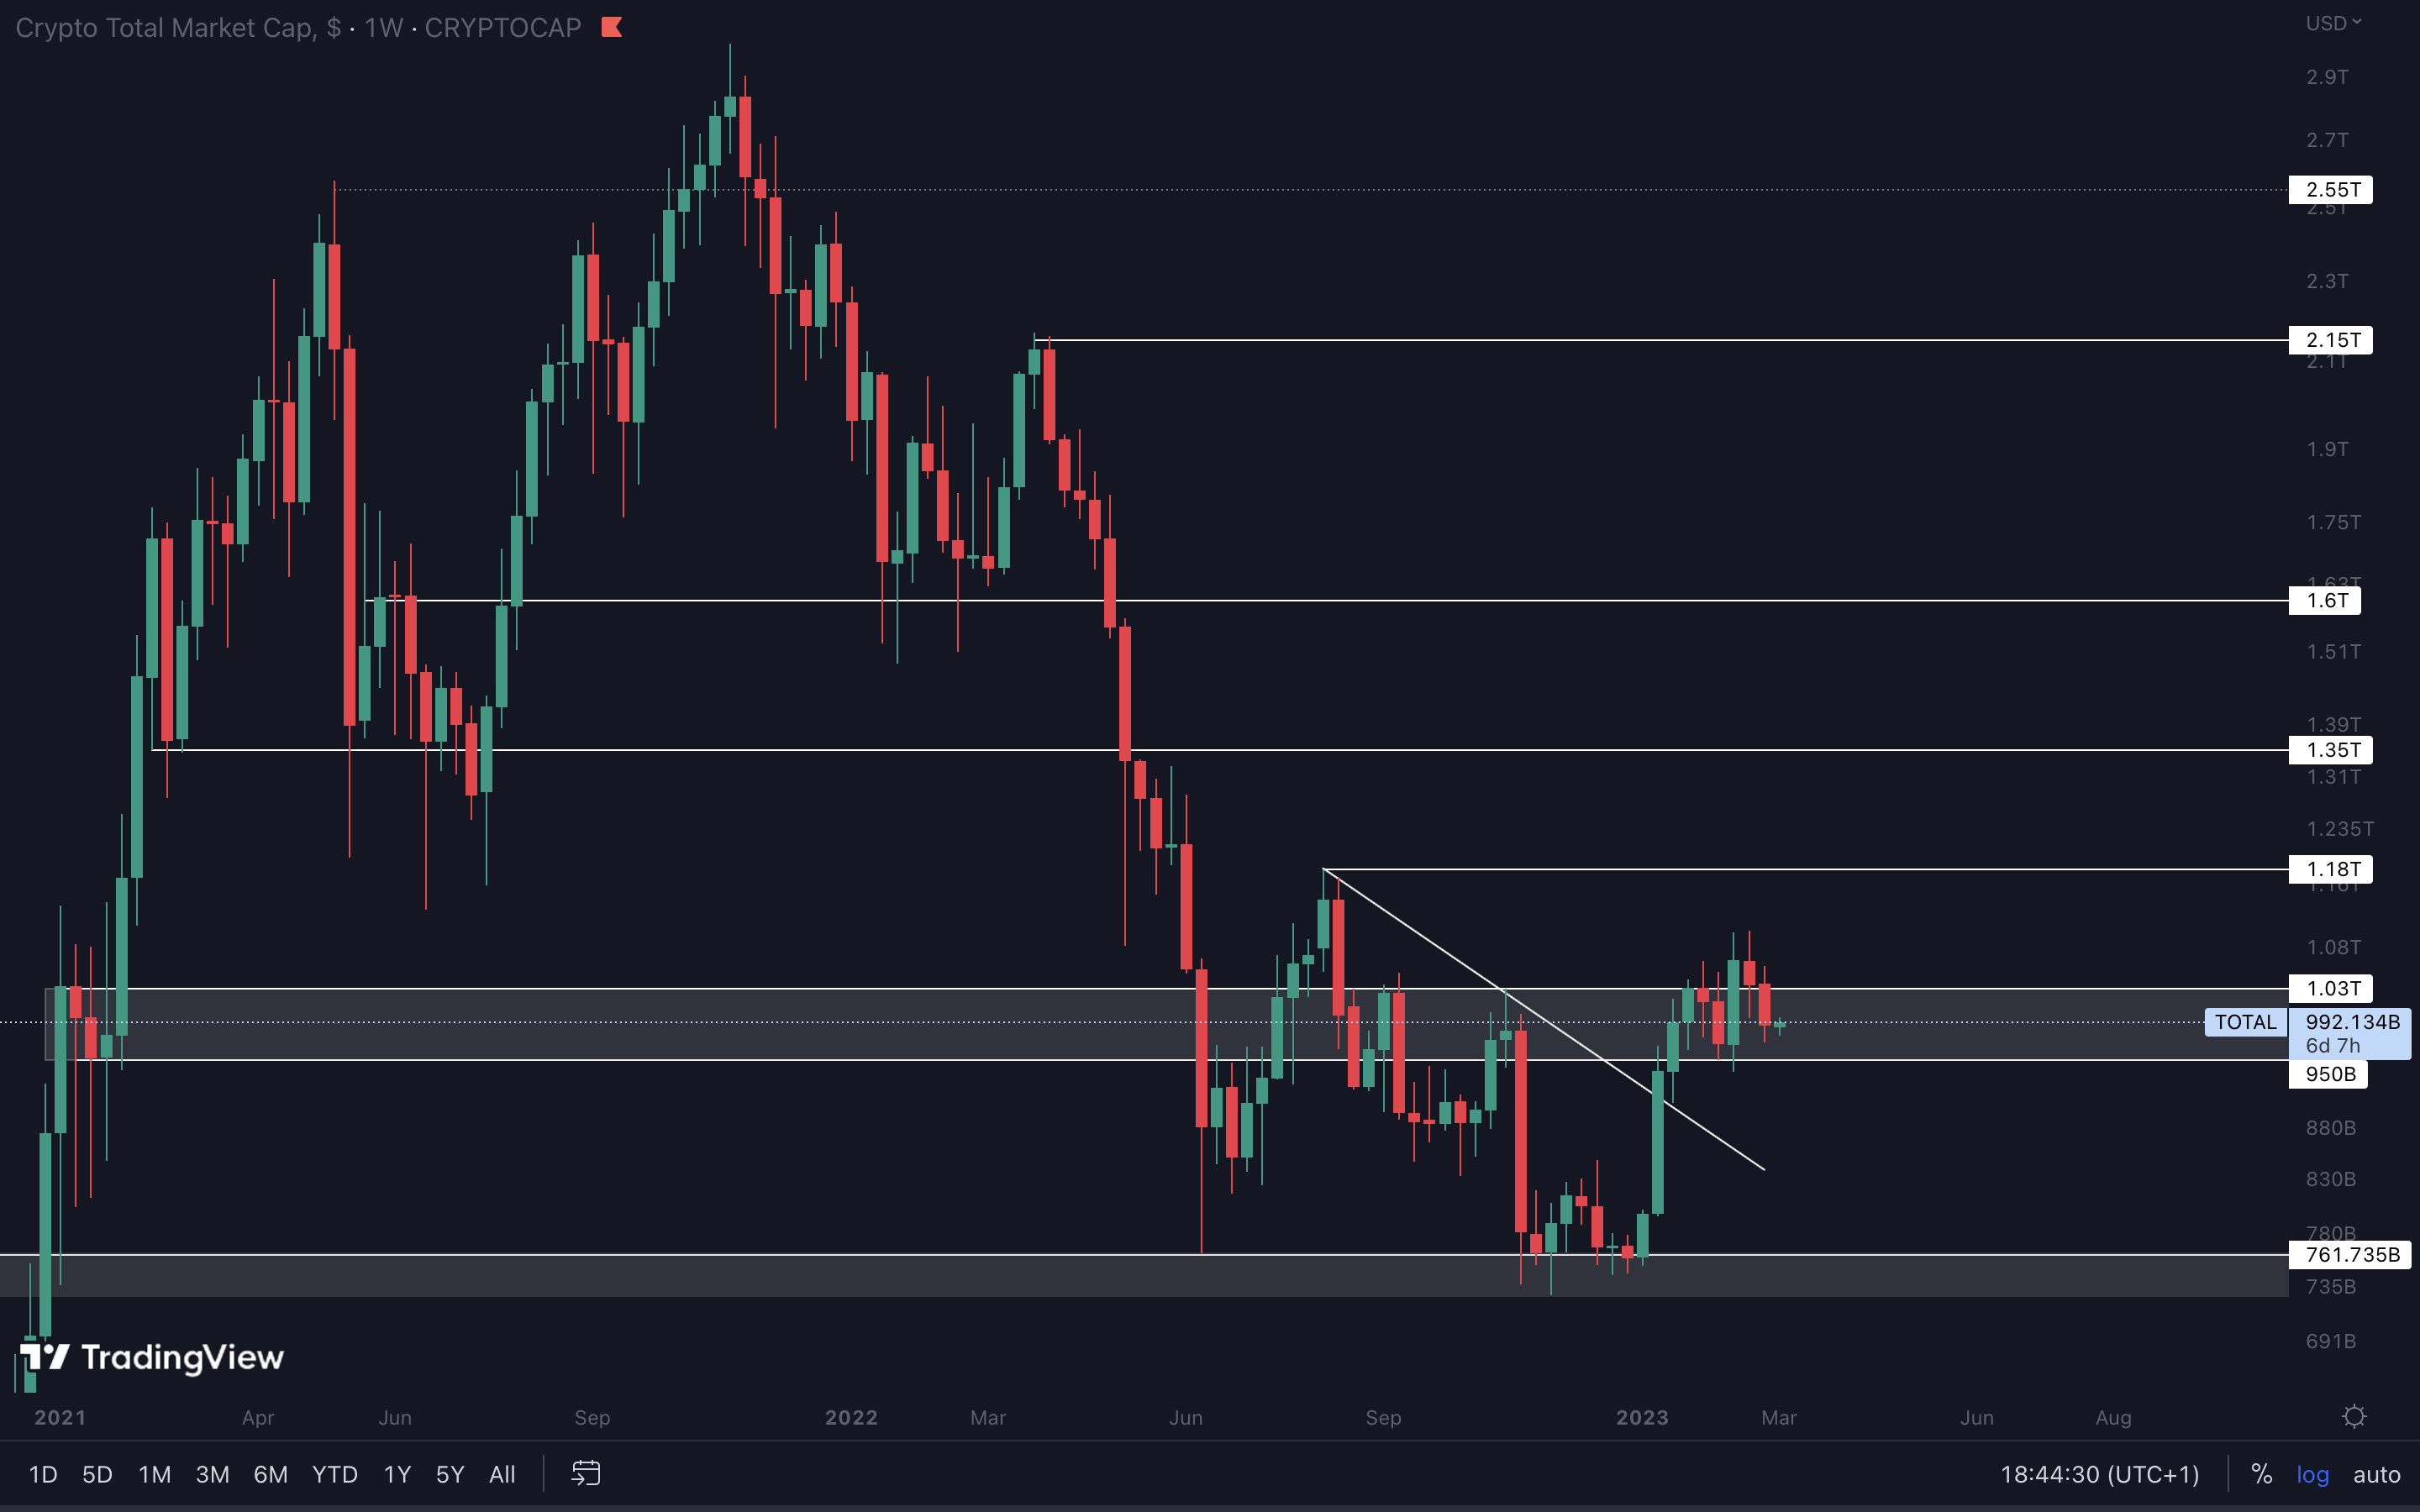
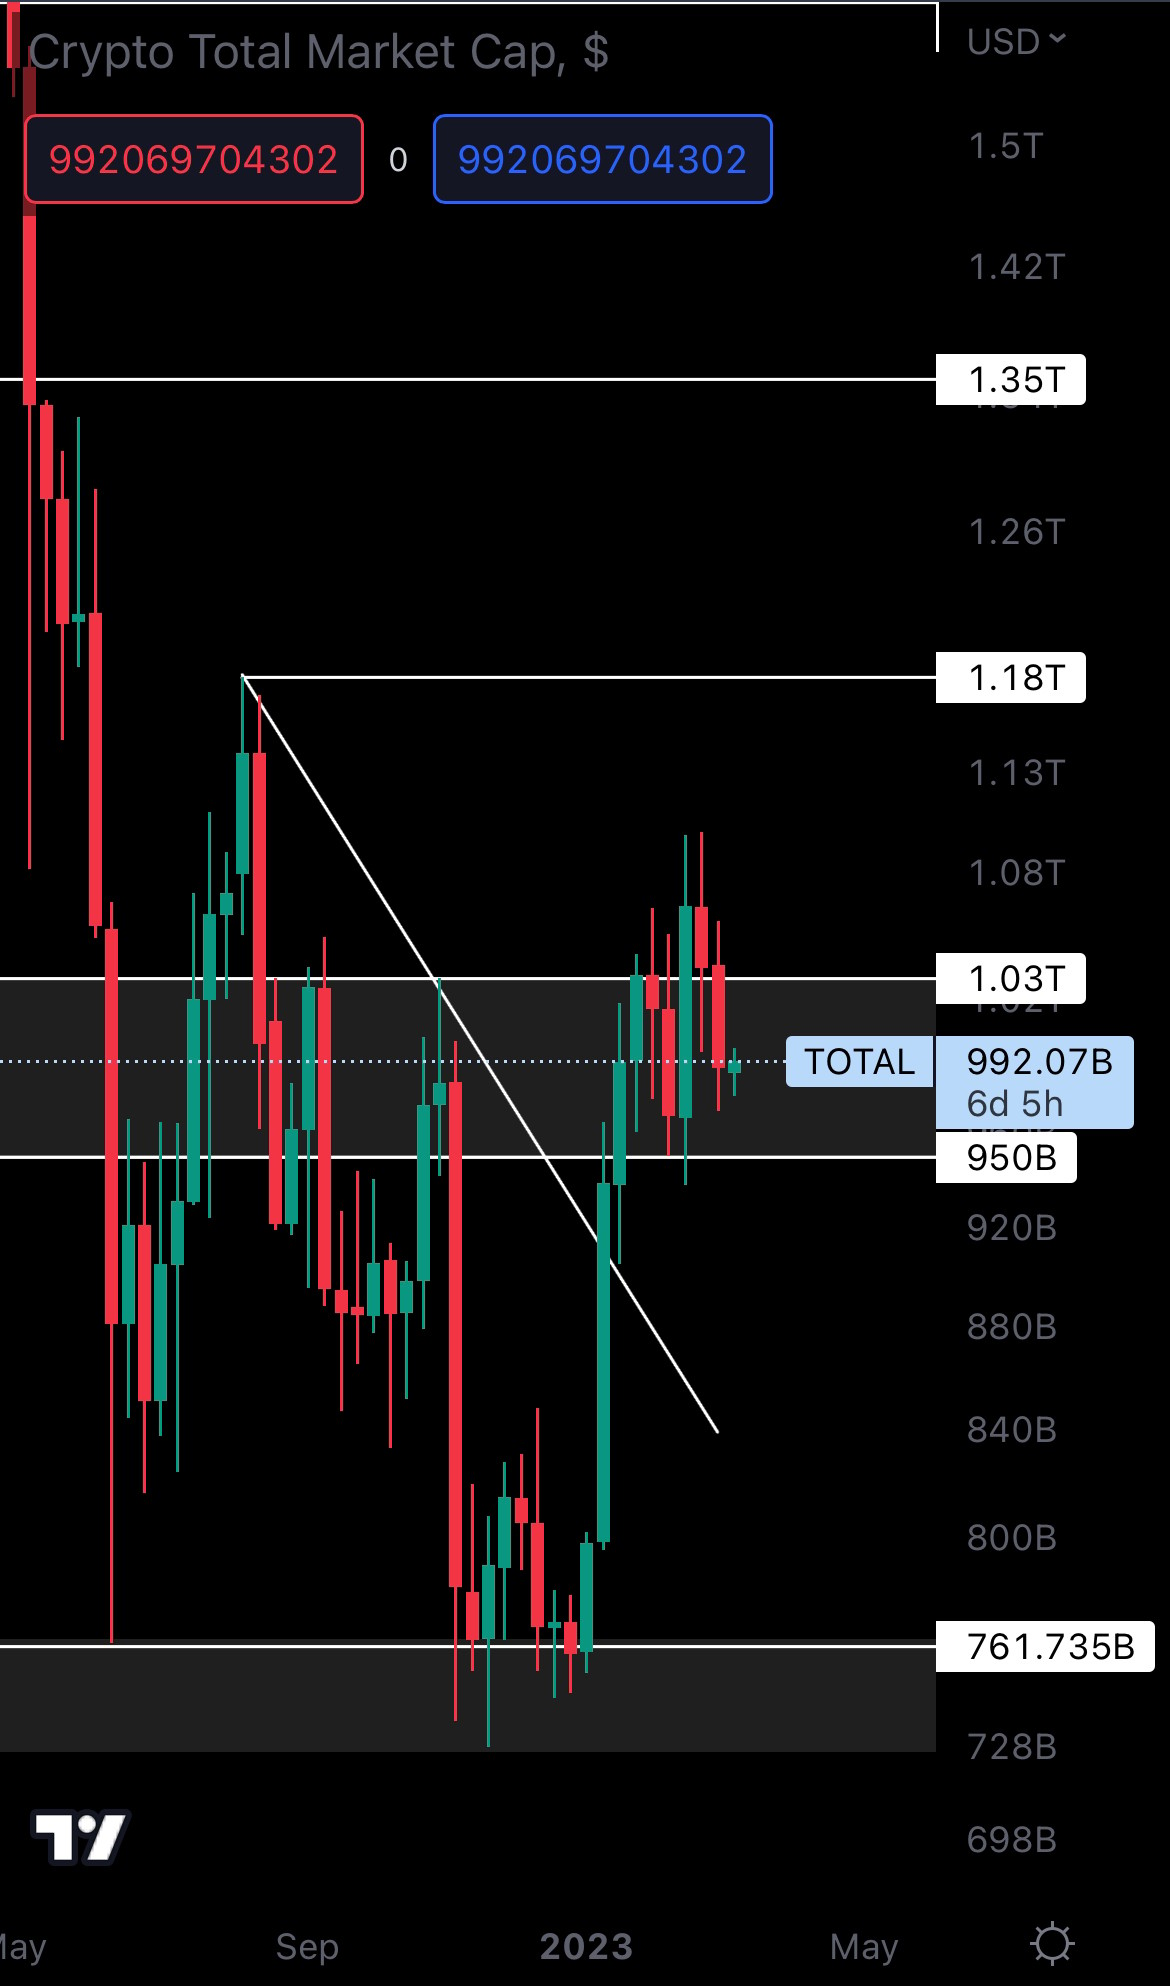
As far as the current price action goes, we’re in a “bullish until bearish” situation. The weekly market structure is bullish and as long as we stay above $950B, the Total Market Cap could still tackle higher prices (such as $1.18T and $1.35T) at some point. It’s very likely that the crypto market will range/consolidate throughout March given how it has performed in previous weeks.
Altcoins Market Cap (Weekly)
The Altcoins Market Cap index represents the entire evaluation of the altcoins market (all coins other than BTC).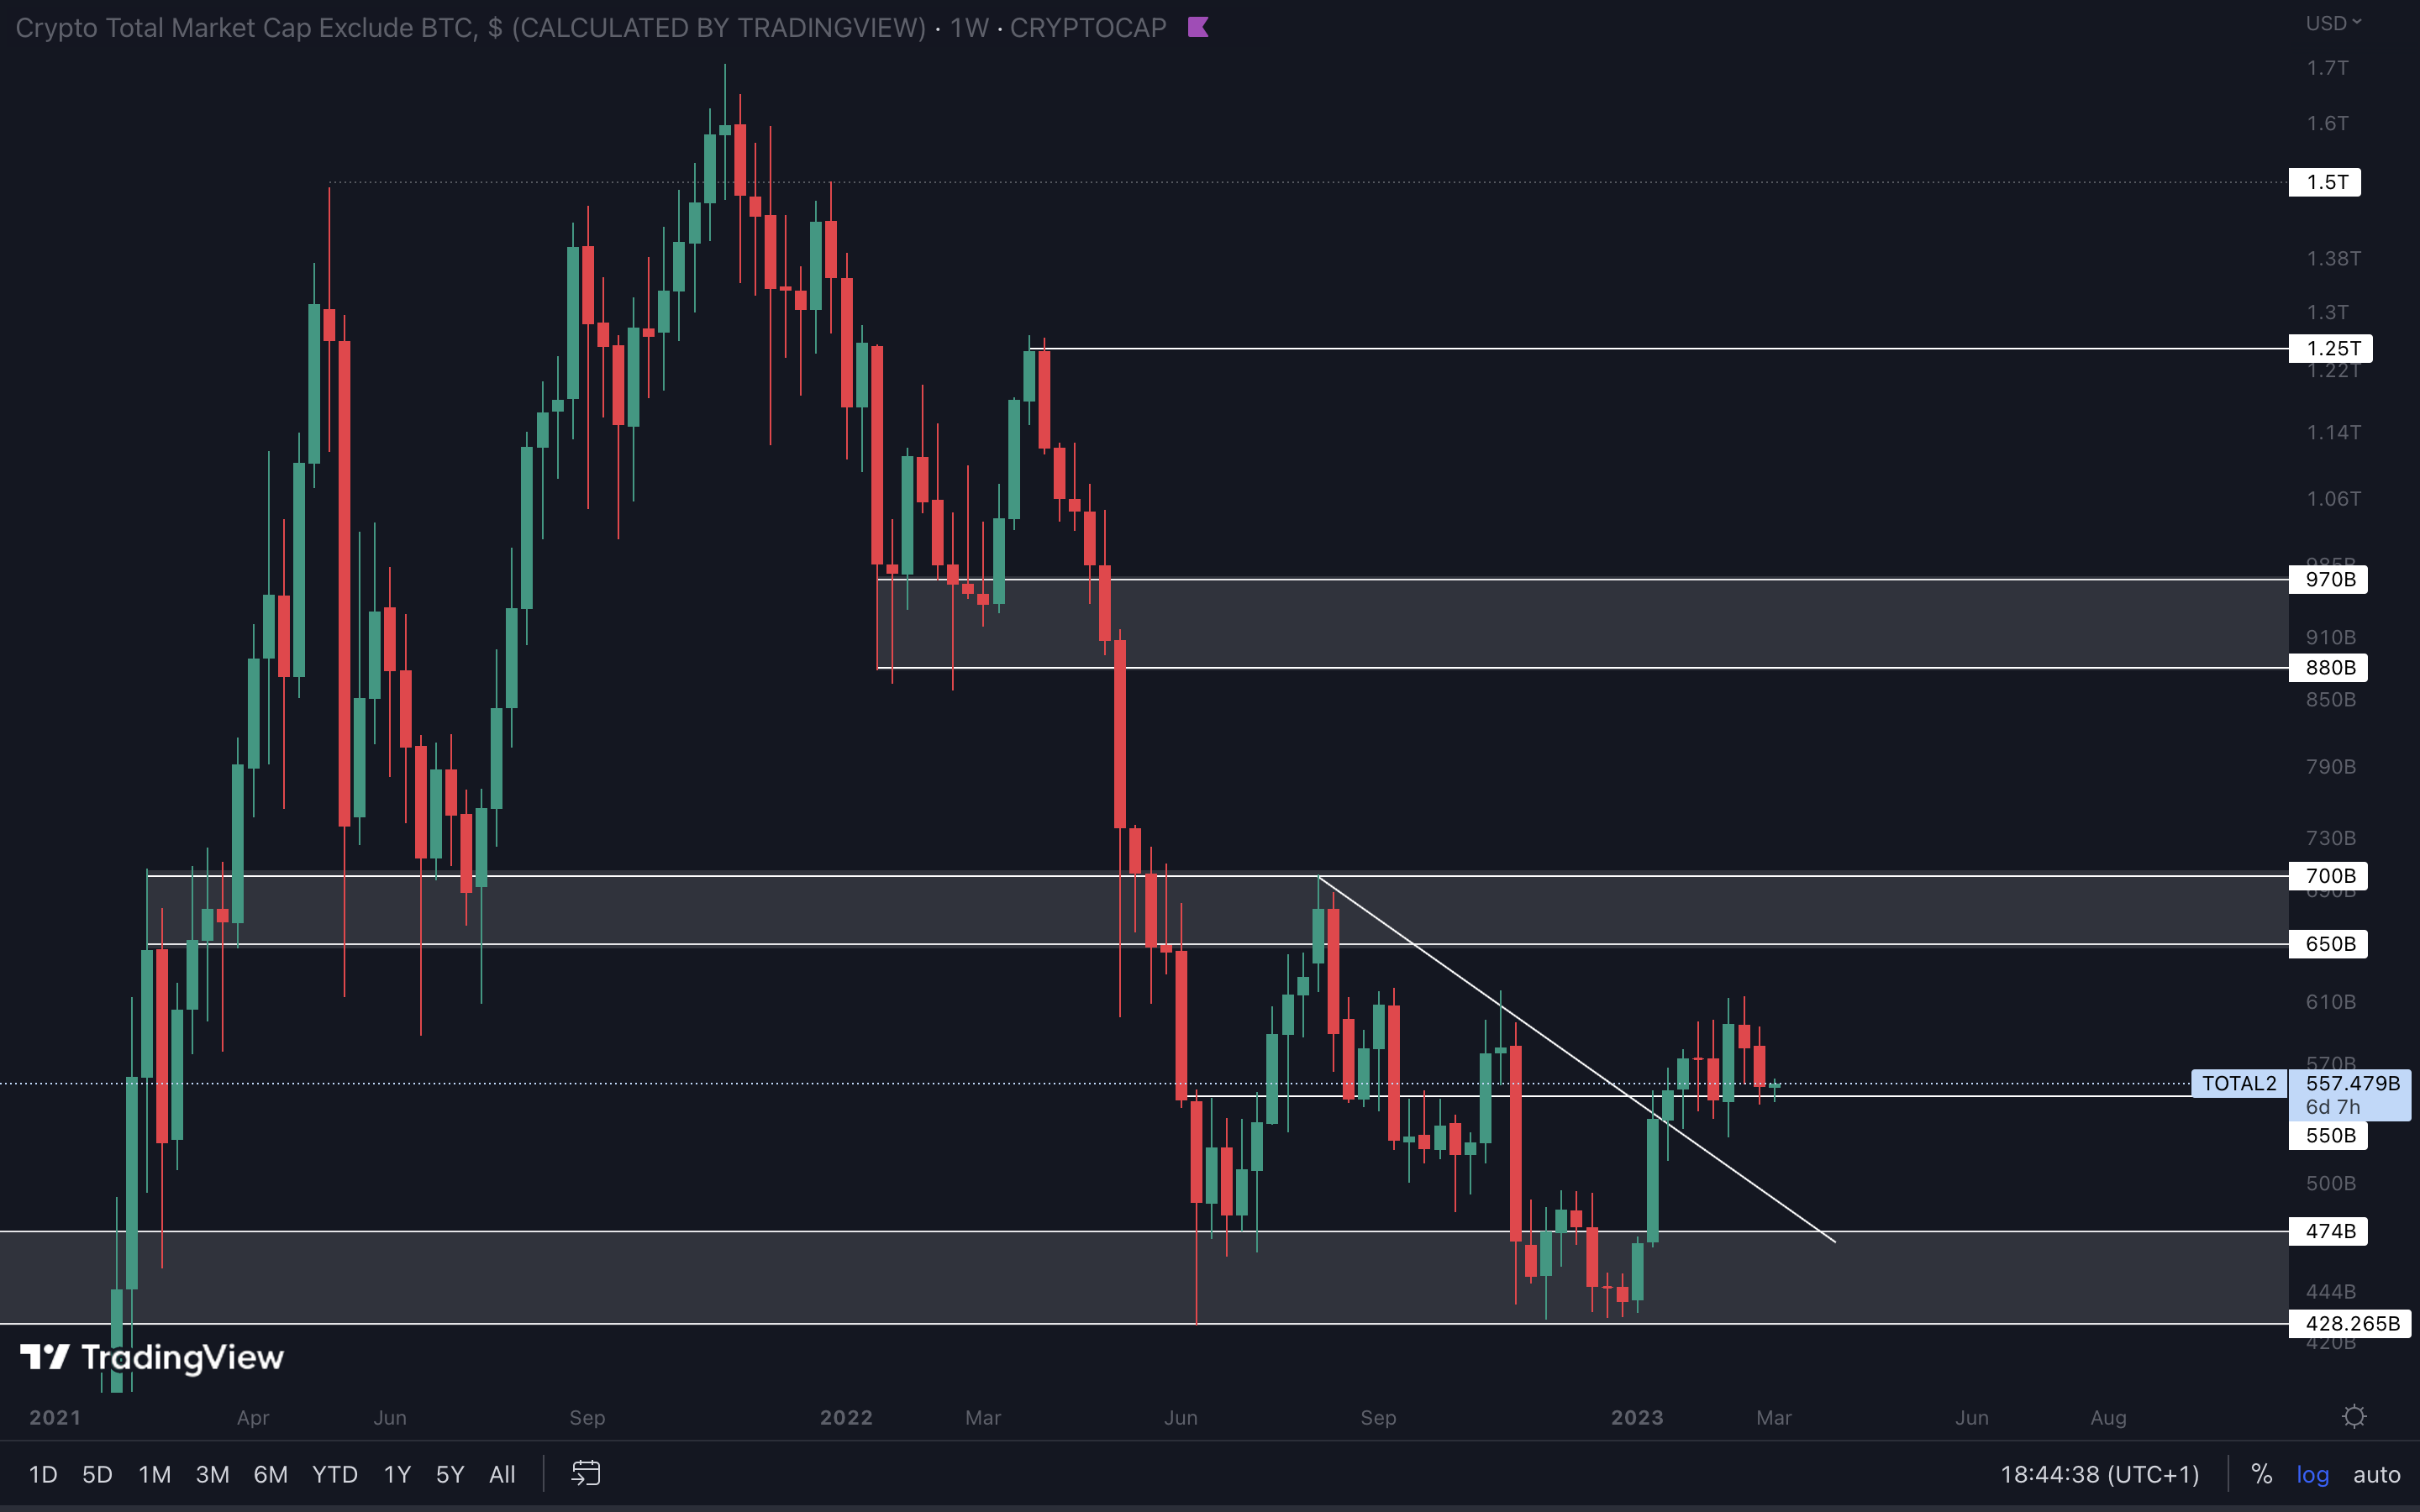
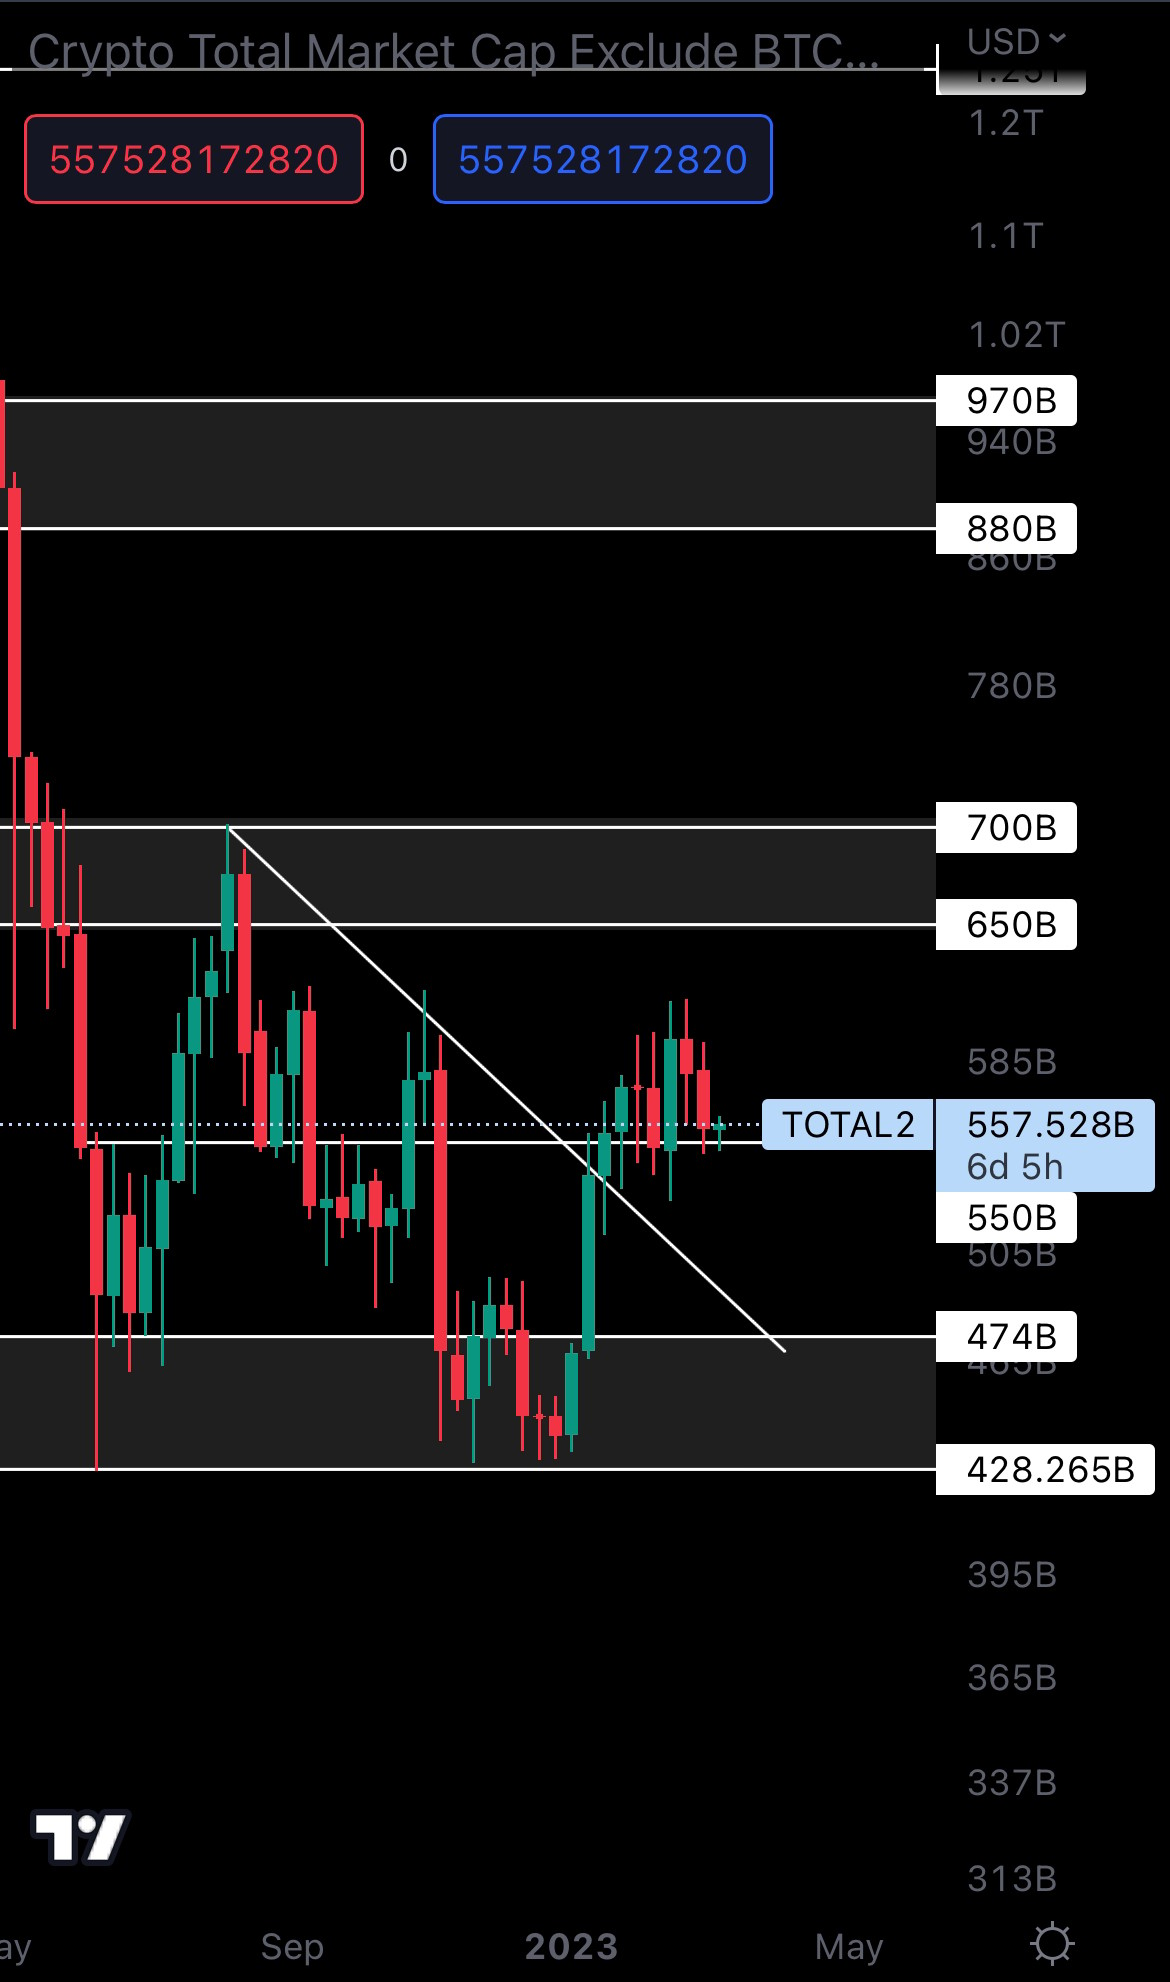
The Altcoins Market Cap is at support ($550B). Our main concern here would be a loss of $550B caused by Bitcoin going down. The Total Market Cap index still has some way to go before it reaches $950B, so this could result in the Altcoins Market Cap index losing $550B as support. If you’ve been tracking the market over the last few days, you’ve probably noticed that altcoins have been dropping rapidly. This would also be a cause of concern if the Altcoins Market Cap index were to lose $550B as support, and it would be ideal to reduce short-term positions or increase them at lower prices if we lose that level.. It all depends on your strategy.
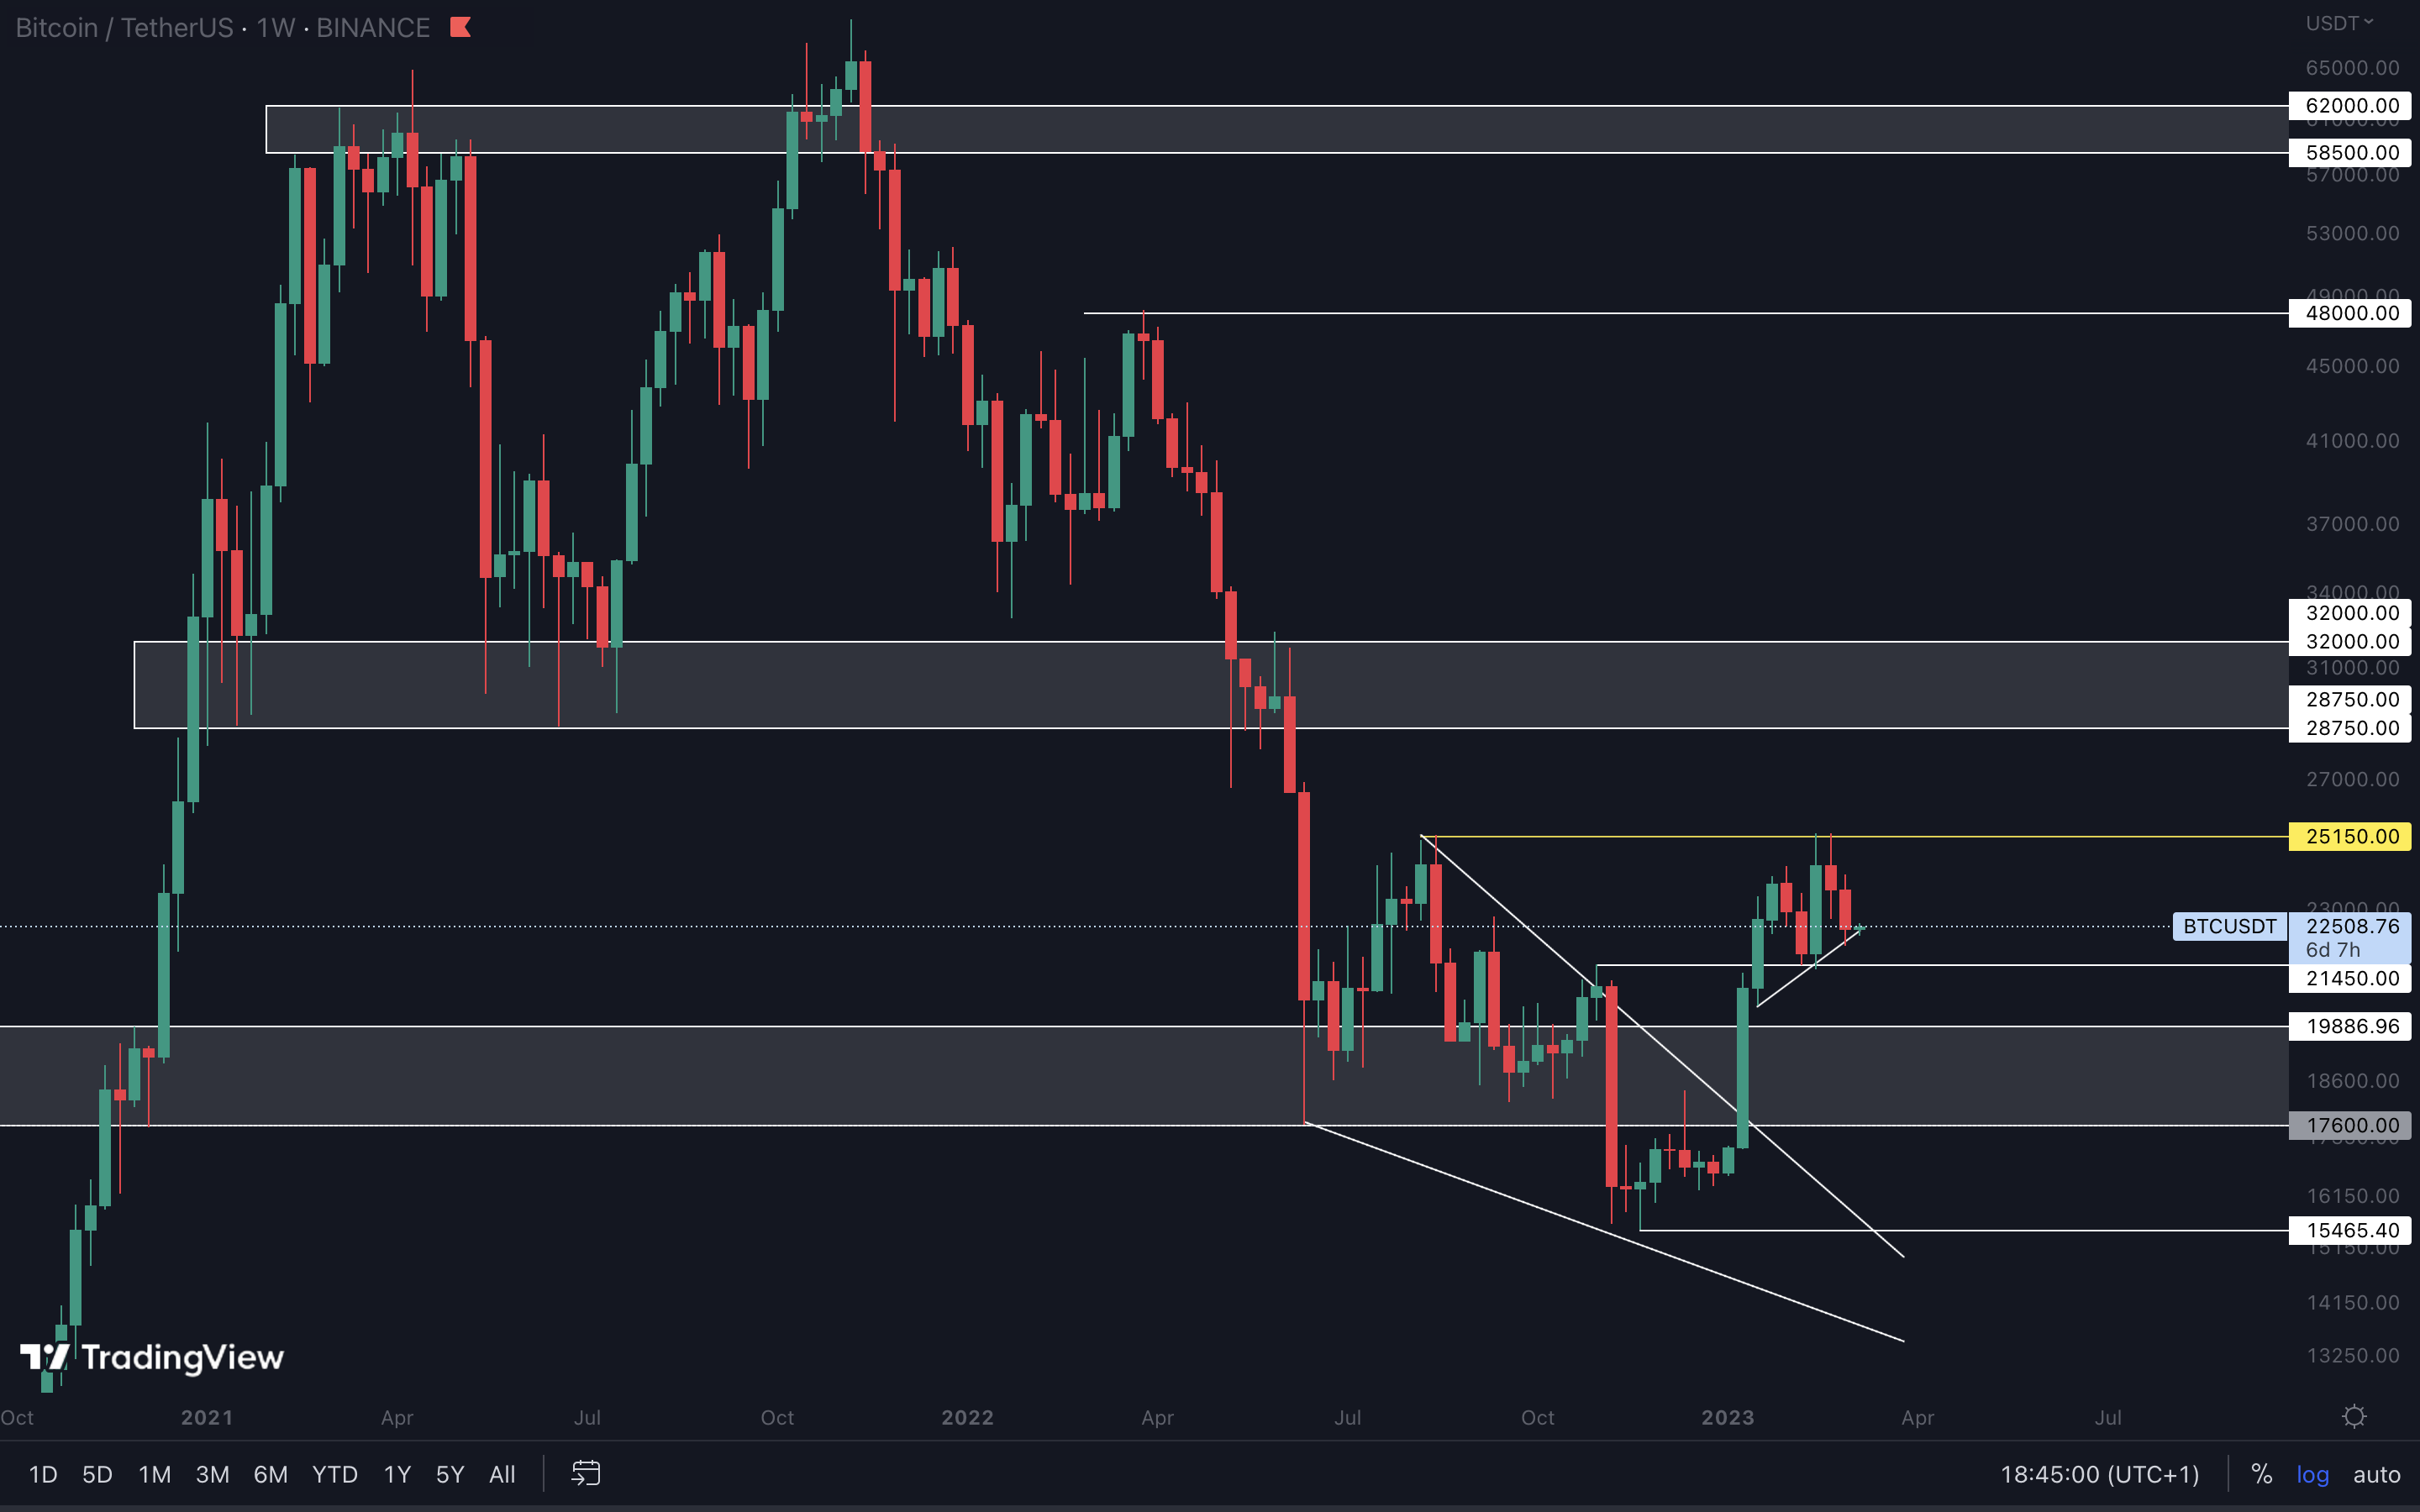
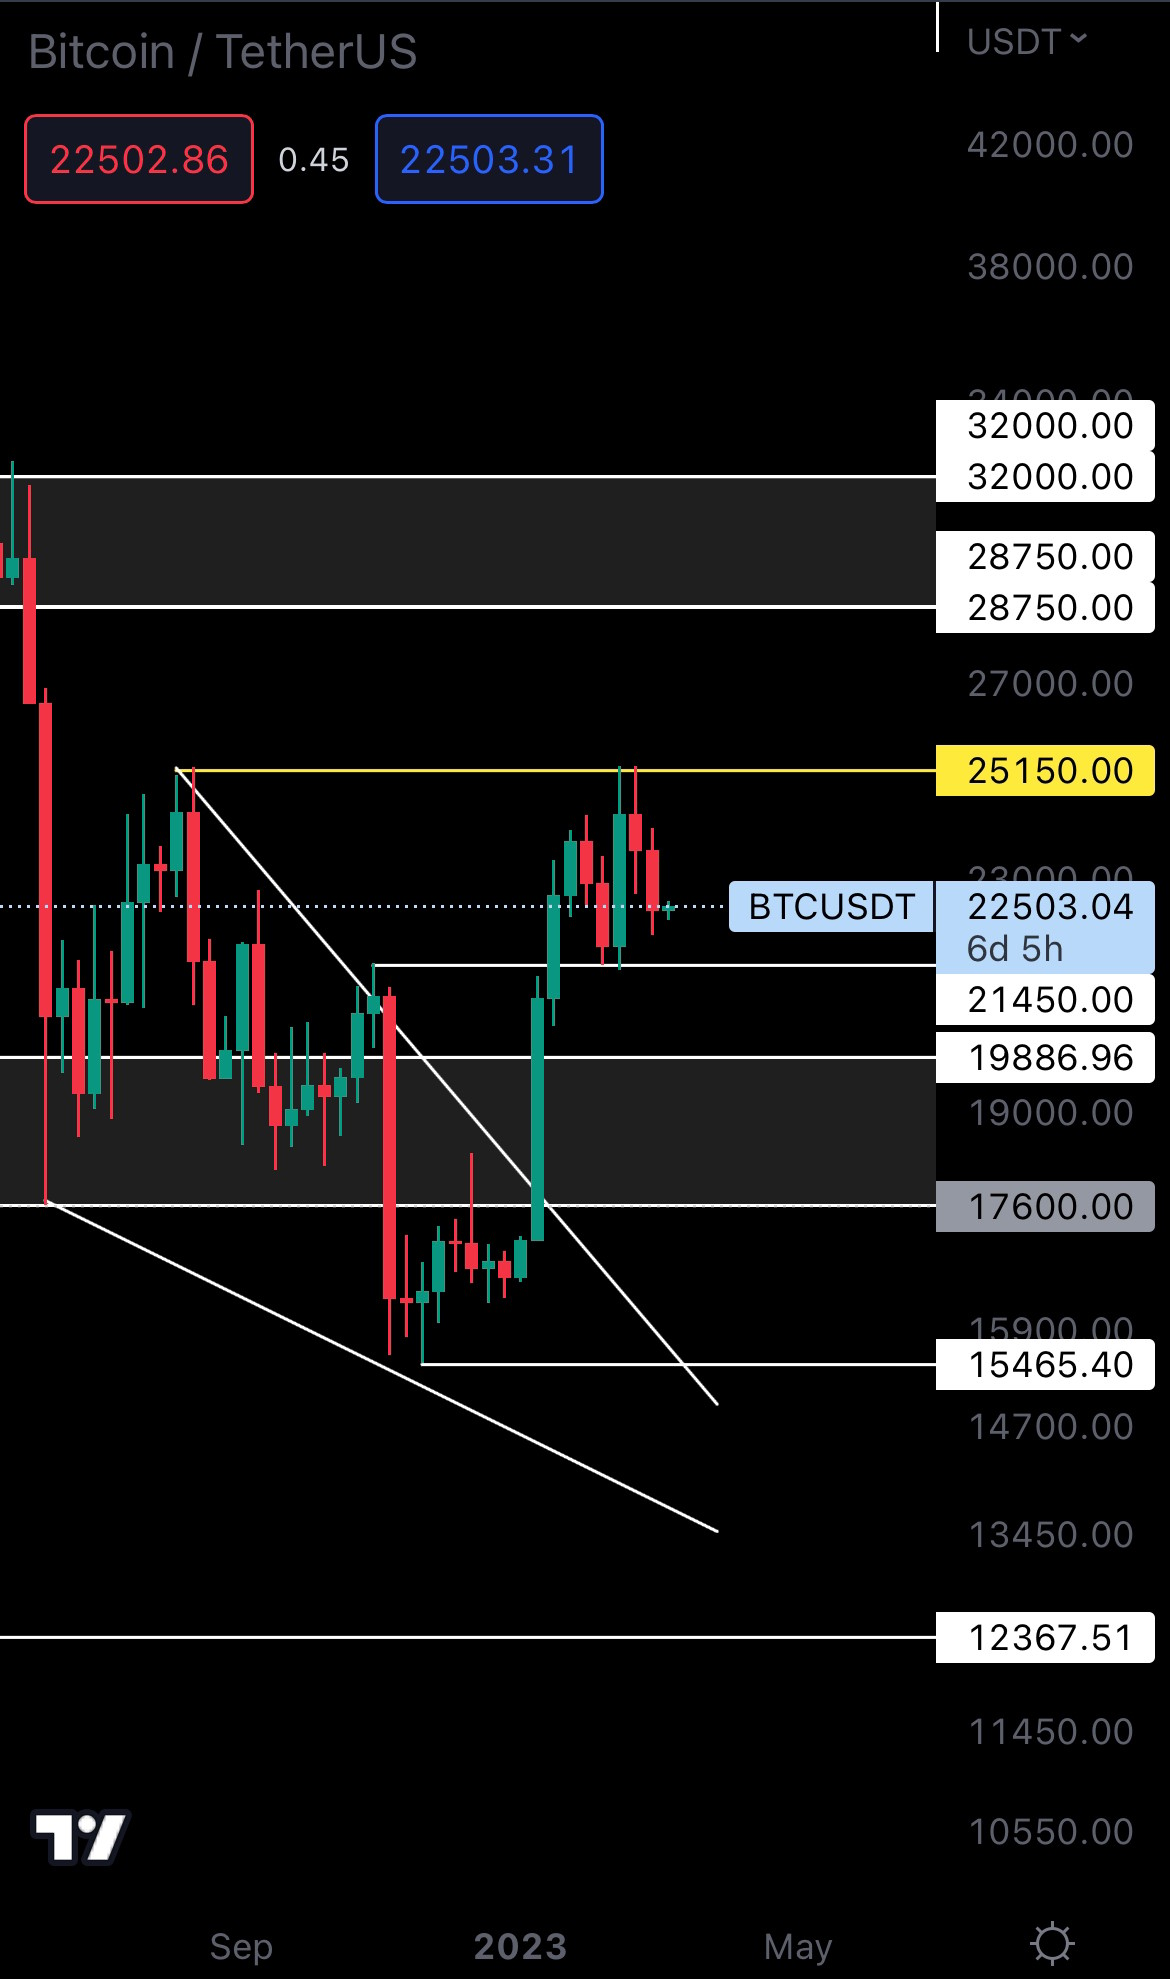
BTC | Bitcoin (Weekly)
BTC | Bitcoin (Daily)
ETH | Ethereum (Weekly)
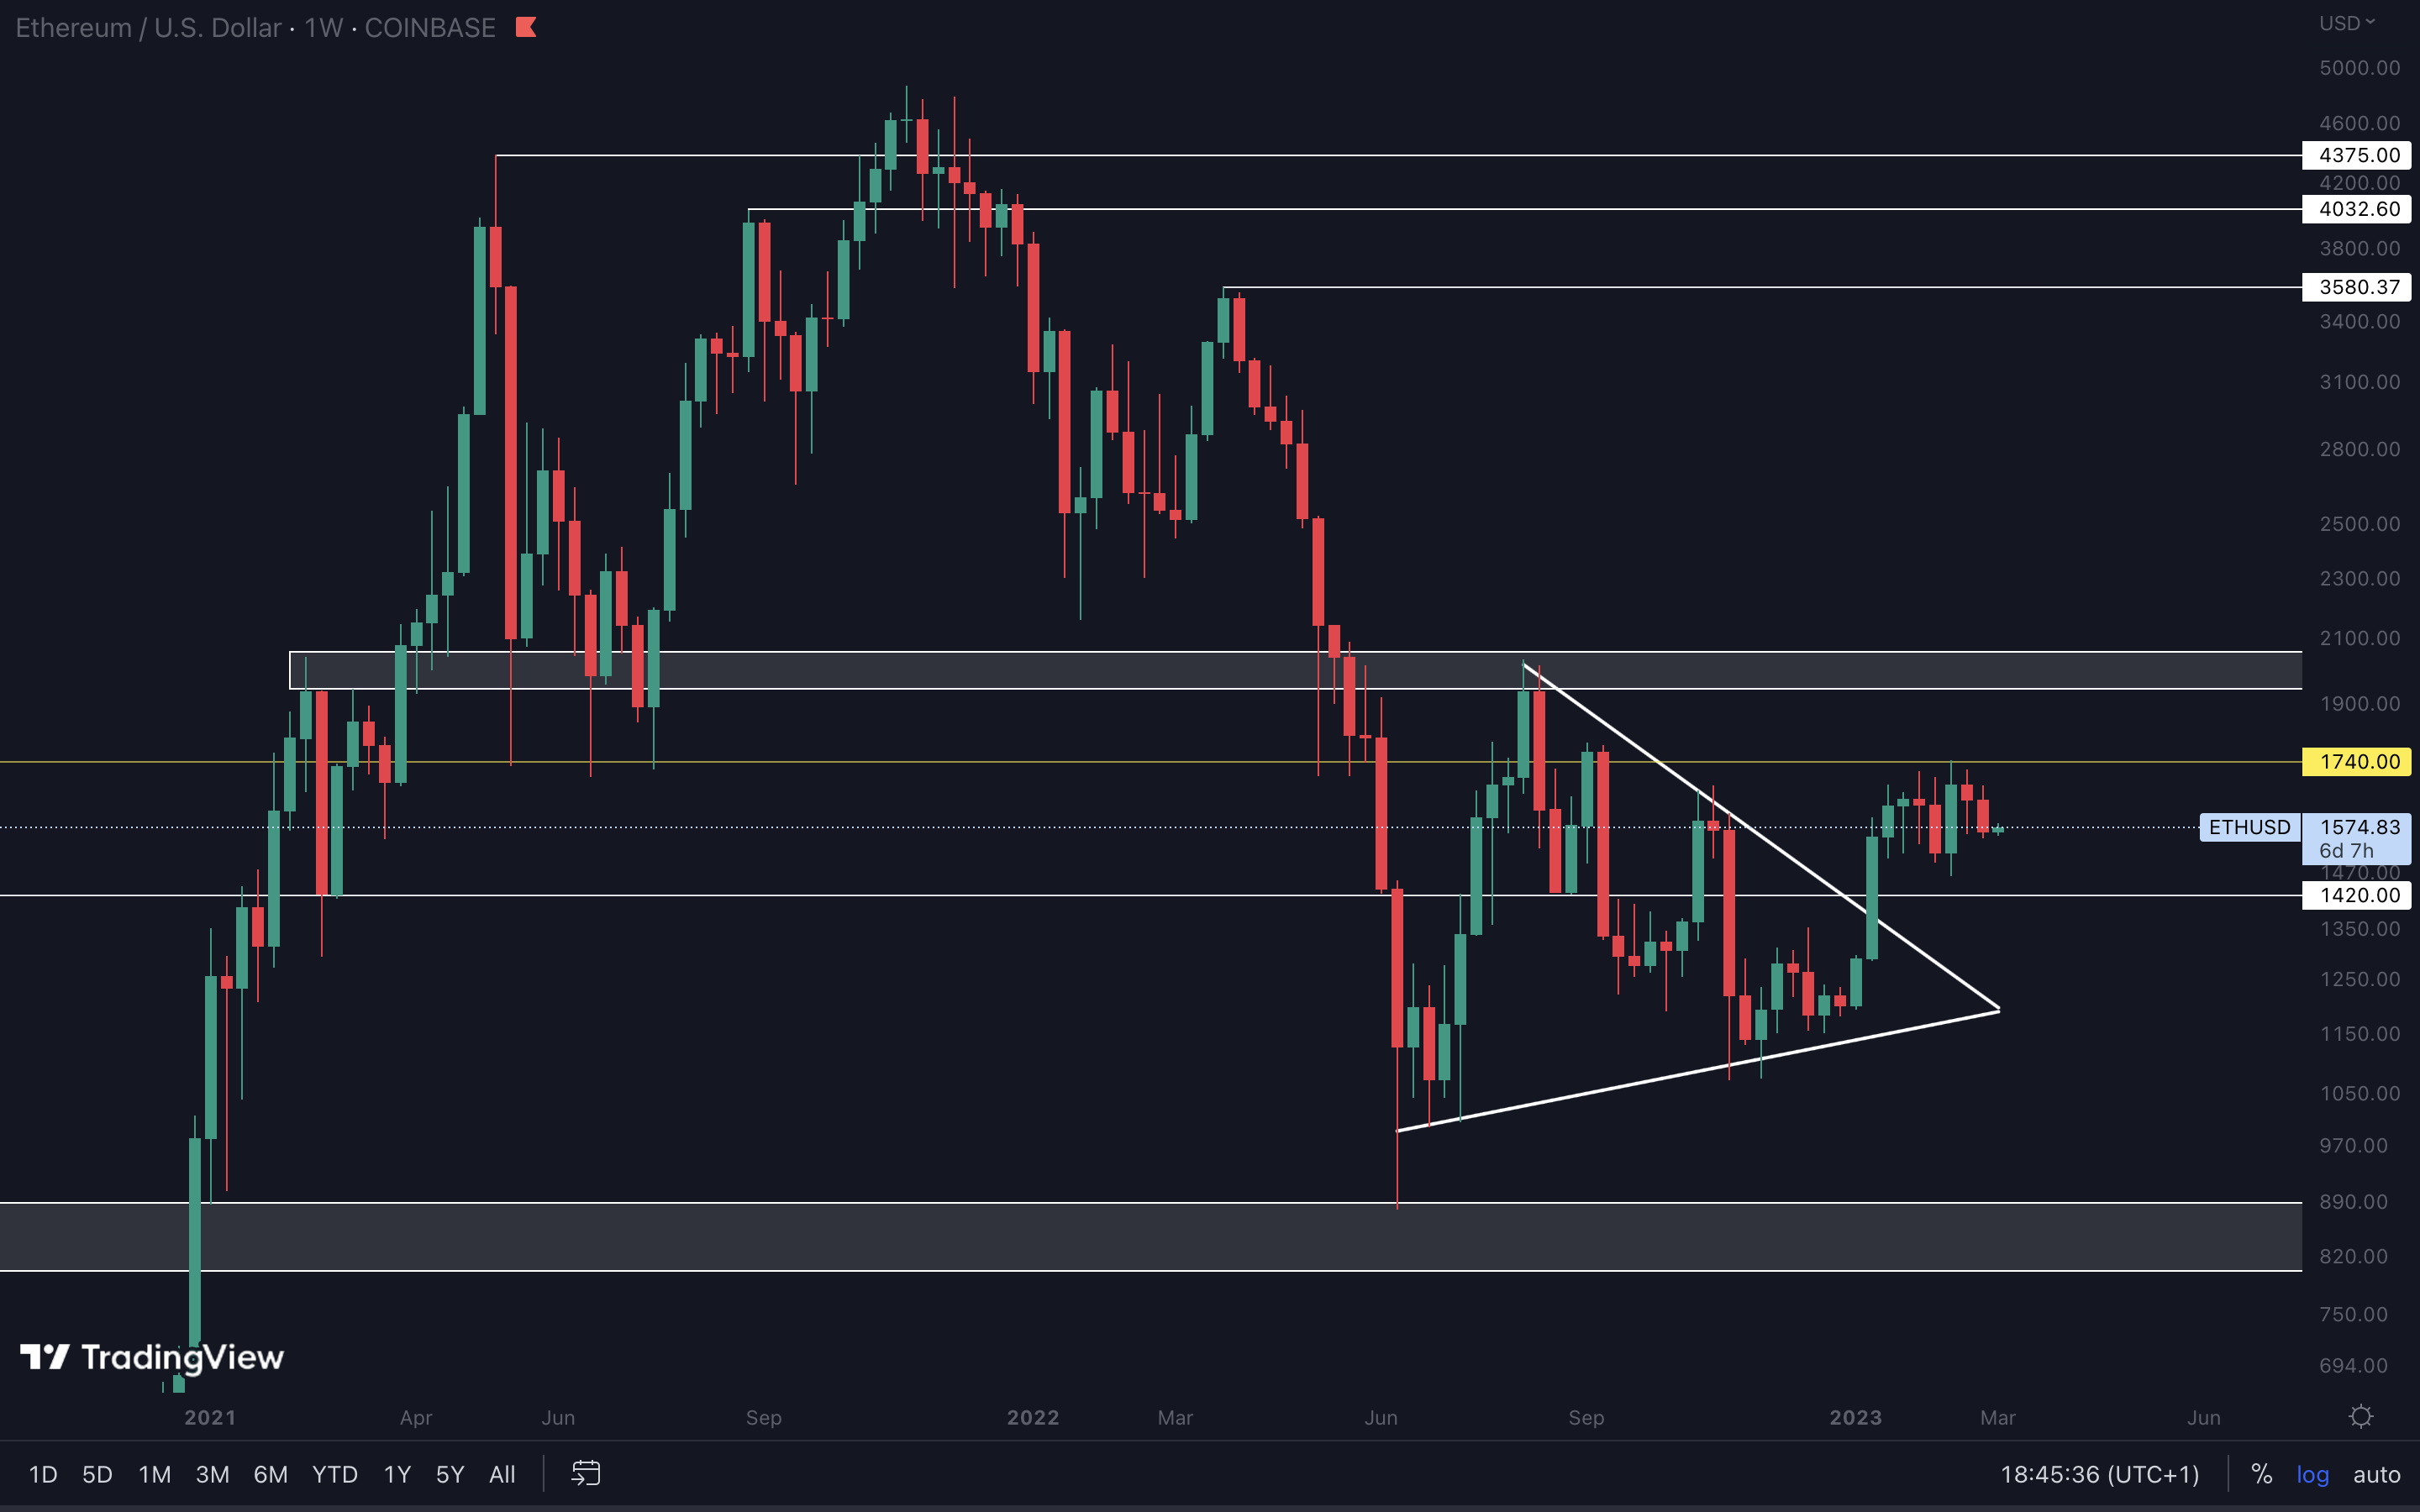
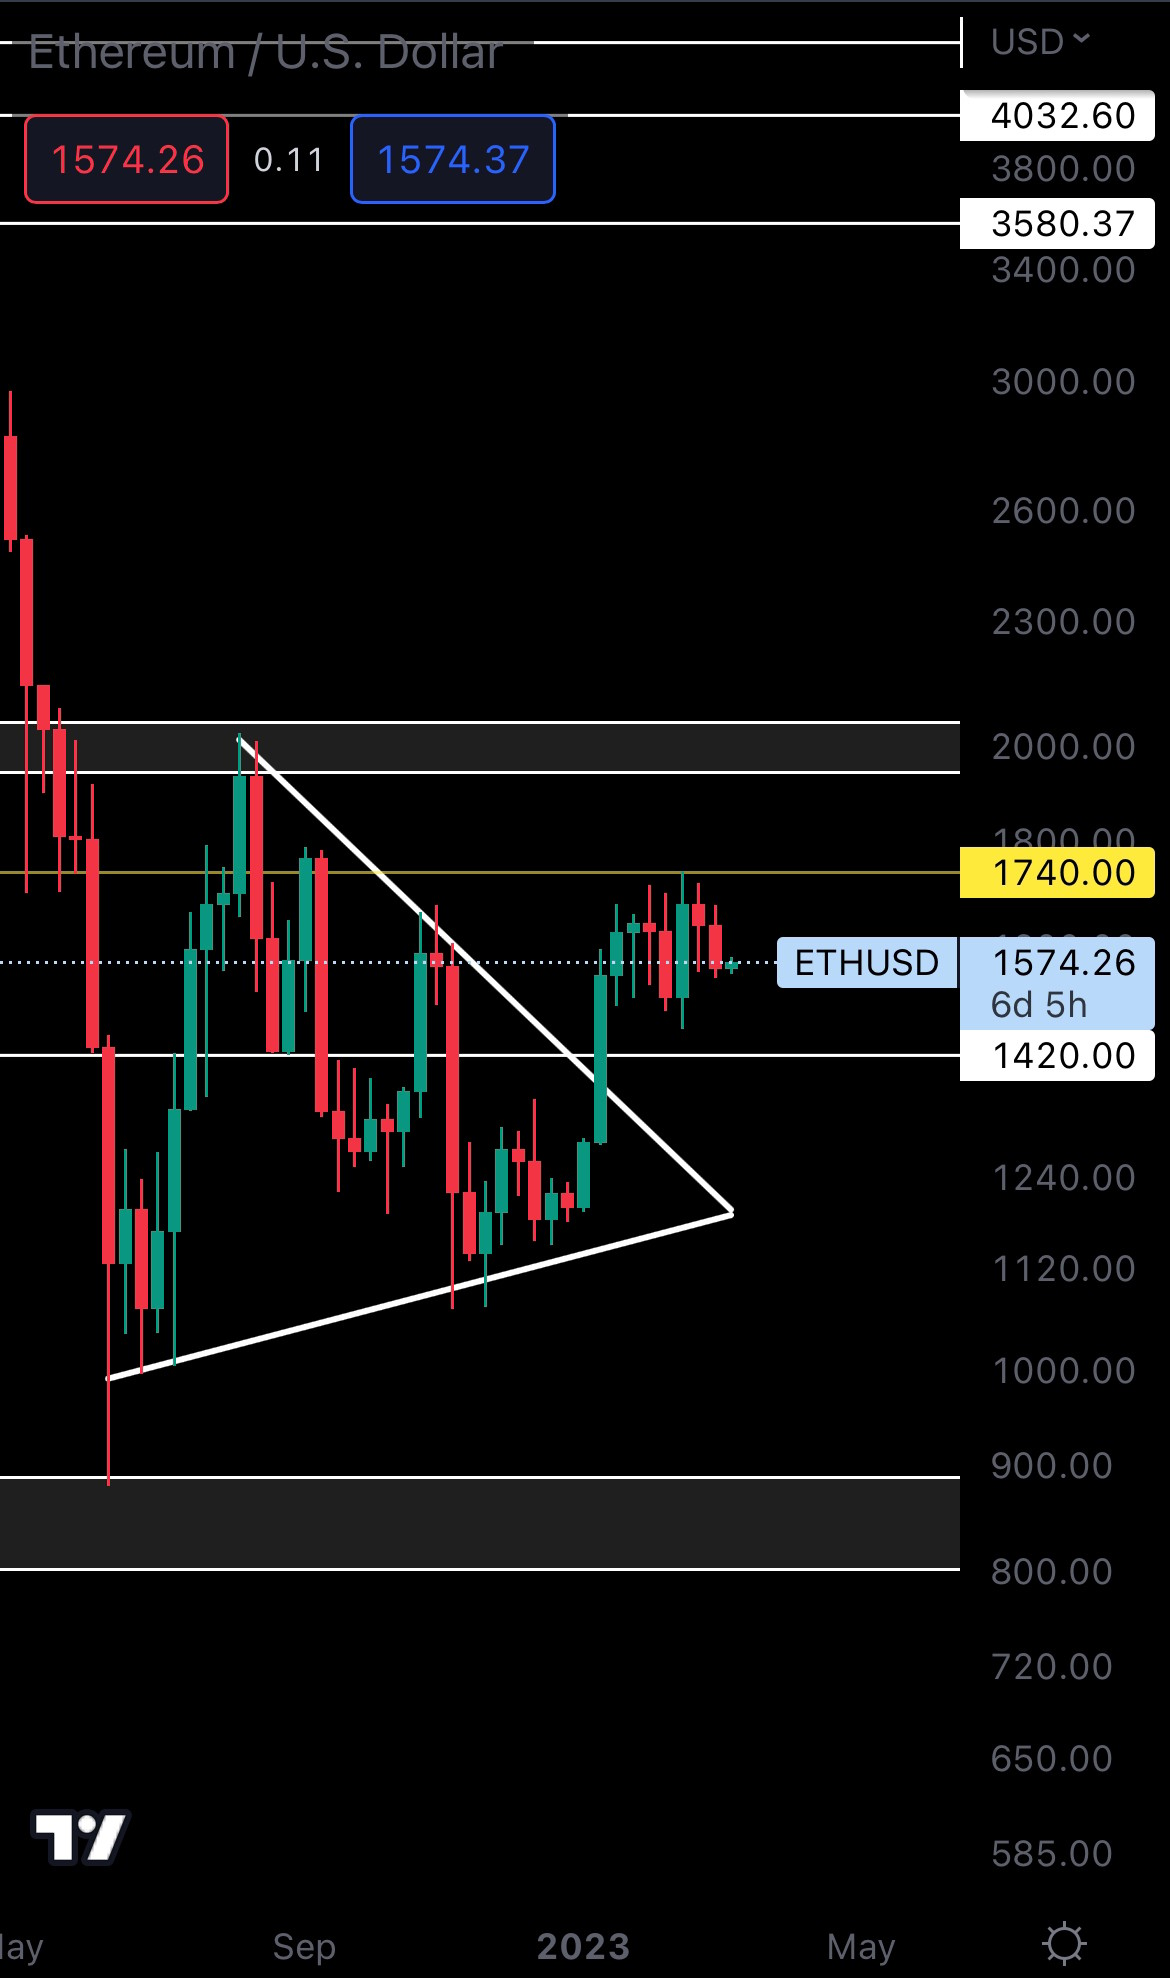
Ether’s price action is no different than in previous weeks. We don’t have enough data to confirm where Ether is going next. However, we do know that it’s ranging between two levels, $1740 and $1420, and only a break of either one will confirm its next direction. In the meantime, we recommend moving your attention to Bitcoin instead of Ether, as it’s a much more reliable asset to track because it drives the market.
SOL | Solana (Weekly)
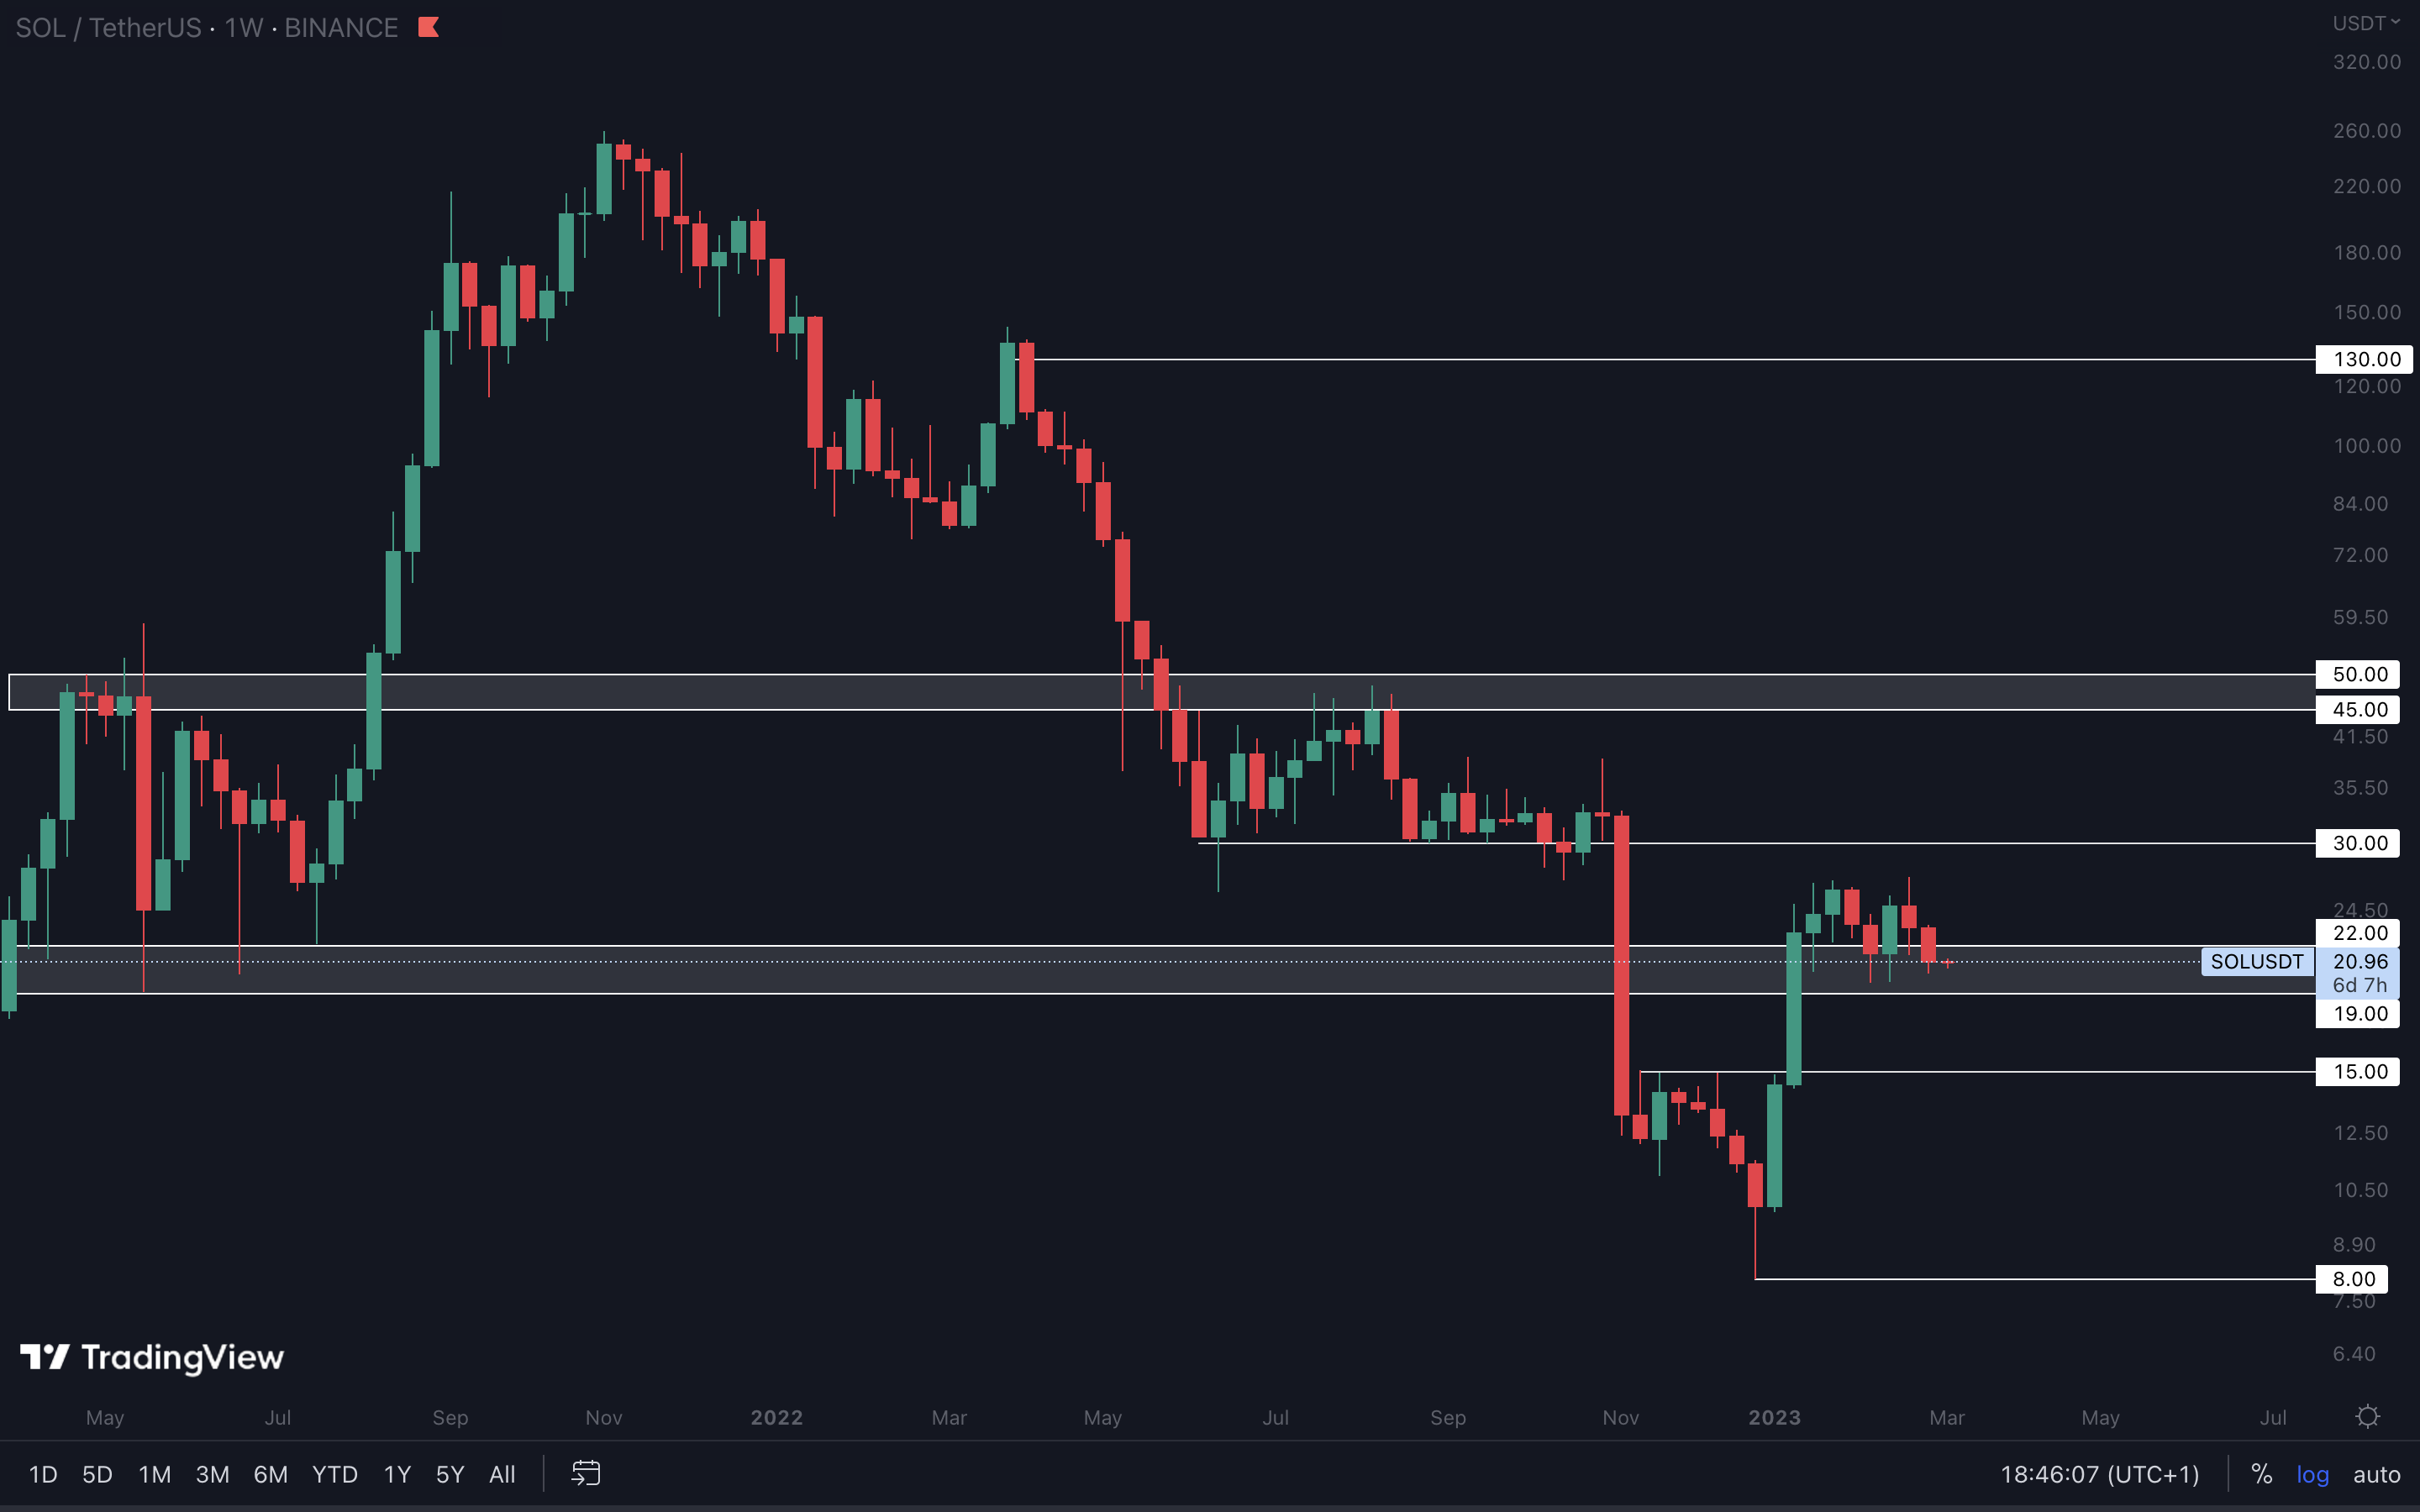
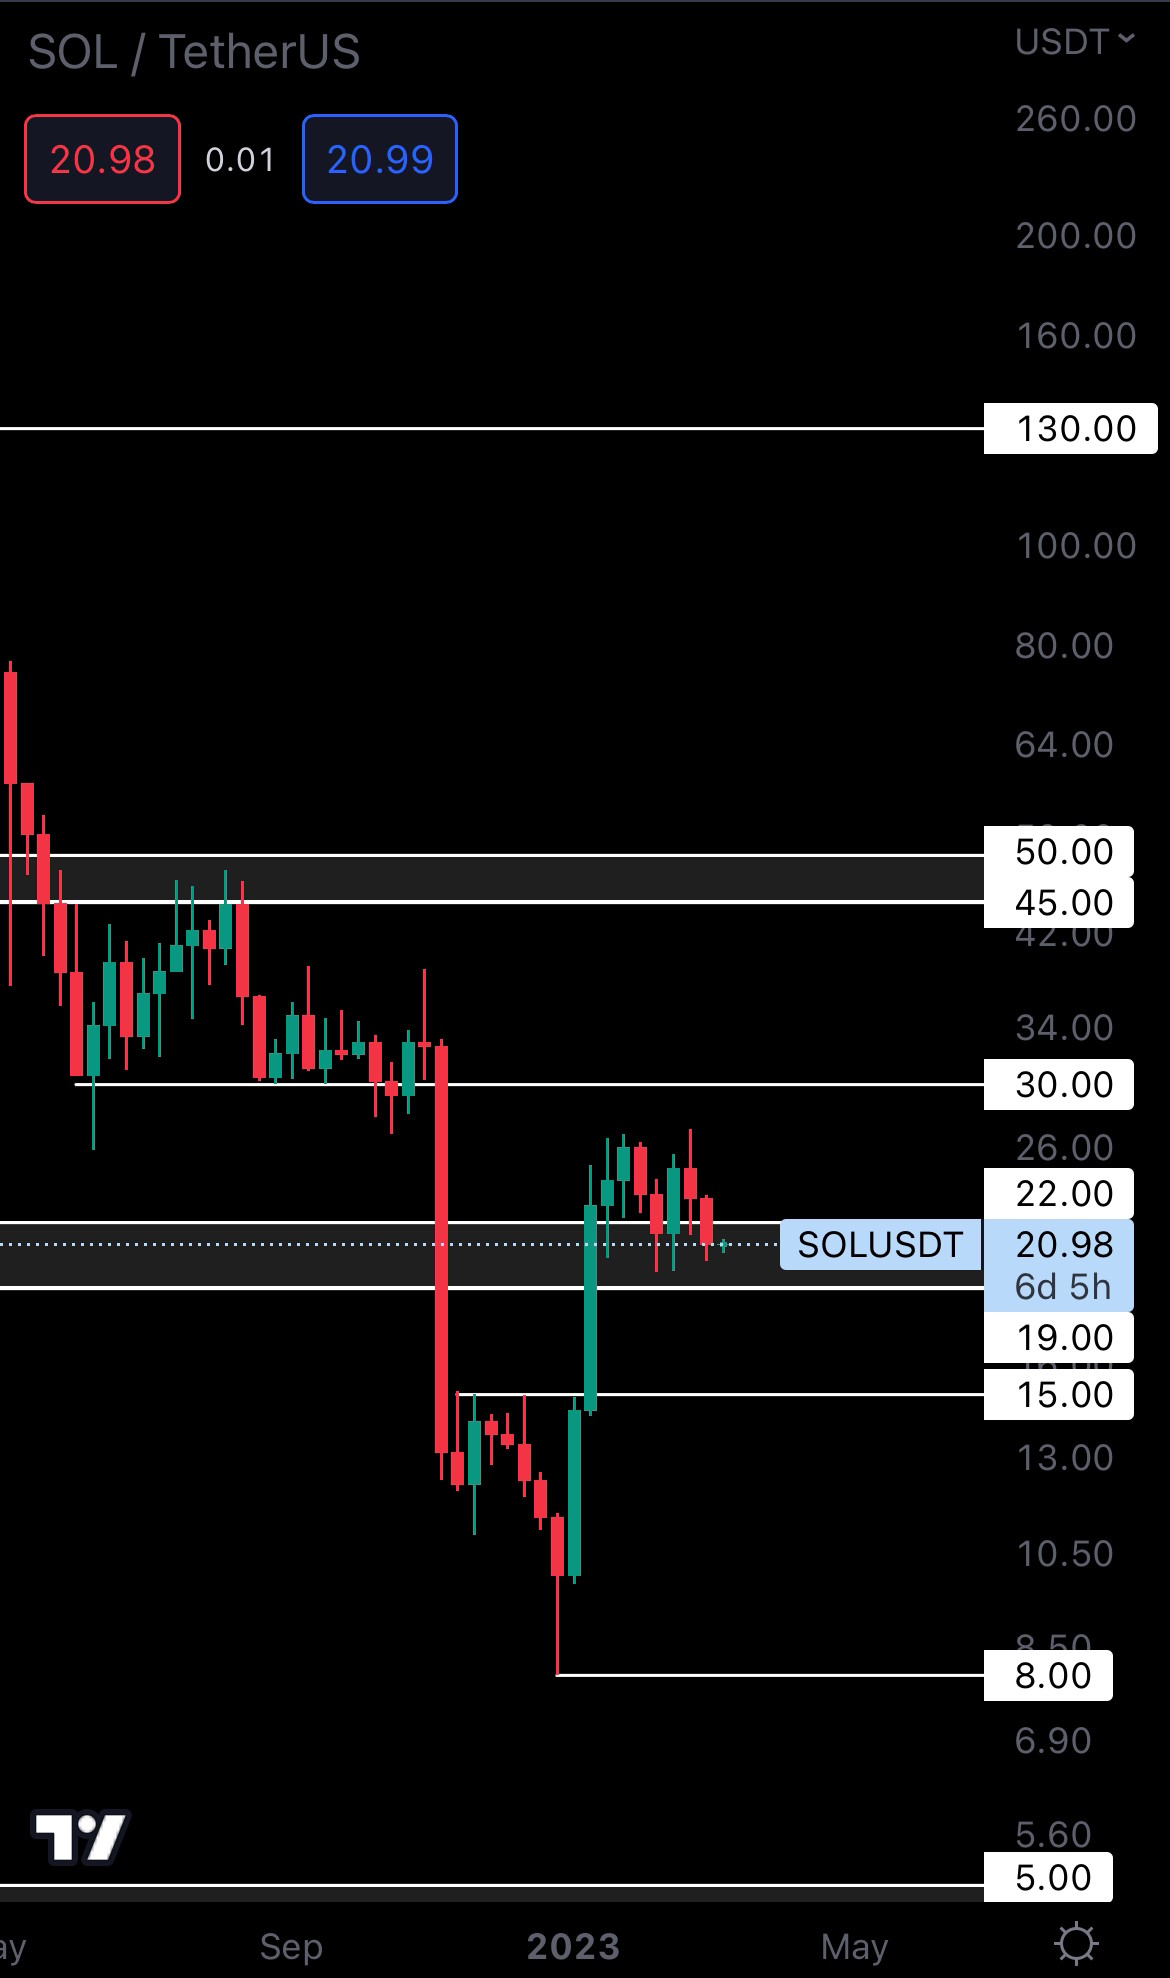
SOL is still at support. If $19 holds, SOL still has a chance of reaching $30, potentially in early Q2. We don’t believe this level will be reached in March because of the indecision that’s in the market right now.
RUNE | THORChain (Weekly)
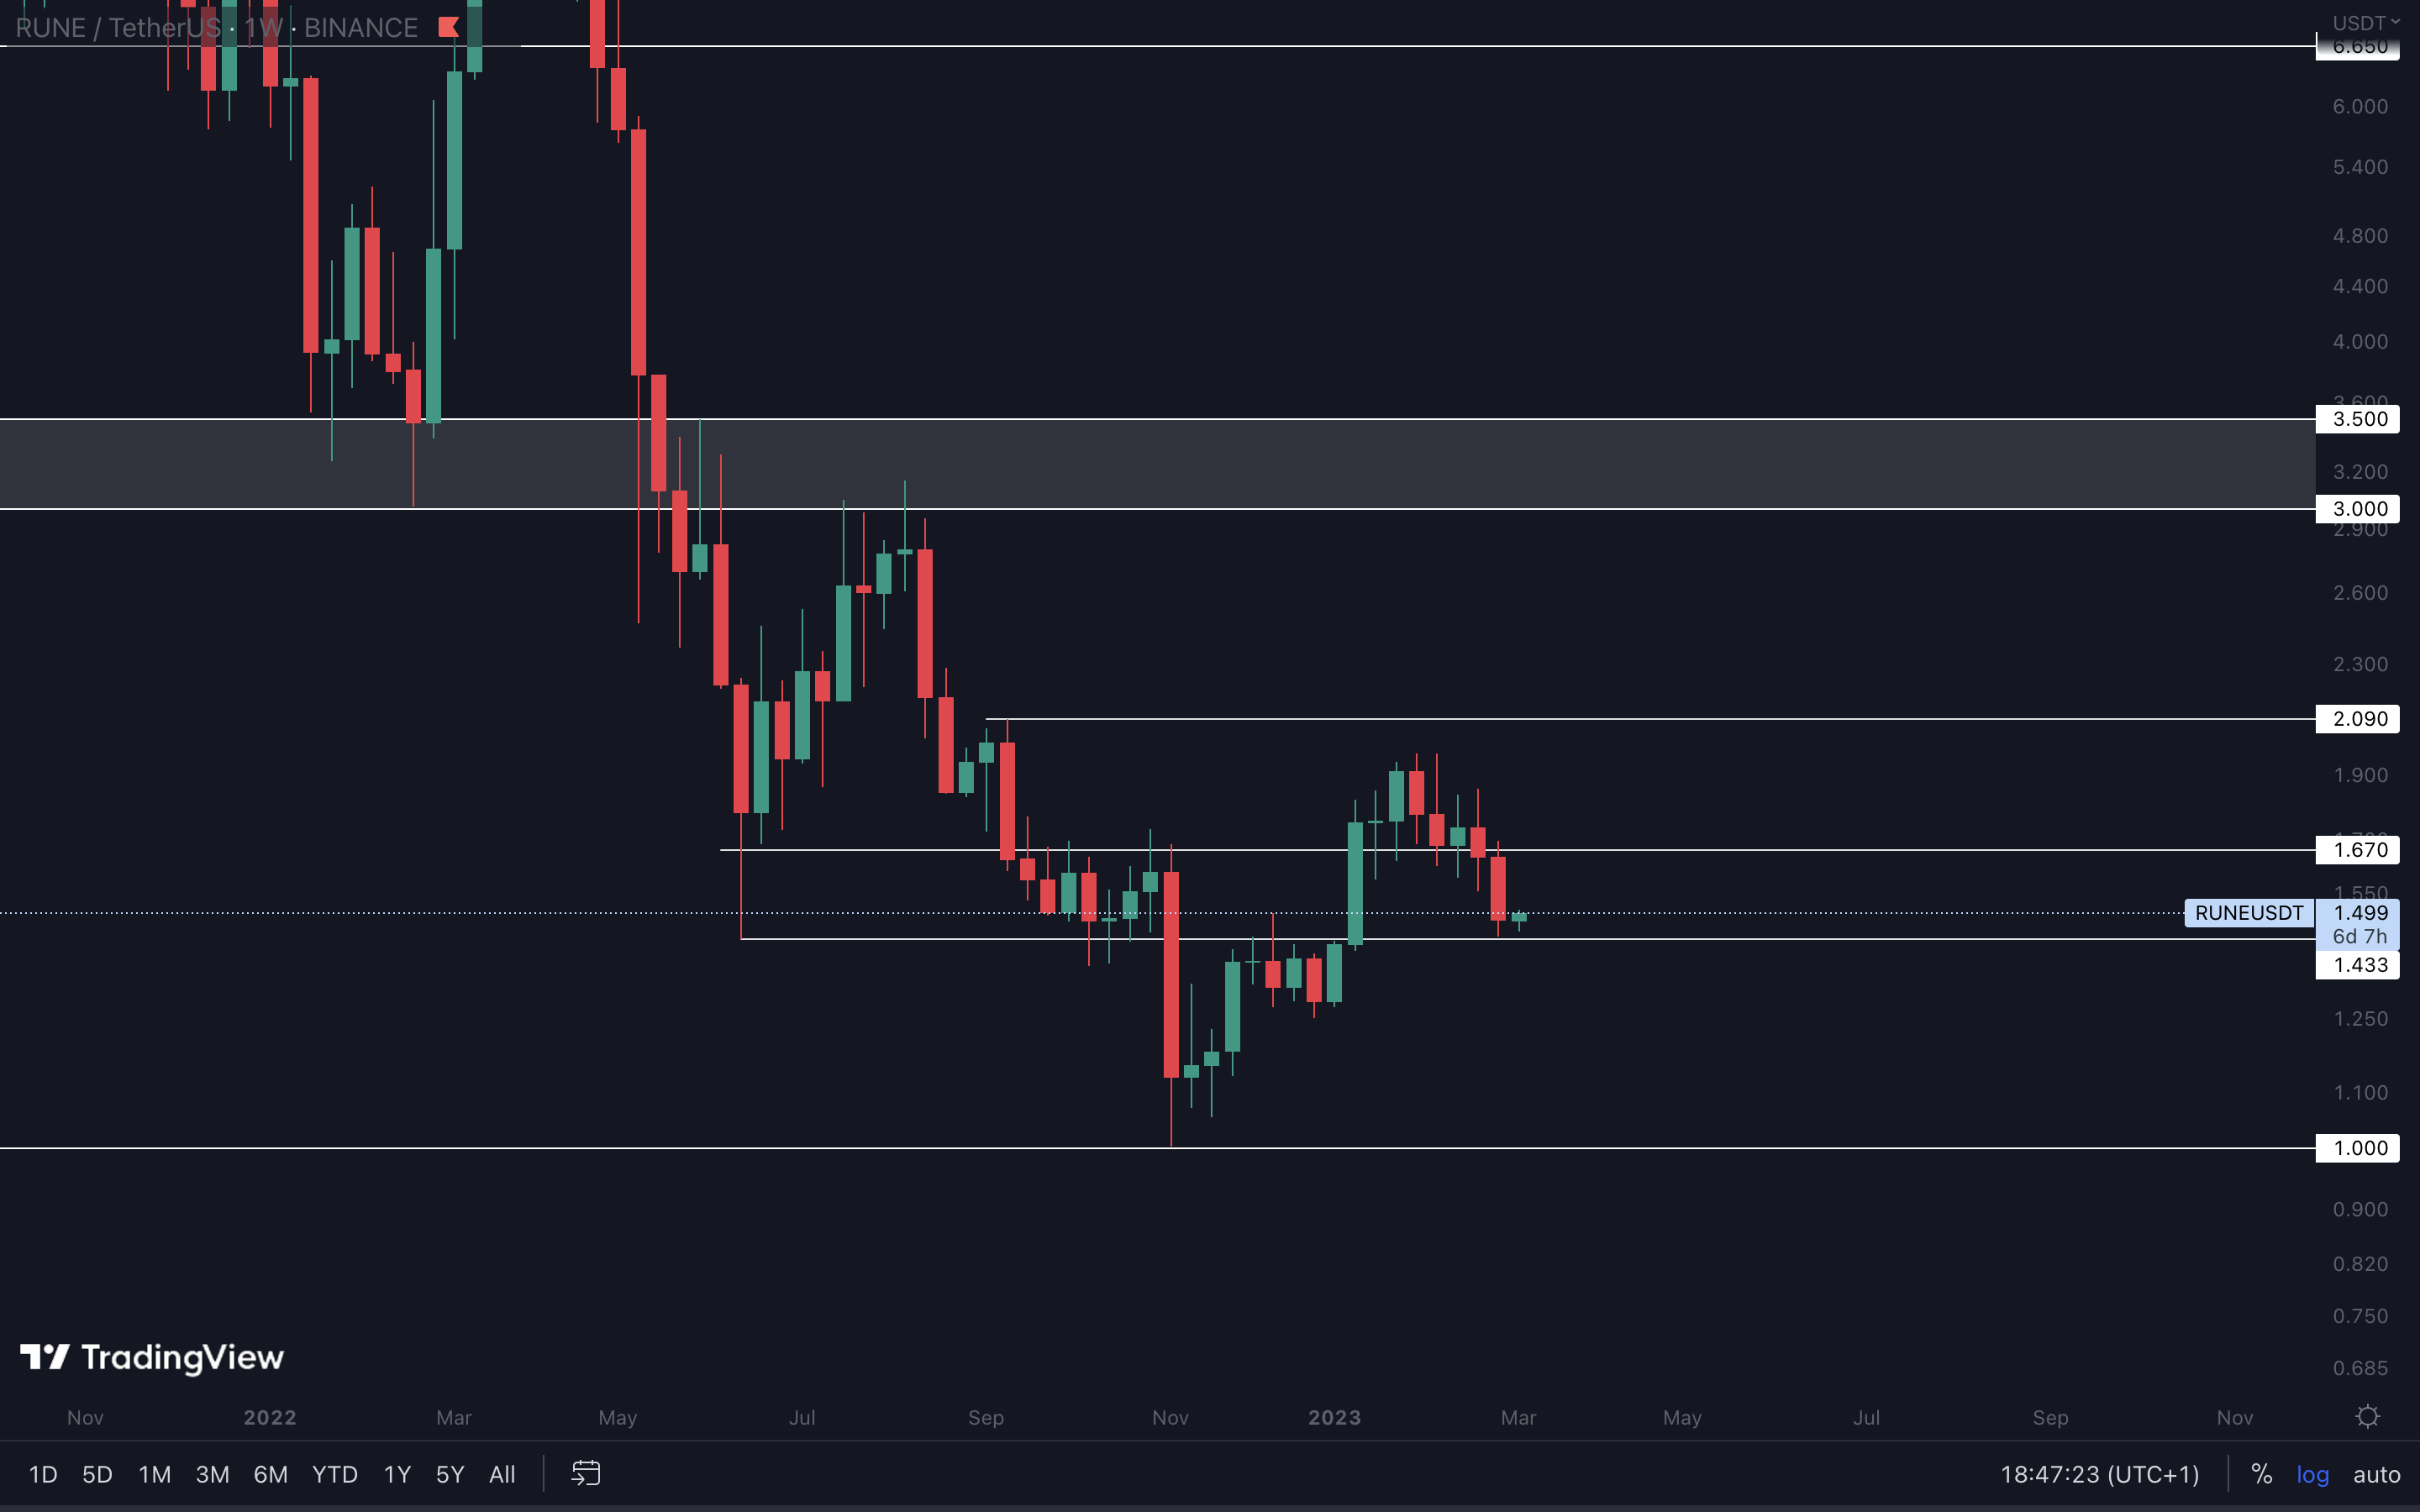
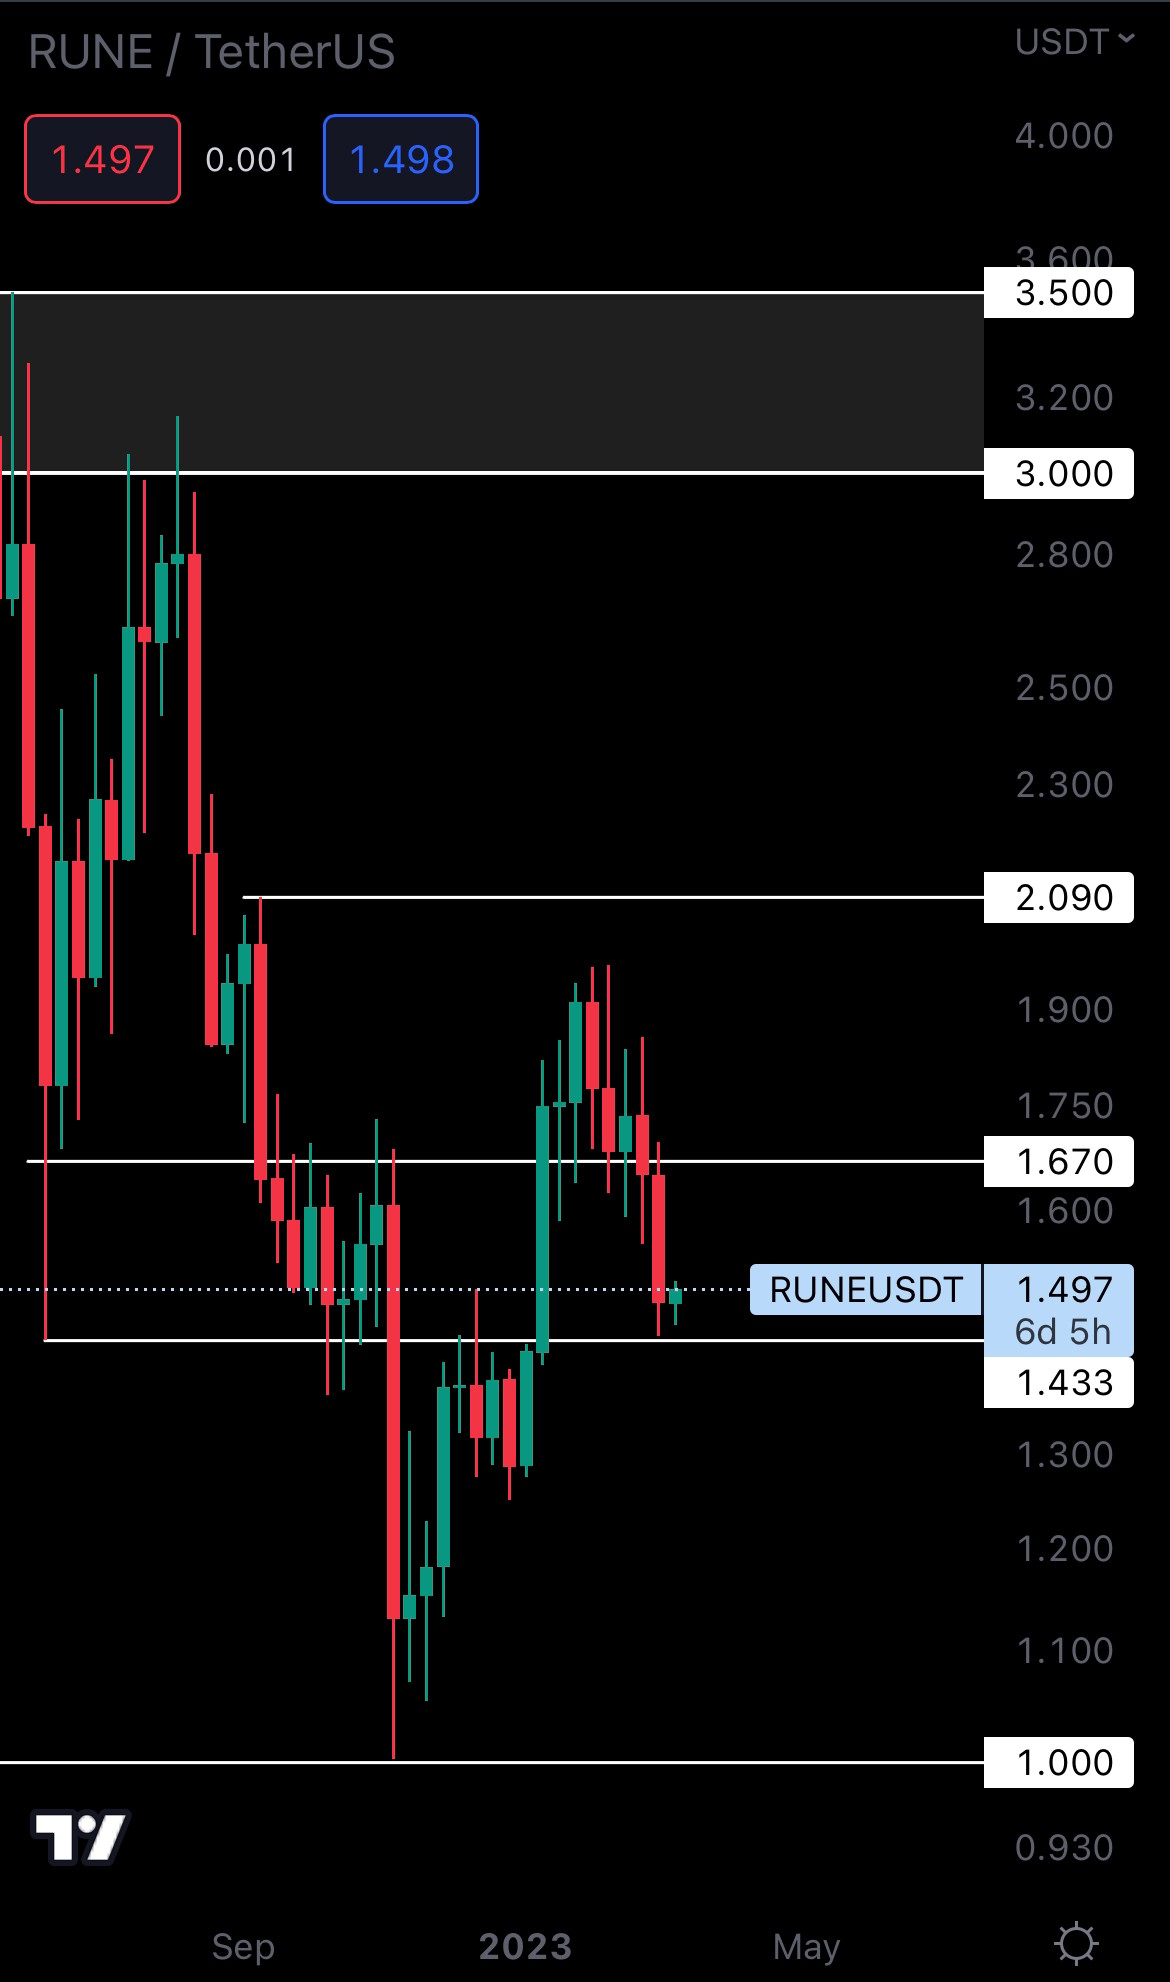
Unlike other assets, RUNE appears to be giving us some indication as to where it is going next. The asset is not only at support ($1.43) but is also on the verge of marking a weekly higher low. $1.43 has been tested multiple times in the past 9 months, and it goes without saying that this is an important level. RUNE holding this level as support and bouncing toward $1.67 and $2.09 respectively would mark a higher low on the weekly timeframe, keeping the market structure intact.
If you were to take a trade here, the risk/reward ratio is definitely intriguing. As always, there are risks with every trade. Given that the rest of the market isn’t on its best terms, RUNE might have a hard time holding $1.43 as support, so you should take this into consideration if you decide to jump on this.
SNX | Synthetix (Weekly)
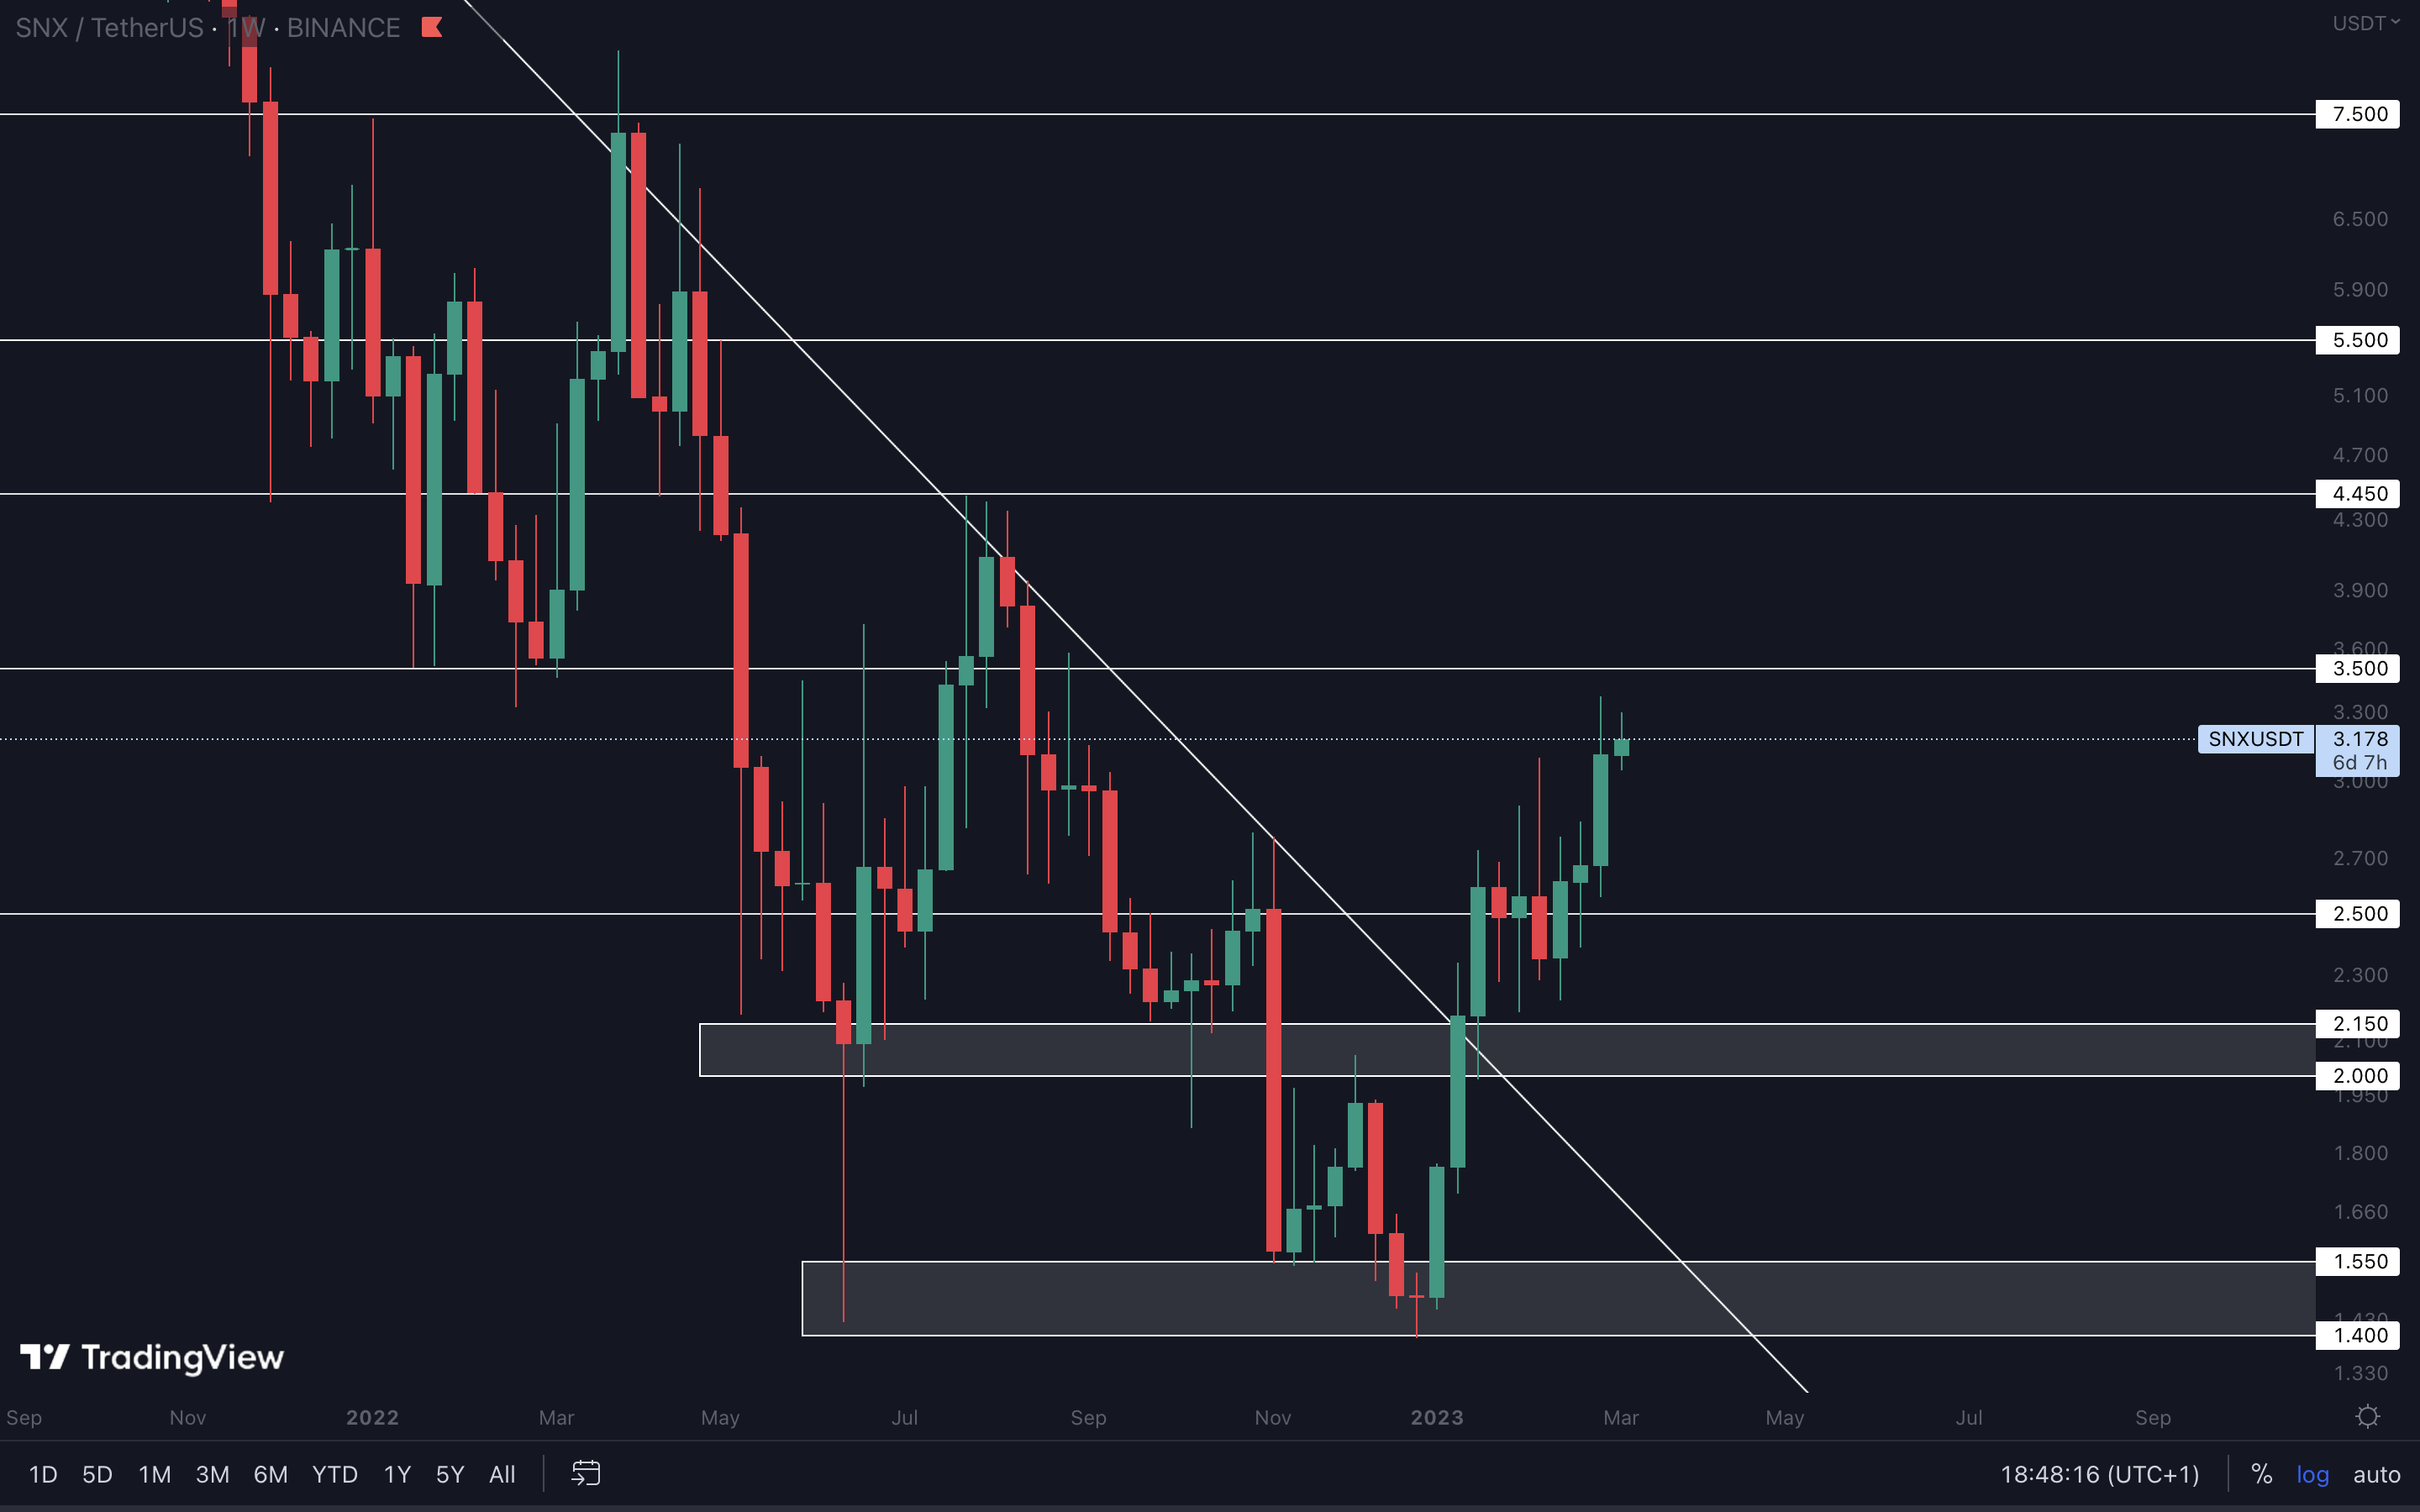
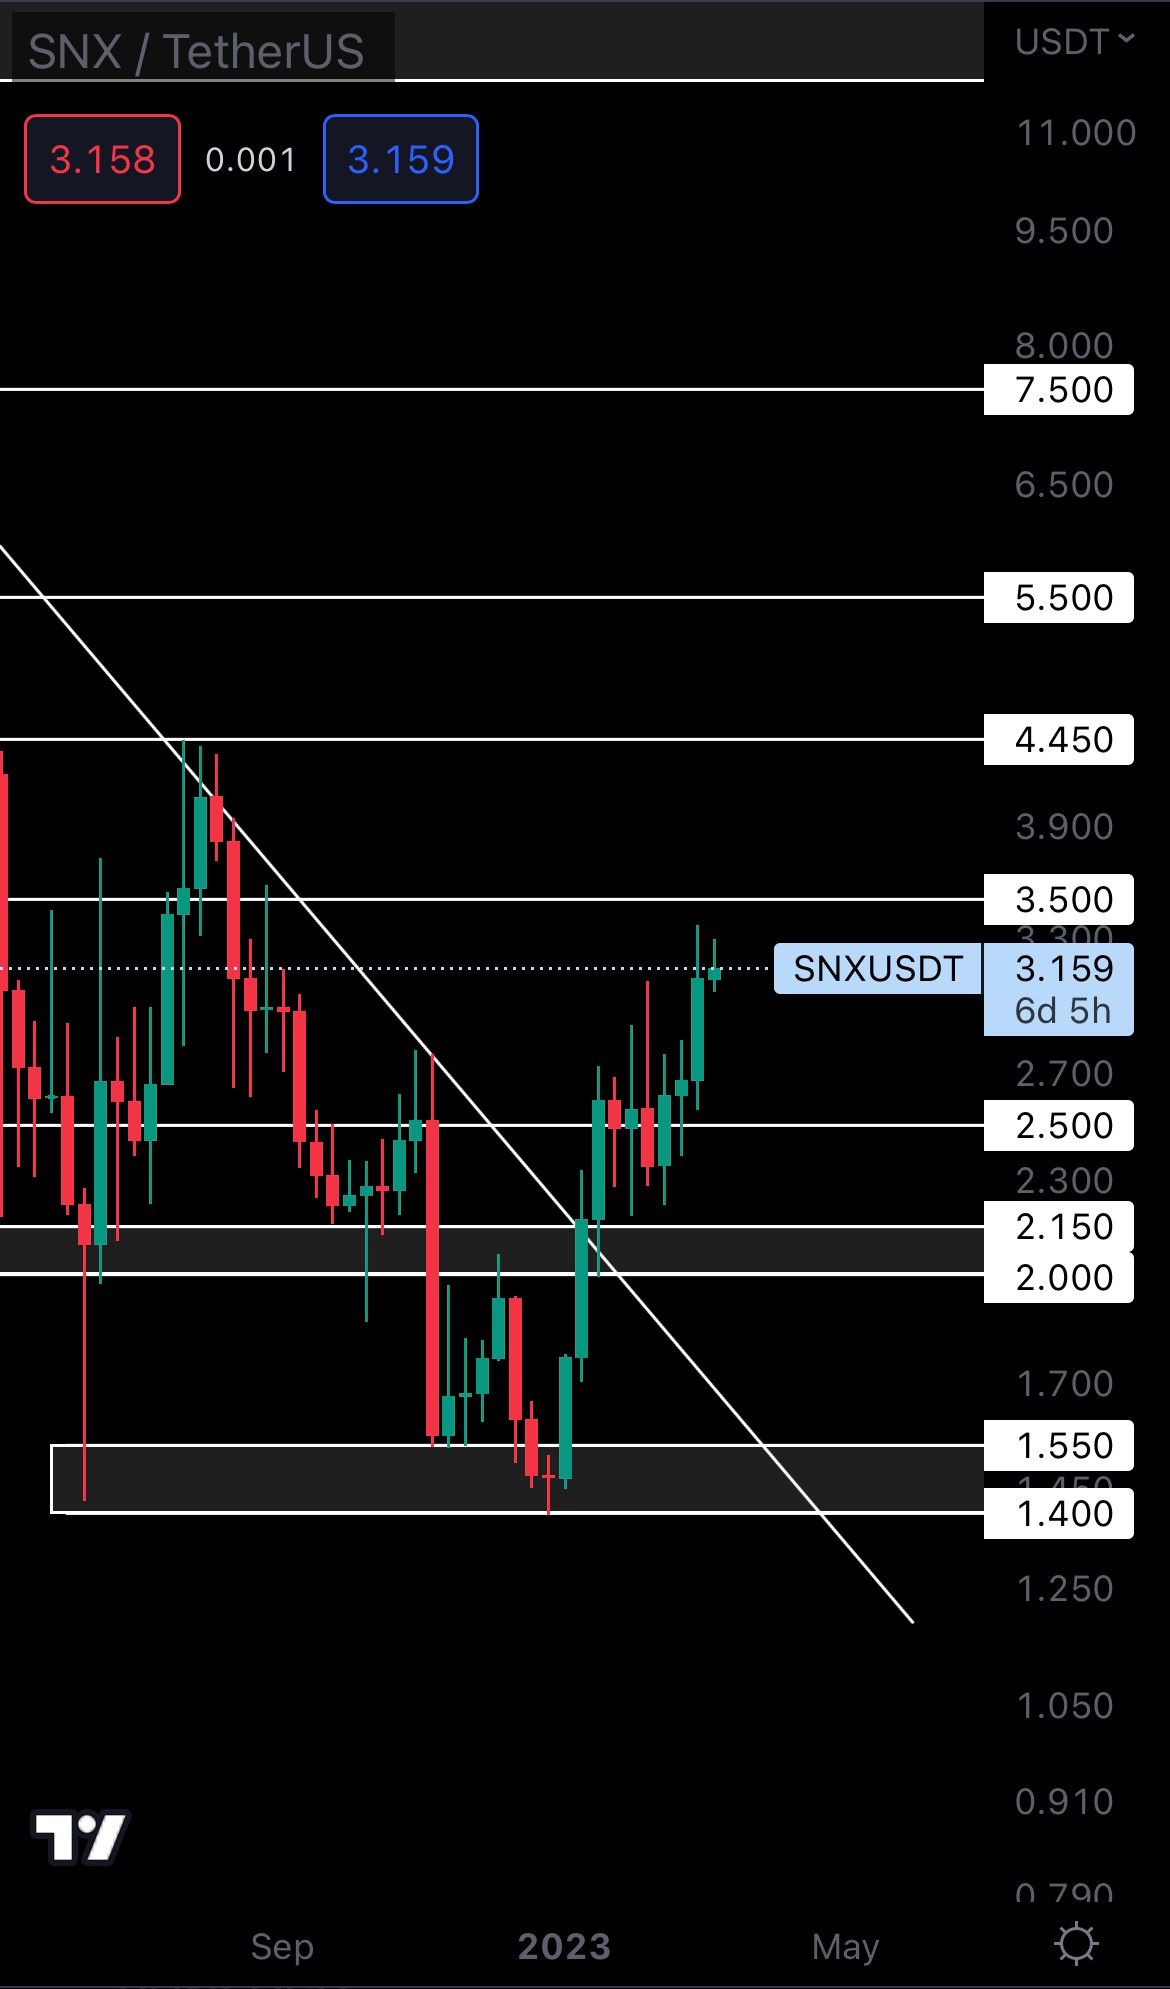
SNX is one of the outperformers right now, and it’s finally approaching $3.50. We don’t recommend entering SNX right now because of how close it is to resistance, but a reclaim of $3.50 would give us a nice opportunity. If SNX closes a weekly candle above $3.50, further upside to $4.45 can be expected. For the time being, we should wait for SNX to reach $3.50 and see how it reacts to that level.
dYdX | DYDX (Weekly)
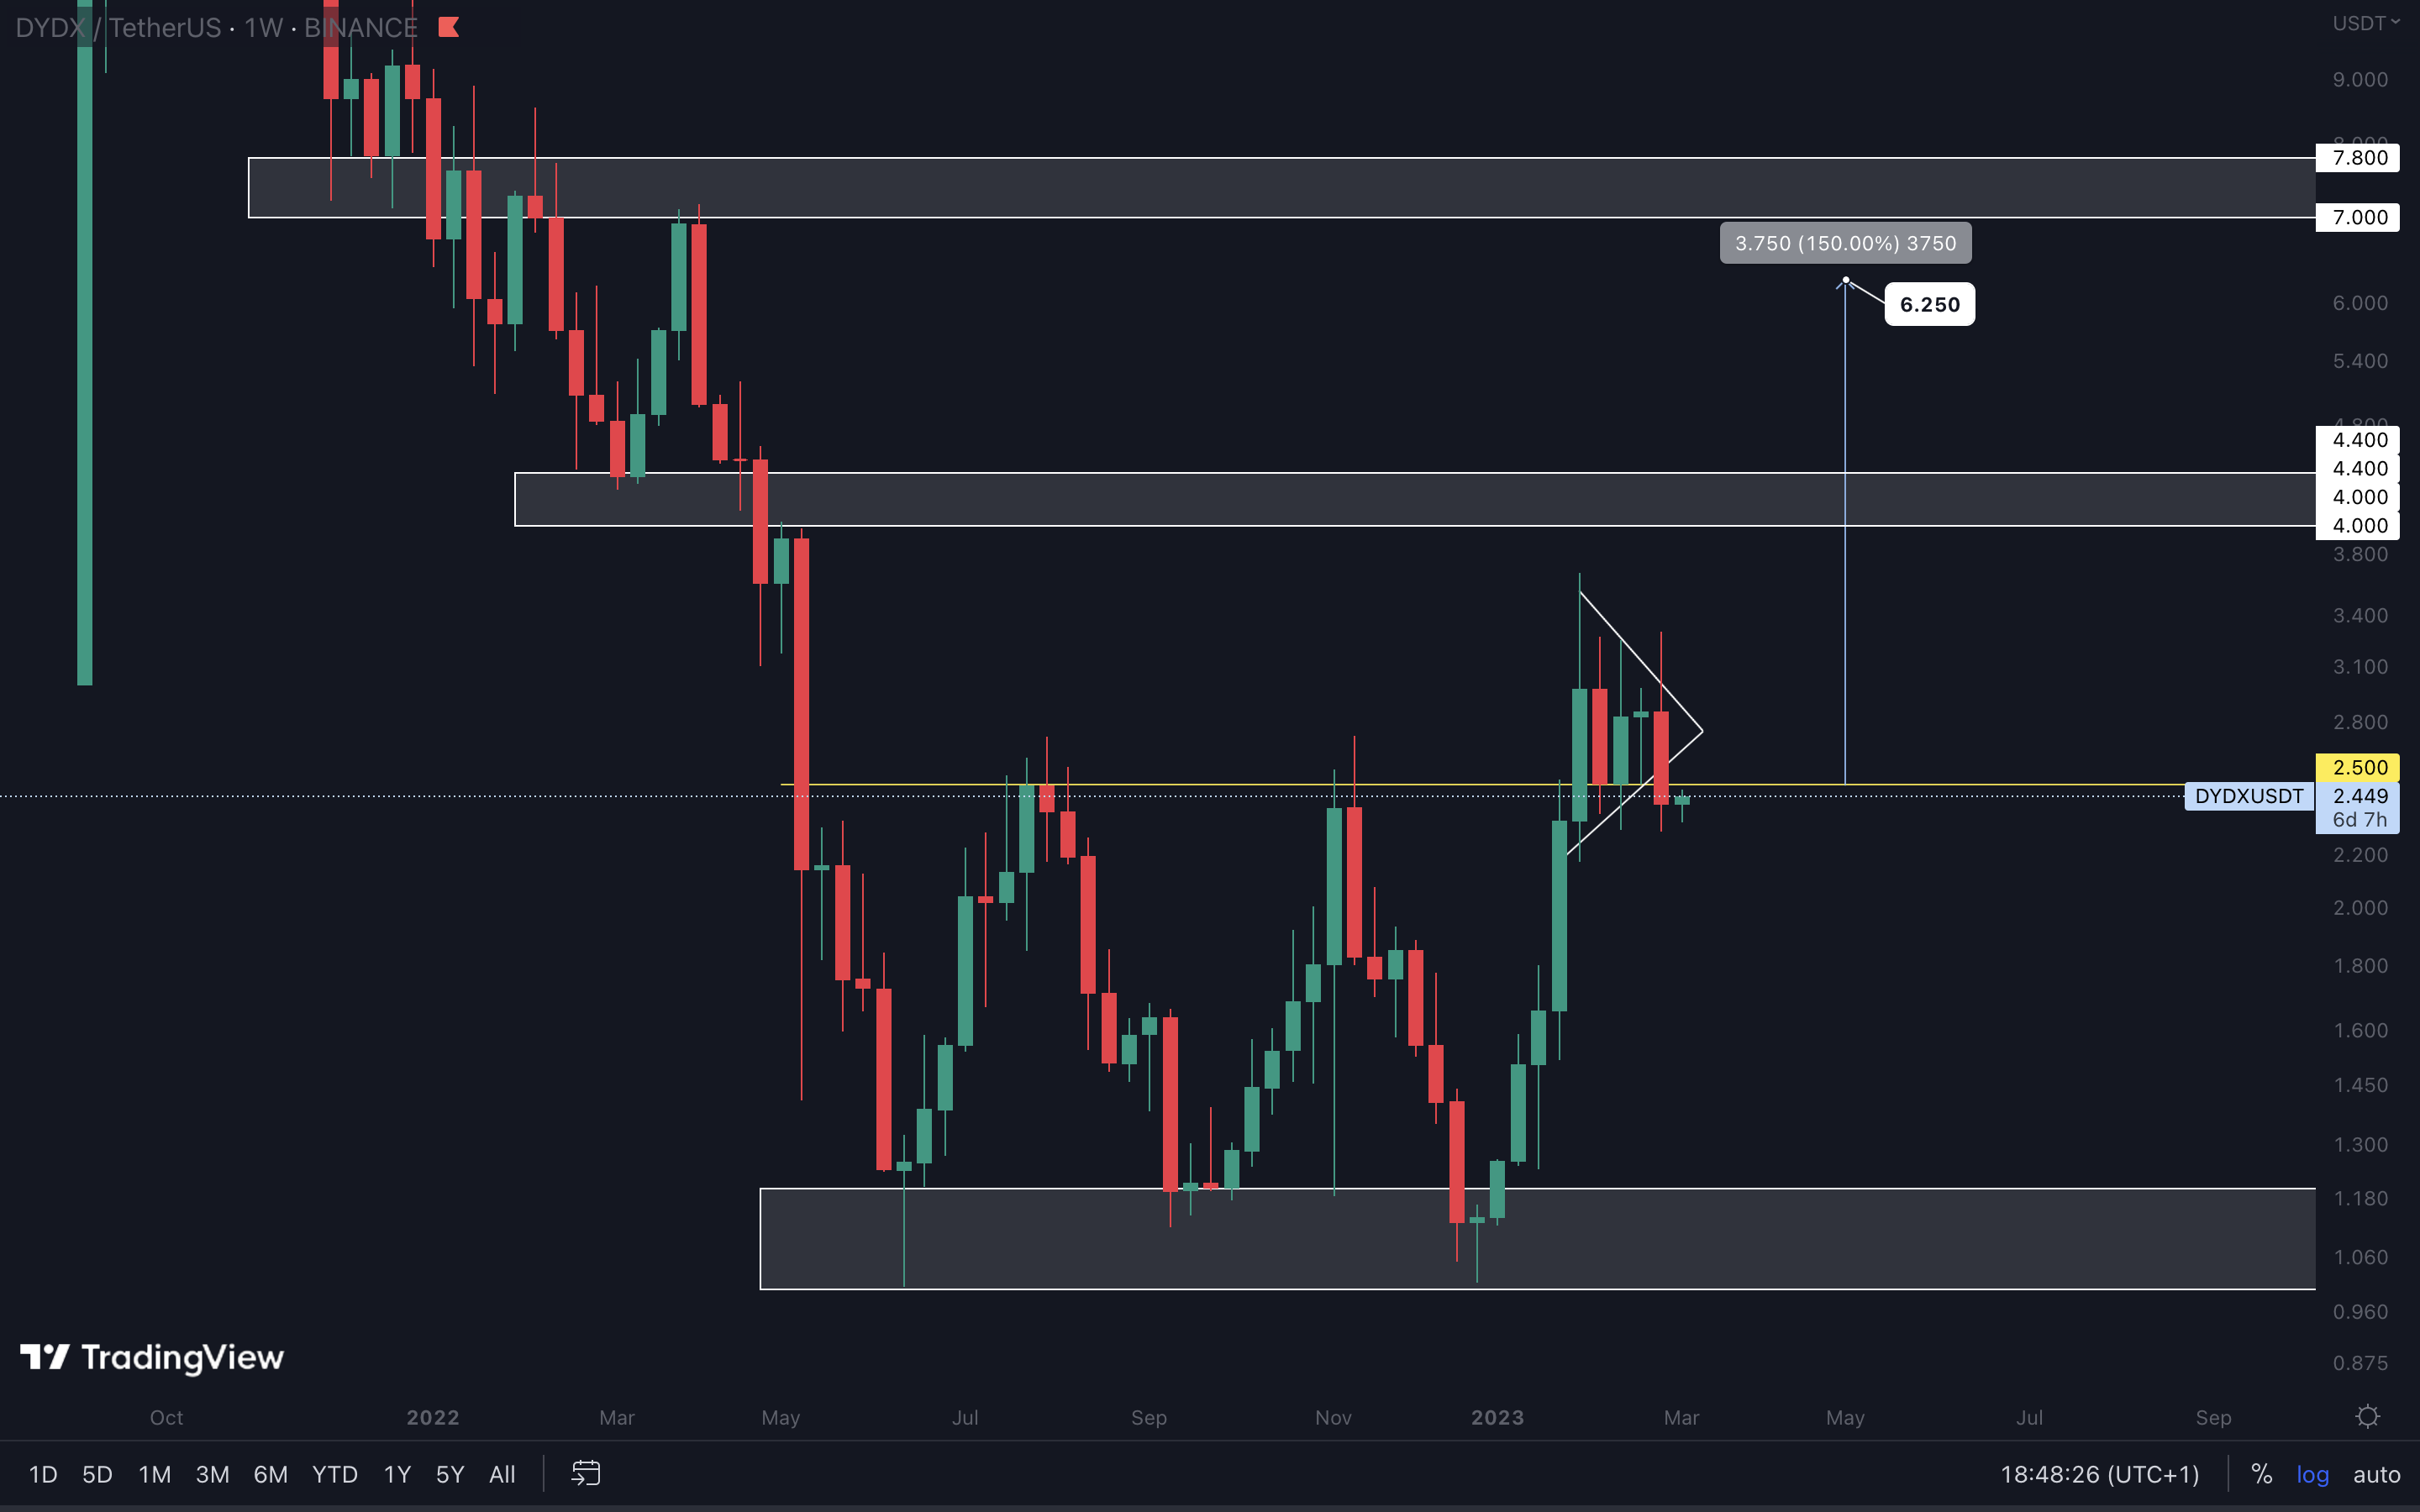
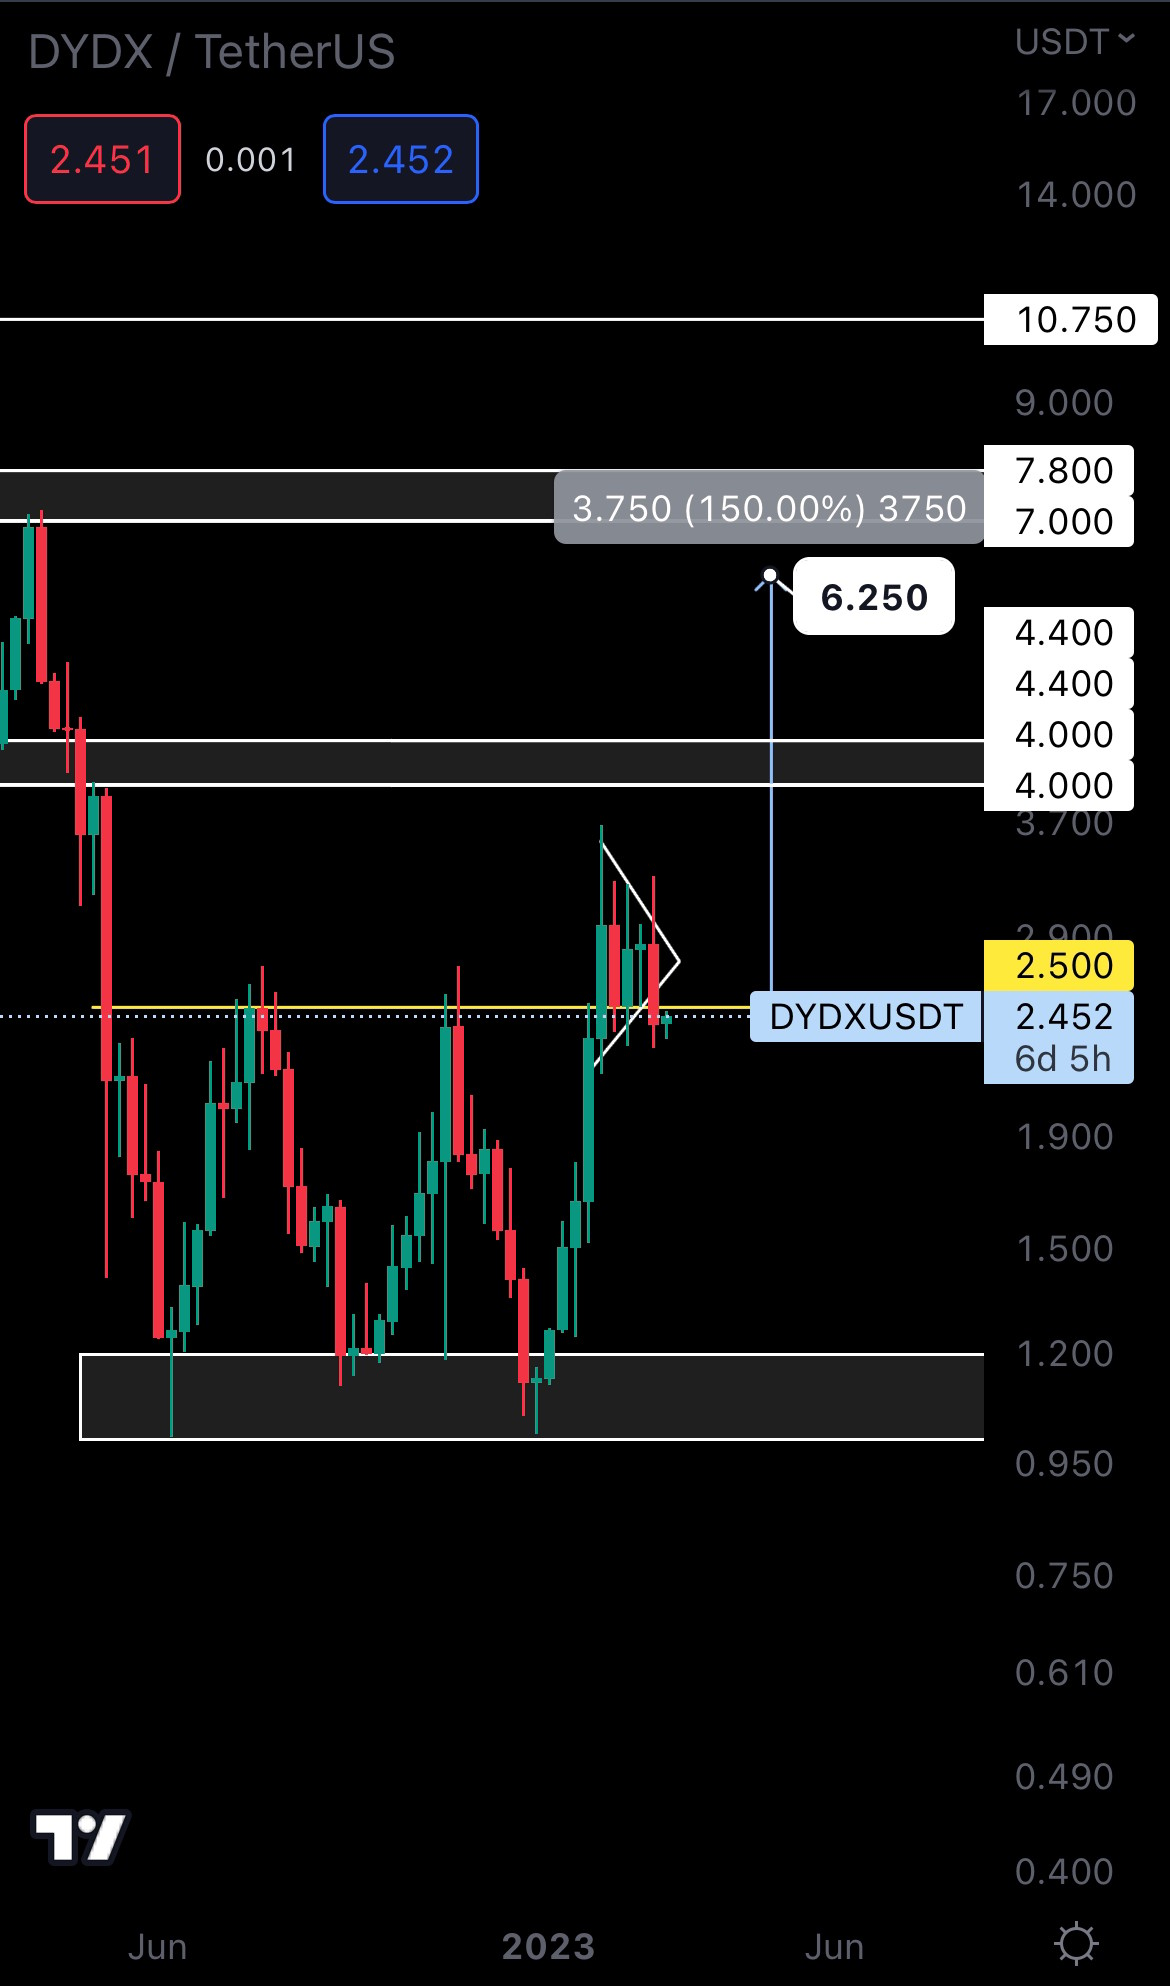
From a technical standpoint, DYDX’s weekly closure under $2.50 has invalidated the triple bottom, as well as its targets. The road to $4 - $4.40 has been invalidated for the time being. In the meantime, DYDX will drop or rise in confluence with the market which means it’s all in Bitcoin’s hands. If the asset reclaims $2.50 once again, then we’re back on track for $4.
Cryptonary's Watchlist
DOT | Polkadot (Weekly)
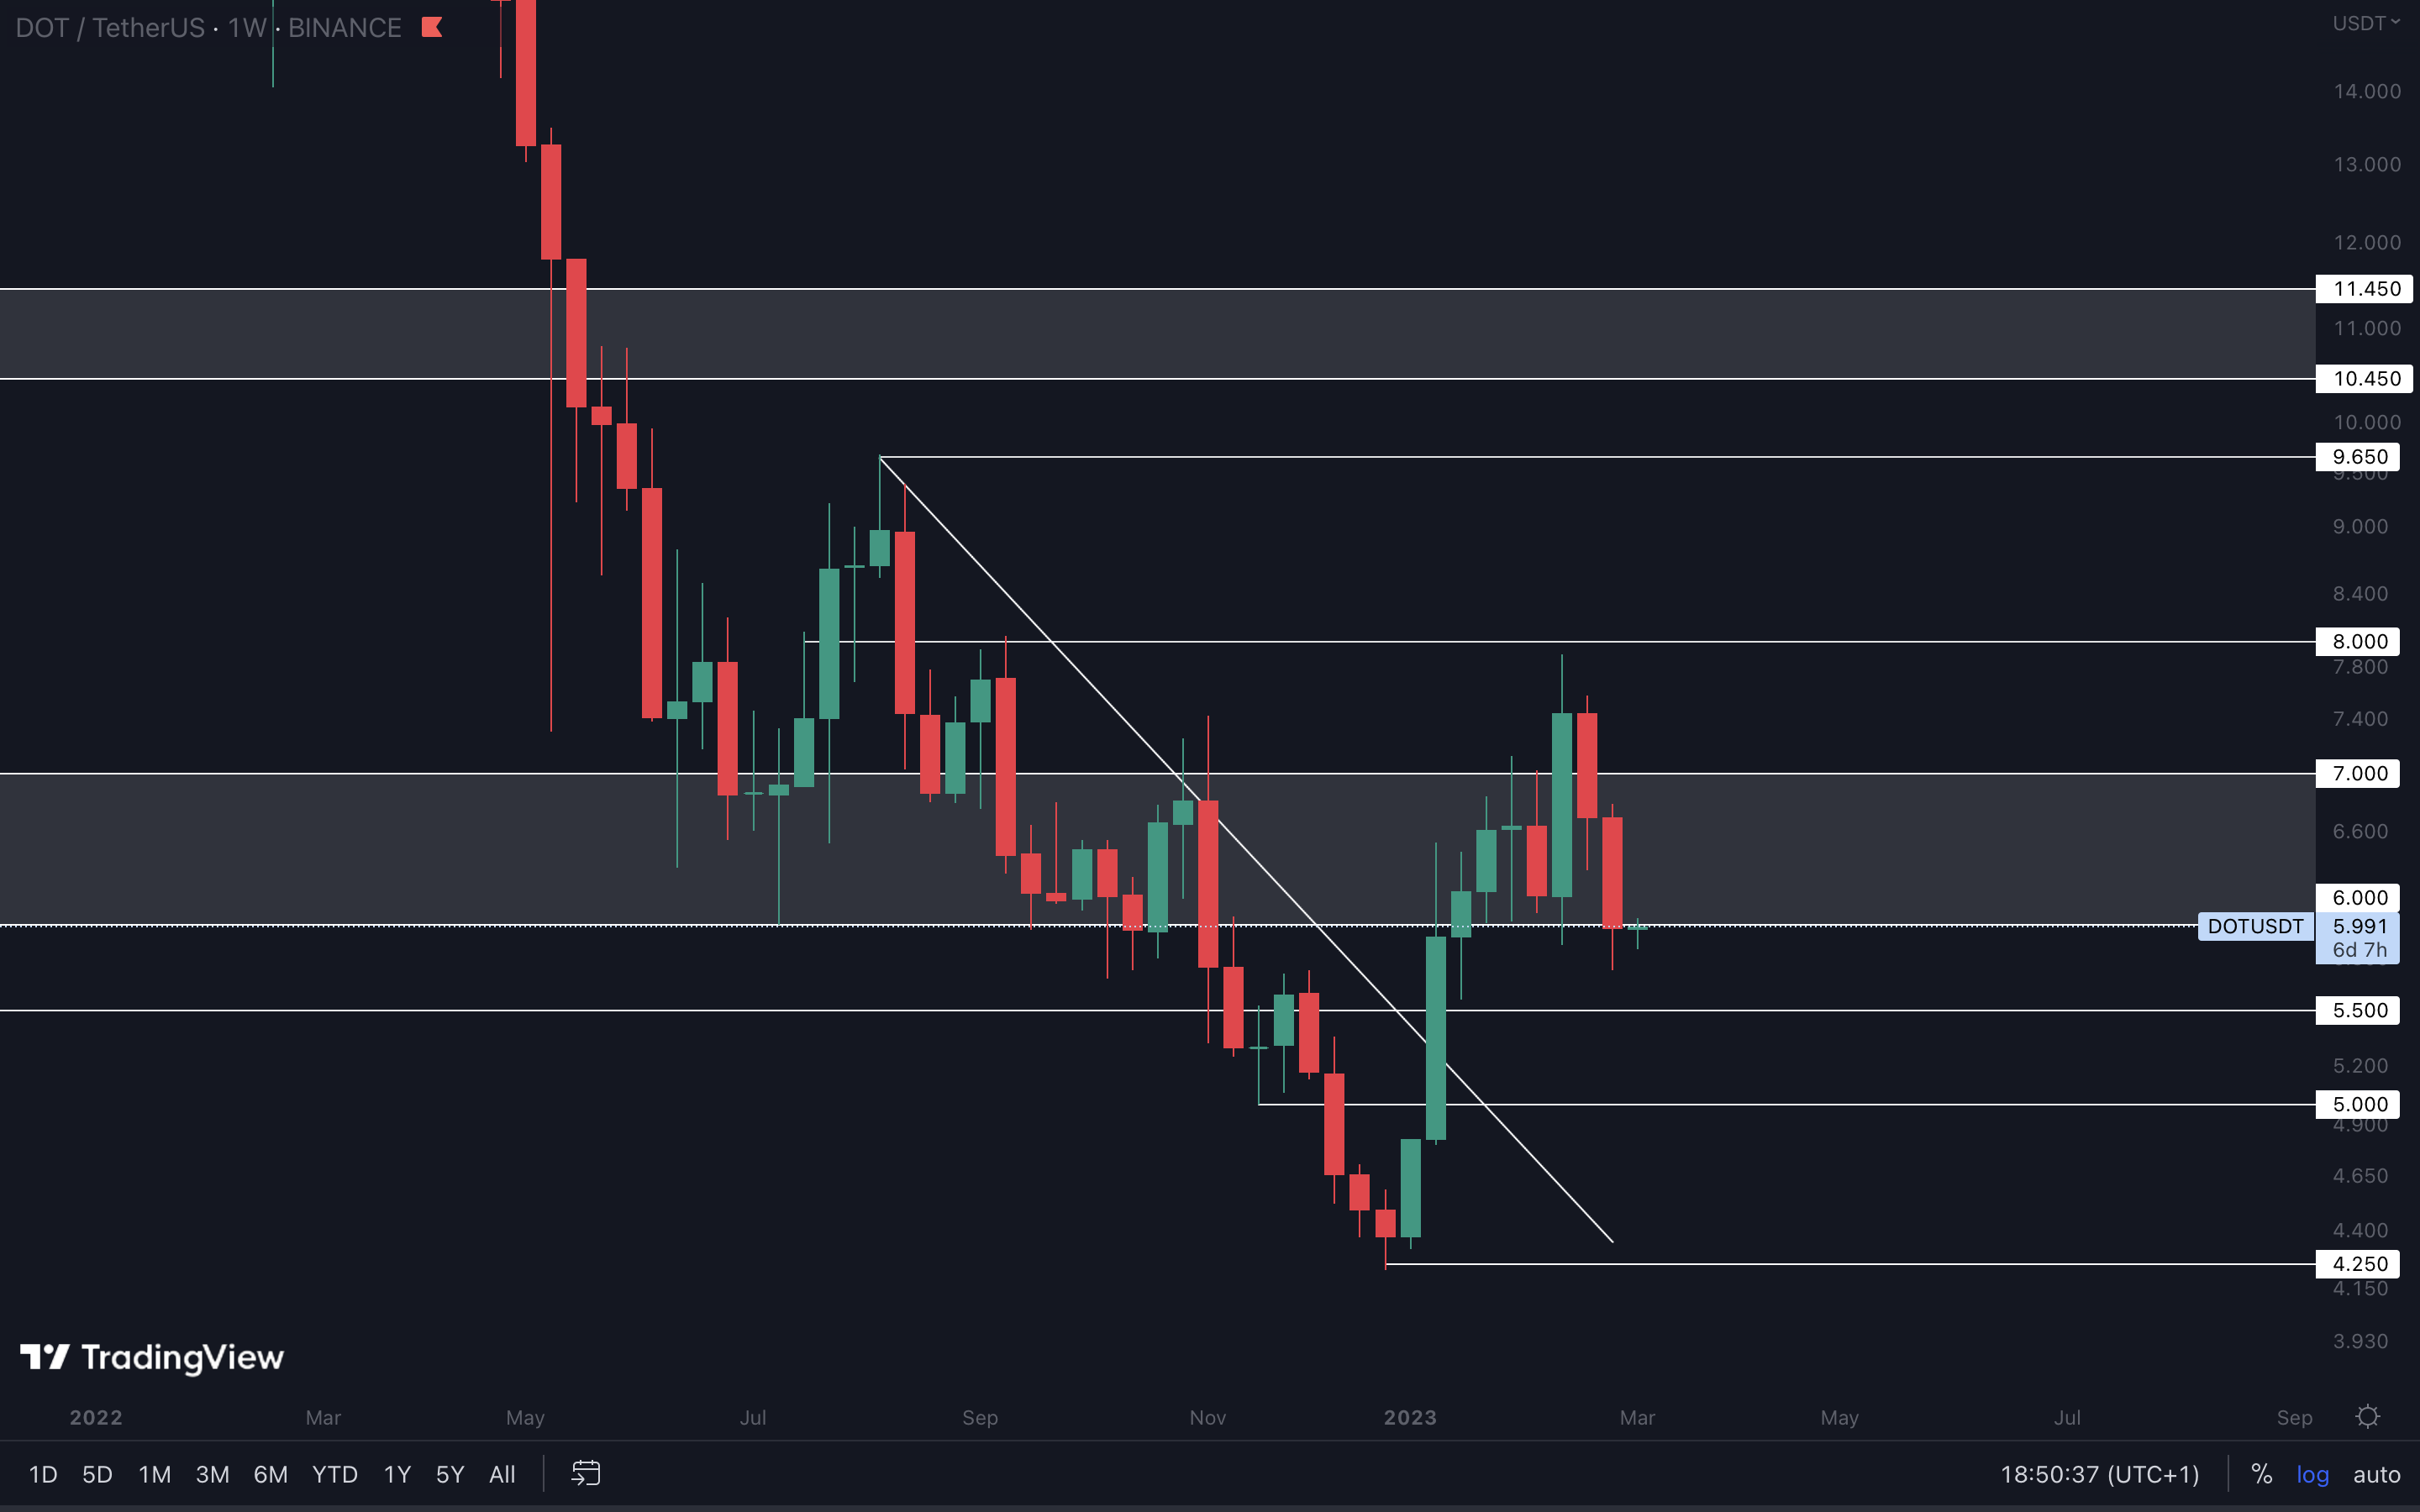
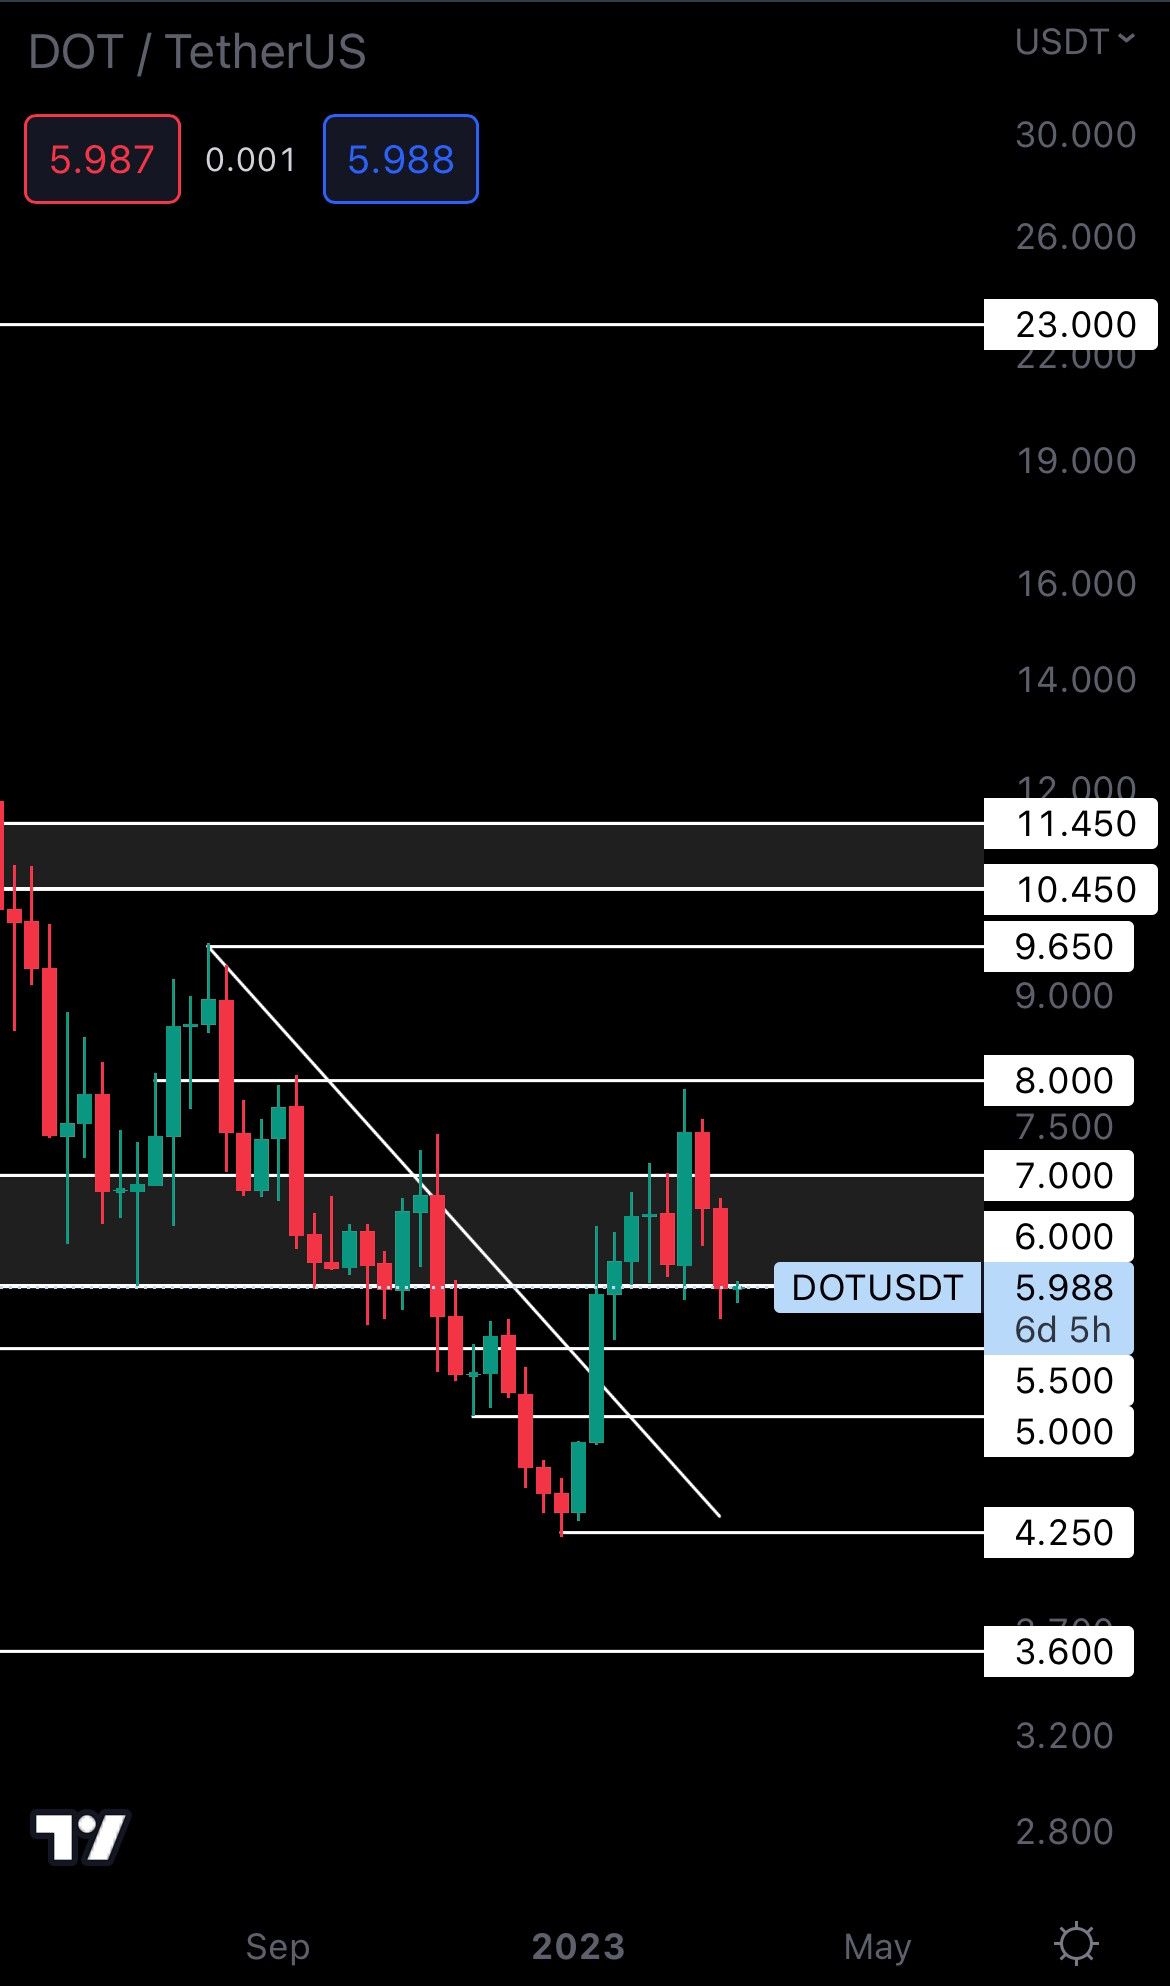
While DOT briefly closed last week’s candle under $6, we can’t count this as “successfully held support”. We’ll have to wait for DOT to close back above $6 to confirm a move to $7, otherwise, either direction is possible.
SYN | Synapse (Weekly)
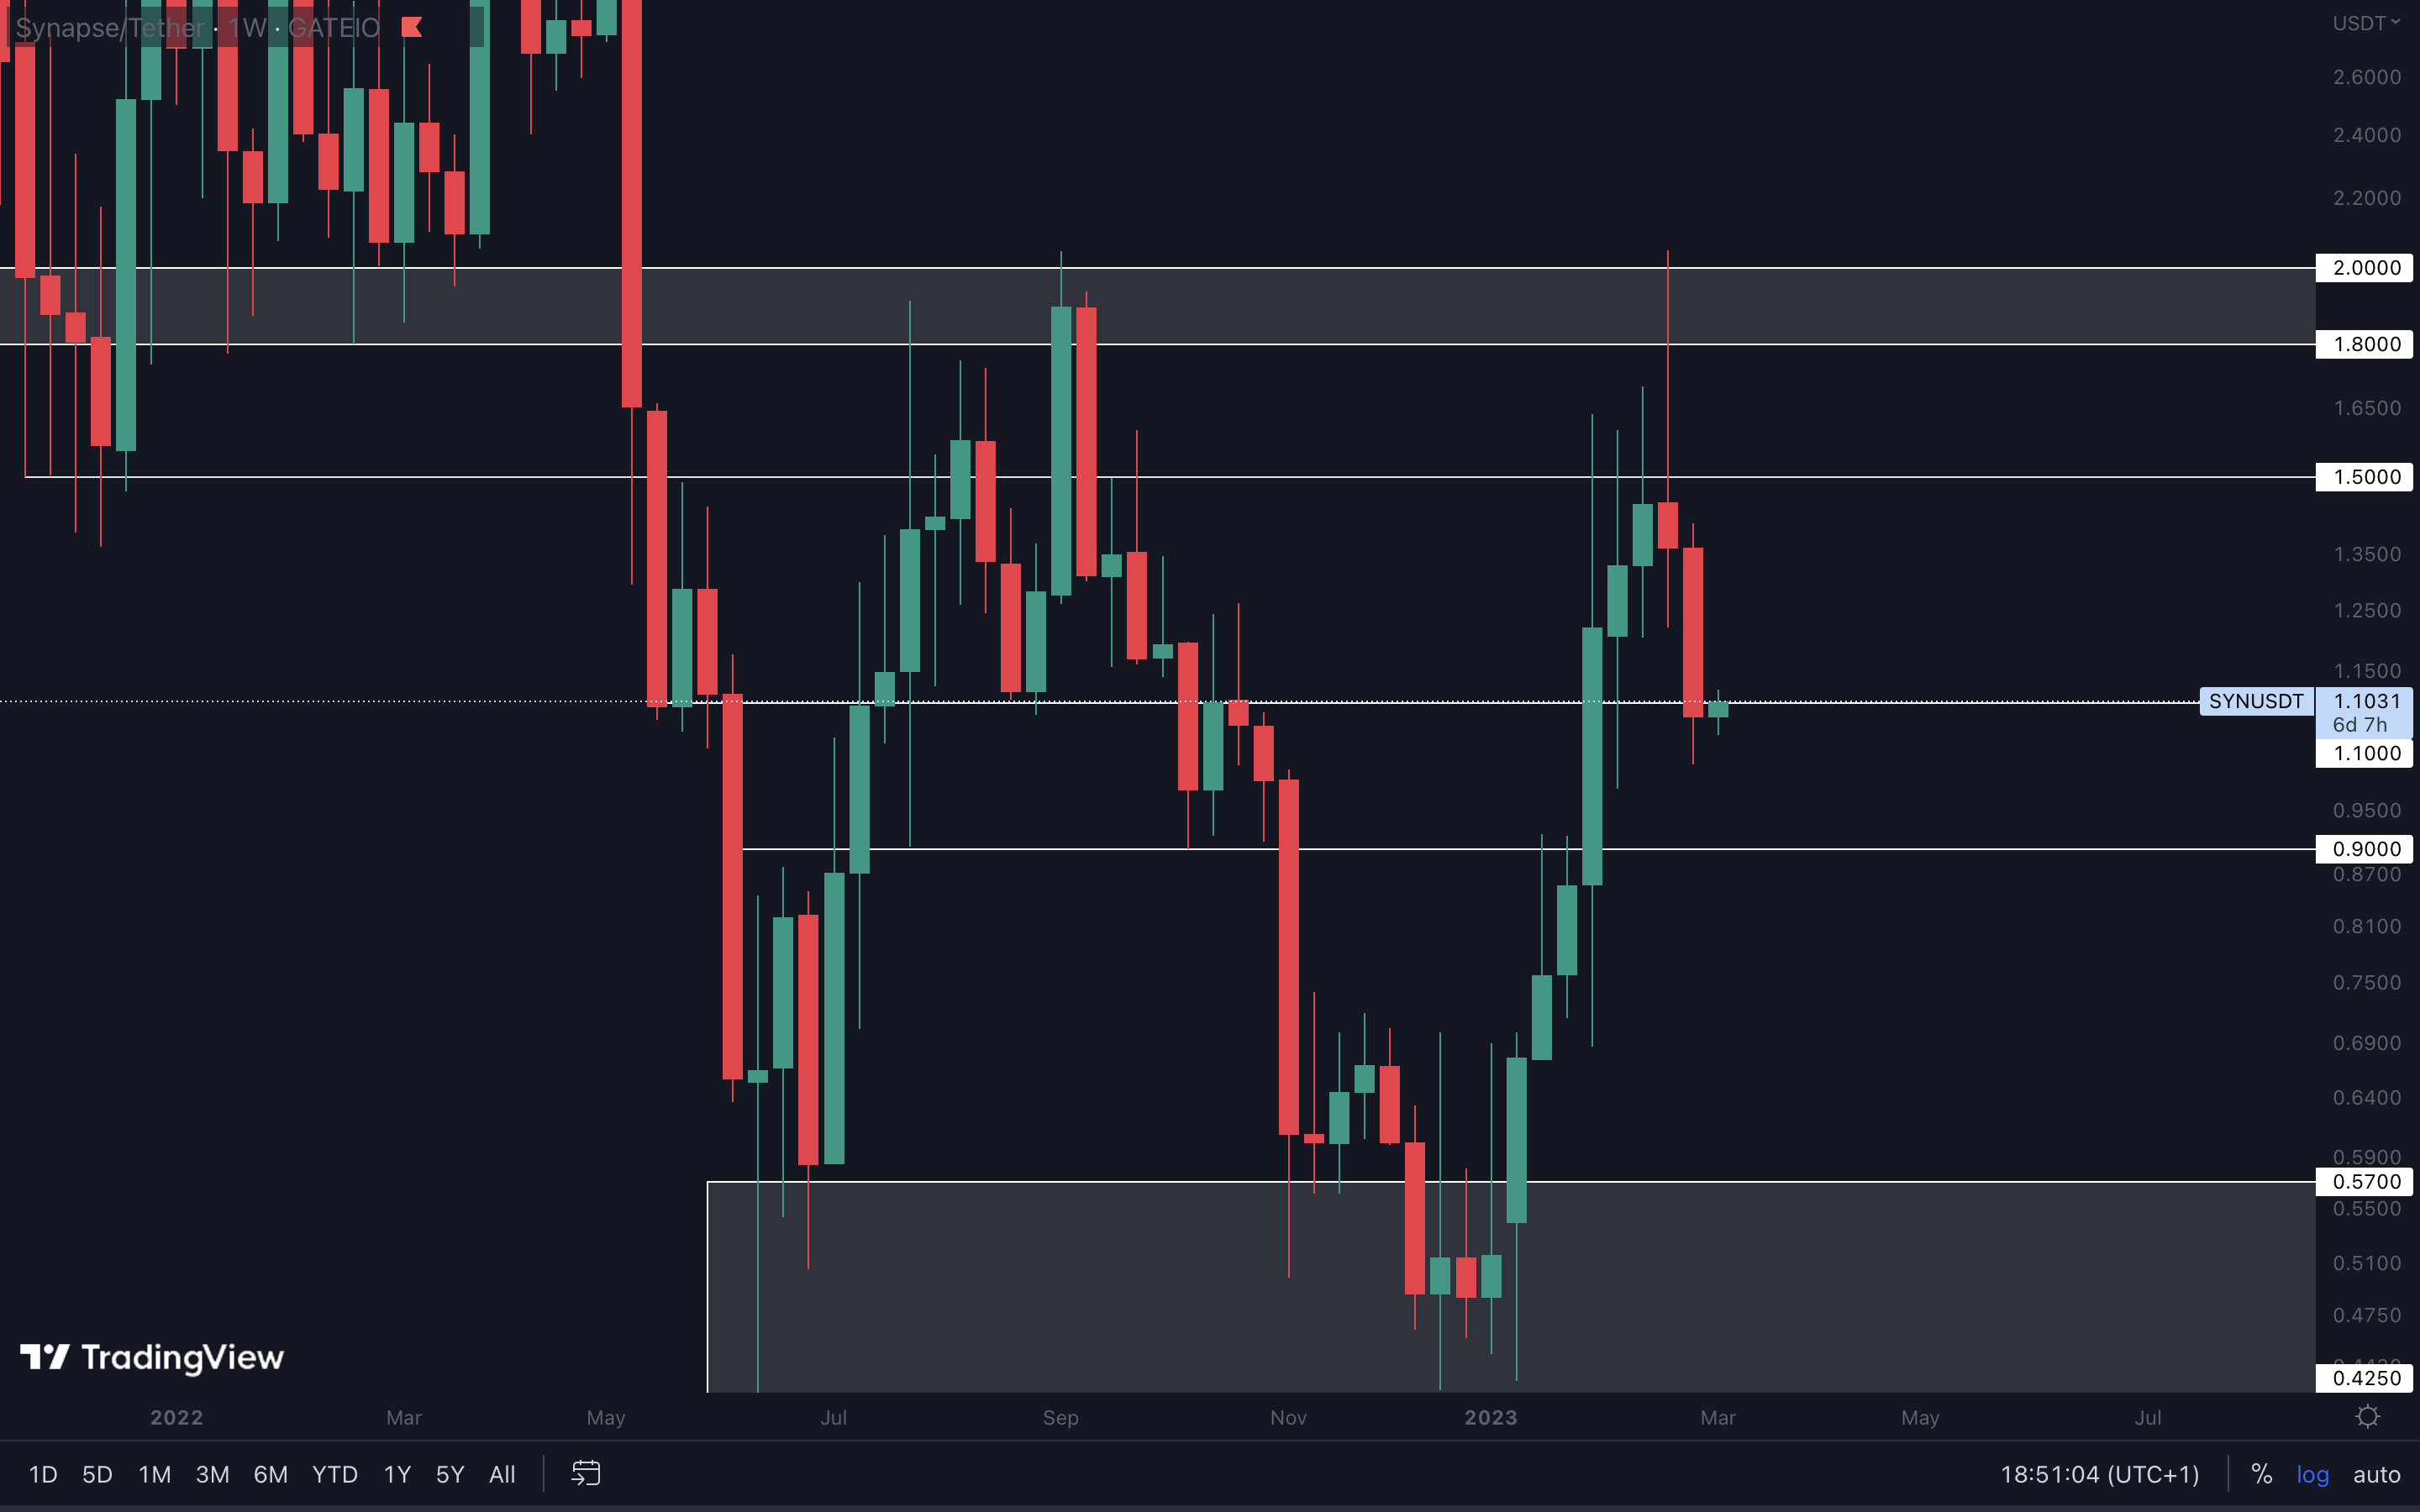
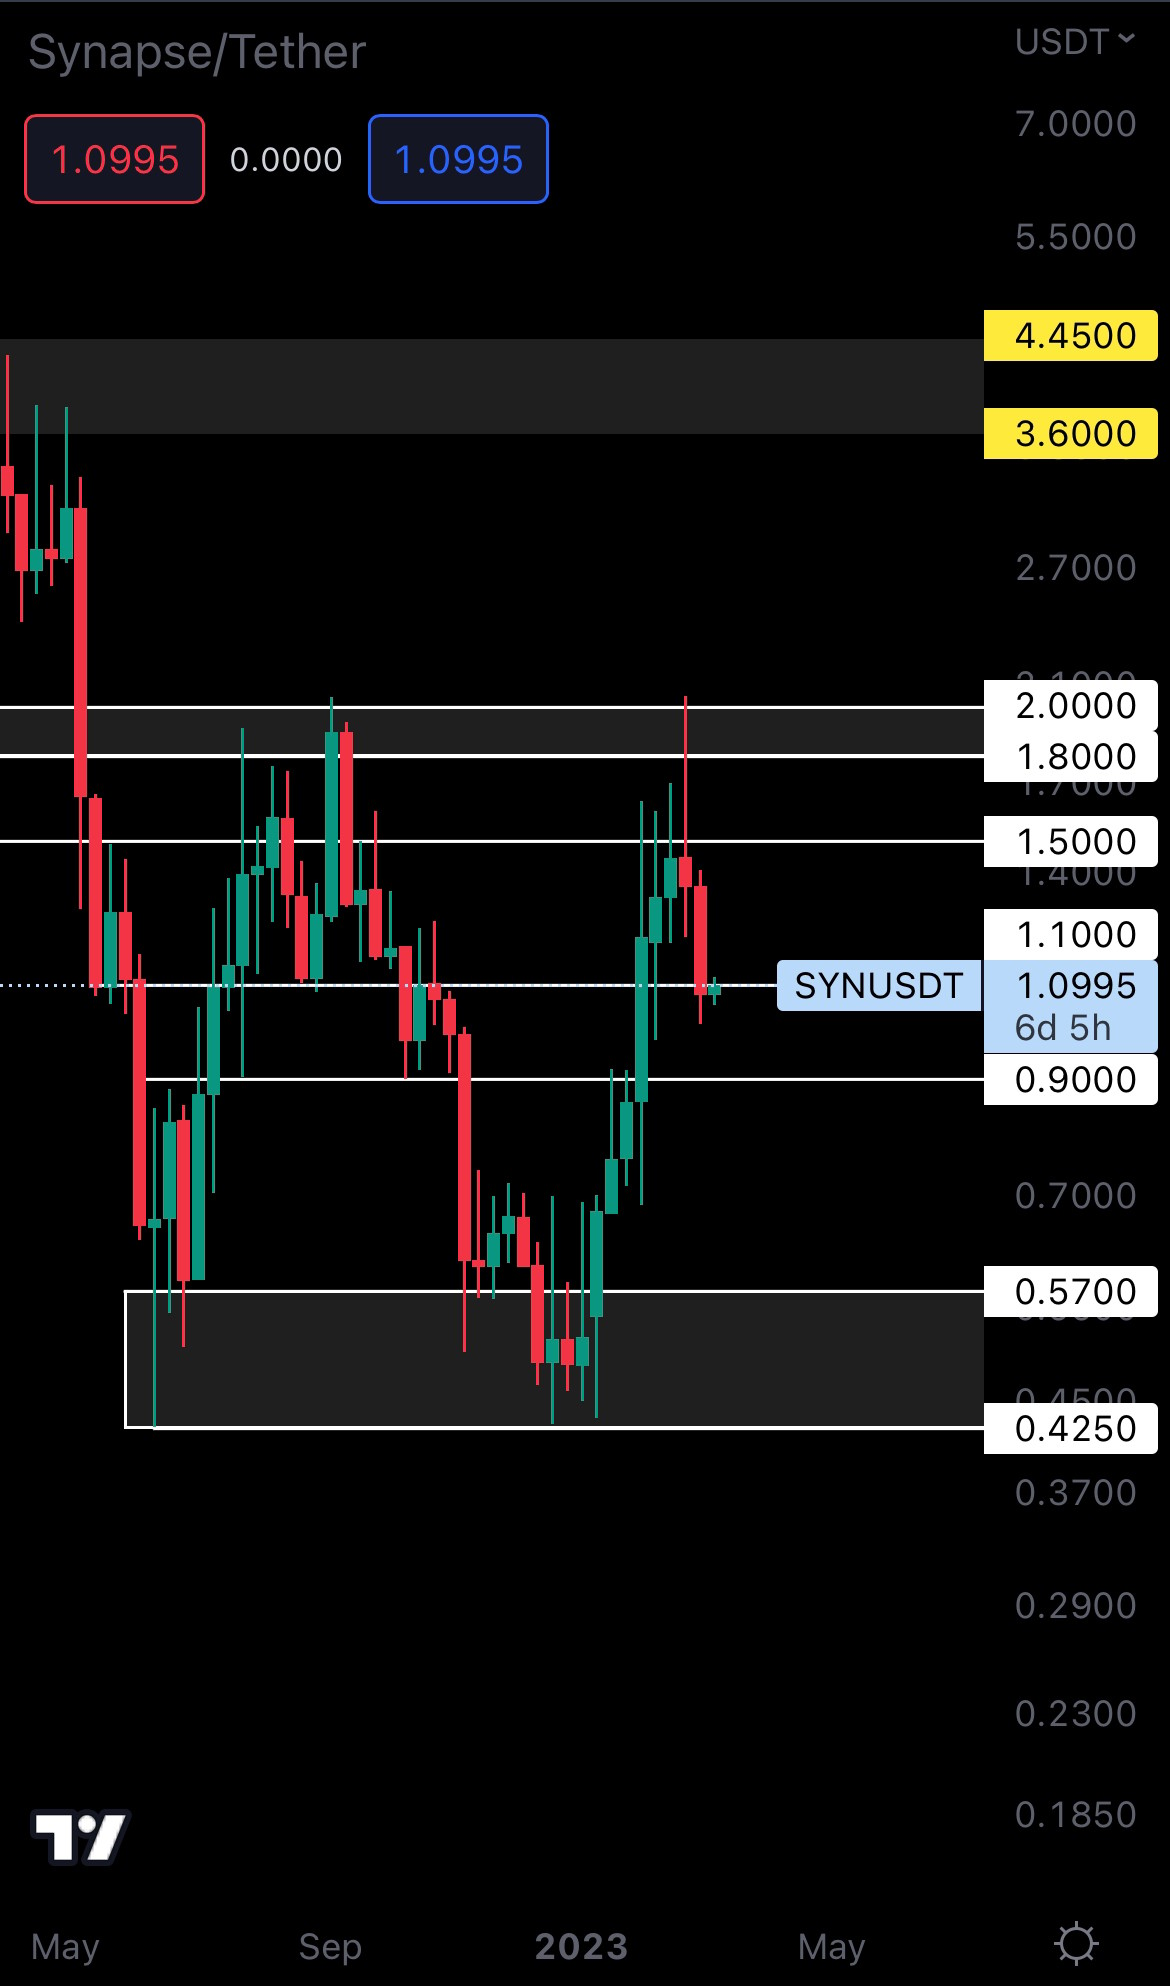
SYN failed to close above $1.10, which has put it on track to $0.90. An invalidation of this scenario would occur if SYN closes a weekly candle back above $1.10.
OP | Optimism (Weekly)
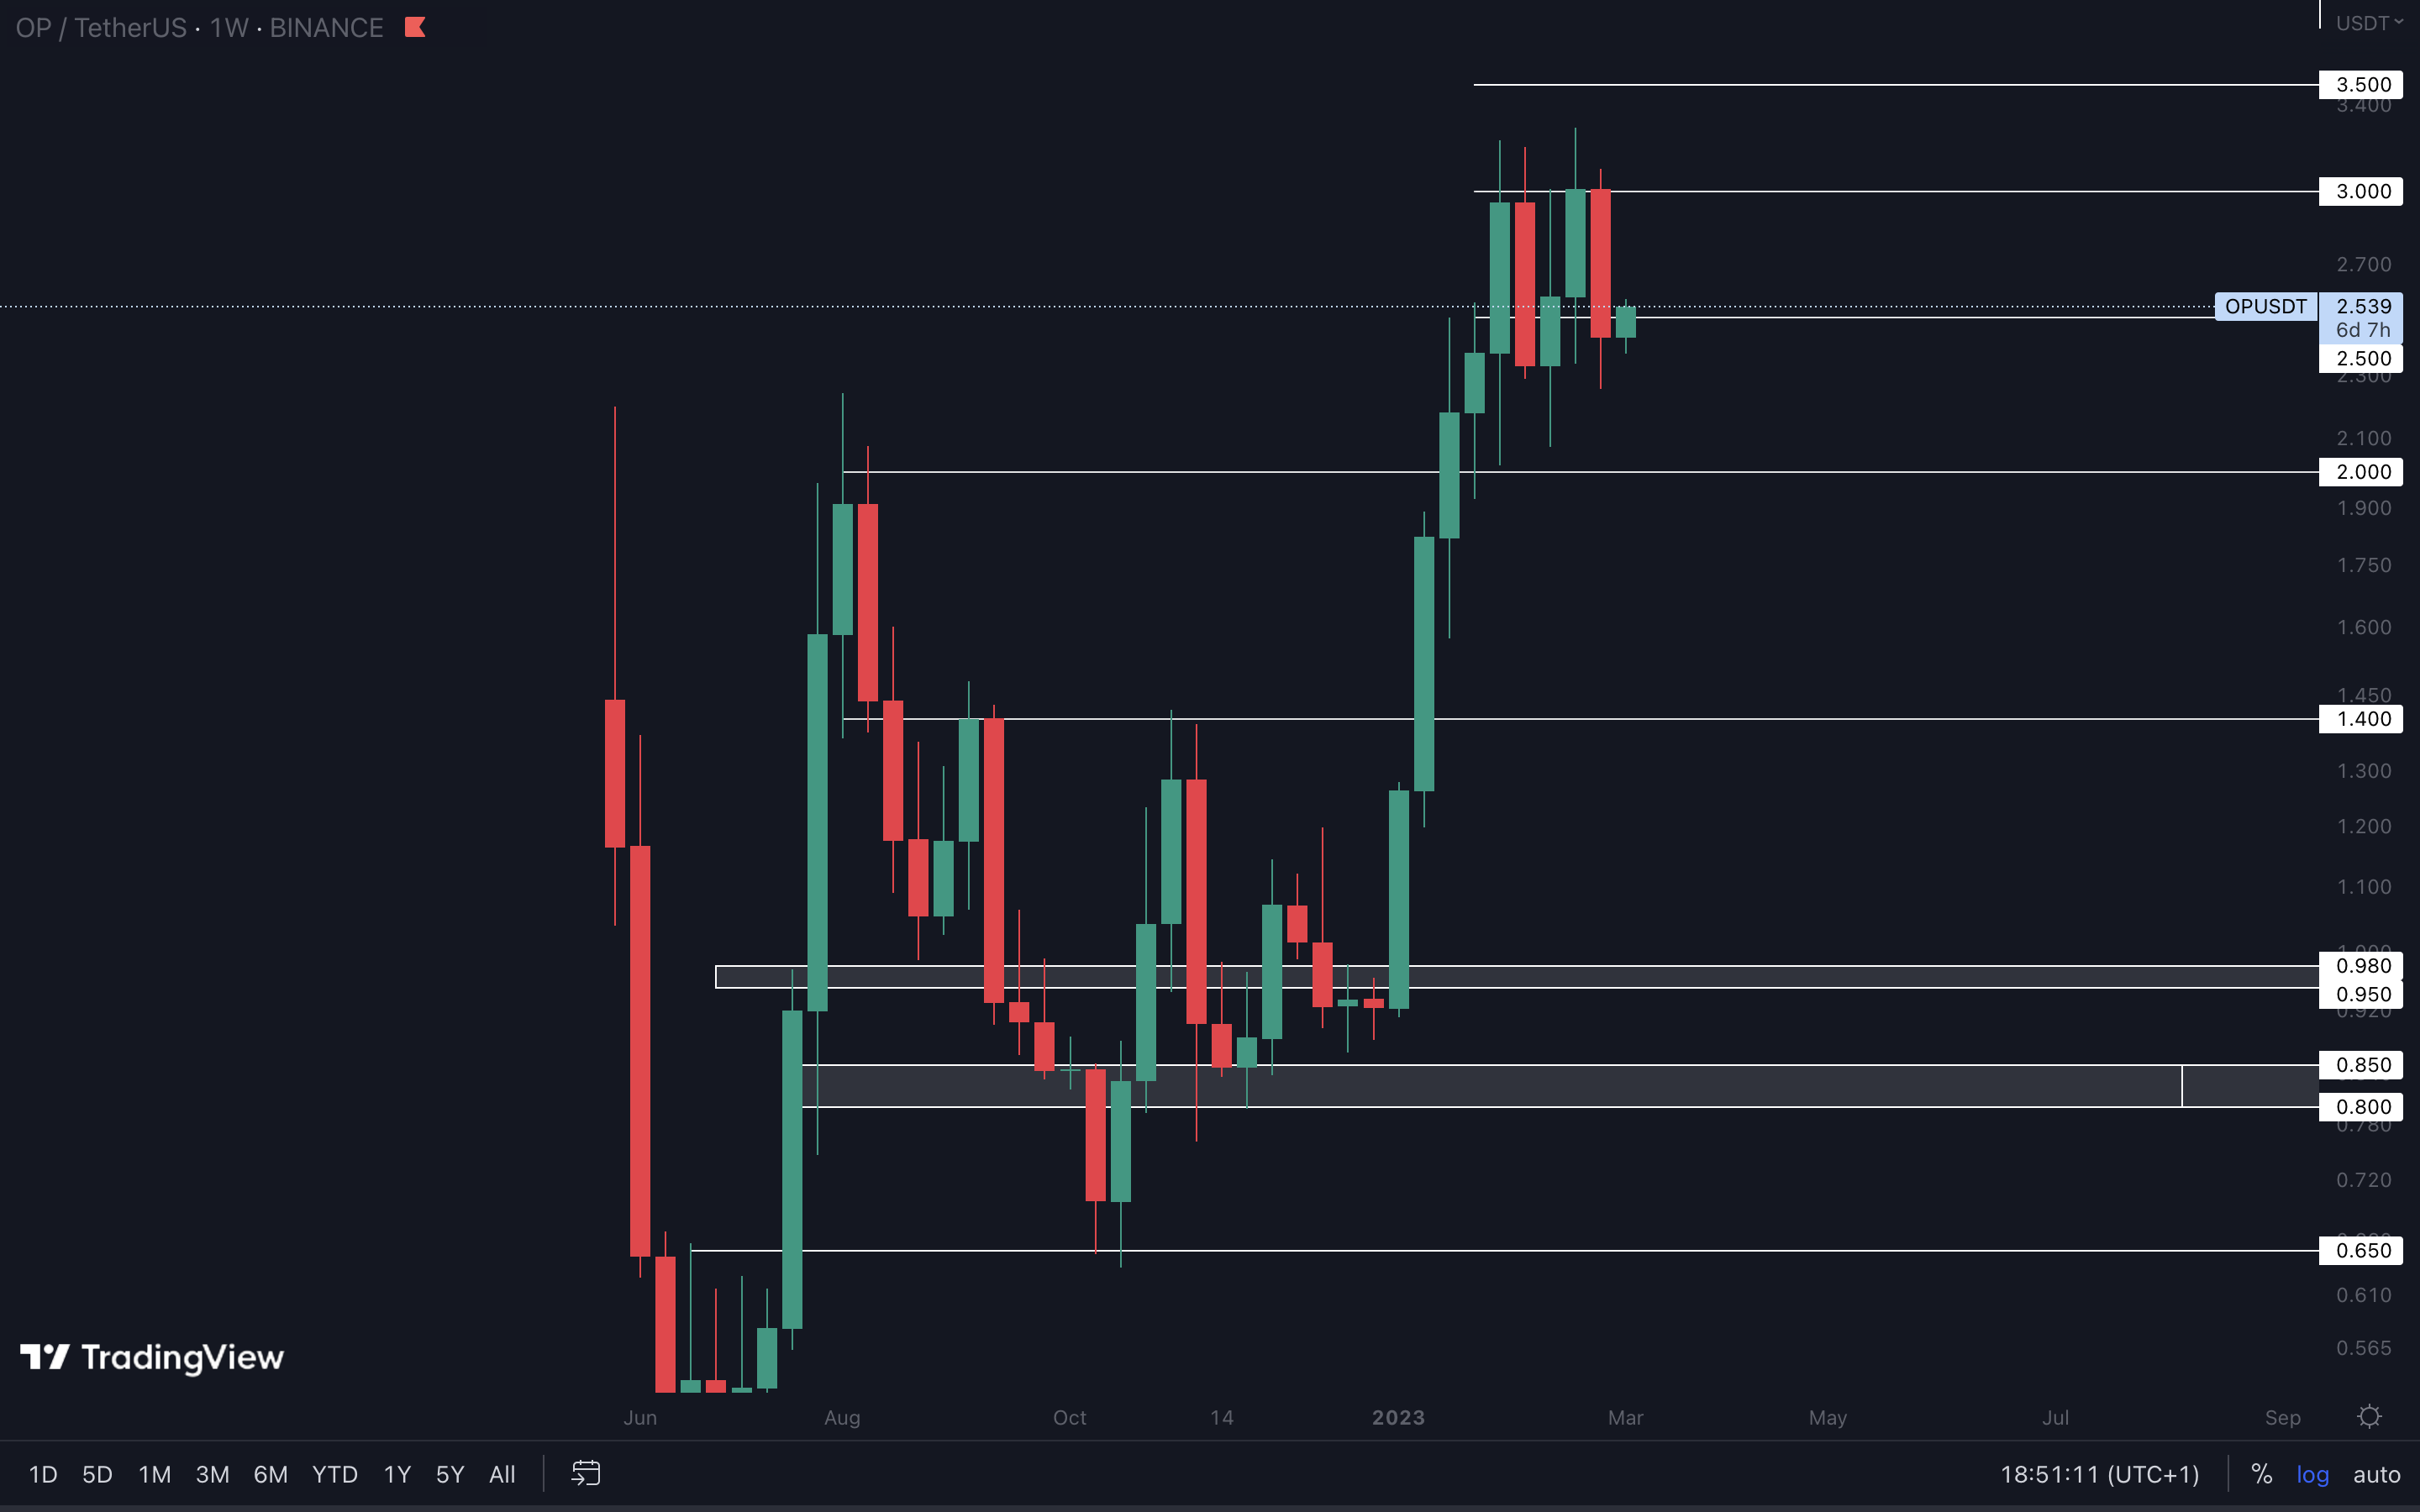
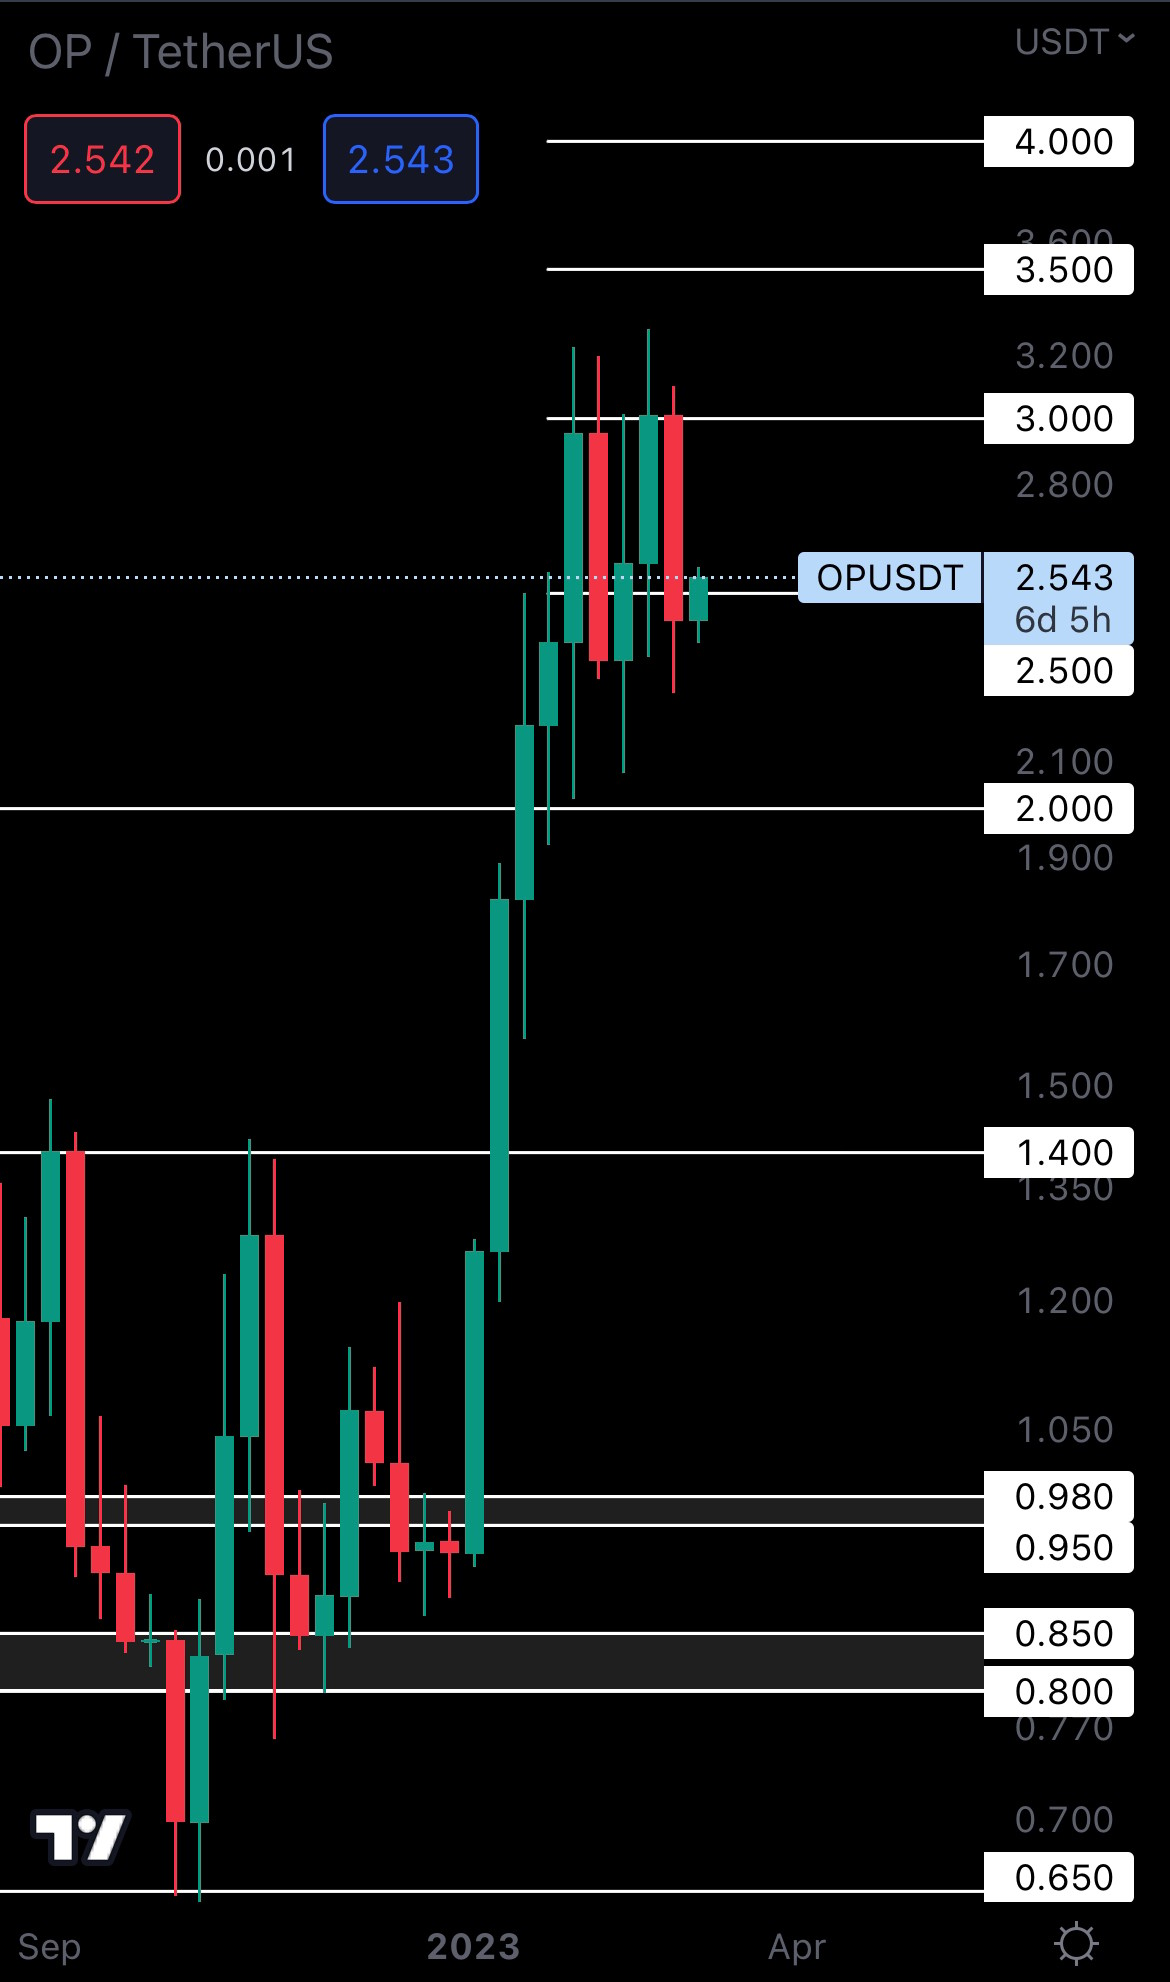
OP had multiple attempts at breaking above $3 but all failed, so we can assume there’s some serious selling pressure at that level. This resulted in OP closing last week’s candle as a bearish engulfing under support, confirming a move to $2. An invalidation of this scenario would occur if OP closes a weekly candle back above $2.50, but a bearish engulfing is usually a strong signal. So, we might see OP reach $2 in the coming weeks.
LDO | Lido DAO (Weekly)
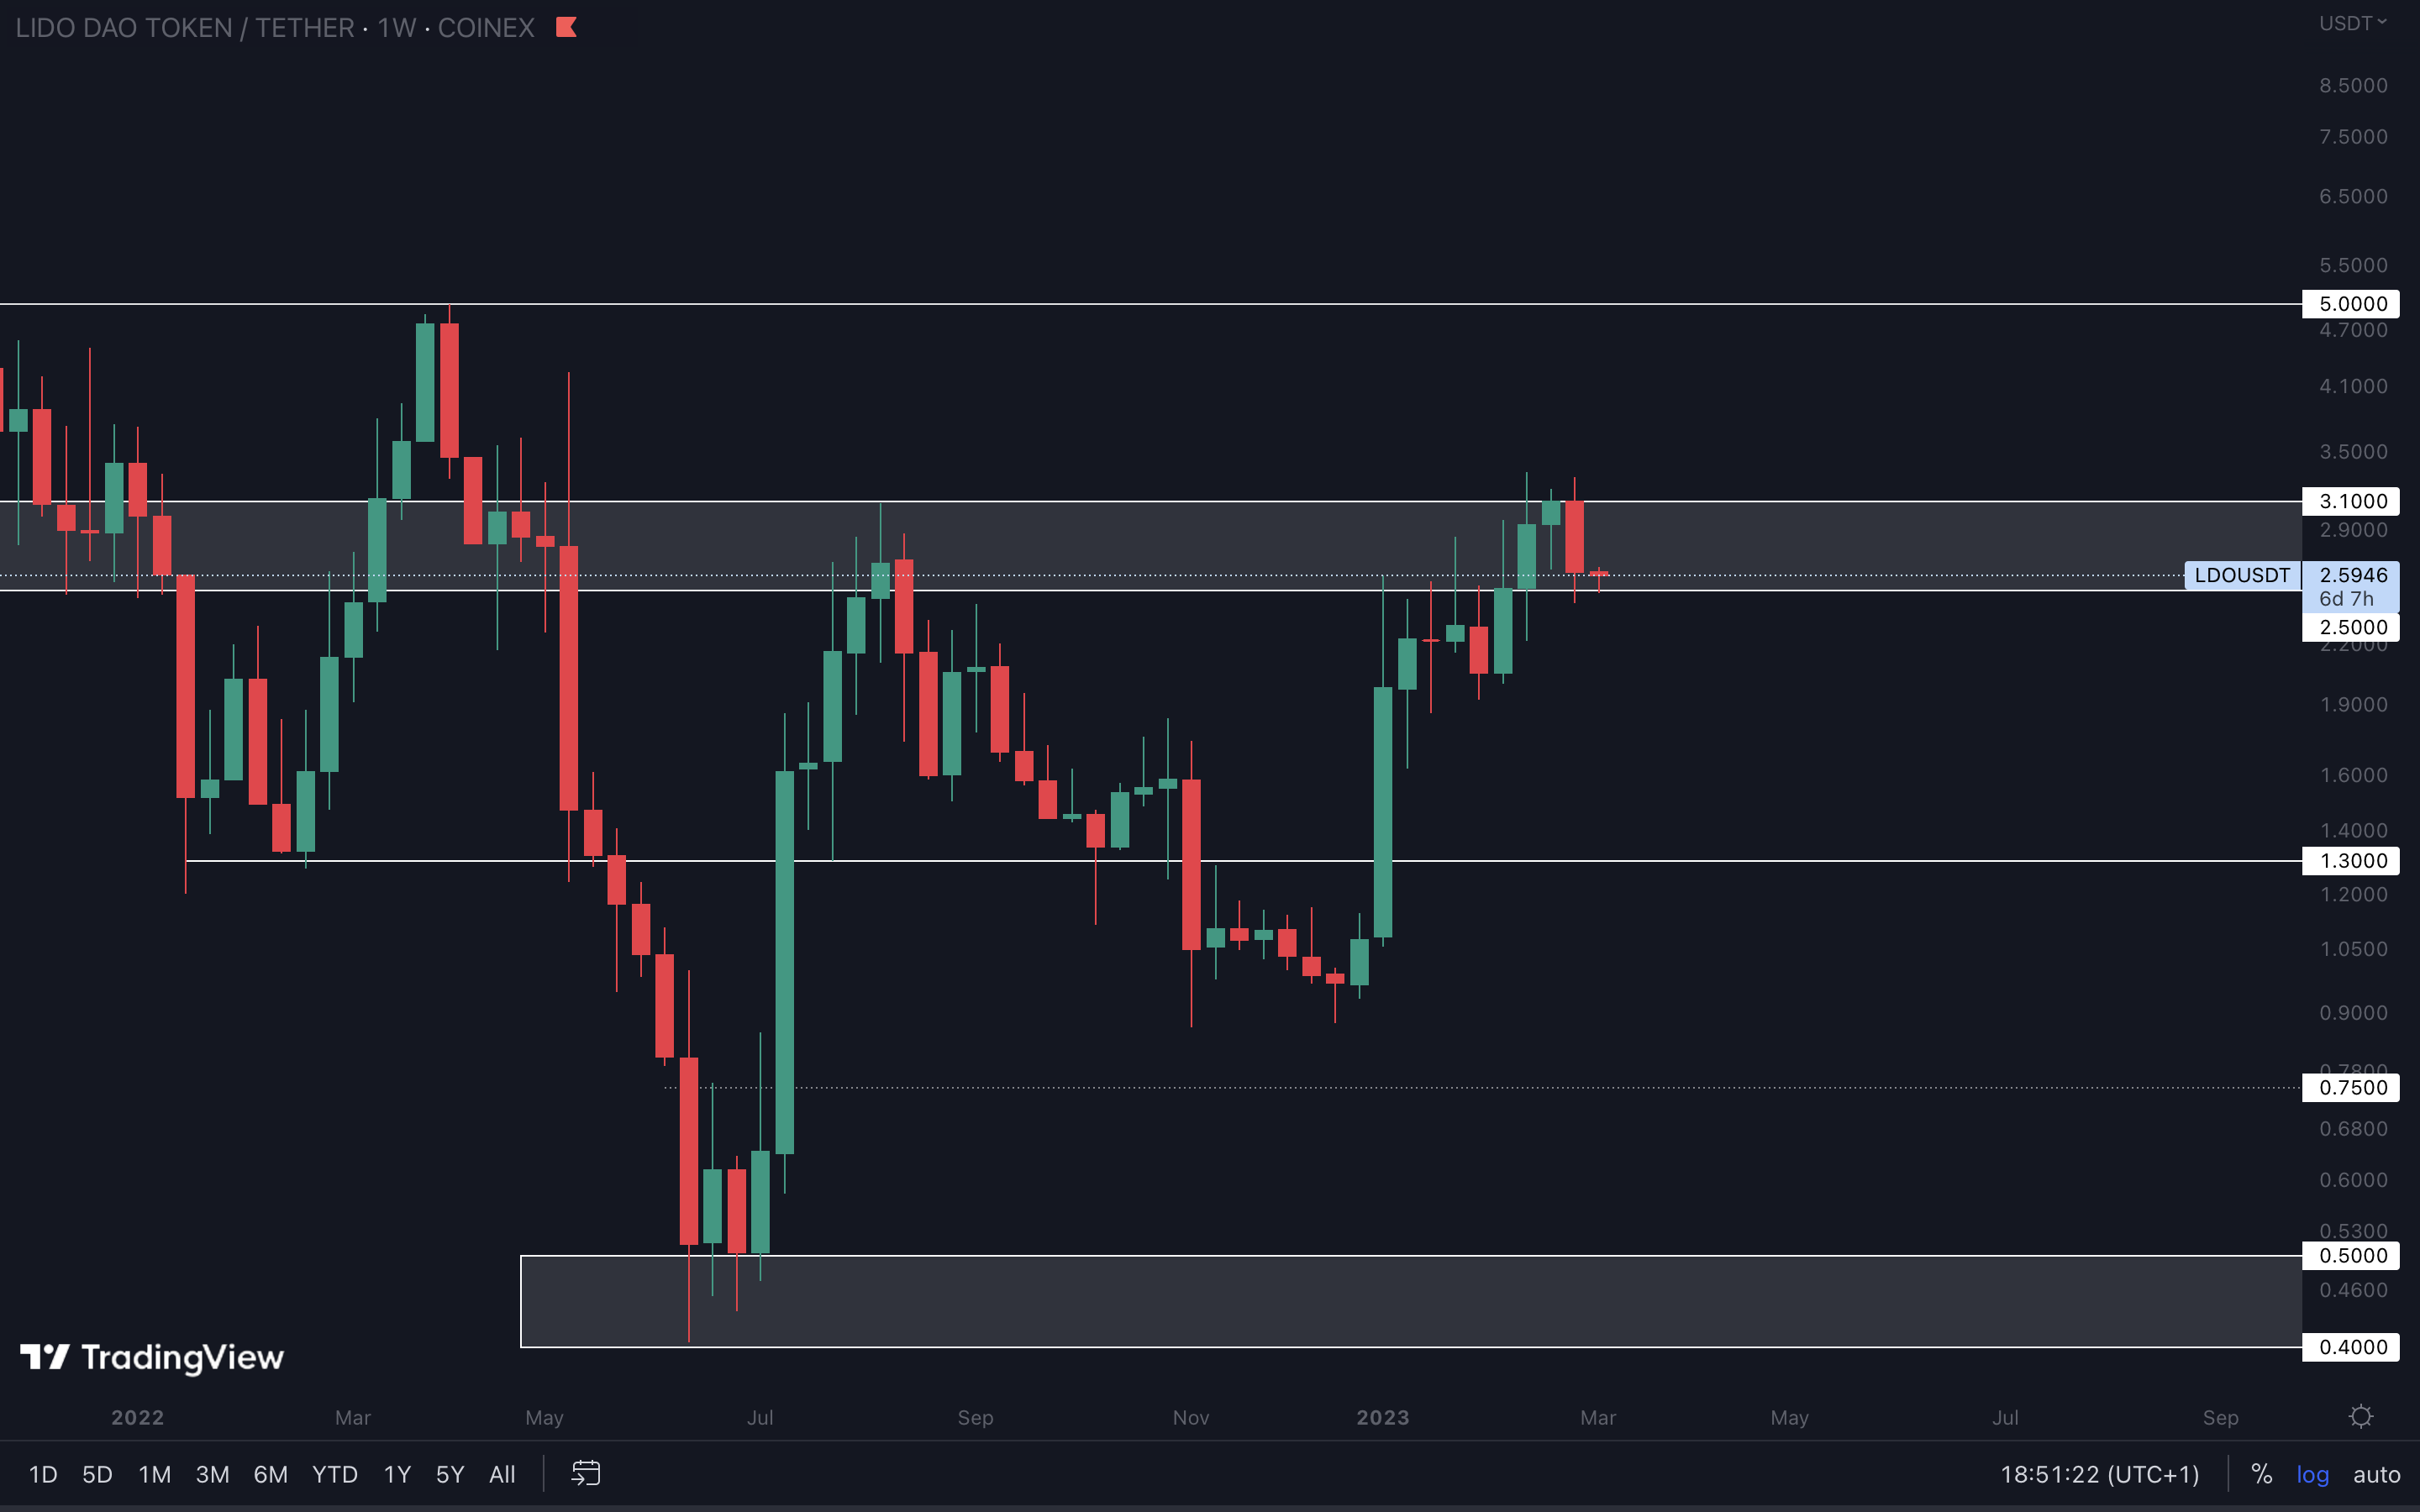
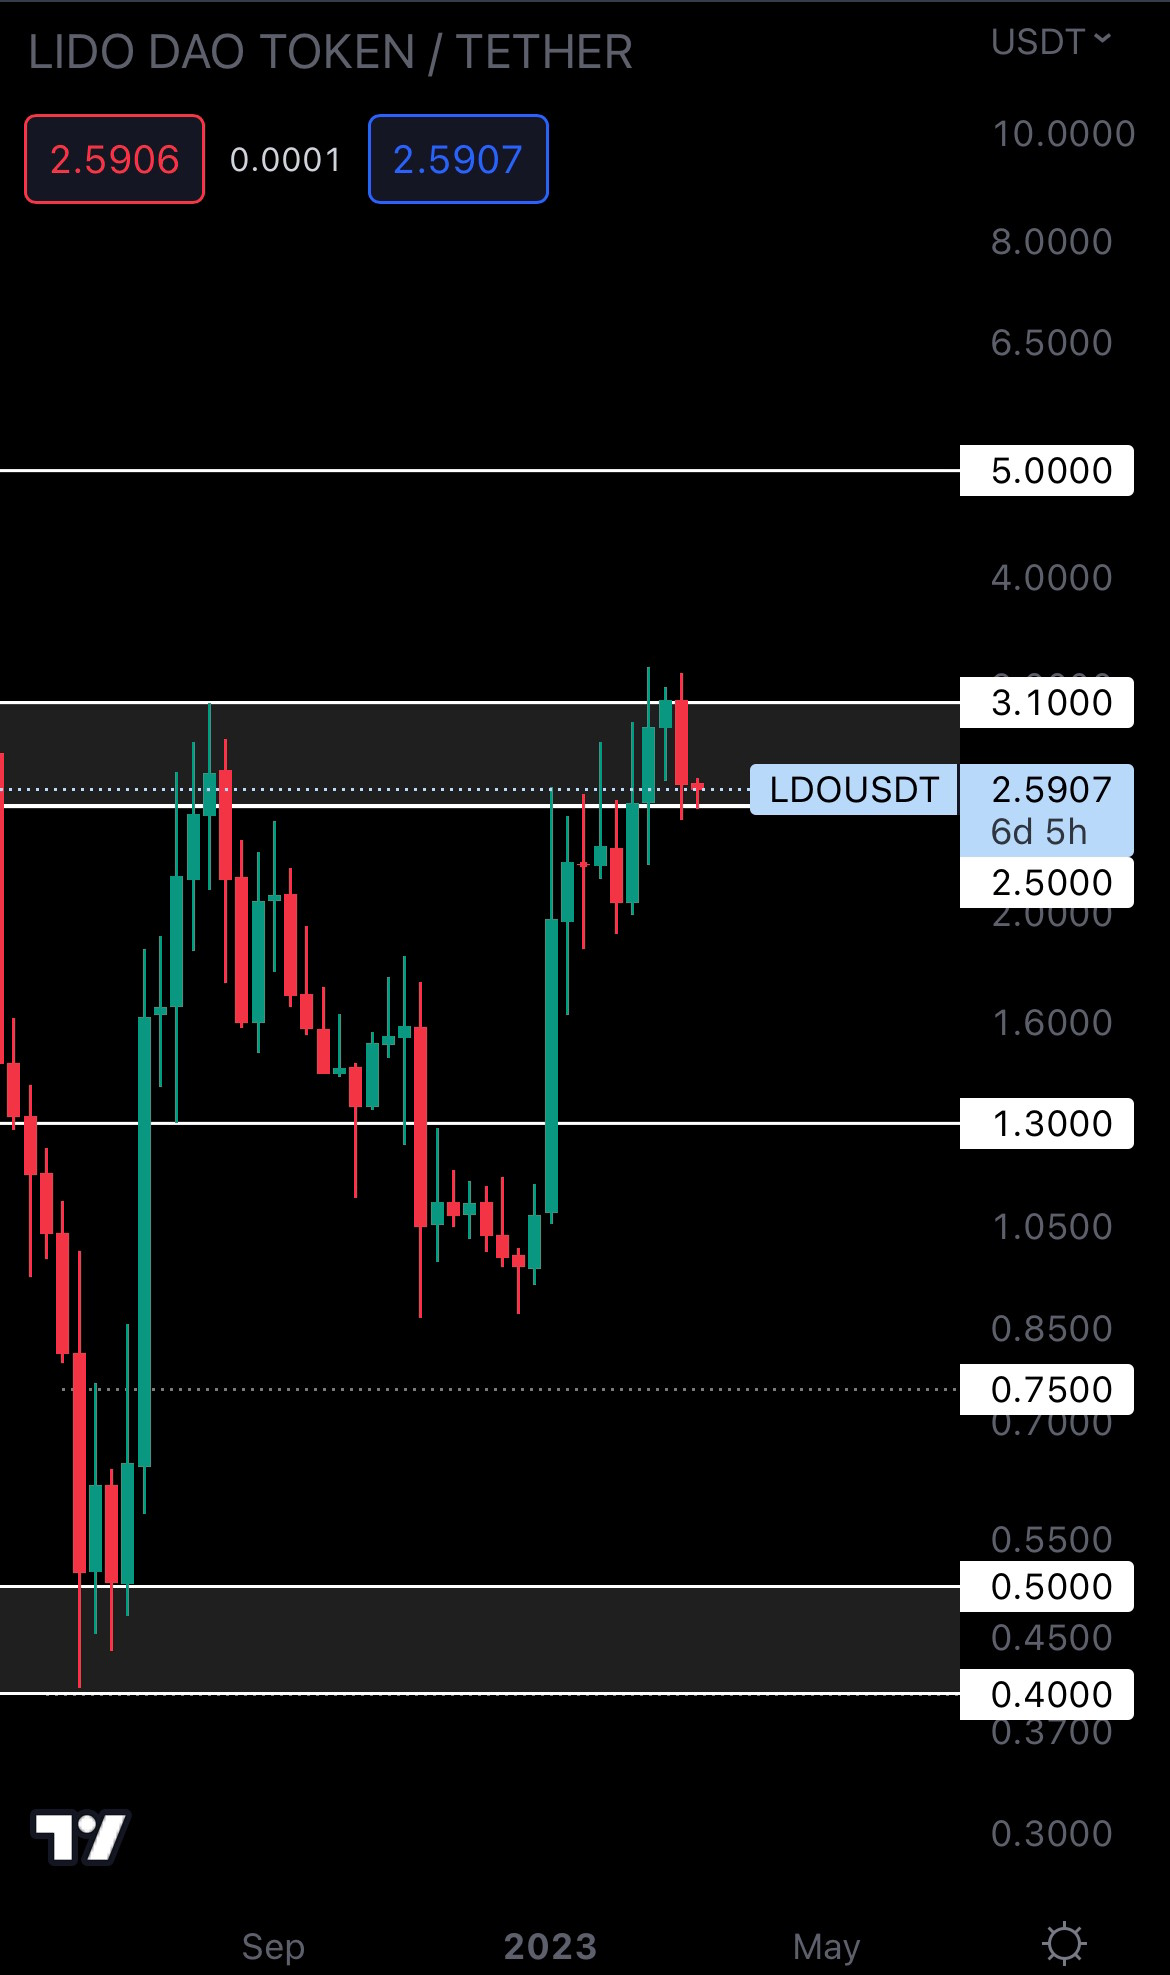 LDO closed above $2.50 (bottom of the current area), so it still might break above $3.10 as long as $2.50 holds. As Bitcoin is at support on the daily timeframe and it might bounce from its supporting trend line, we could see LDO take a swing at $3.10 this week or next week.
HEGIC | Hegic (Weekly)
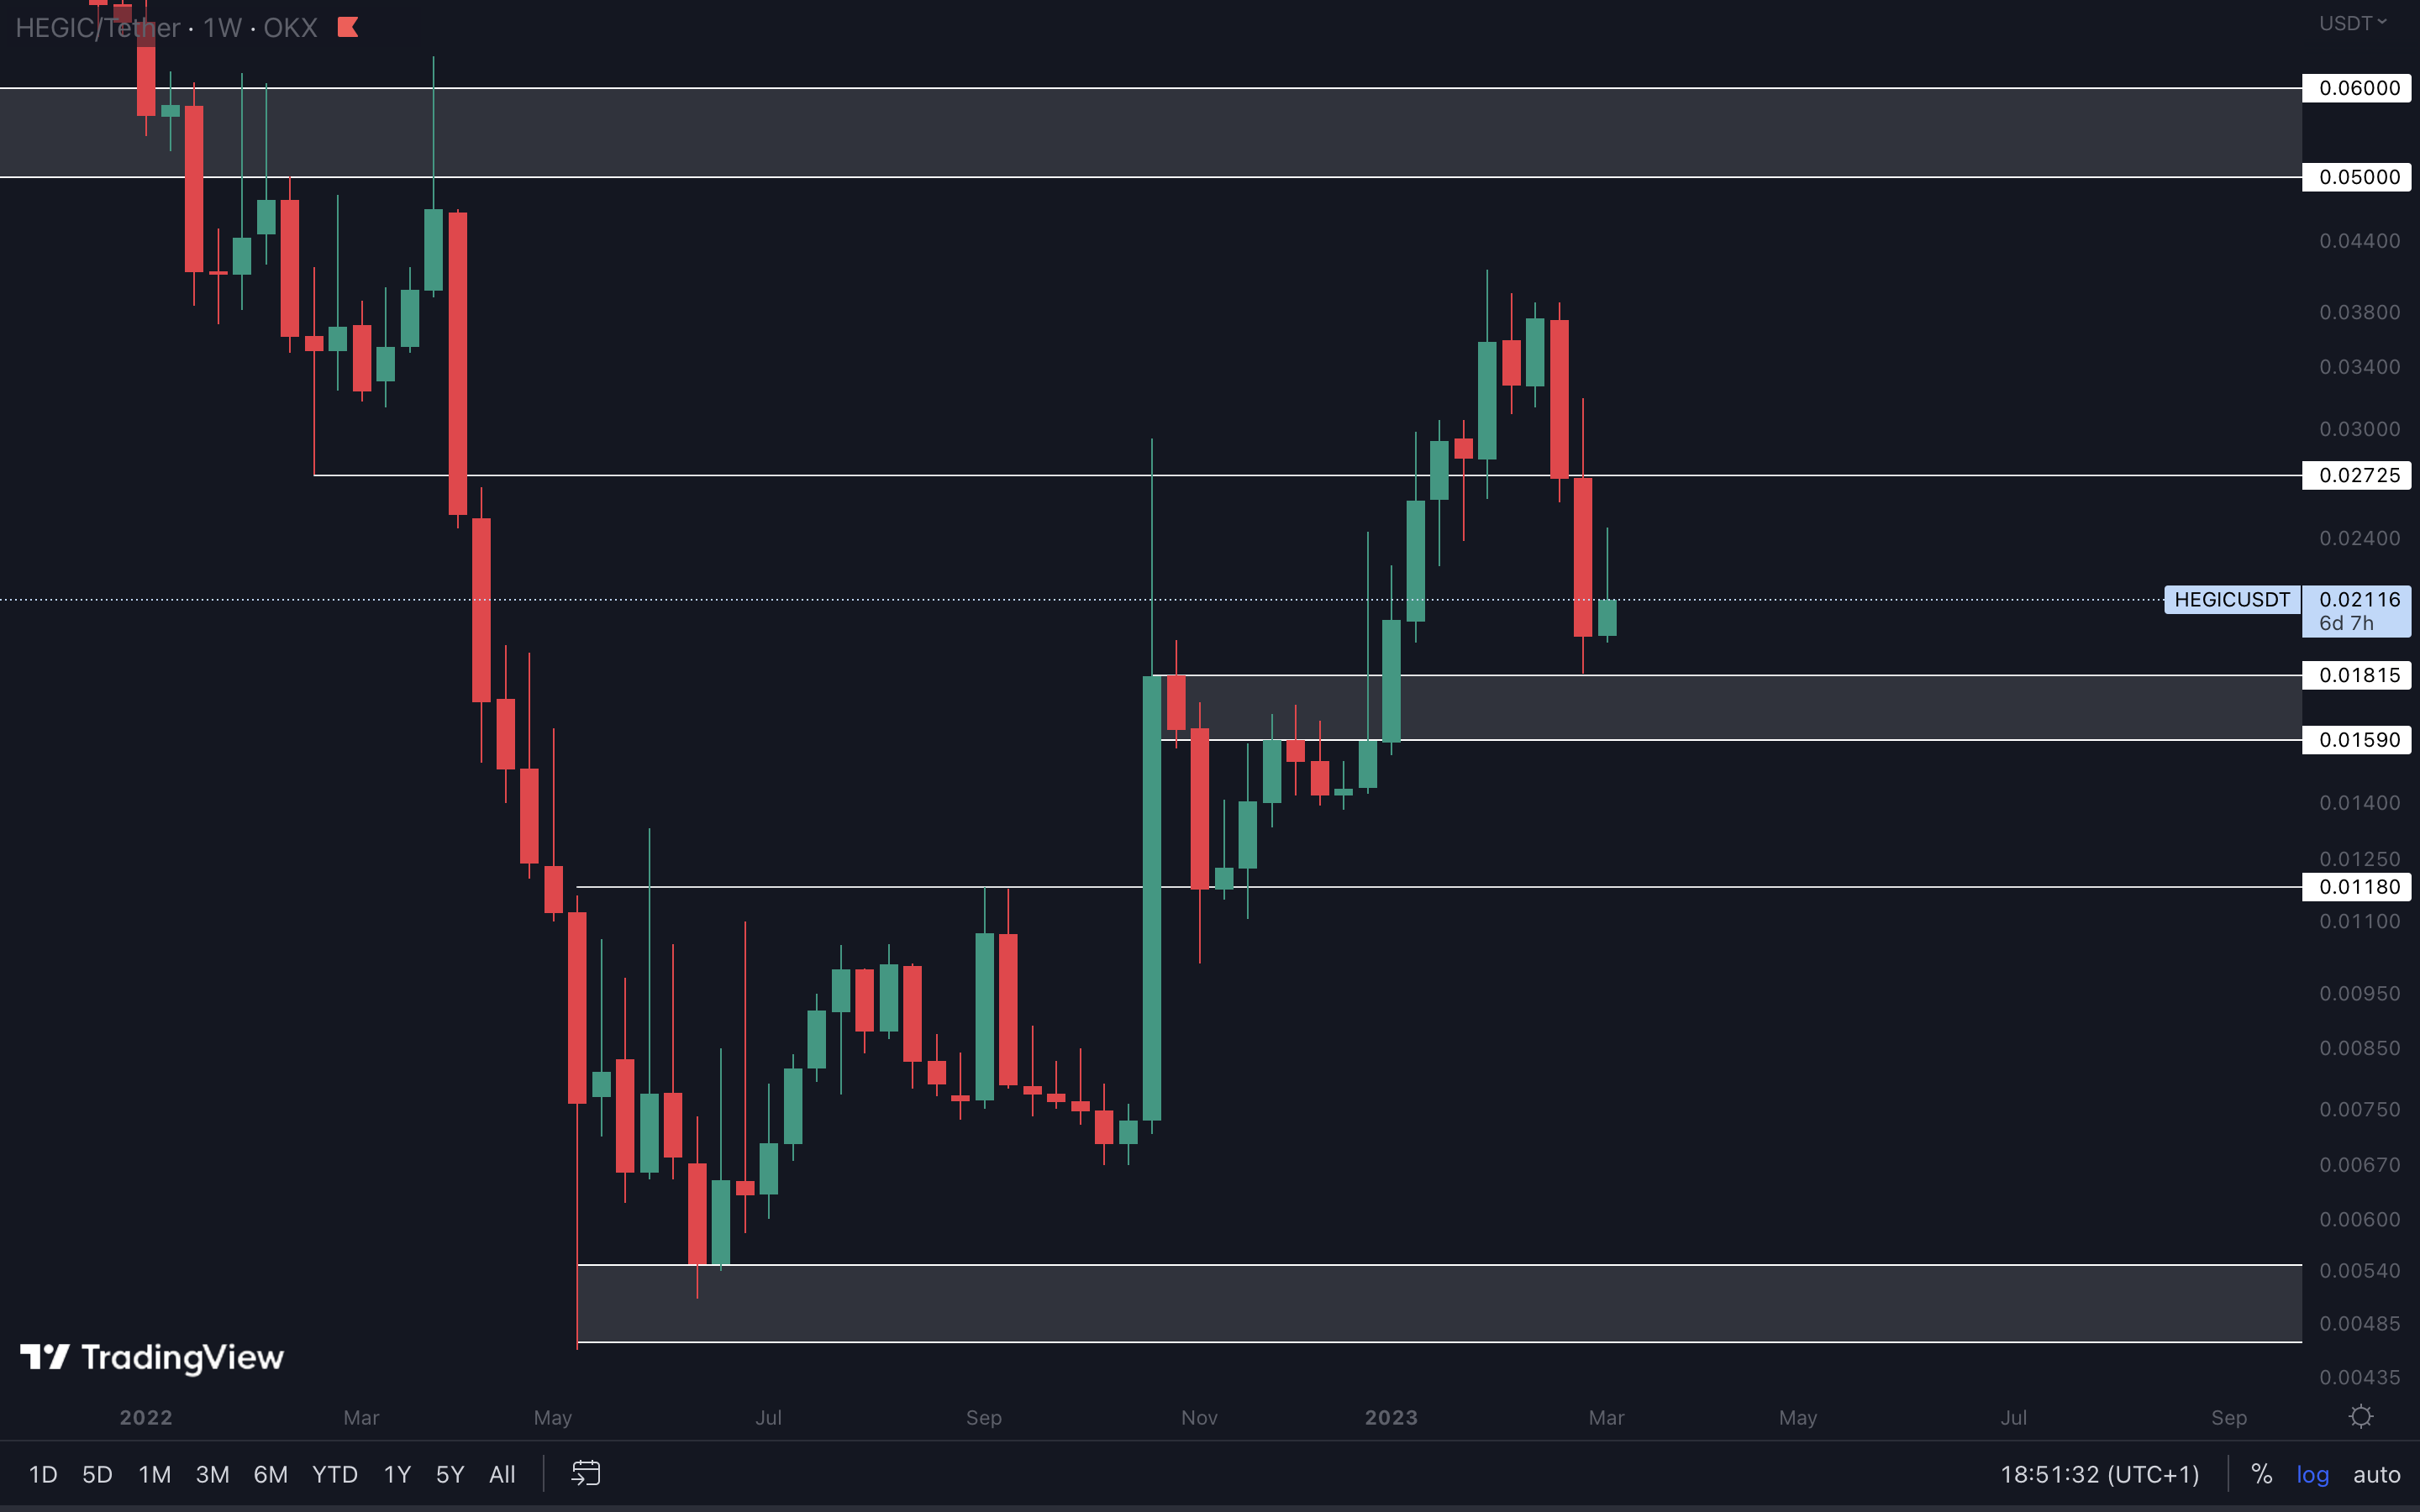
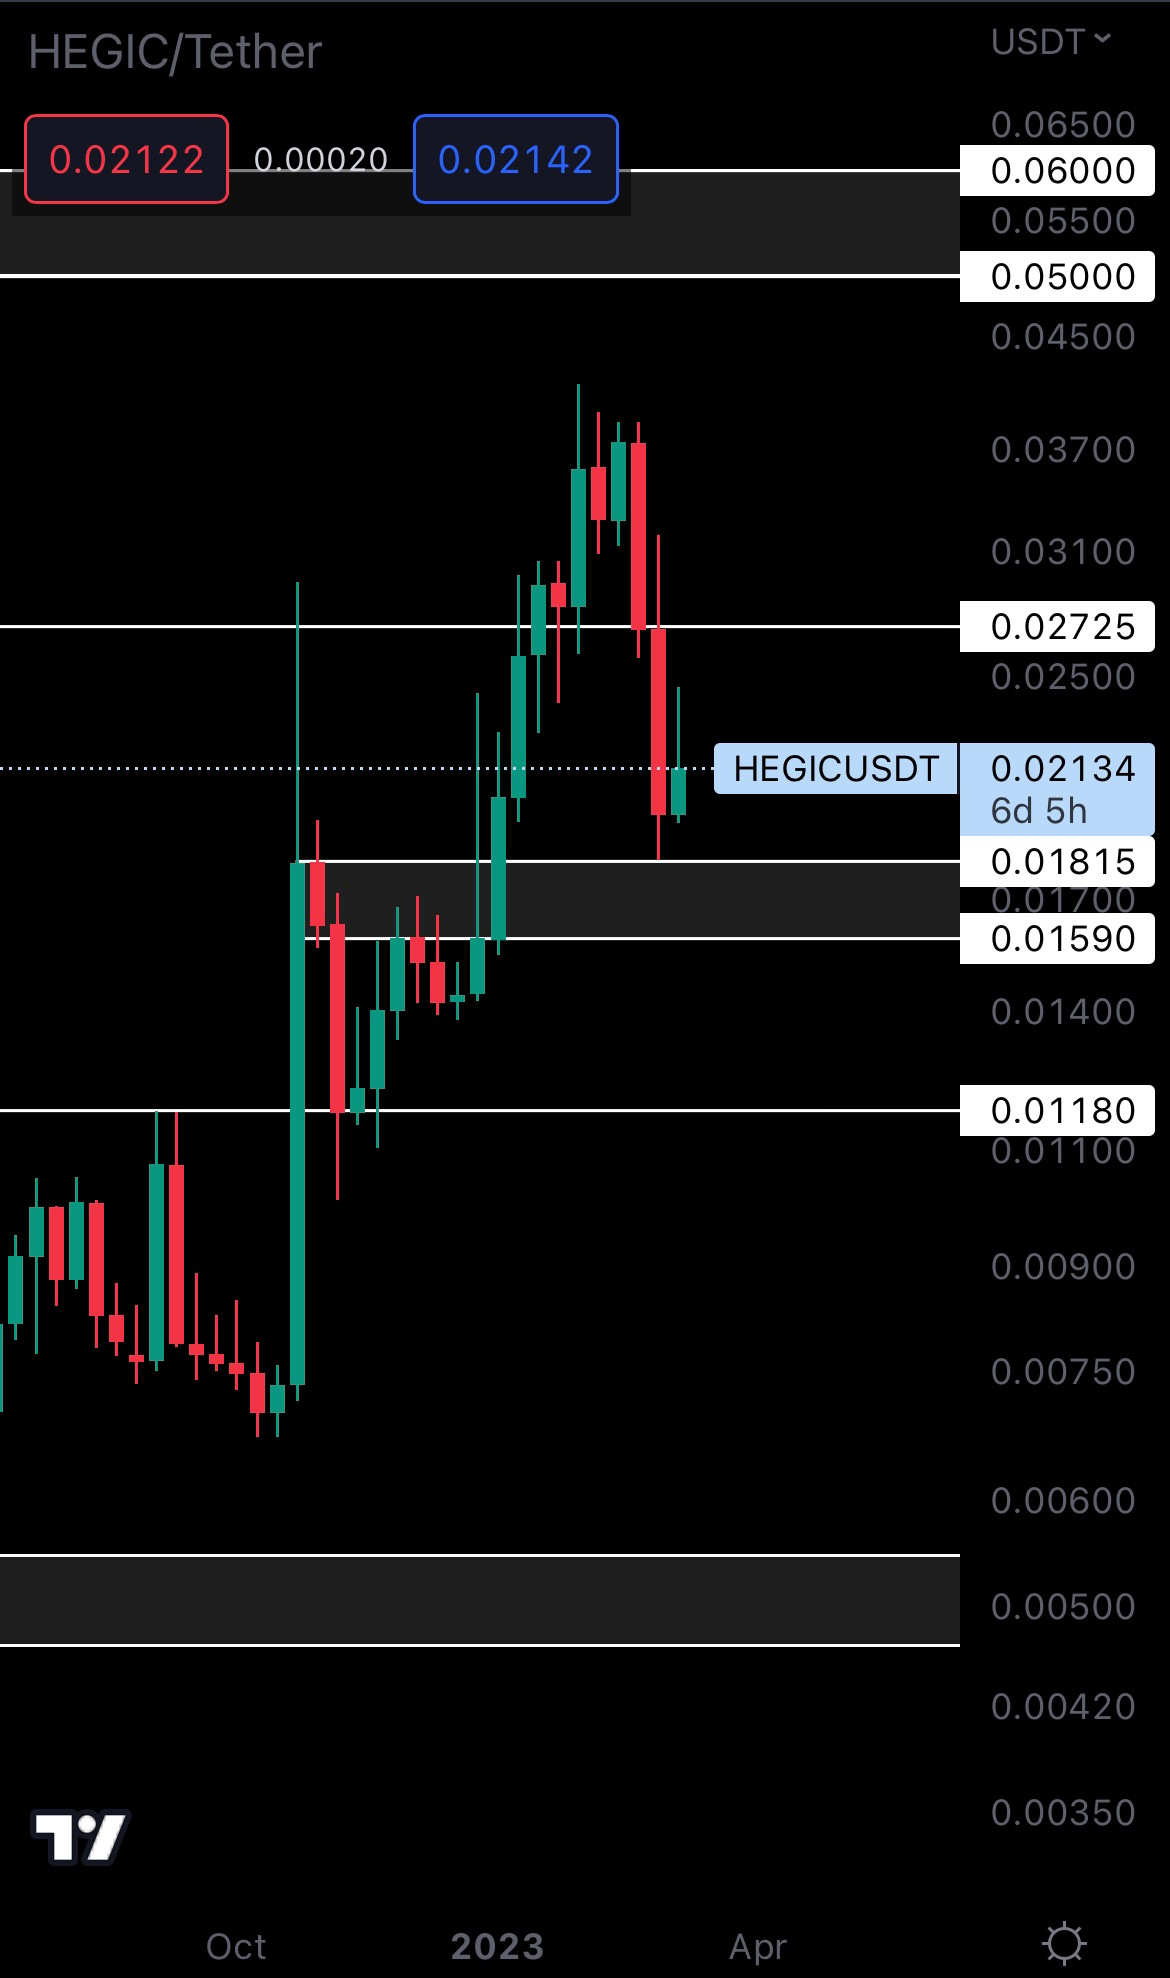
HEGIC had a surprising week - after losing $0.02725 as support, it rapidly dropped to its next support area between $0.01590 and $0.01815. This would be a perfect spot for HEGIC to form a weekly higher low, so buying here might be a good idea. When paired with Bitcoin potentially bouncing from its supporting trend line, HEGIC’s buying pressure after testing $0.01815 (which can be seen in the current candle) could mean it will perform well in the coming weeks.
ASTR | Astar (Weekly)
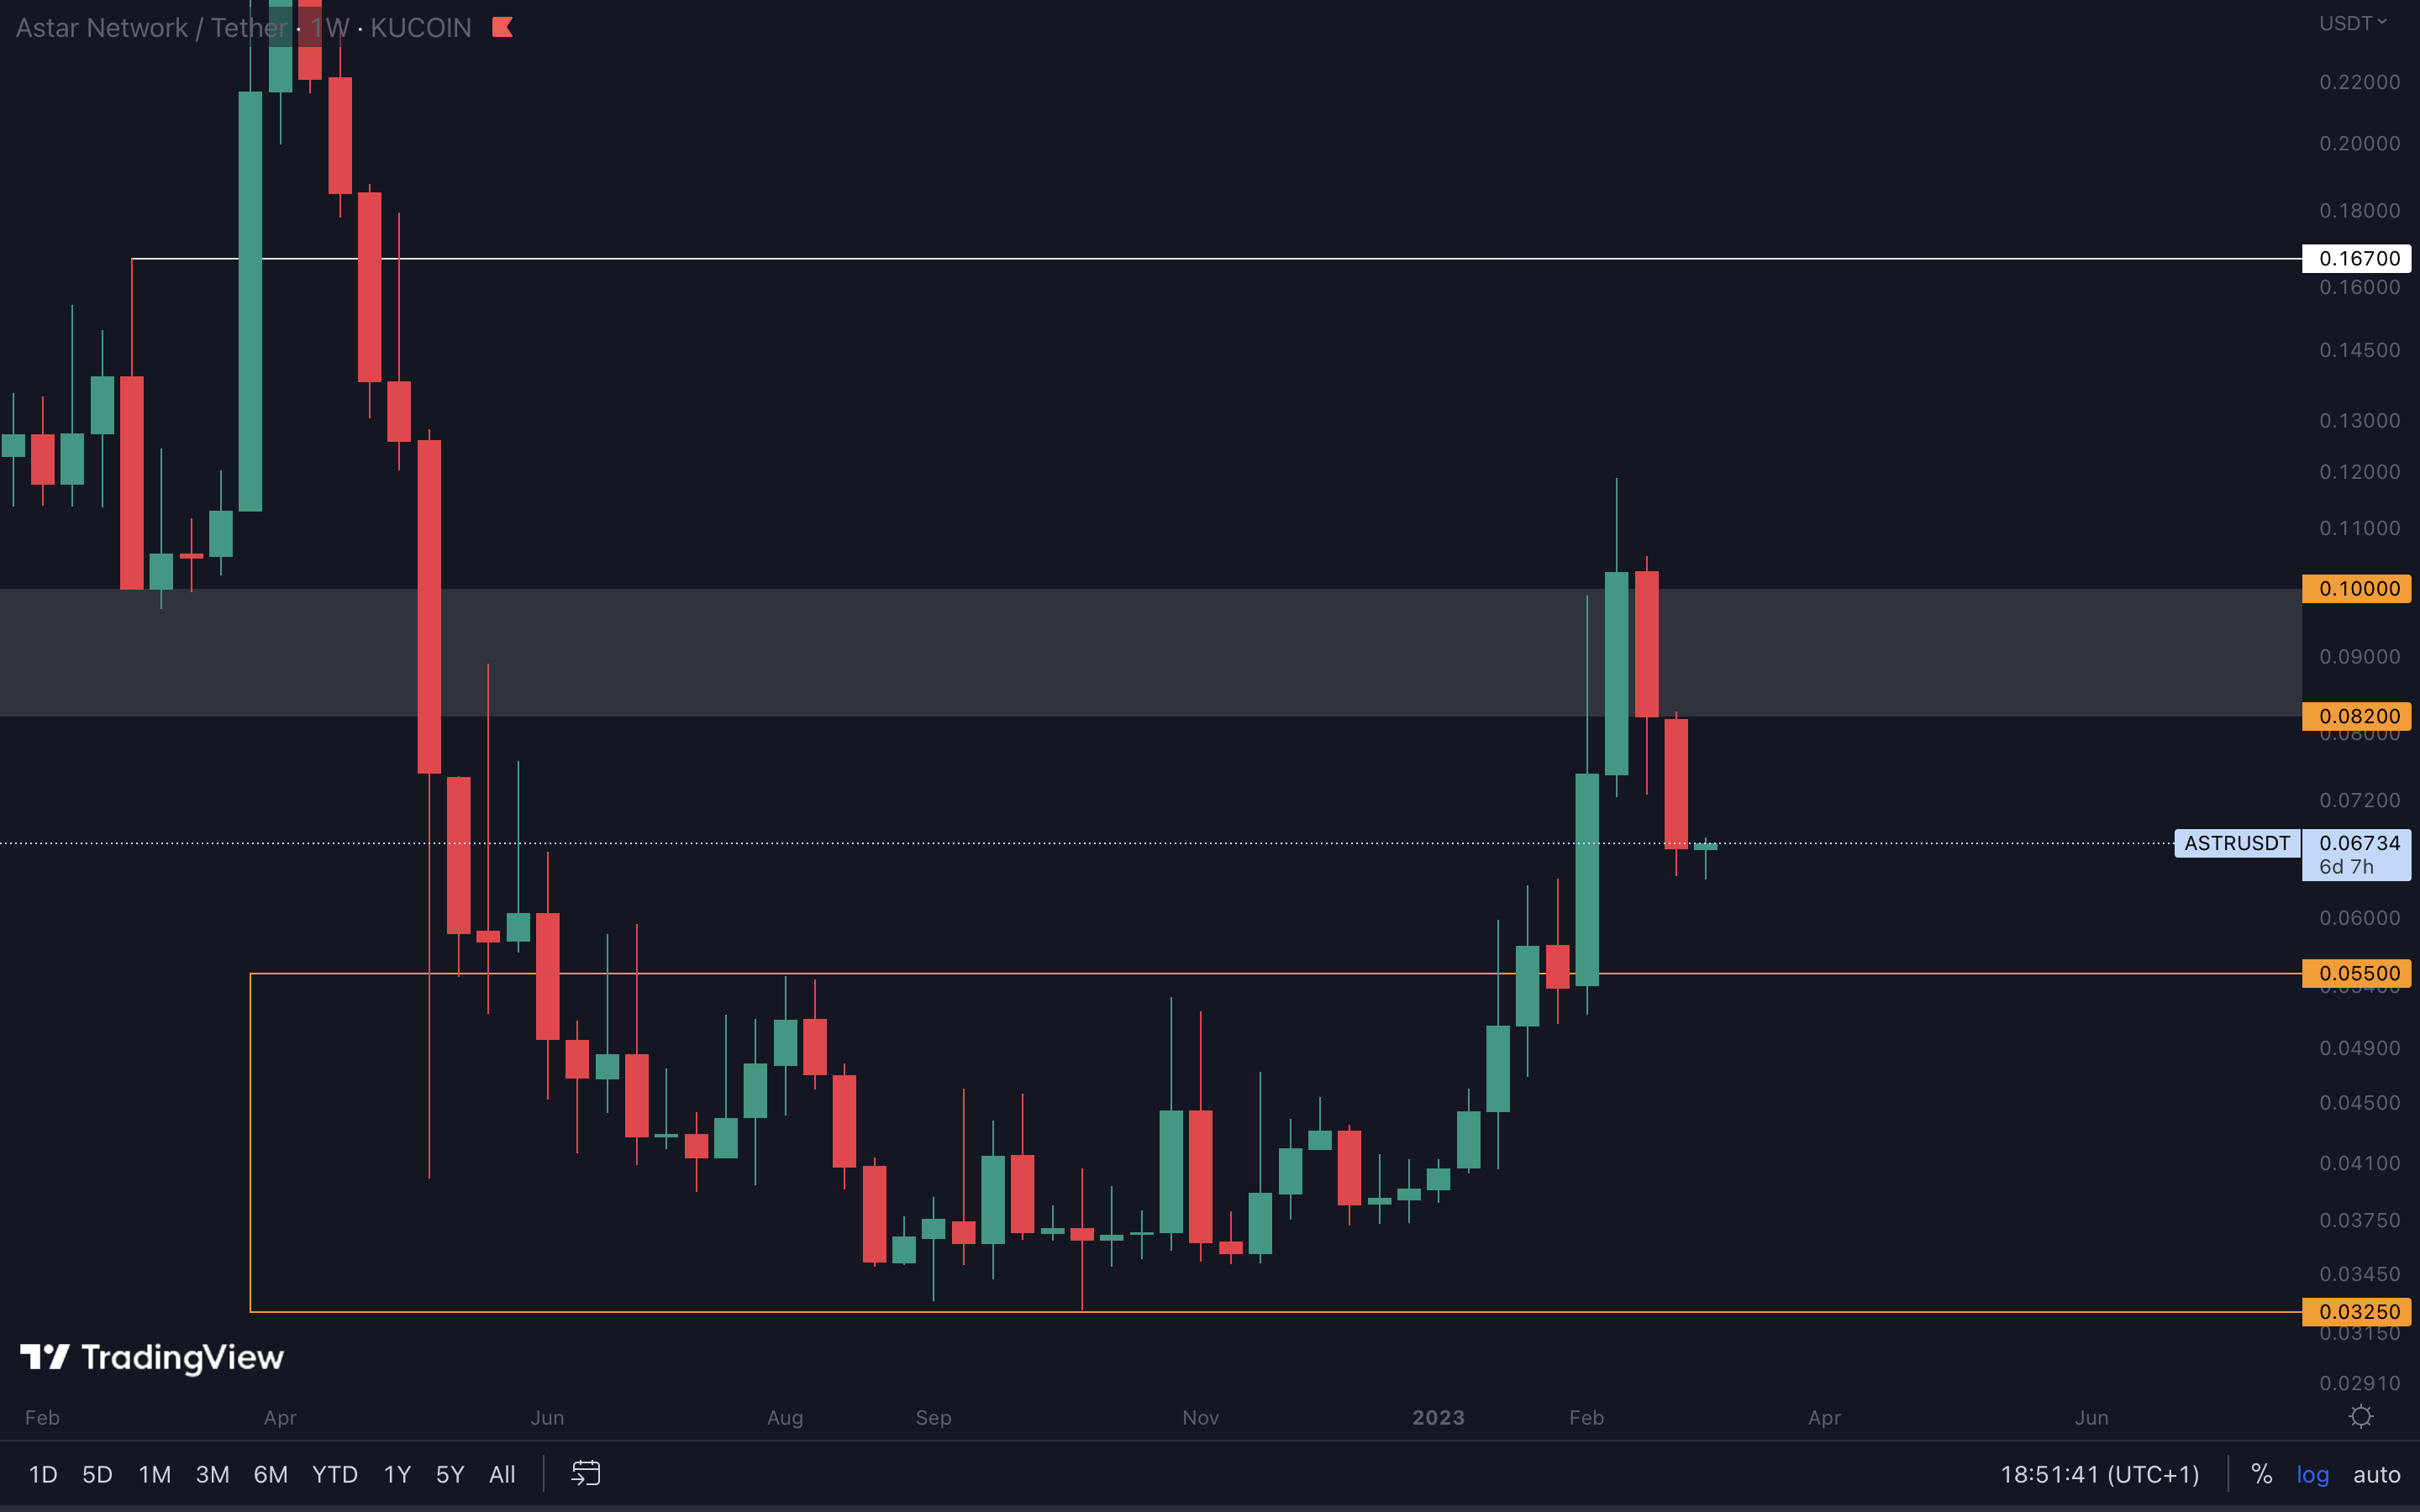
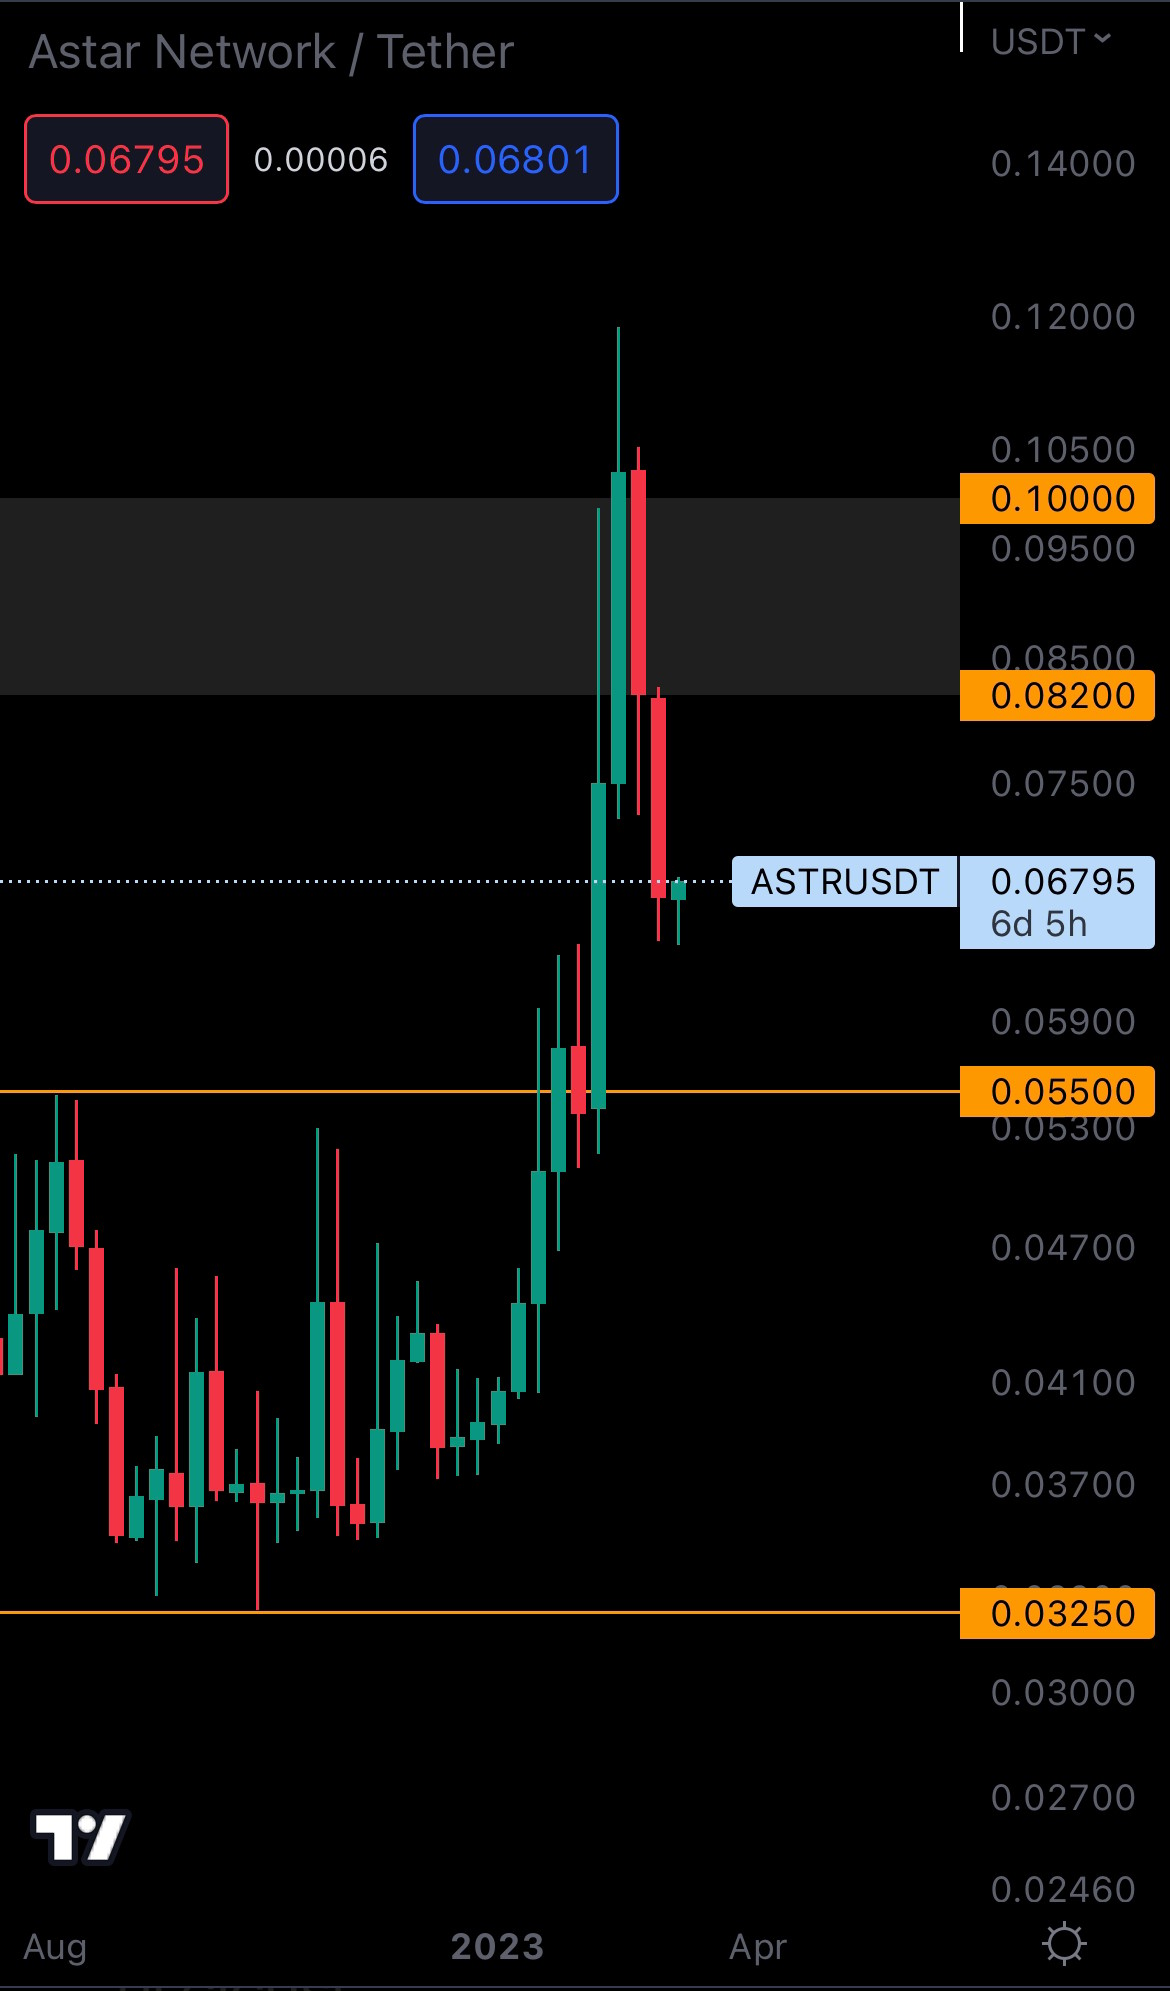
It seems the selling pressure isn’t stopping, and ASTR doesn’t have any support levels in proximity other than $0.0550. So, we might see ASTR test $0.0550 in the coming weeks, unless Bitcoin performs well which would result in ASTR forming a local bottom instead, and rising higher from here. If you want to know when/if that happens, you can check our daily TA here.
THOR | THORSwap (Weekly)
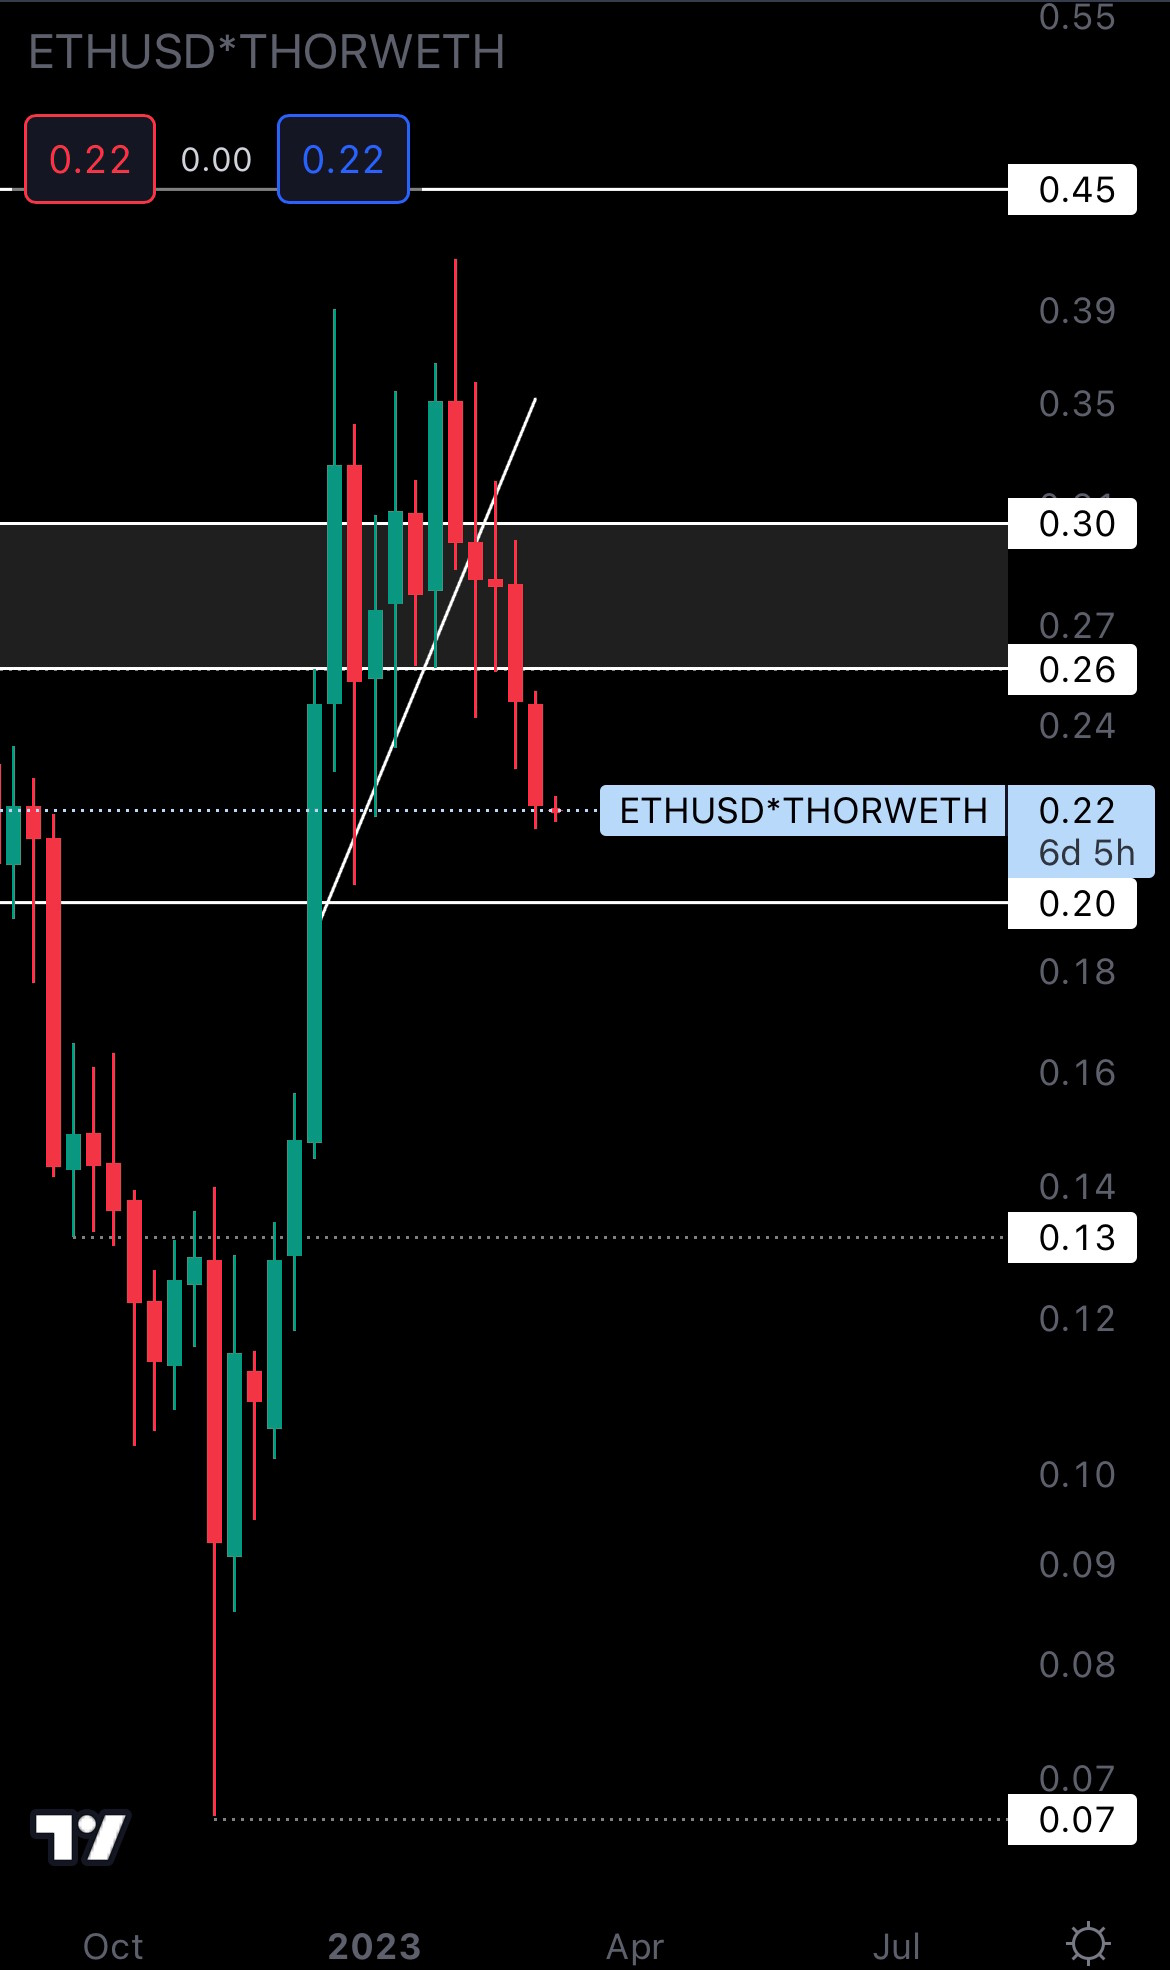
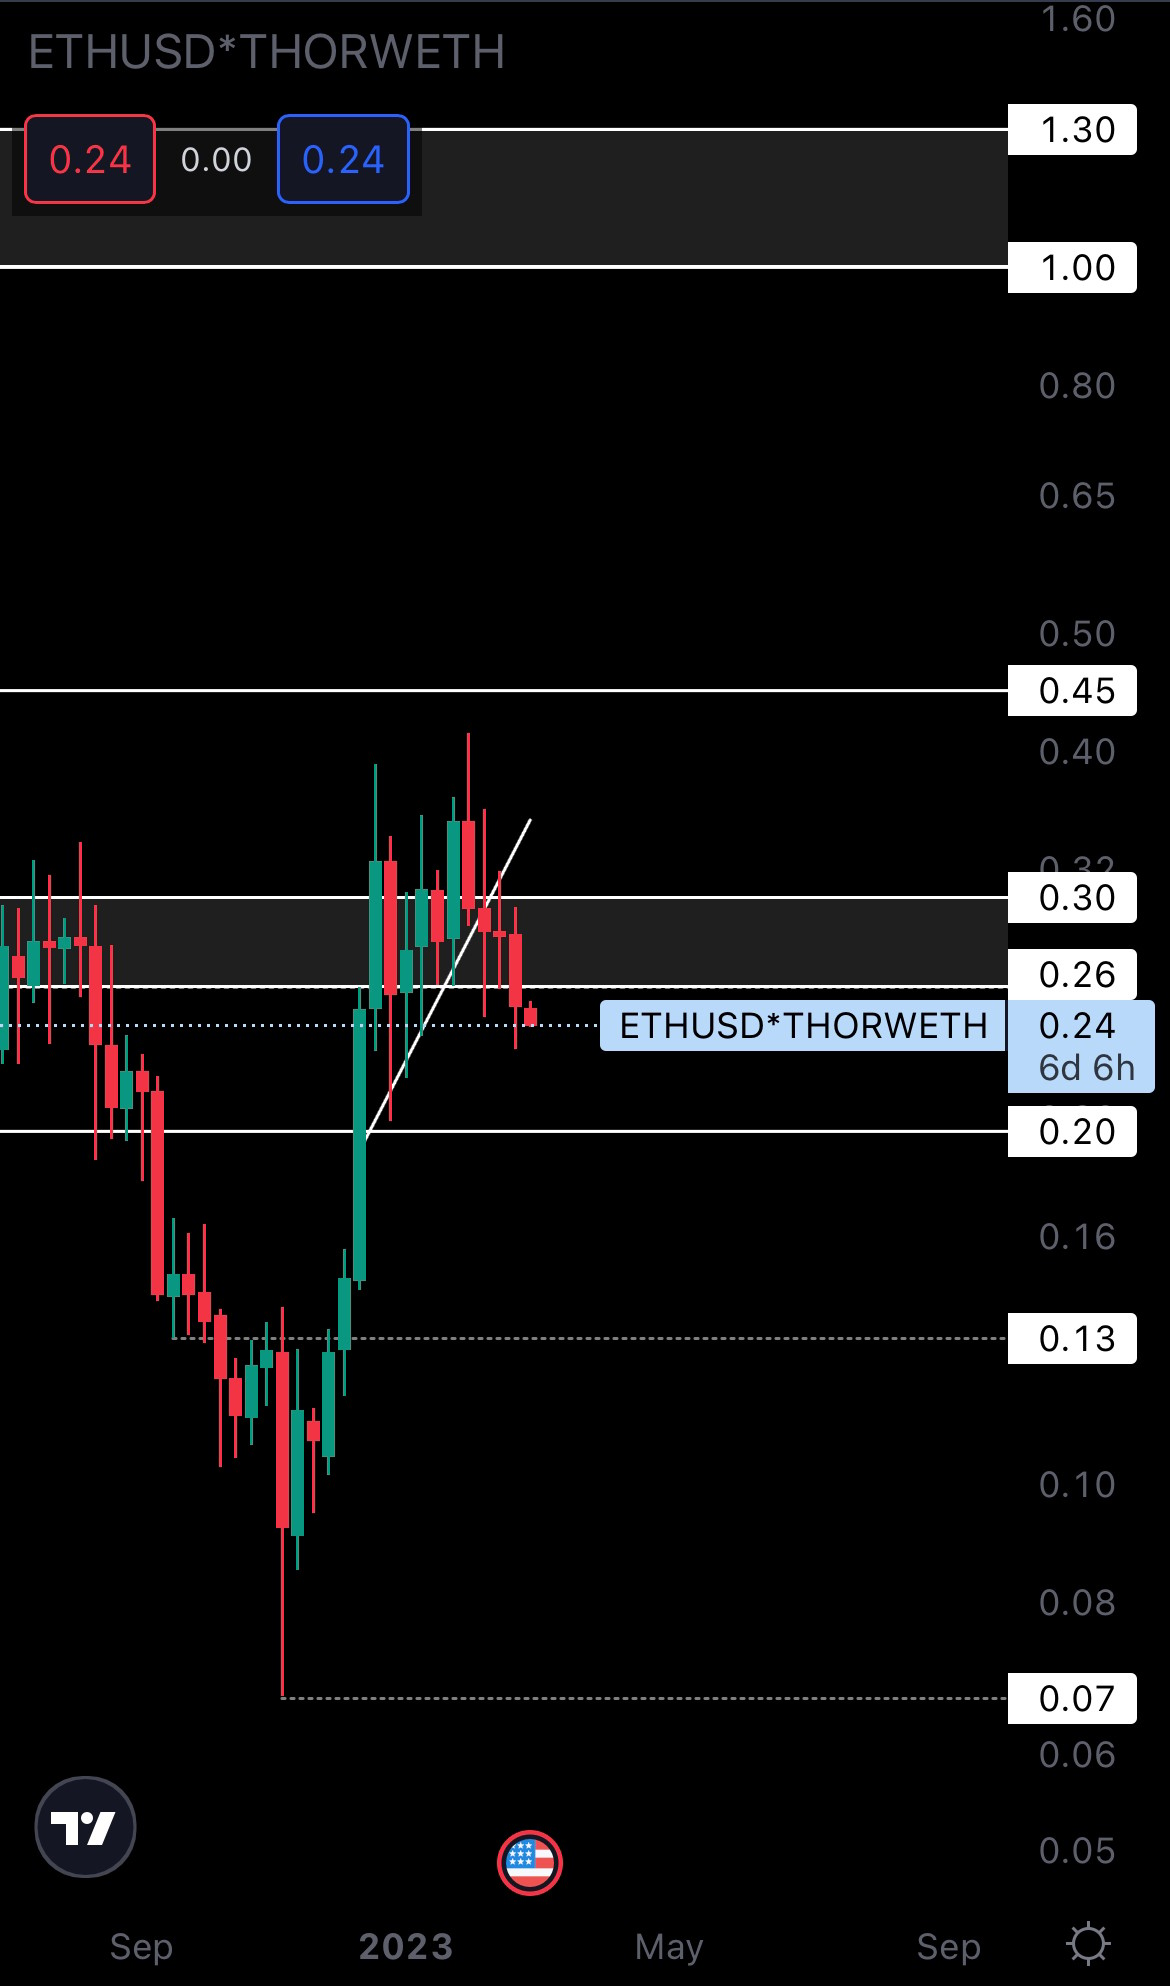
There have been no changes in THOR’s price action, so it’s still on track for $0.20.
This would be a great entry point for a trade, not only because it’s an important support that has been tested multiple times in the past, but also because it’s a perfect spot for THOR to form a weekly higher low. Invalidation of the above would be if THOR closes a weekly candle under $0.20.
MINA | Mina Protocol (Weekly)
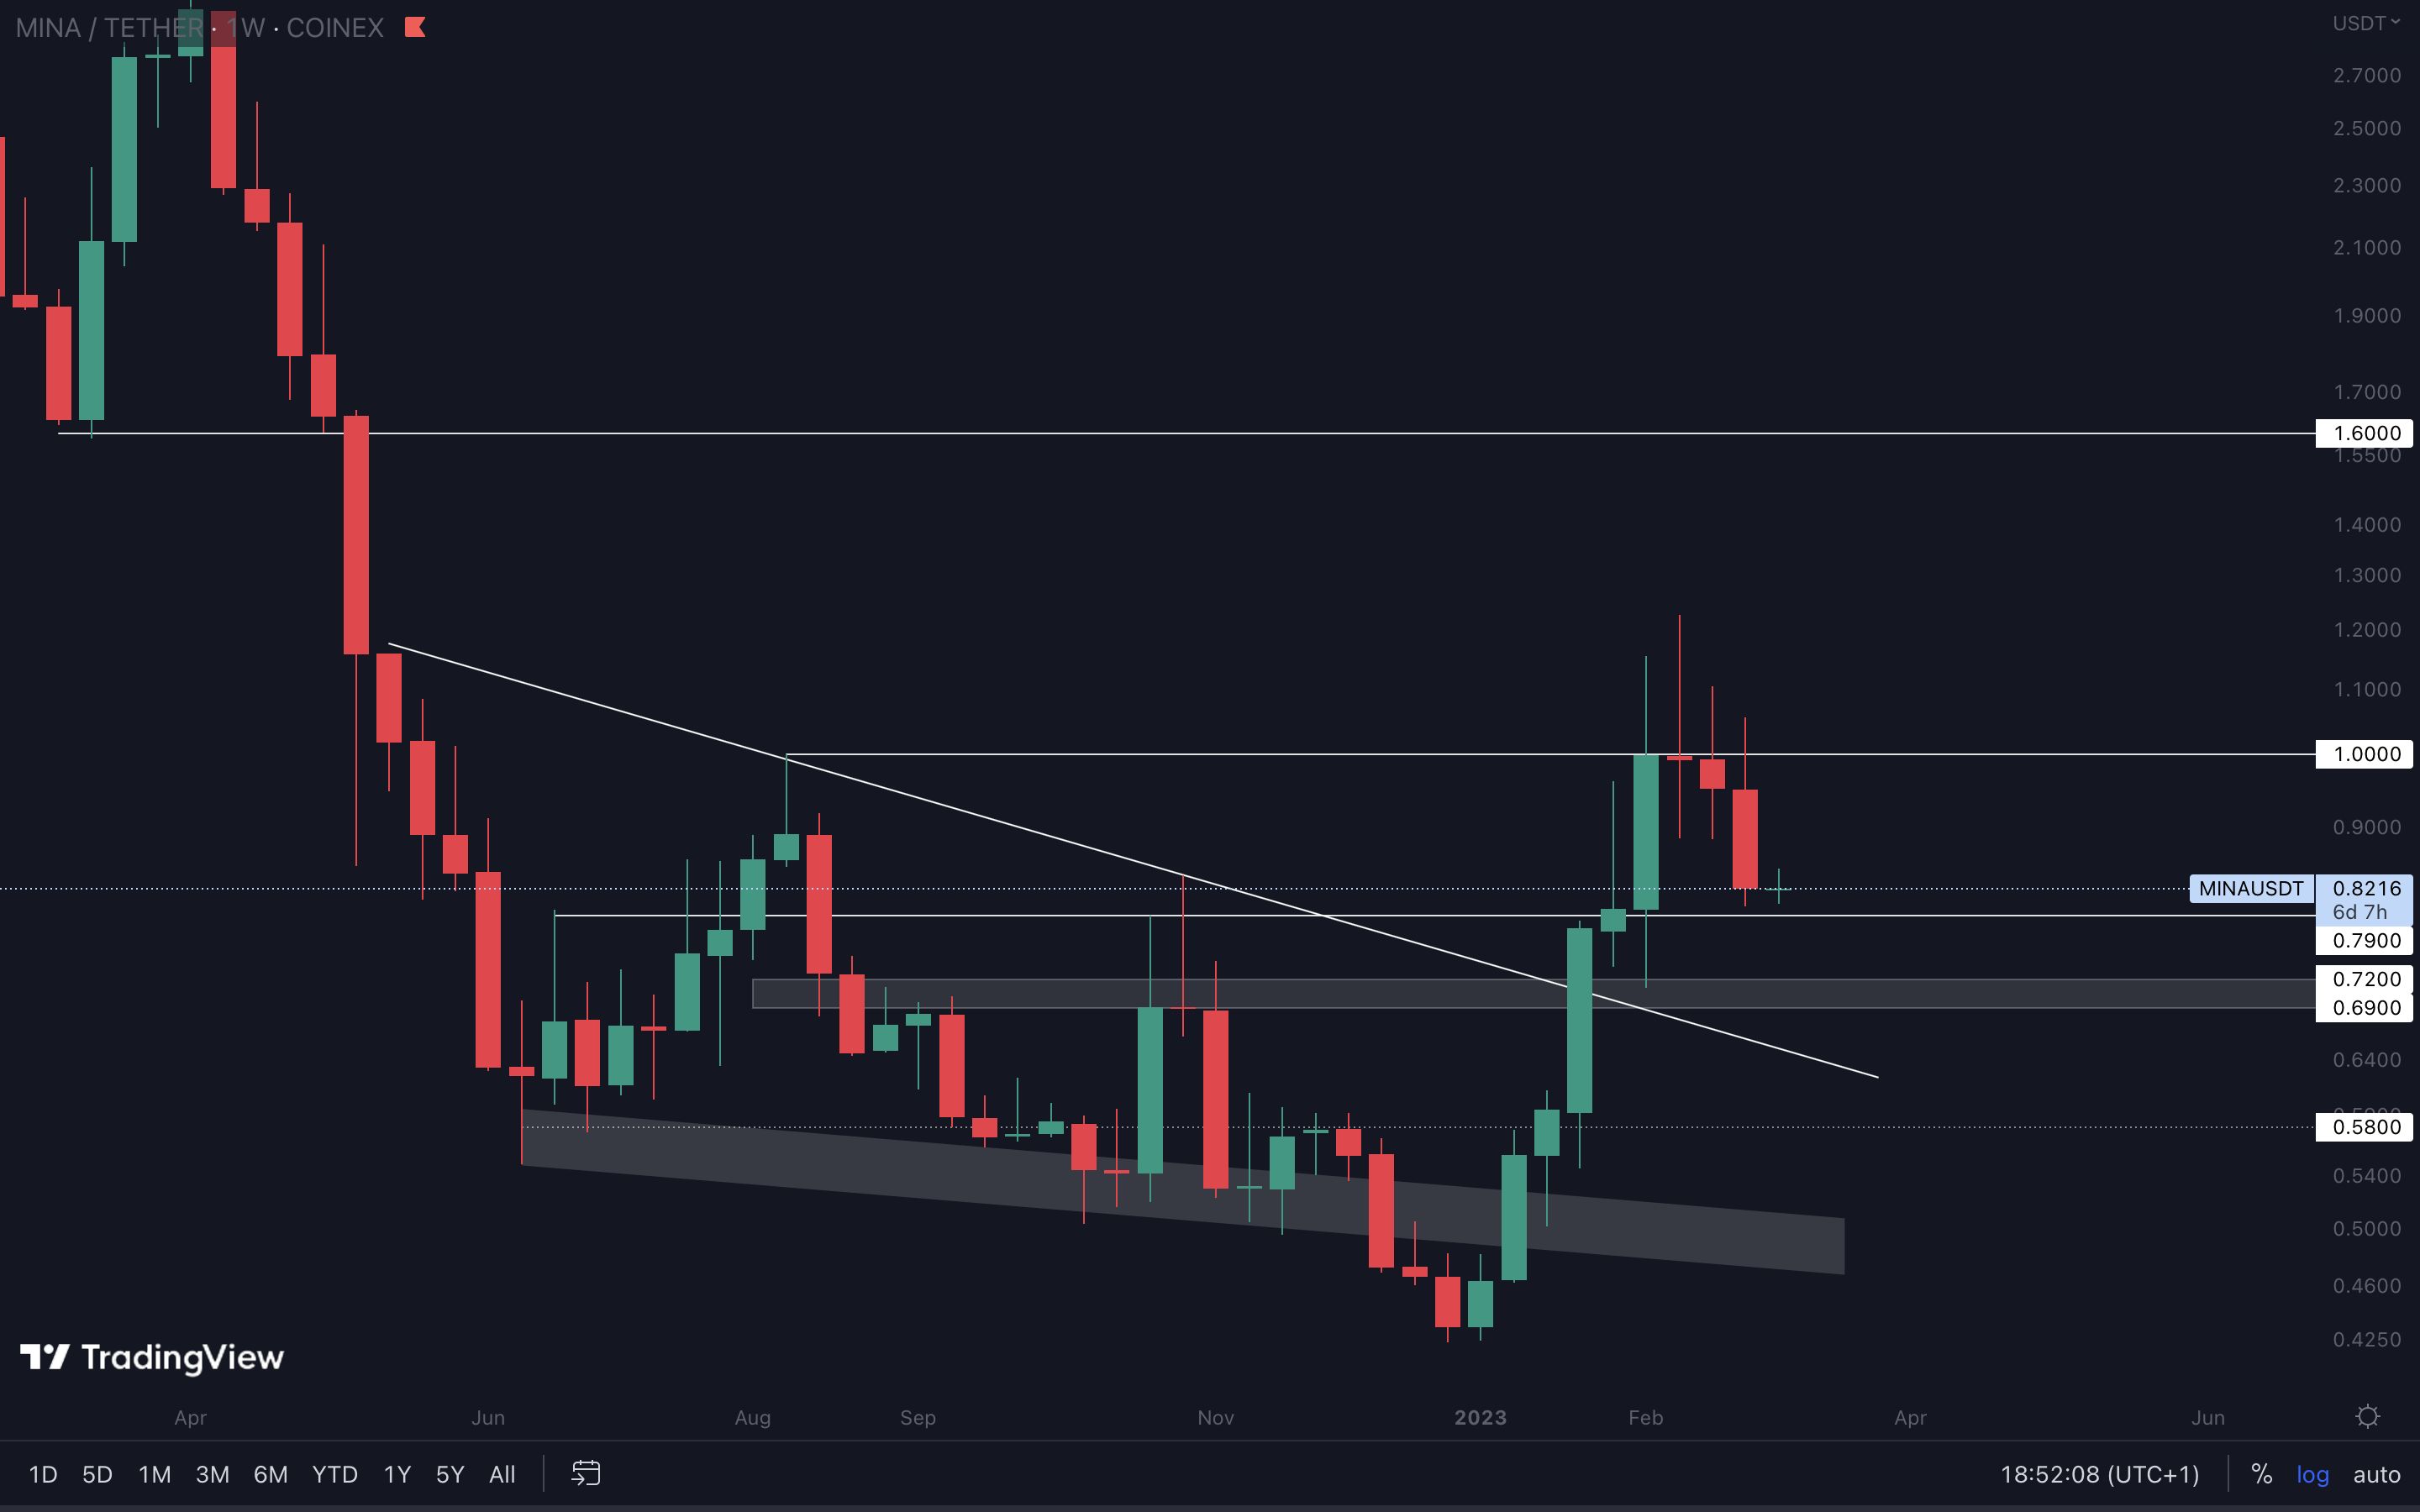
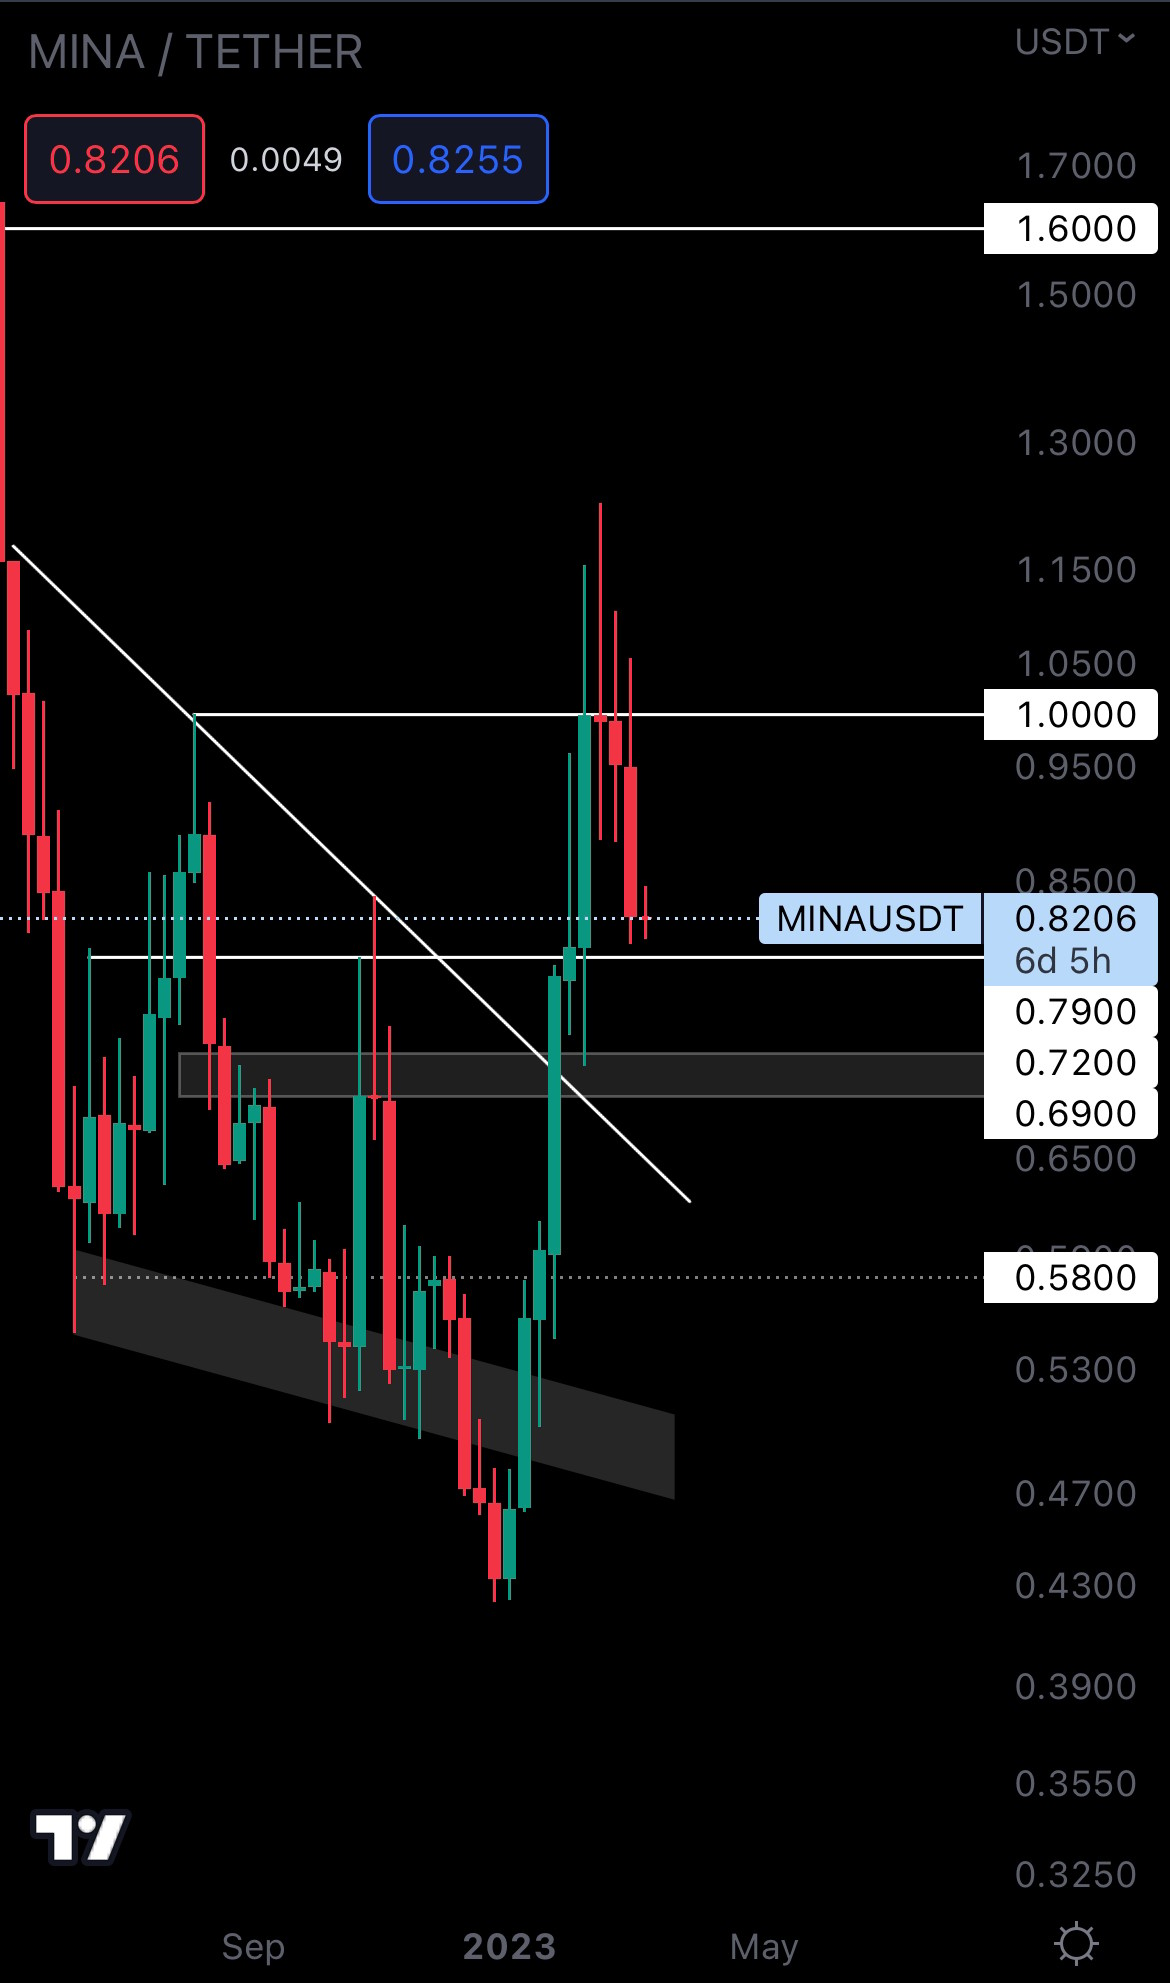
MINA is near support ($0.79). This level is also a great spot for MINA to form a weekly higher low, but so is the $0.72 - $0.69 support area, so it’s not quite clear where it’s headed at this time. If you’re investing in MINA, a DCA (Dollar-Cost Averaging) approach might be your best play at both $0.79 and $0.72 - $0.69. This way, you minimize your risk as much as possible in case it doesn’t go as expected. With Bitcoin potentially bouncing from its supporting trend line, MINA might also see some upside this week
STG | Stargate Finance (Weekly)
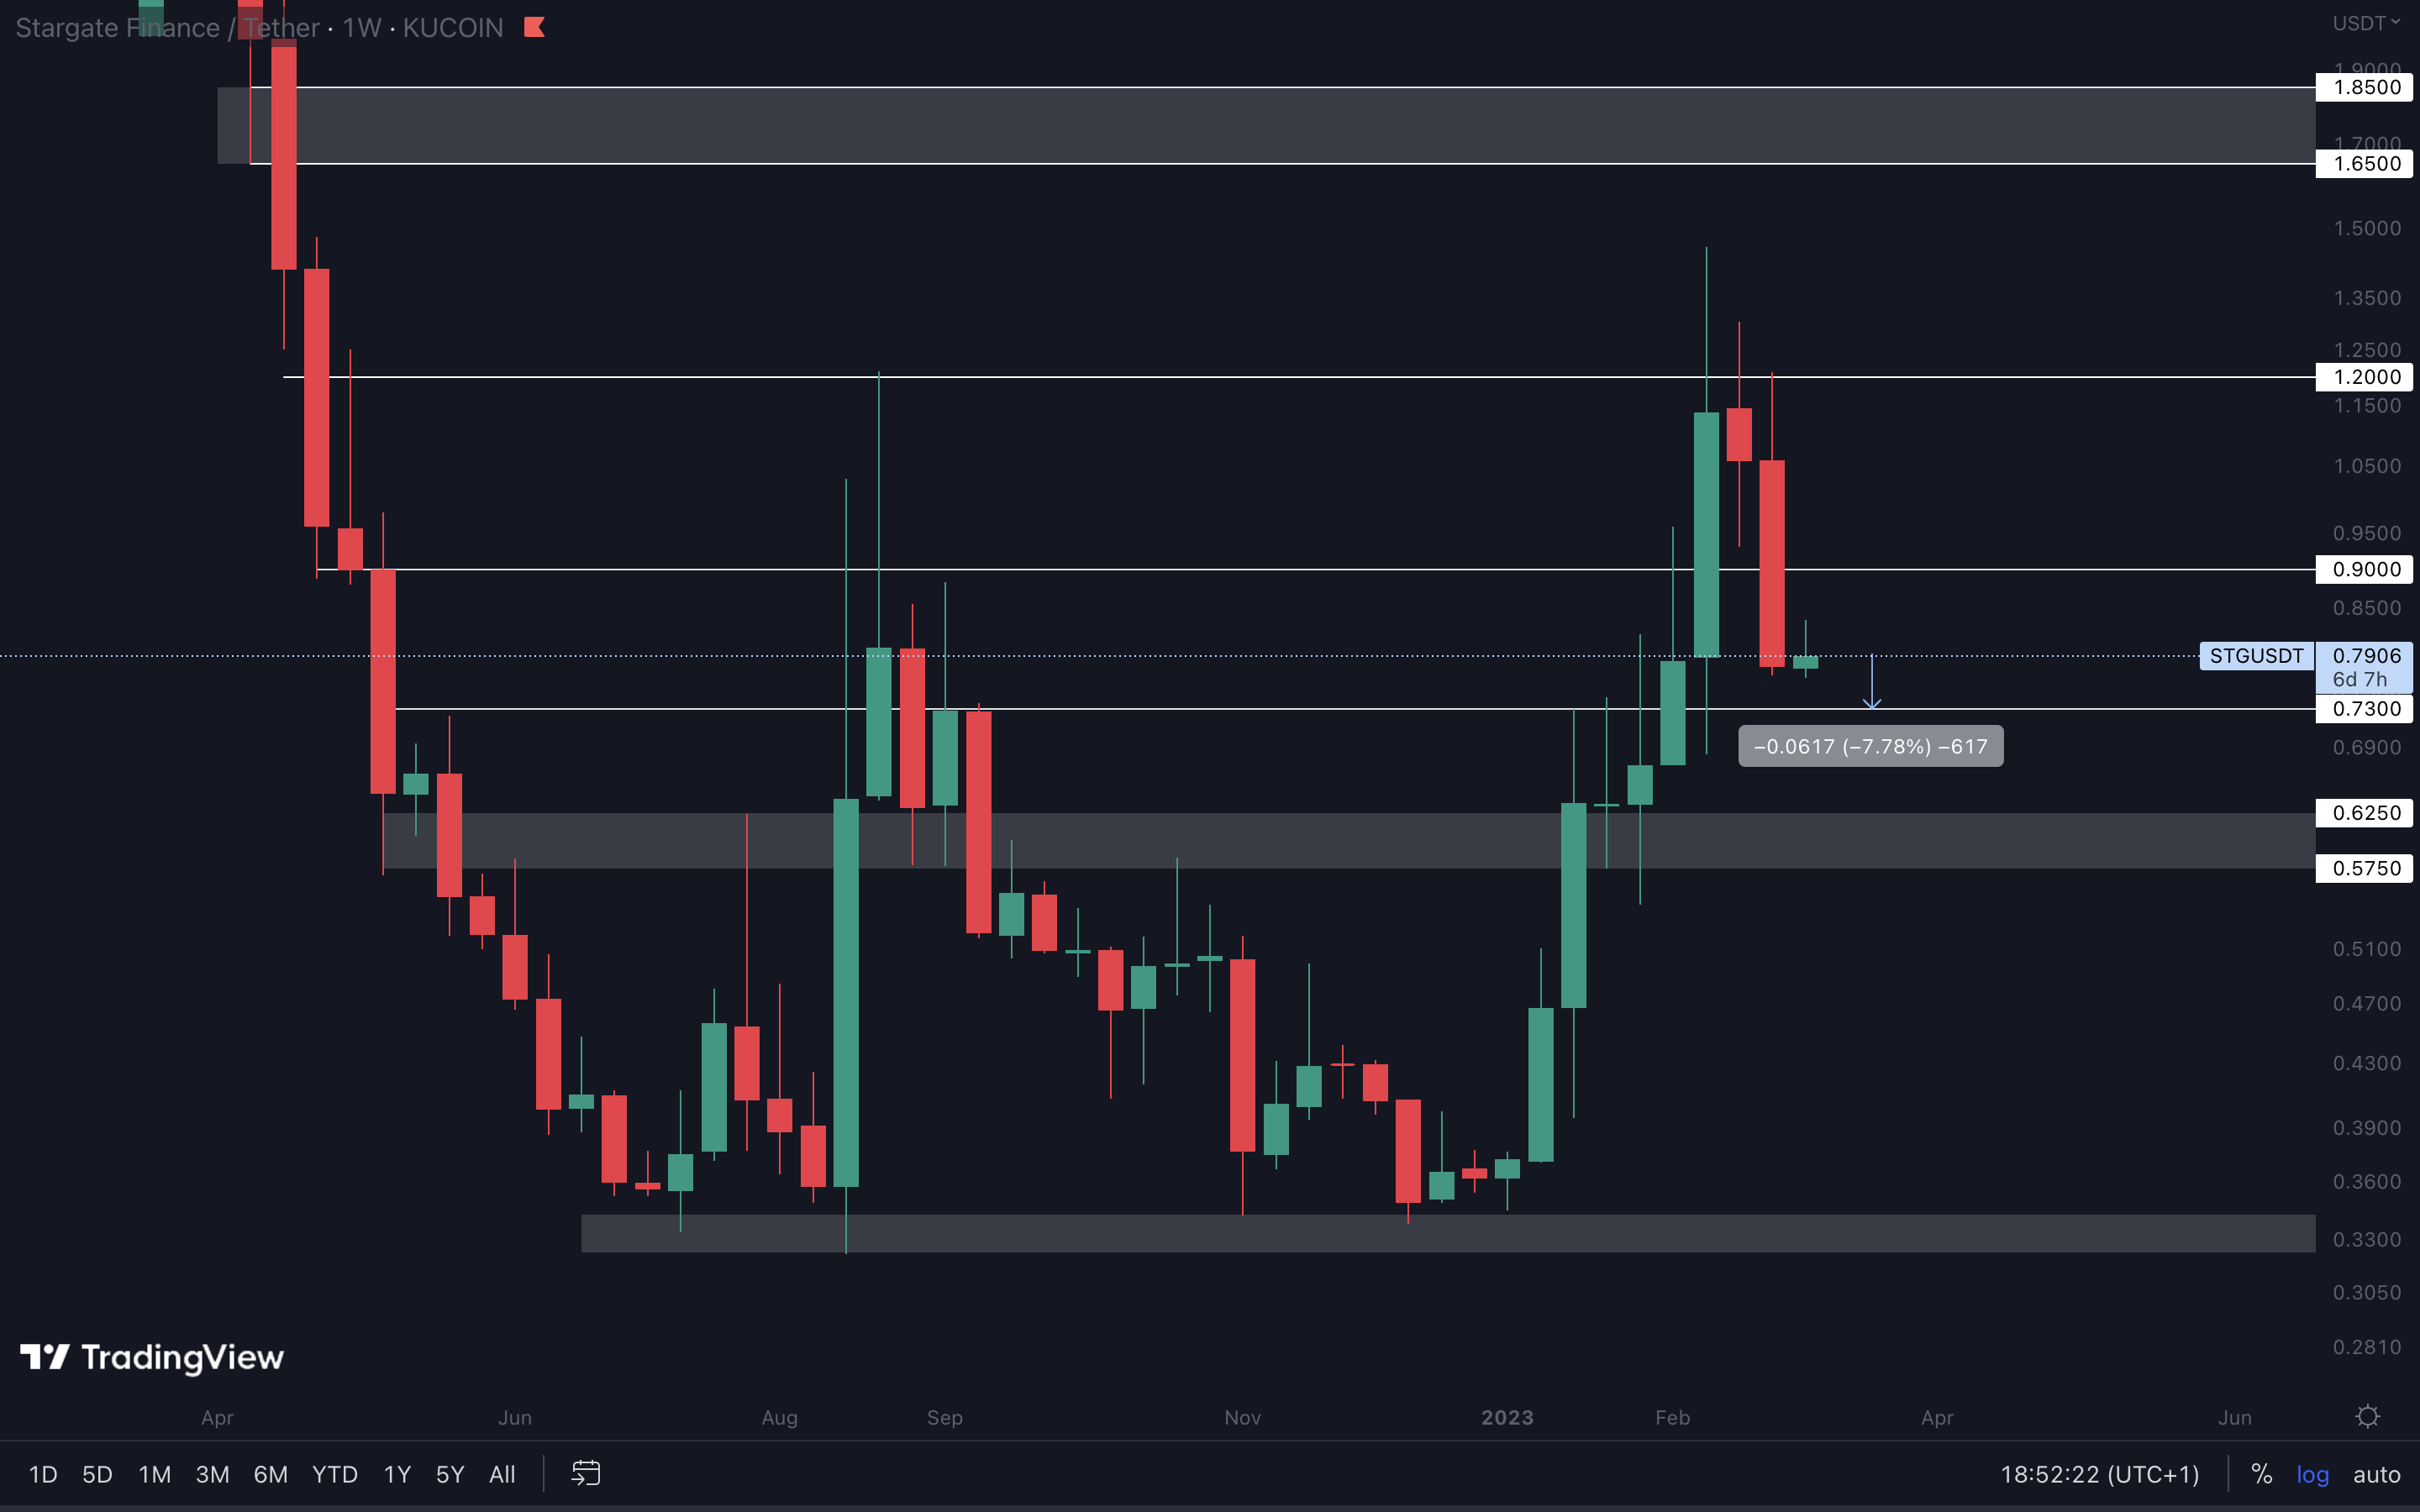
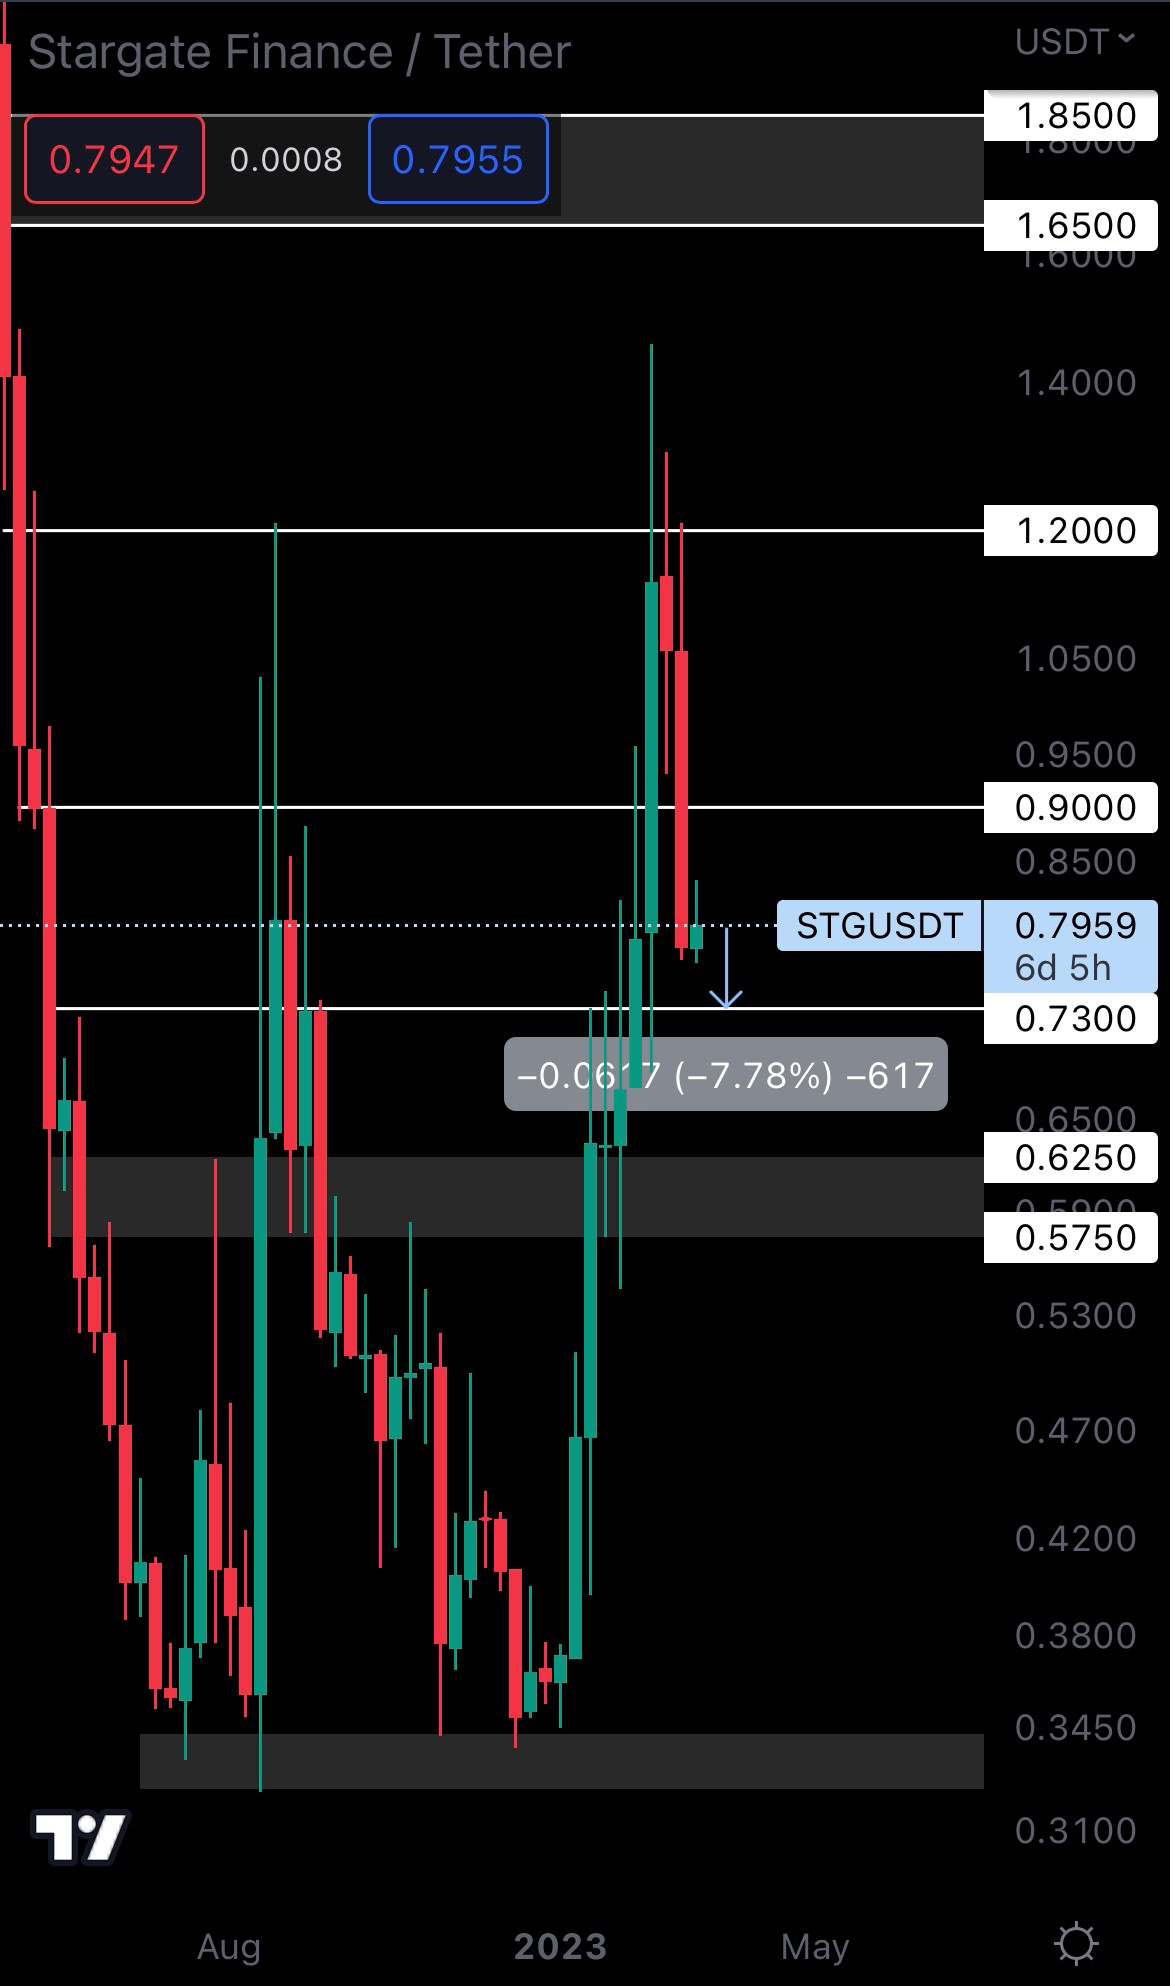
STG closed an almost full-bodied candle last week, losing $0.90 in the process. If it’s not obvious already, this opens the road for $0.73, a level we believe will be tested this week as it’s not a large move (-7.78% from its current price to be specific). This level is a good spot for STG to form a weekly higher low, so a DCA approach will work here as well.
Cryptonary’s take
We don’t expect March to bring any extreme returns. Instead, we believe this is a month of accumulation/consolidation that will prepare us for what’s to come. And as we remain in a bullish market, our trajectory can only be UP.Here are a few action points for you as we head into new weeks:
- Check out our previous reports and analysis, and make a plan of your own. Consider potential opportunities in sight in case Bitcoin breaks resistance ($25,150).
- Bitcoin closing a weekly candle above $25,150 would be ideal for risking-on. However, we don’t recommend this unless a proper risk-management strategy is in place.
Recommended from Cryptonary


