Save 23% ($351) & Get a Free 1-1 Call with our Team ⏰ : 0d 2h 59m 44s
XRP Breakdown - Will it outperform Bitcoin in this bullish rally?
As the entire market started turning bullish, XRP’s price increase was lagging behind. Today [2 Feb 2020], as the entire market was rather stalling on a weekend, XRP, alongside ETH, took the time for a solo-run.
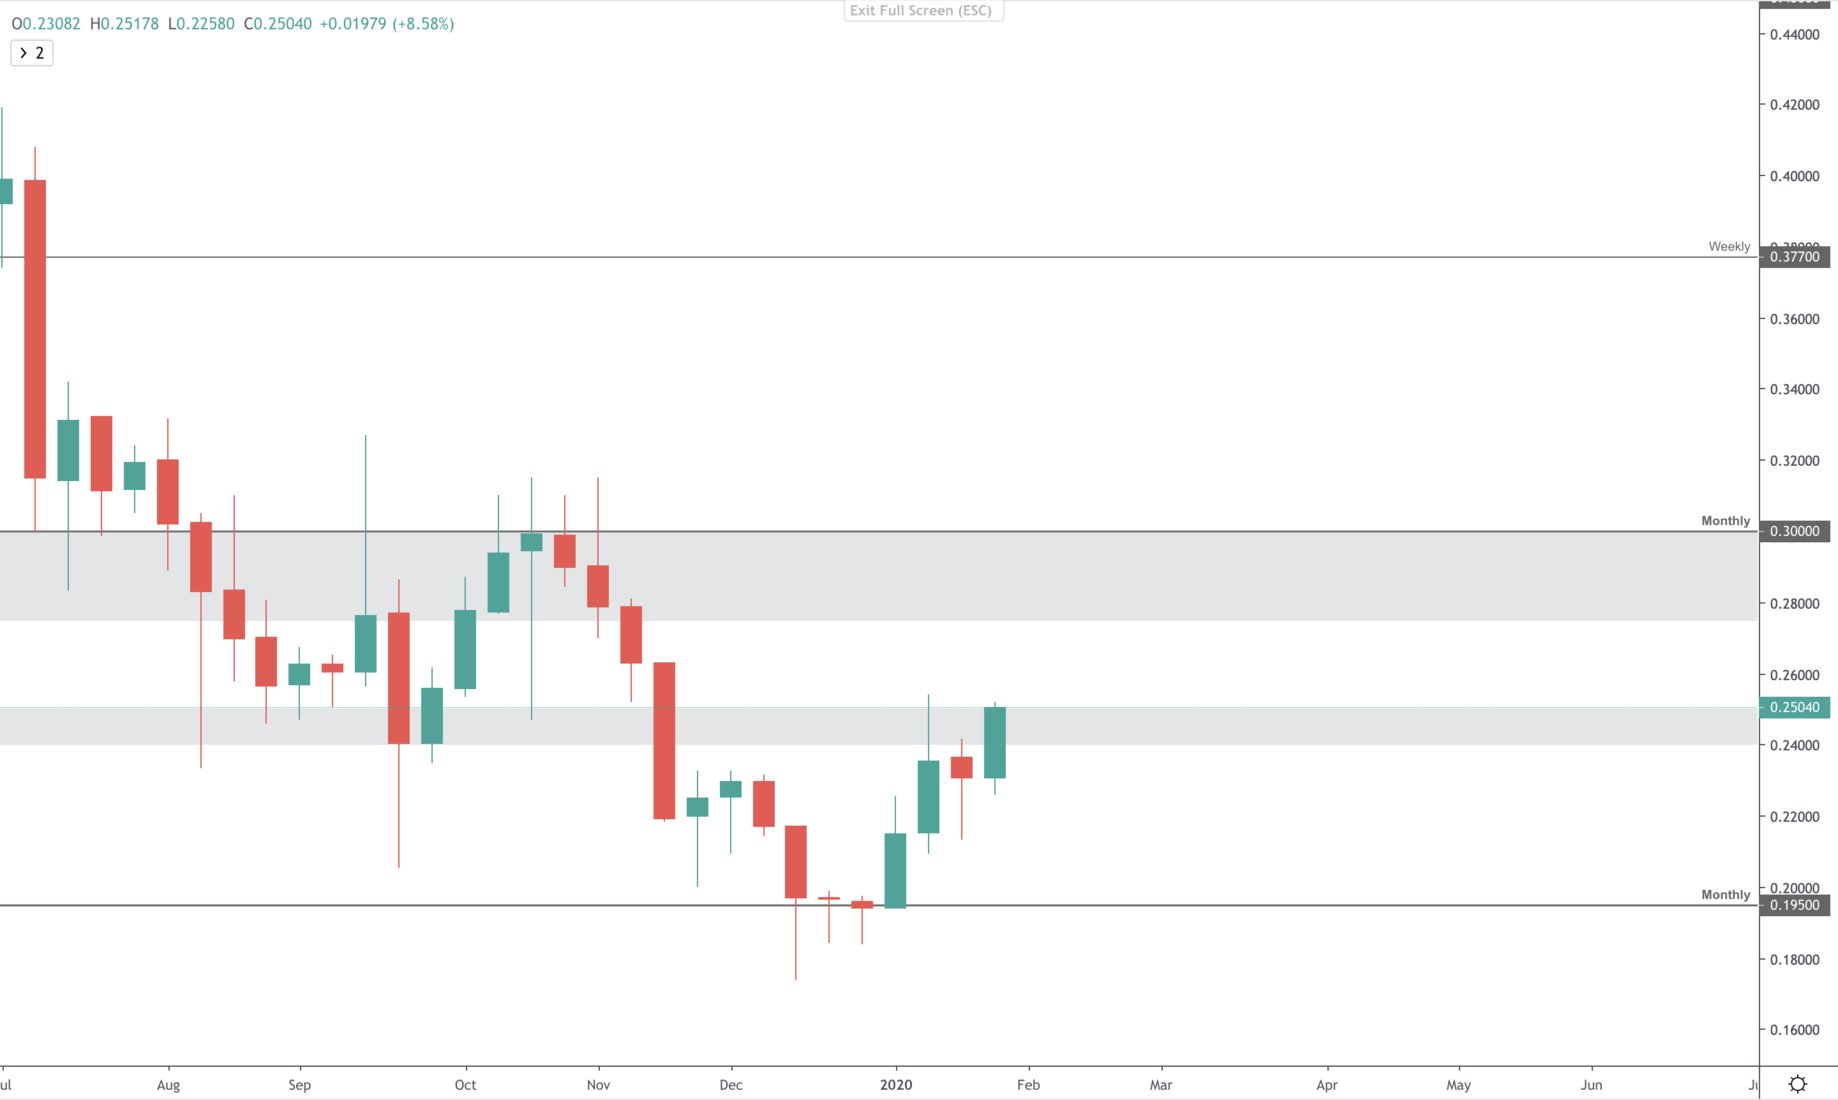
Let’s have a look at the weekly timeframe as the candle will close tonight.
XRP peaked during the 2019 rally on the 22nd of June at $0.50. Since, it has been registering lower highs and lower lows. The past two weeks attempted to break that LH/LL structure by going above the last weekly low at $0.24 registered in September with no luck.
Buyers finally stepped with strength. If, and only if, the weekly candle closes above the weekly area of [$0.24-$0.25], then the downtrend structure would be broken and the next target would sit at $0.30 (+20%). But will that be enough to outperform Bitcoin?
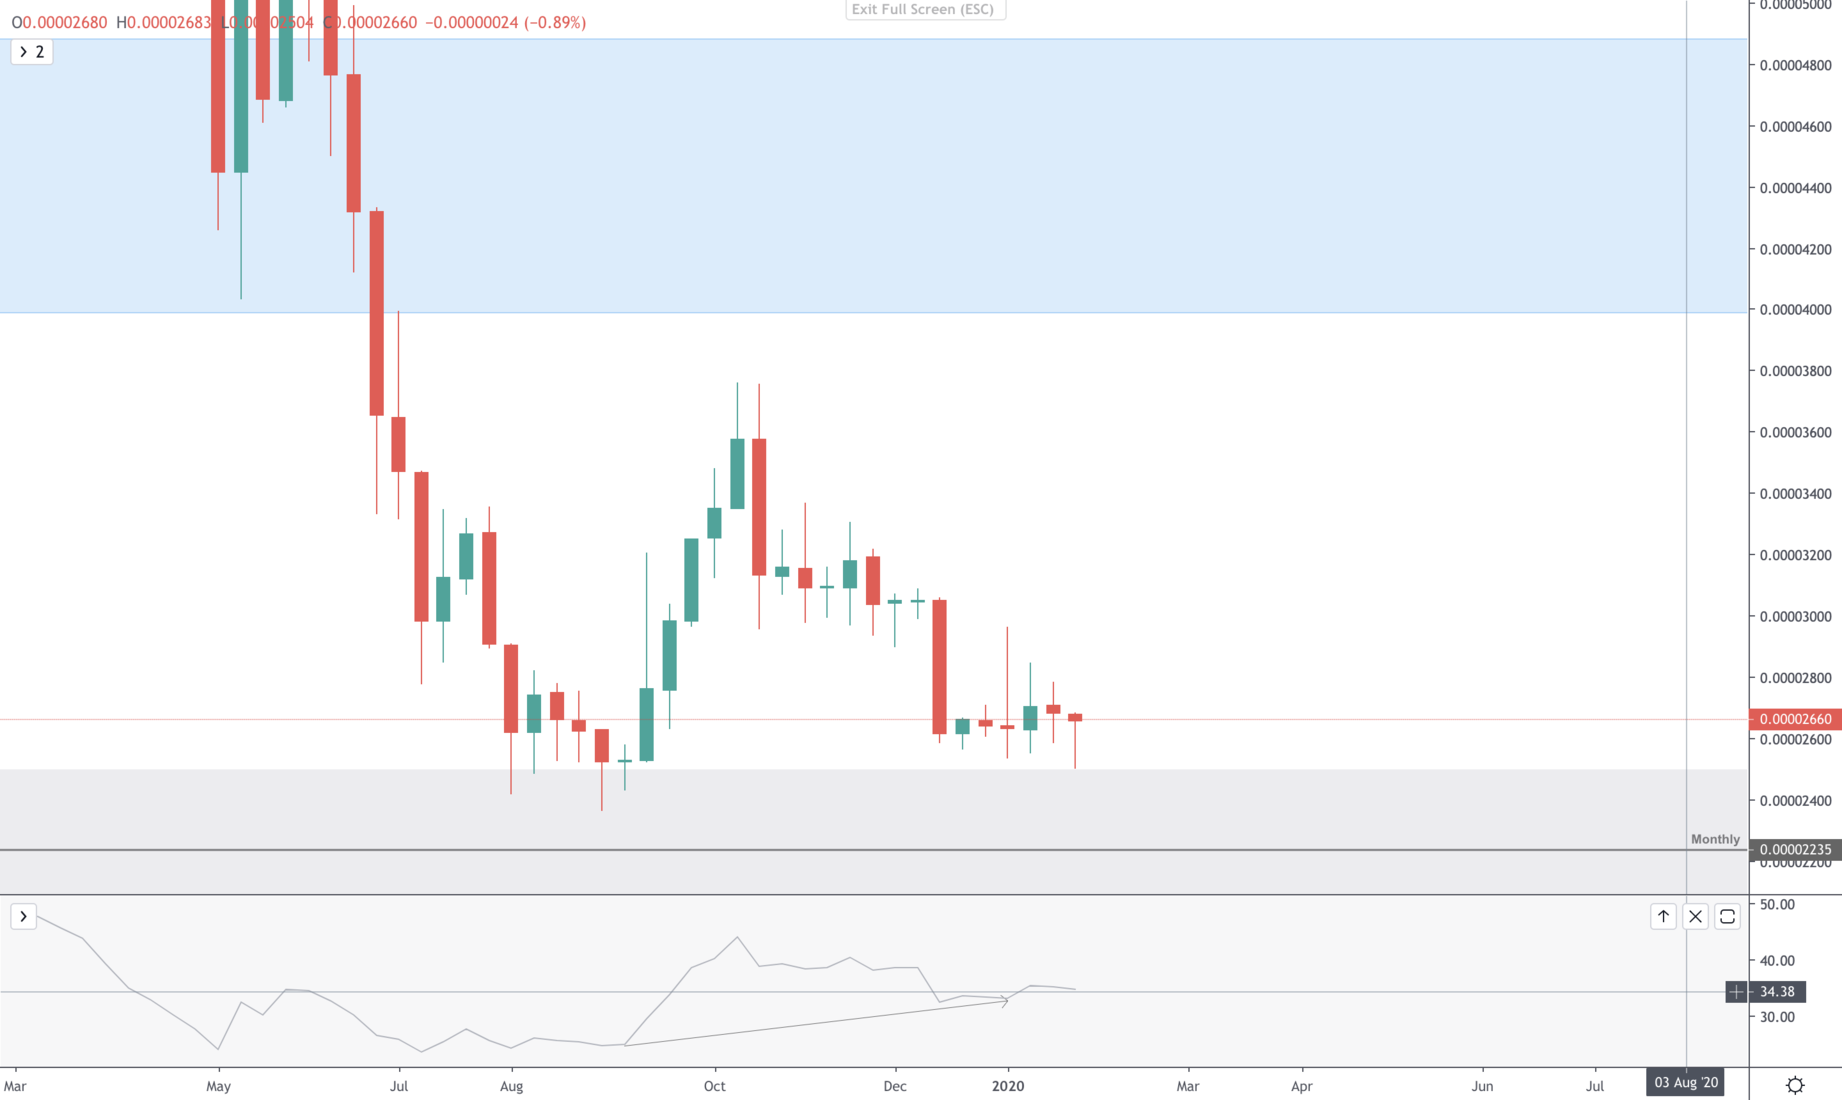
That’s when we have a look at the XRP/BTC chart. Price found support at the grey liquidity zone near 2500 SATS, with enough demand to push the price beyond 3500 SATS on the first test. This second test is bringing with it a double-bottom with an exaggerated bullish divergence and a bullish hammer weekly candle proving that buyers are currently overpowering the sellers.
As long as 2500 SATS holds on the weekly timeframe, the next target will be the blue zone which starts at 4000 SATS.
To conclude, Bitcoin is in a clear uptrend alongside the entire market as we’ve established in the IGTV. XRP is gaining strength in its USD pair and by looking at the BTC pair we are able to see that XRP will probably outperform Bitcoin for the foreseeable future.
Recommended from Cryptonary


