Save 23% ($351) & Get a Free 1-1 Call with our Team ⏰ : 0d 2h 59m 43s
Technical Analysis

Disclaimer: This is not financial or investment advice. You are responsible for any capital-related decisions you make, and only you are accountable for the results.
XRP ($XRP):
Overview
XRP is amongst one of those handful alts which are showing remarkable relative strength compared to the broader market amidst recent pullbacks. Currently trading at $3.17, XRP is consolidating within a range defined by $3.317 (2018 ATH) on the upside and $2.758 on the downside.The asset is holding above the 200 EMA on the 4-hour time frame, which is positioned around $2.84, adding confluence to the support at $2.758.
Analysis
- Support levels:
- $2.758: A key support zone that XRP has respected, preventing it from breaking lower despite market volatility.
- 200 EMA (4H): Acting as a dynamic support.
- Resistance levels:
- $3.317: A significant historical level marking XRP's 2018 all-time high, which has acted as strong resistance in recent attempts to break higher.
- If XRP flips this level into support, it could trigger a strong upward continuation.
- Potential scenarios:
- Bullish continuation: If XRP maintains the $2.758 - $3.317 range, the next move would likely test and potentially break above the $3.317 resistance, leading to price discovery toward higher levels.
- Bearish breakdown: A break below $2.758 could see XRP returning to its previous range between $2.75 and $1.96, potentially testing the $2.00 level.
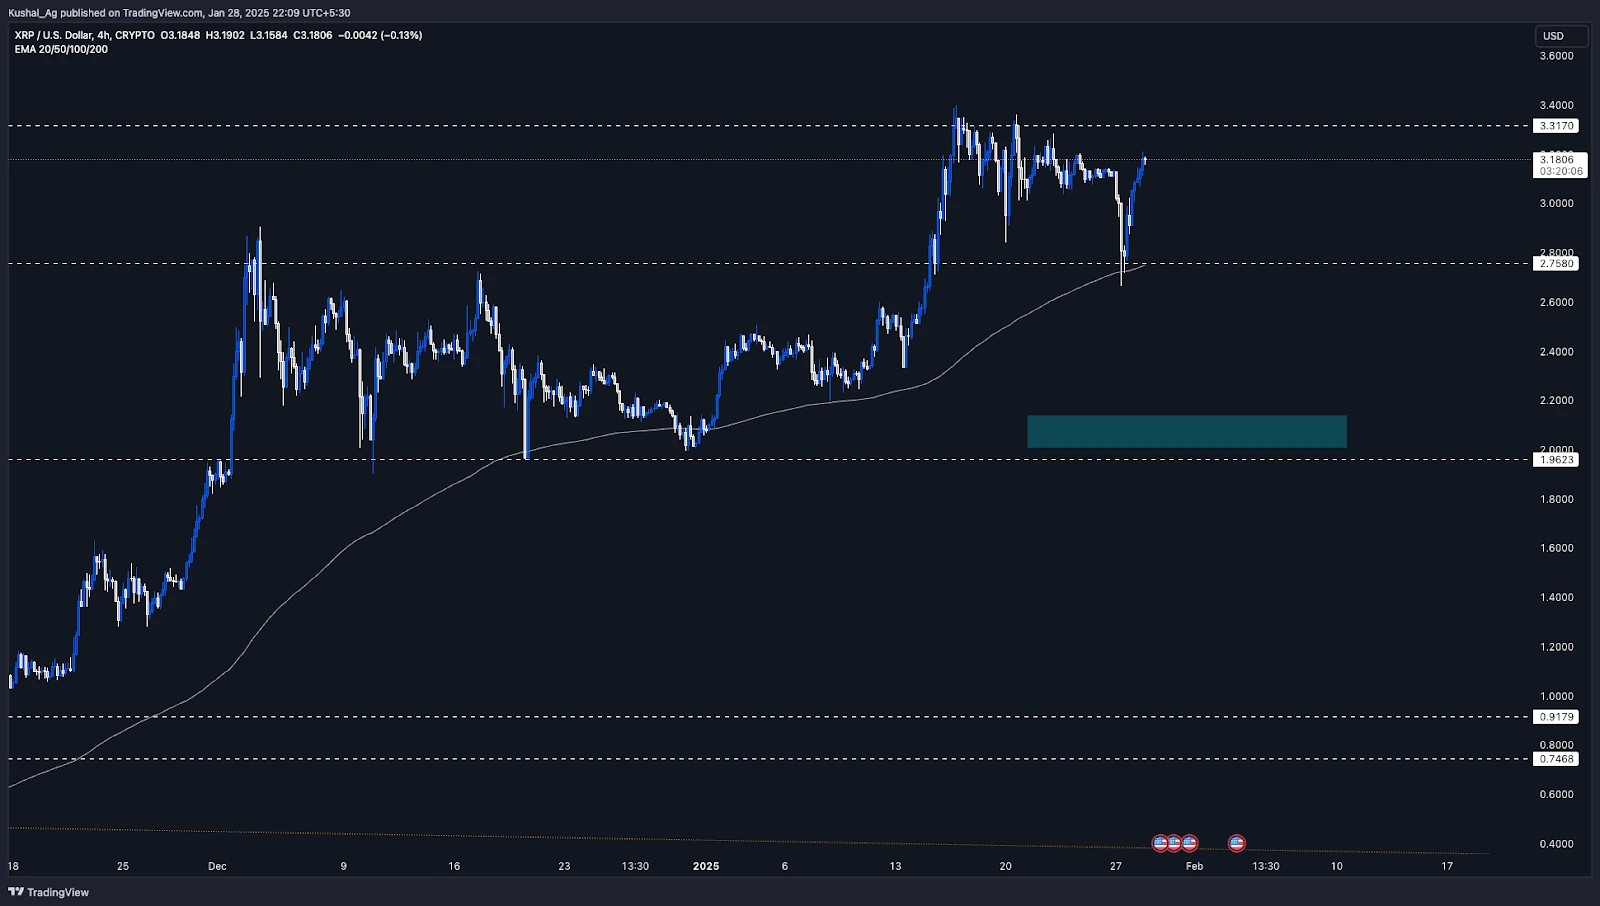
Cryptonary's take
XRP is showing notable strength relative to the broader market. The ability to hold the $2.758 region, along with the support of the 200 EMA, indicates that buyers are stepping in at key levels. However, breaking through the $3.317 resistance will be crucial to XRP's short-term trajectory.Shiba Inu ($SHIB):
Overview
Shiba Inu has broken down below key support levels on the daily time frame, including $0.00002 and the 200 EMA, and is currently trading at $0.0000198. SHIB is now trading within the range of $0.000016 to $0.00002, indicating increasing downward pressure as it struggles to reclaim lost support.Analysis
- Current price action:
- SHIB is trading above the $0.000016 support zone, a critical level that has historically provided a base for price bounces.
- The break below the 200 EMA adds bearish weight, signalling a potential continuation of the current downtrend if support levels fail.
- Trend formation:
- A descending orange trendline highlights SHIB's pattern of lower highs and lower lows, reinforcing the bearish structure.
- Breaking above this diagonal resistance would indicate a shift in sentiment and pave the way for recovery.
- Key levels:
- Supports:
- $0.000016: Immediate support; losing this level could lead to further decline.
- Resistances:
- $0.00002: Immediate resistance level that needs to be reclaimed to neutralize bearish momentum.
- $0.0000238: A critical level to flip for bullish continuation in the medium term.
- Supports:
Potential scenarios
- Bullish case:
- If SHIB holds above $0.000016 and manages to break the orange diagonal trendline, we might see a recovery, followed by an attempt to reclaim $0.0000238.
- Bearish case:
- Failure to hold the $0.000016 support zone could lead to further downside, potentially testing deeper levels below $0.0000119.
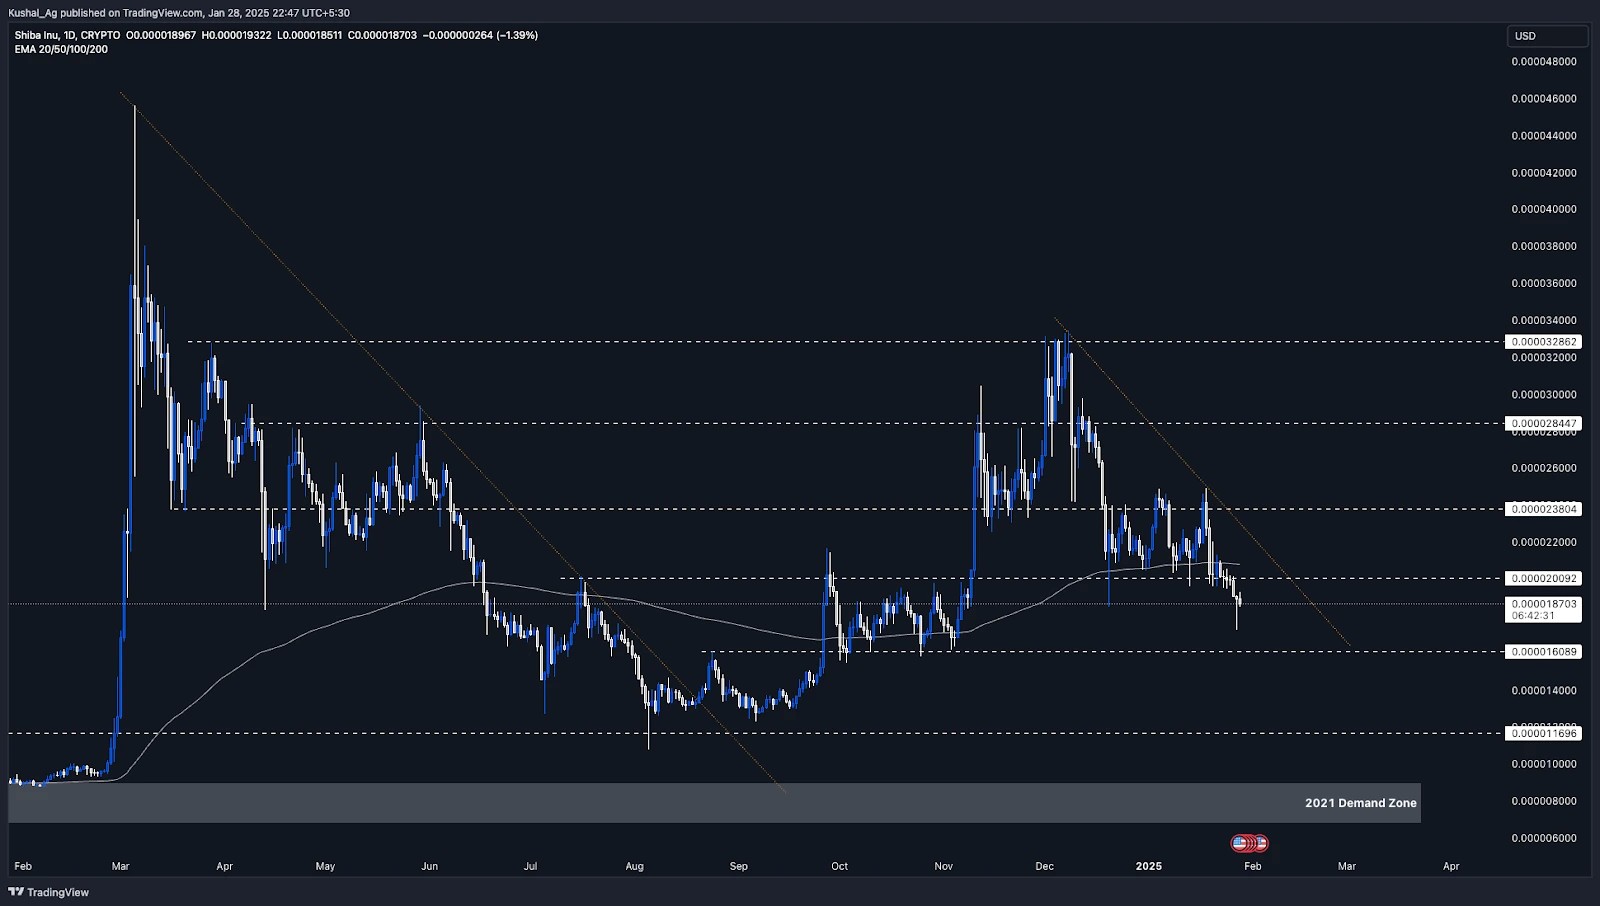
Cryptonary's take
Shiba Inu is currently in a pivotal phase, with key supports being tested and bearish momentum prevailing. For SHIB to regain investor confidence, it must break above the descending trendline and reclaim the 200 ema on the daily timeframe for the least, signalling a potential trend reversal.Recommended from Cryptonary


Market Pulse
4 min read
Mar 19, 2026

PRO
Market Direction
13 min read
Mar 17, 2026

PRO
Market Updates
9 min read
Mar 16, 2026
