Save 23% ($351) & Get a Free 1-1 Call with our Team ⏰ : 0d 2h 59m 43s
Market Analysis

Key price level: $0.50
Note: these charts are two different time periods, although price action on the charts is eerily similar.
Looking back to September 2014 where XRP began forming a rangebound price until April 2017. Price action was stuck, bouncing between $0.004 and $0.031 when a breakout occurred around May 2017. Comparing this with the current price action we're seeing, it's very similar. Further backed by a proven statistic that XRP stays in an accumulation channel for around 65 weeks and the price being in the bottom of the long term buy zone.
-
- Our bias remains bullish over the long term.
- Both charts show a hard rally that declines into an accumulation channel.
- Rallies form rounding tops before breaking key price levels that go on to make new all time highs.
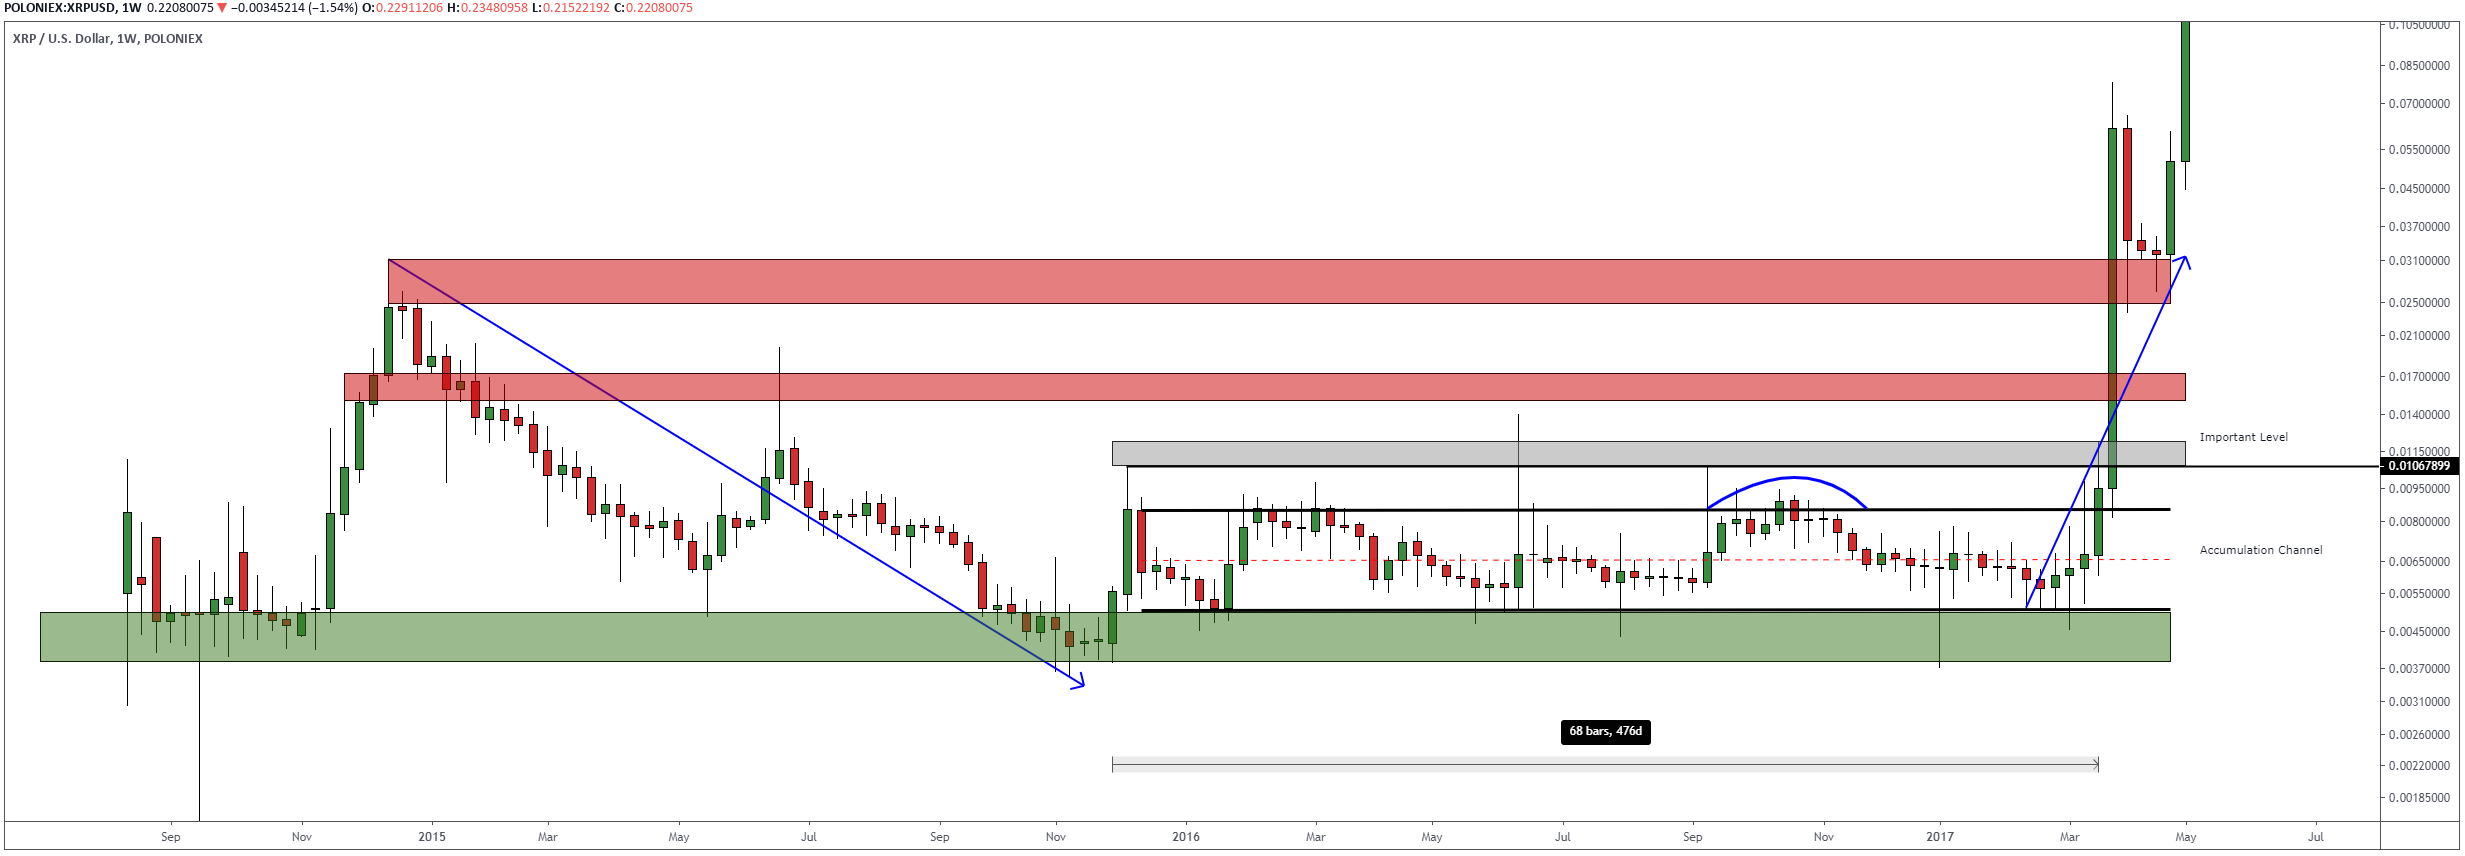 XRP 2014 Fractal - click for fullscreen[/caption]
[caption id="attachment_11709" align="aligncenter" width="2436"]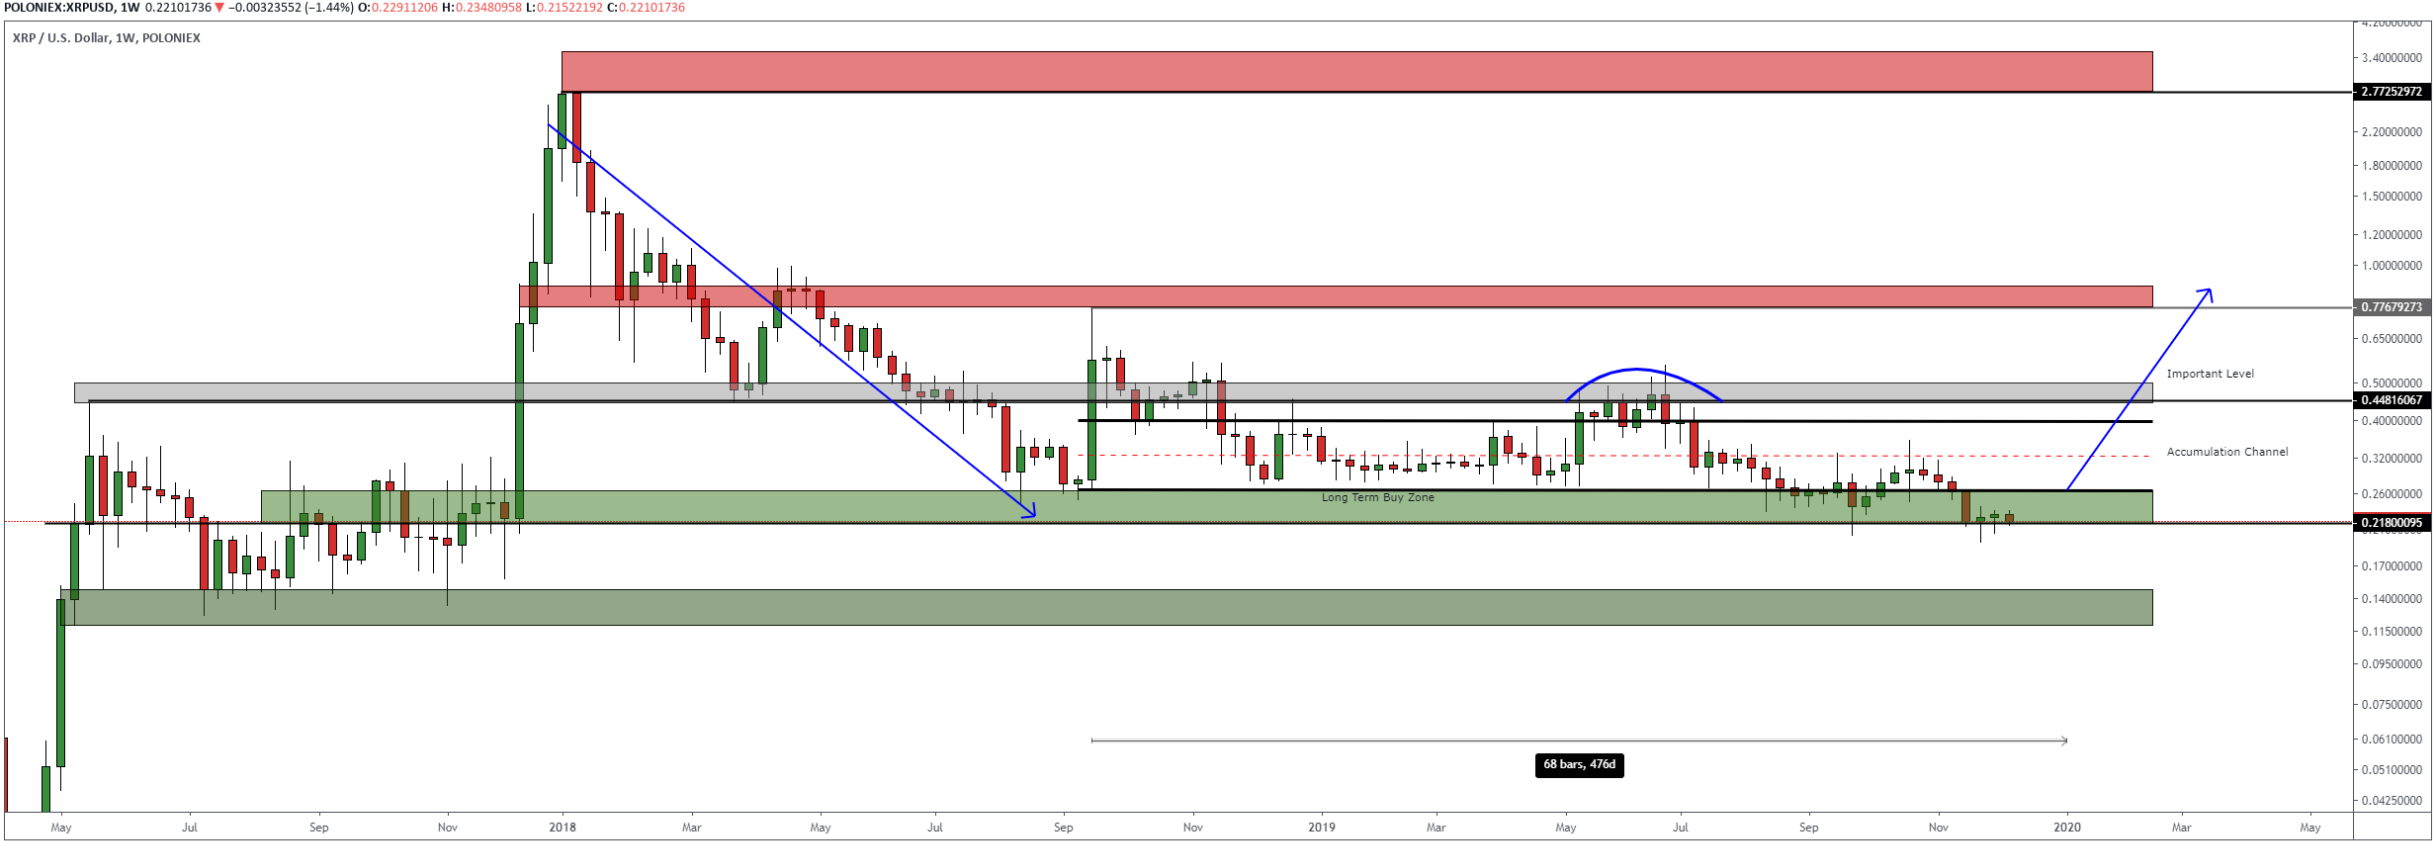 XRP 2019 Fractal - click for fullscreen[/caption]
Recommended from Cryptonary


Market Pulse
4 min read
Mar 19, 2026

PRO
Market Direction
13 min read
Mar 17, 2026

PRO
Market Updates
9 min read
Mar 16, 2026
