Save 23% ($351) & Get a Free 1-1 Call with our Team ⏰ : 0d 2h 59m 43s
XRP Technical Analysis - Registering multi-year lows [PRO+]
The black swan that sent Bitcoin down by over 50% within a single day did not spare the third-largest cryptocurrency; XRP. The latter has been struggling to break its bearish LH/LL structure on large timeframes for a few months and the crash certainly did not help it. In fact, XRP/USD reached levels unseen since August 2017 prior to the massive bull-run.
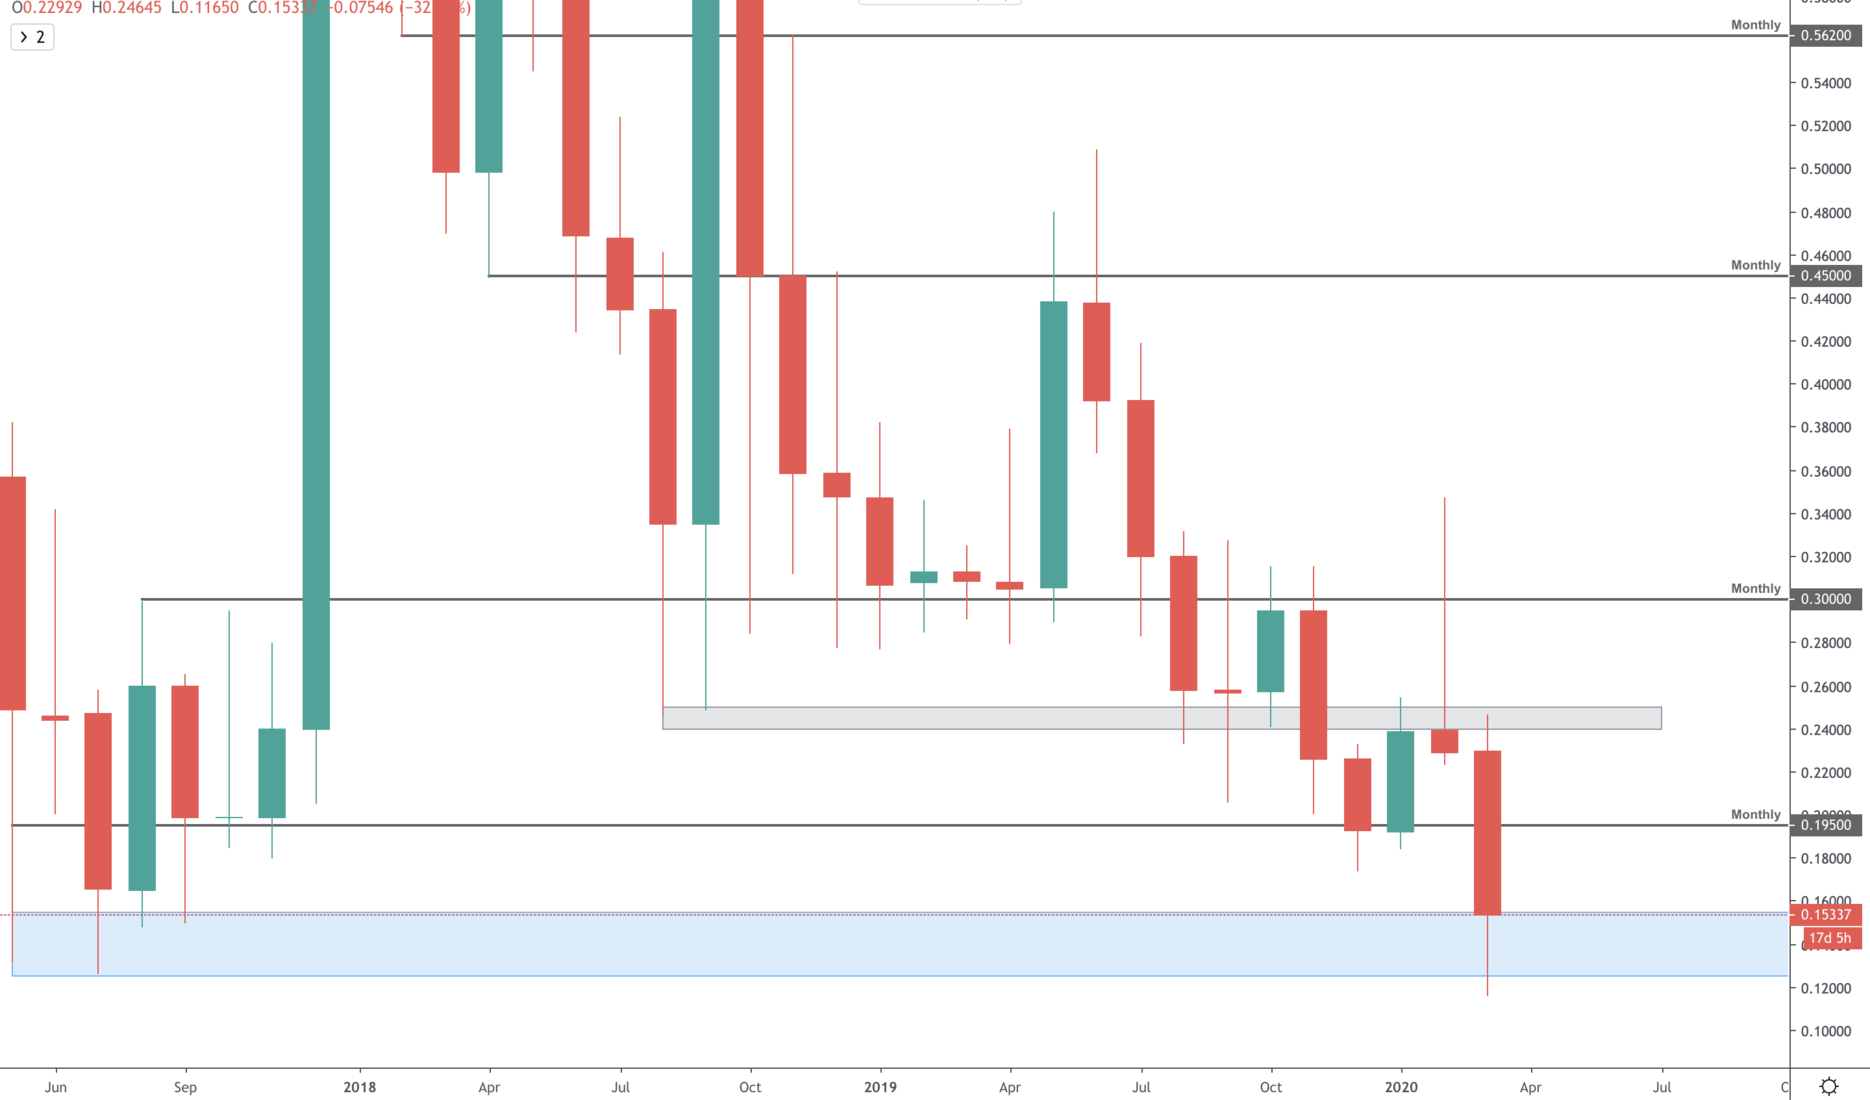
Starting out with the monthly timeframe we can see a very clear bearish structure, especially since the mid-2019 rally. Price has been breaking candle closure lows and showed inability to reclaim them twice so far. After months of downside, price has reached the [$0.125-$0.155] liquidity area that has provided enough fuel for the 1,500%+ rally of 2017. As the latter has communicated strength in the past, we view it as a great place to accumulate spot positions in this crypto-asset.
Going one order of magnitude lower on timeframes, the weekly chart offers us a slightly more detailed view into the actions of market participants.
[caption id="attachment_14983" align="aligncenter" width="2880"]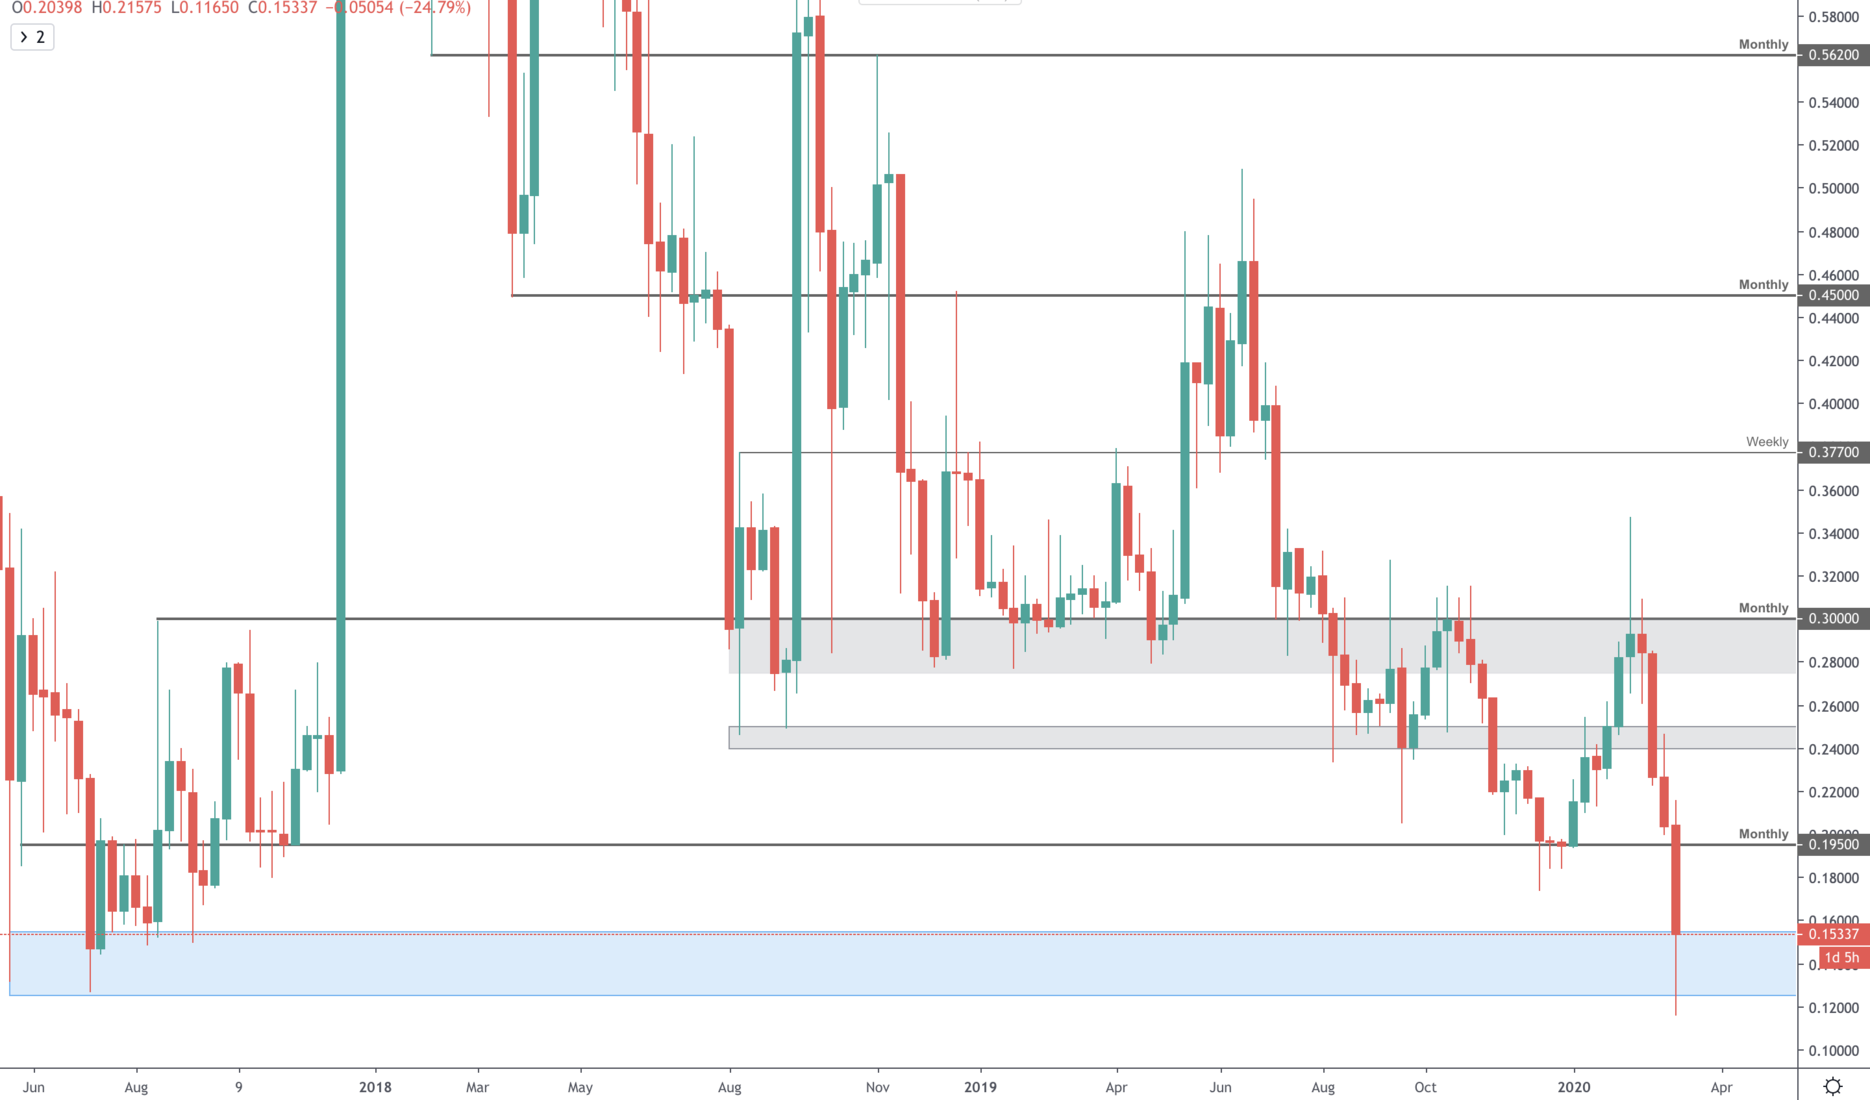 XRP/USD [1W][/caption]
[$0.275-$0.30] had offered a lot of support for XRP/USD. In fact, the first time it had visited that level post-2017 price rallied all the way towards $0.80. Each dip into that support level showed great buying. Nonetheless, a support can only hold so much before buy orders get depleted, which is exactly what happened in H2 2019. Price broke down below the support area, retested it as resistance and dropped towards $0.195.
The latter occurred in the beginning of 2020 when the crypto-market was showing signs of strength and bullish momentum. We had built a long position from $0.25 which we’ve derived from the 1D TF and were anticipating $0.30 to finally be broken on the weekly timeframe which would have broken the bearish structure and signaled a potential rally. As can be seen this did not occur, which invalidated our position. Our exit signal however, came from the daily timeframe and made us exit at $0.295 for a small profit.
[caption id="attachment_14981" align="aligncenter" width="2880"]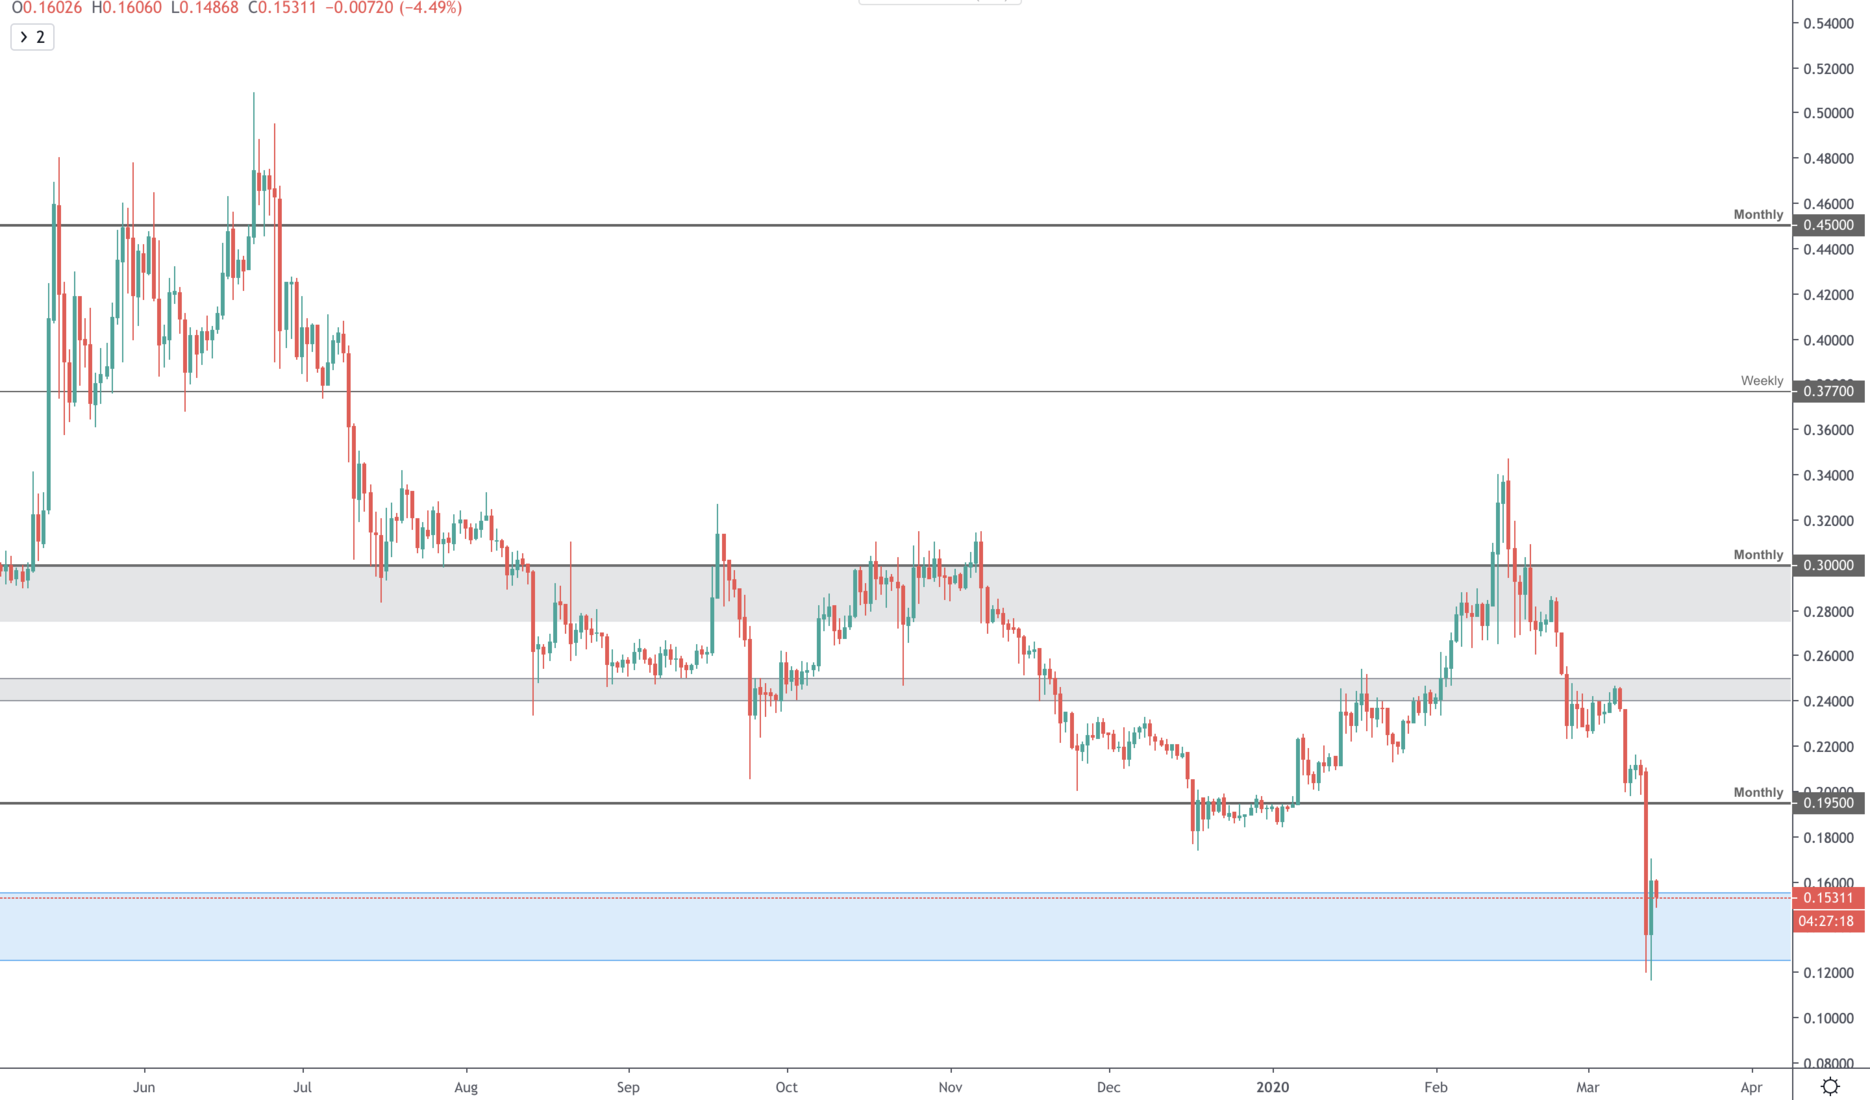 XRP/USD [1D][/caption]
As soon as price had closed a daily candle under $0.30, we immediately exited our longs as the scenario we were trading was deemed obsolete. Since then, price kept drifting lower until it finally reached [$0.125-$0.155]. From here where is price likely to go?
First off, we shall warn that there are absolutely no certainties or high probability events during black swans, the only highly probable outcome is volatility. Nonetheless as this is a highly uncalled for movement due for cryptocurrencies due to panic selling, we view it as a great buying opportunity for long term holdings. Of course if price breaks down below $0.125 with a daily closure, we would re-consider our approach.
From a shorter-term trading perspective, if tonight’s candle closes above $0.155 there may be an opportunity to long towards a $0.195 target (25% profit).
We always preach that the cryptocurrency market is full of public information and this is not exception. For that, our first stop is the BTC pairing of the asset.
[caption id="attachment_14979" align="aligncenter" width="2880"]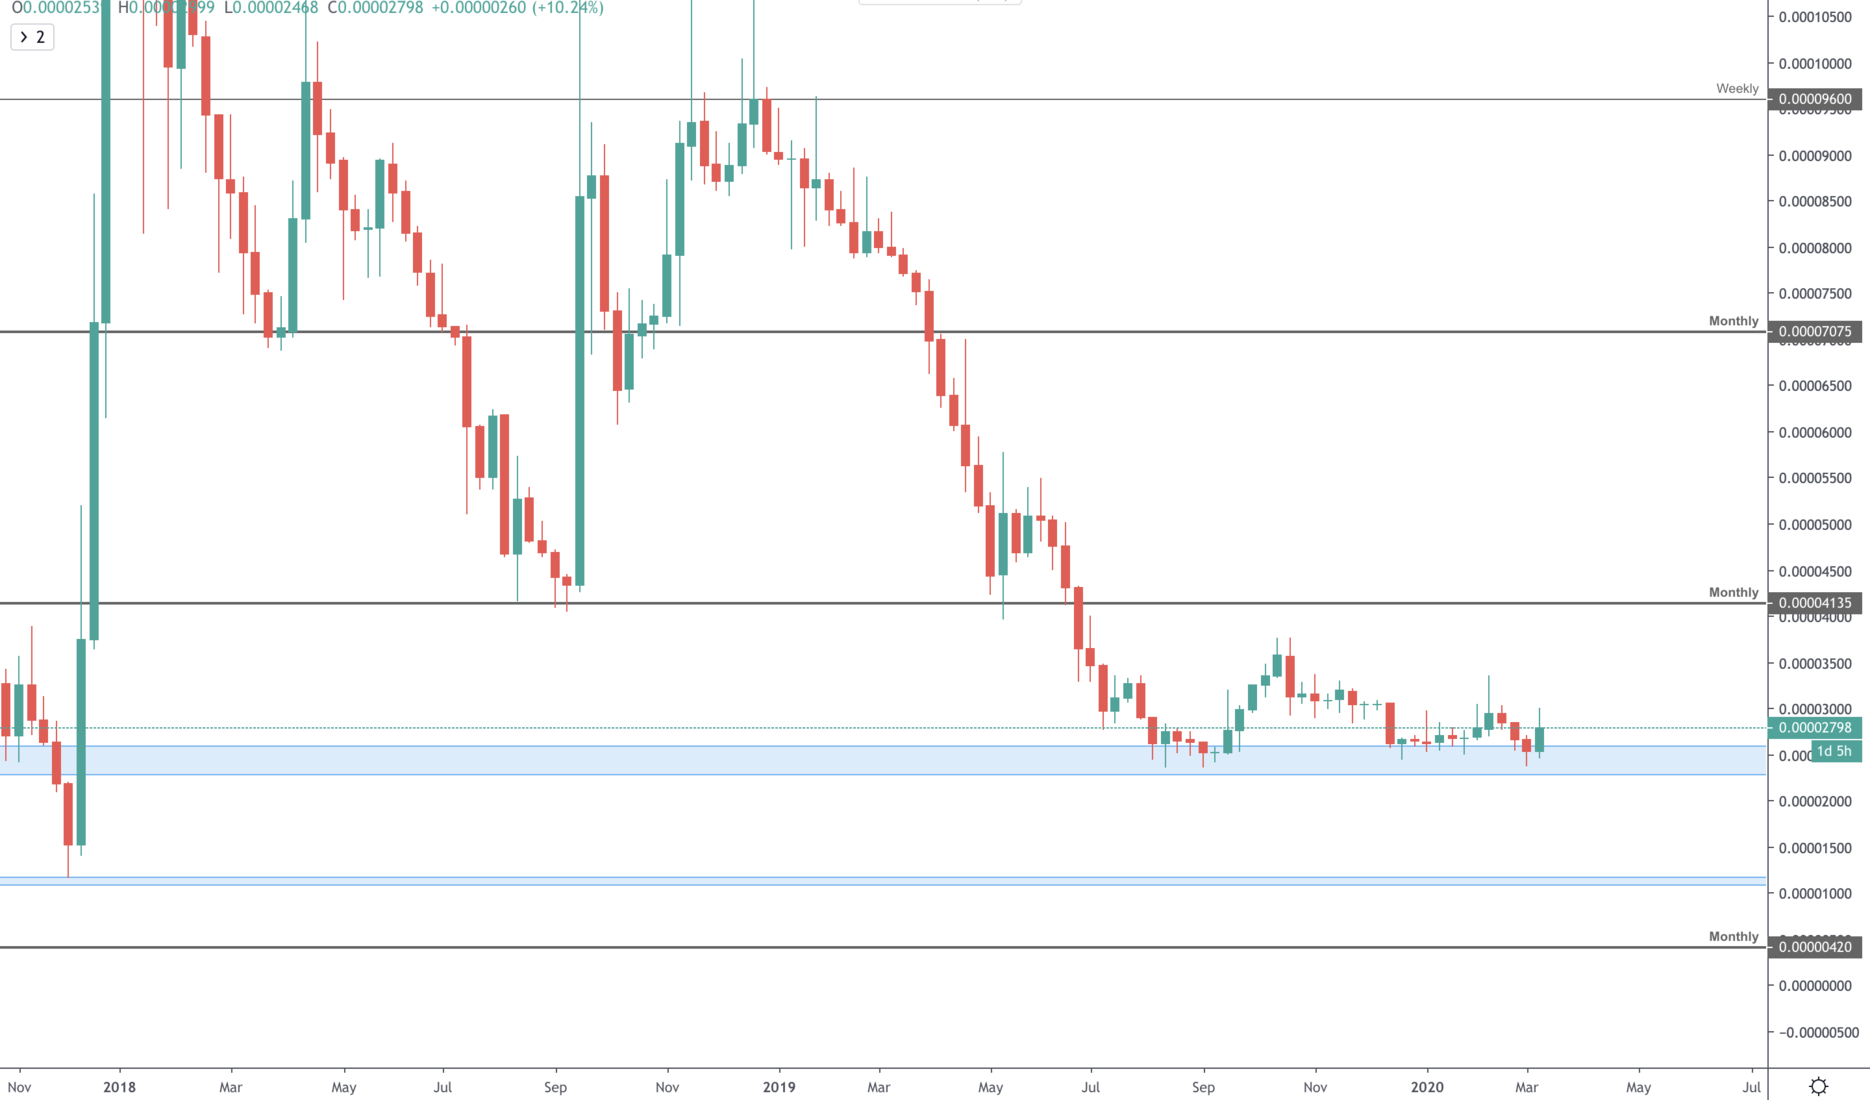 XRP/BTC [1W][/caption]
As can be seen, [2280-2600] has been offering good support for the better part of a year now. That creates an opportunity for XRP to outperform Bitcoin with a chance to approximately double in valuation with a 4135SATS target. The other side of the coin reads, the long price stalls at support, the less buyers there are and the higher the chance of a breakdown towards [1090-1170]. Shortly put, XRP has the upper hand against Bitcoin, but this may not last much longer if price keeps stalling.
[caption id="attachment_14980" align="aligncenter" width="2880"] XRP/ETH [1W][/caption]
Our second stop is the ETH pairing, which just recently provided a great trading opportunity from [0.0009-0.001] towards 0.0012 (20% gain), as XRP outperformed ETH during the crash. As explained to members when we first put our eyes on that level, we expect a great reaction at the first touch but in order for XRP to outperform ETH on a larger scale and reach new highs, a base will need to be built, which we anticipate to be around done around [0.0009-0.001]. This communicates, that we overall view ETH & XRP to have somewhat of a similar performance, with an upper hand to ETH for a short while.
Our last stop is the XRP Dominance chart, which has not been covered by anyone in this space.
[caption id="attachment_14978" align="aligncenter" width="2880"]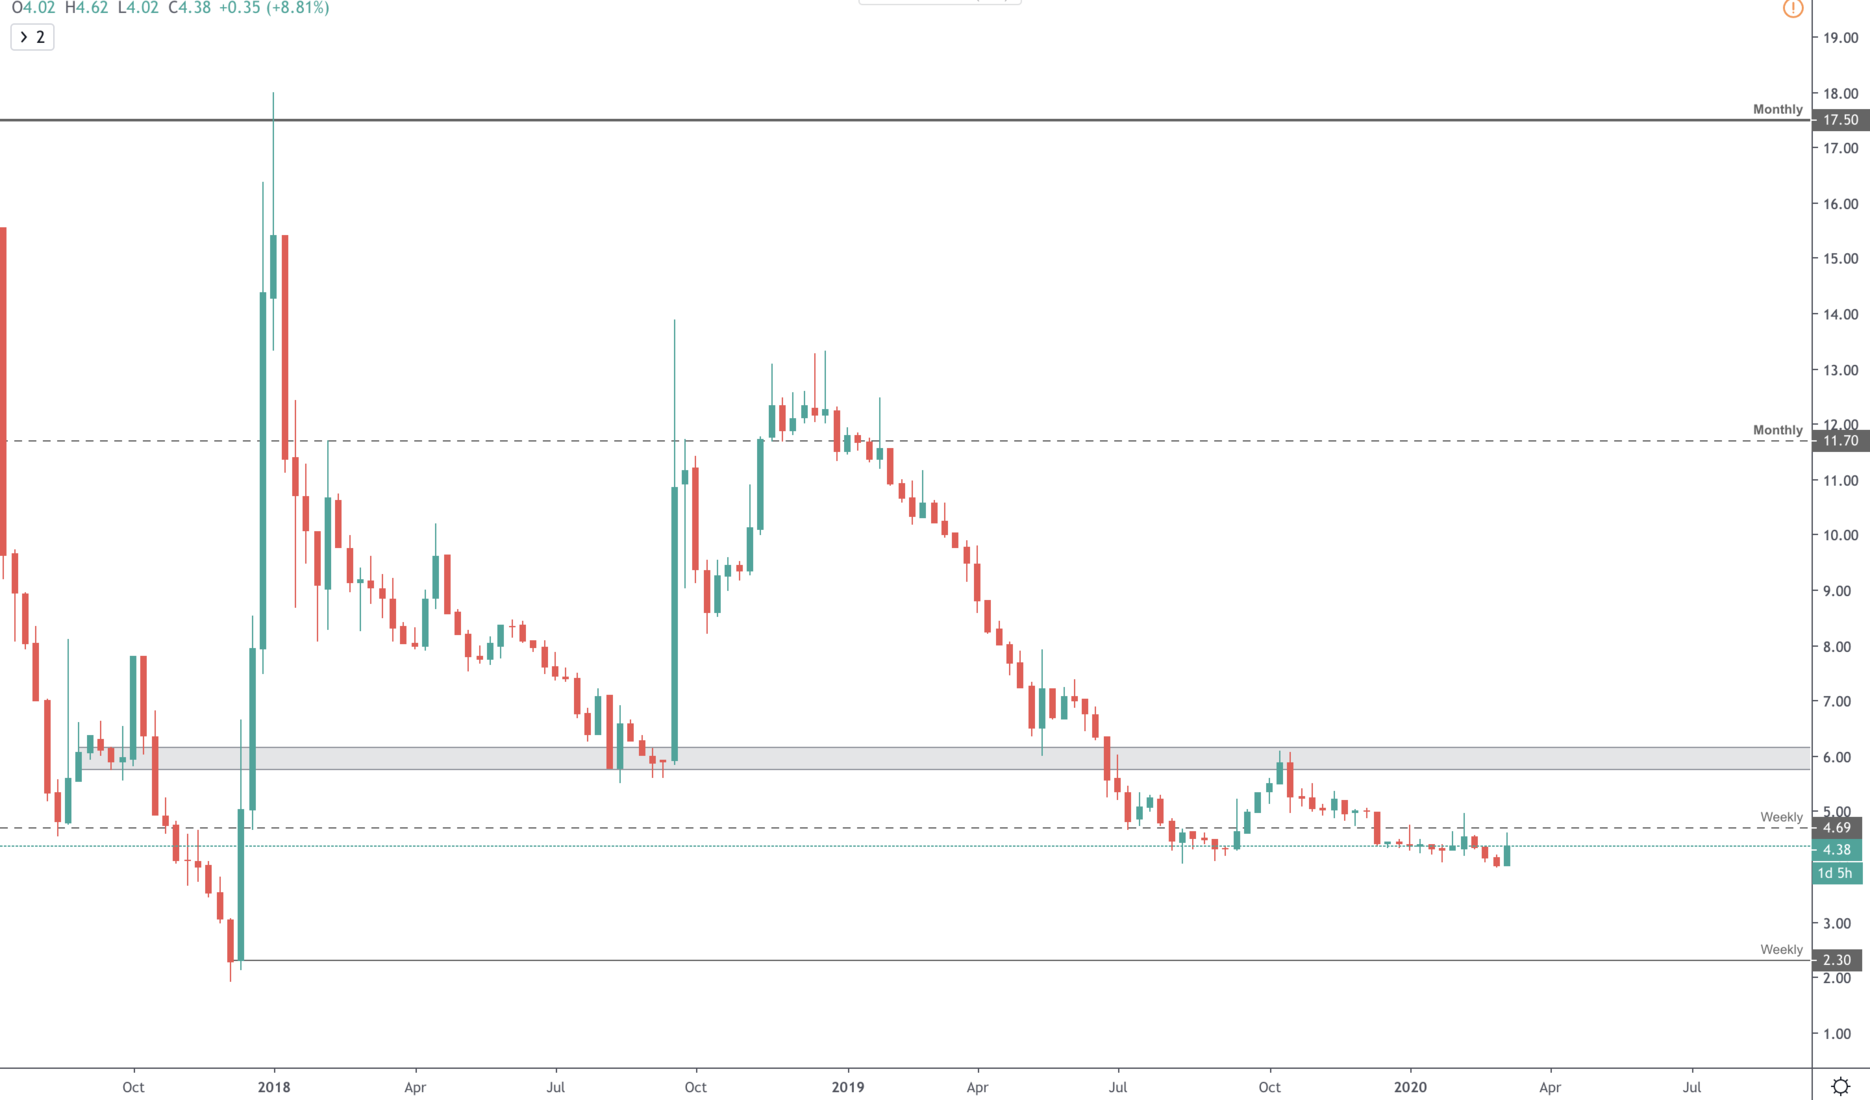 XRP Dominance[/caption]
At first sight, it seems oddly similar to XRP/BTC, and that is because BTC dominates the major part of the market in terms of market capitalisation. However, upon closer inspection, this gives us some clues that are not seen elsewhere. The XRP/BTC unbroken support is broken here and seems as it has been turned to resistance. While dominance charts are not traded by market participants and hence technical analysis concepts cannot be strongly applied, it can provide some loose opinions. And this chart, currently communicates a bearish one. Which falls in line with ETH outperforming XRP for a short while (results in ETH gaining some XRP market share).
Recommended from Cryptonary


