Save 23% ($351) & Get a Free 1-1 Call with our Team ⏰ : 0d 2h 59m 44s

Disclaimer: This is not financial or investment advice. You are responsible for any capital-related decisions you make, and only you are accountable for the results.
XRP ($XRP):
Overview
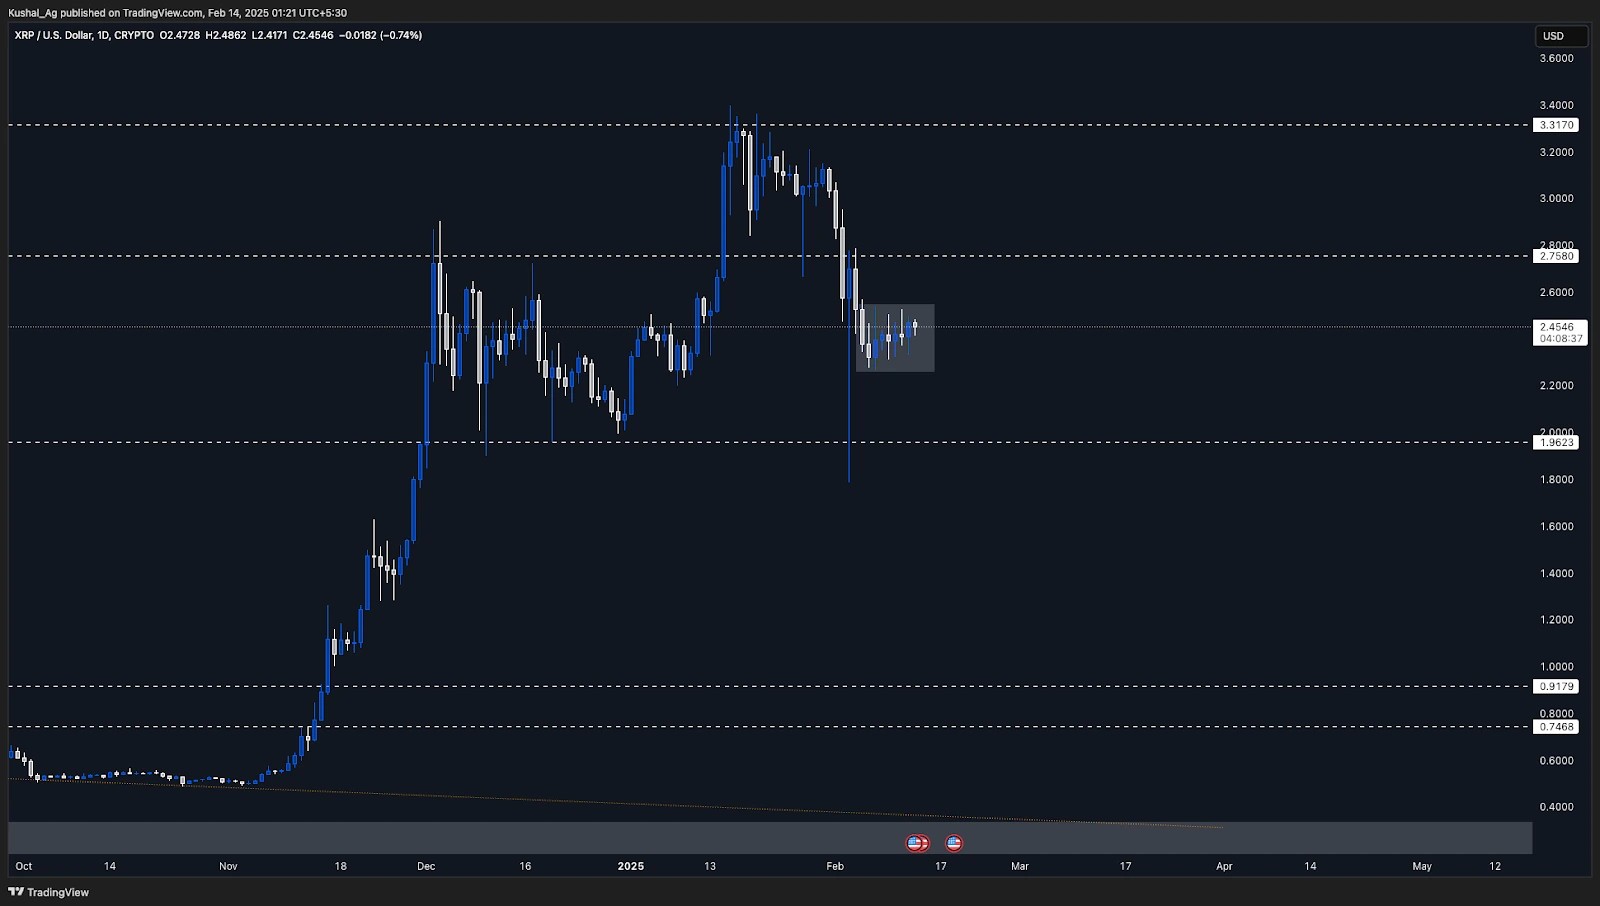
XRP is currently trading at $2.46, following a significant retracement from its all-time high of $3.39. After breaking down from the $3.31 - $2.75 range, XRP tested the lower range of $1.96 - $2.00, wicking down to $1.795-a sharp 47.37% drawdown from the high. Despite this, XRP quickly rebounded and is now back within the $2.75 - $1.96 consolidation range.For the past week, it has been squeezing within a tighter range, marked by the grey box, signalling the potential for either a breakout or extended consolidation.
Analysis & key levels
- Support levels:
- $1.96 - $2.00: Strong support range that previously acted as a major bounce zone.
- $1.795: The recent bottom from which XRP quickly recovered.
- Resistance levels:
- $2.75: This was previous support, but it has now turned resistant after the breakdown.
- $3.31 - $3.39: The all-time high level.
Potential scenarios
- Bullish case:
- If XRP holds above $1.96, it could continue consolidating before an eventual breakout.
- A break and close above $2.75 would confirm bullish momentum, opening the door for a move toward $3.31 and beyond.
- Bearish case:
- If XRP loses its current tight consolidation, it could lead to a retracement to the range bottom, testing $1.96 or lower.
- Given the tight range and low volatility, a fakeout or liquidity grab before a real move is possible.
Cryptonary's take
XRP is currently in a state of consolidation, with price action squeezing into a tighter range. A break on either side will determine the next trend.For now, it makes sense to wait for a confirmation move rather than force a bias. If $1.96 holds, we could see accumulation before a breakout. However, if XRP continues to break down, we might see lower levels before any recovery.
TRON ($TRX):
Overview
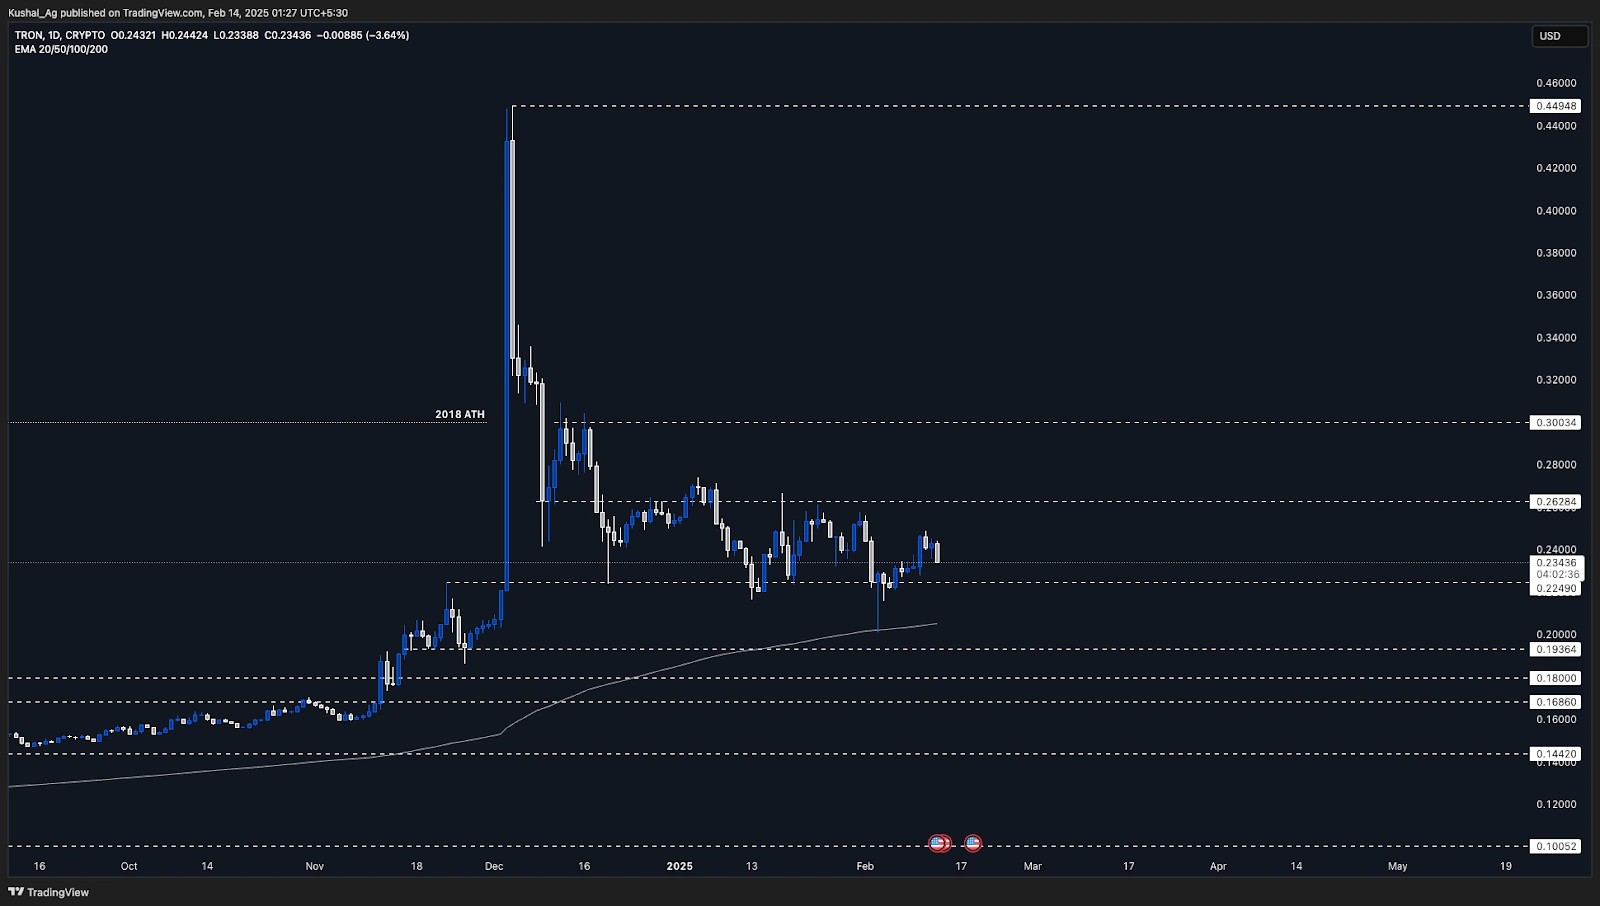
TRON ($TRX) remains range-bound, currently trading at $0.234. The asset has reclaimed the 200 EMA on the daily time frame, which is sitting at $0.231, and is using it as a support level. If this holds, TRON could be setting up for a strong move in the coming weeks/months.For a bullish continuation, TRON needs to break above $0.262, the top of the current range. This would confirm momentum for a push toward $0.30-a key psychological level. However, failure to hold above the 200 EMA and the $0.224 support zone could lead to a deeper retracement.
Analysis & key levels
- Support levels:
- $0.231 (200 EMA): Currently acting as a support level.
- $0.224: Bottom of the current trading range.
- $0.193: If the range breaks down, this is a stronger support area.
- Resistance levels:
- $0.262: The top of the range-a key breakout level.
- $0.30: If $0.262 is broken, this will be the next major resistance.
- $0.449 (ATH): A break past $0.30 could open doors for price discovery.
Potential scenarios
- Bullish case:
- TRON continues holding above the 200 EMA and $0.224 support.
- A break above $0.262 confirms bullish momentum and could trigger a move toward $0.30 and beyond.
- Bearish case:
- If TRON breaks below $0.231 (200 EMA) and $0.224, we could see a move toward $0.20 and $0.193, where stronger support lies.
- A deeper correction could be triggered by market-wide weakness.
Cryptonary's take
TRON is currently in a consolidation phase, but holding the 200 EMA as support is a strong sign. If momentum picks up and TRX breaks above $0.262, it could set up for a strong leg higher toward $0.30 and beyond. However, if the 200 EMA fails, we might see a test of lower levels around $0.20 - $0.19 before any further upside.For now, patience is key as the range remains intact, and we wait for a clear breakout or breakdown signal.
AI16Z:
Market context
AI16Z has experienced a significant pullback, currently sitting at a $507M market cap after a 90% drawdown from its highs of $2.36 to a swing low of around $0.250.On the daily timeframe, there was an attempt to hold the $570M market cap region as support, but that level—originally not well-established due to how early the token was in its lifecycle—has now flipped into resistance. This was confirmed on February 11th, when Price faced rejection instead of showing a bullish continuation.
The fact that buyers were previously willing to step in at this level but are now looking to sell instead is not a great sign for short-term strength. This doesn’t mean AI16Z is done, but it does highlight that momentum has shifted, and the AI sector itself is oversaturated.
A lot of these high-flying tokens that ran well in the last few months are now dispersing capital, and we’re seeing rotation into other areas of the market. The reality is, that it’s not about whether the token itself is bad—it’s about understanding market conditions and capital flow.
Playbook
At this stage, holding AI16Z through uncertainty makes little sense. Sitting in stables is the best move, allowing for flexibility to reallocate—either into stronger narratives or back into AI16Z if it reclaims key levels and shows renewed strength. It’s always better to buy back higher with conviction than to hold through hope.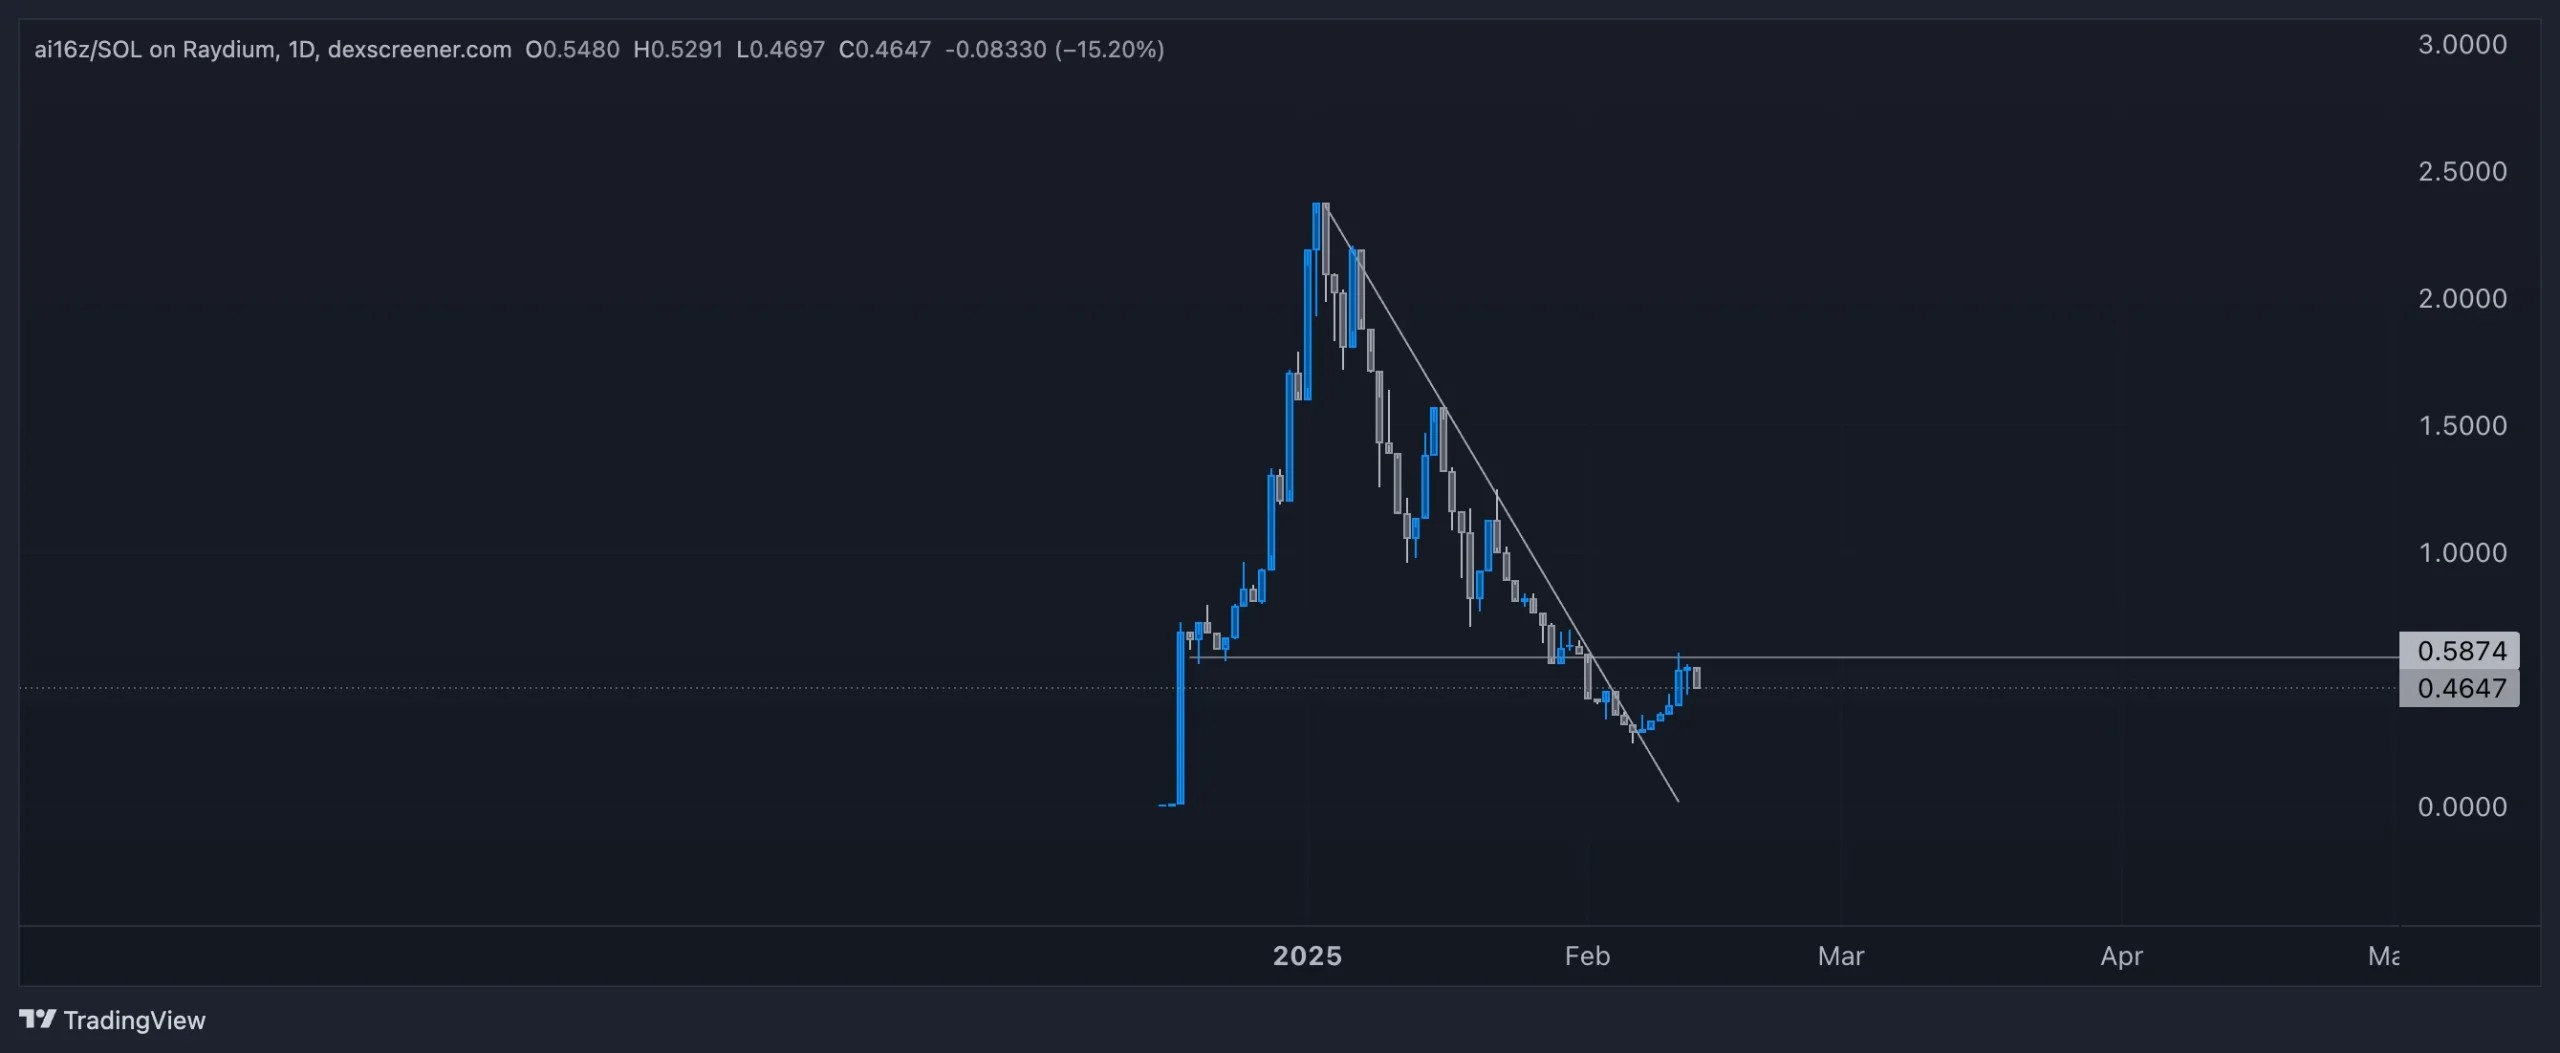
Cryptonary’s take
This is a clear rotation phase, and the AI narrative is showing signs of exhaustion. That doesn’t mean AI16Z won’t perform well in the future, but capital flow dictates the game, and right now, there’s no urgency to hold. The best traders aren’t attached to assets—they move with the market, not against it.The key here is staying liquid and waiting for clear strength before redeploying. The AI16Z structure isn’t screaming bullishness yet, so patience is key. This isn’t about emotion—it’s about positioning yourself to strike when the conditions are right.
Recommended from Cryptonary


