Save 23% ($351) & Get a Free 1-1 Call with our Team ⏰ : 0d 2h 59m 43s
Market Direction

Disclaimer: This is not financial or investment advice. You are responsible for any capital-related decisions you make, and only you are accountable for the results.
- ETH Open Interest is frightening. It just keeps soaring higher.
- ETH's Funding Rate is at 0.005%, which again shows a balance between Longs and Shorts.

Technical analysis
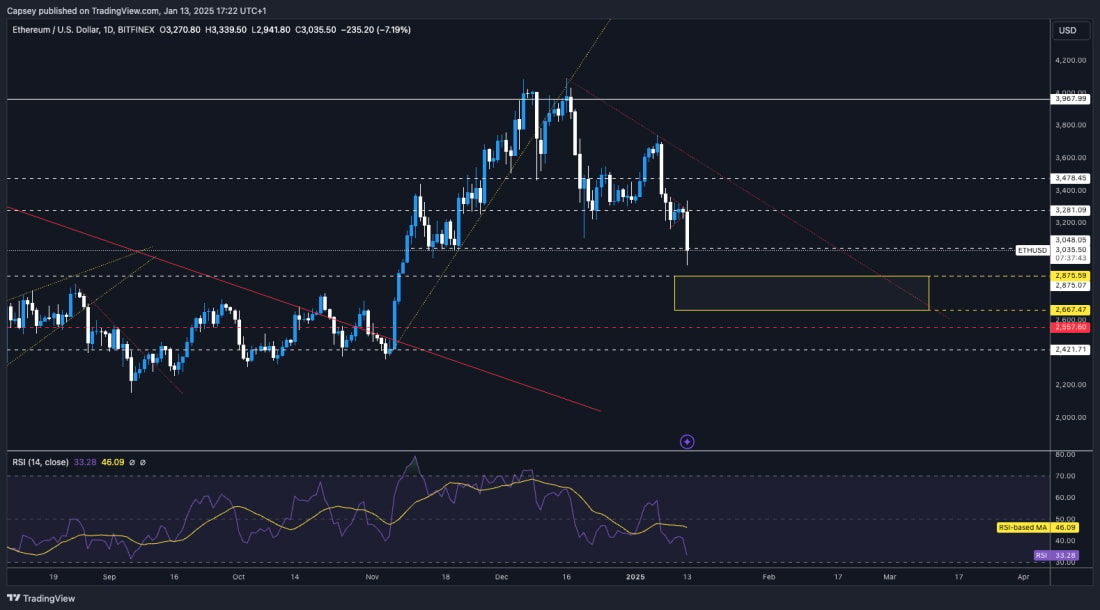
- ETH had a nasty rejection on Jan 7th, which was the jobs data, and it lost the key horizontal level of $3,280 just days later, breaking down from the bearish pennant.
- On the upside, the key level for ETH to reclaim is $3,480, although the price is 15% away from there currently.
- ETH has now moved down into the local horizontal level of $3,050, where we have initially seen some bids come in, and the price is holding up for now. Beneath $3,050, the next horizontal level is at $2,875, with the Yellow Buy Box going down to $2,660.
- The RSI has moved down drastically and now just sits above oversold territory, although there aren't any bullish divergences yet.
- Next Support: $3,050
- Next Resistance: $3,280
- Direction: Bearish
- Upside Target: $3,280
- Downside Target: $2,660 - $2,875
Cryptonary's take
ETH has pulled back substantially, but it is close to approaching the Yellow Buy box, whilst the RSI is also close to being overbought. What we'd like to see is a price to pull back to the Yellow Buy box and remain range-bound for a period. In this period, we'd like to see 1 or 2 bullish divergences (lower low in price, higher low on the oscillator) build-up. That would be the indication for us to potentially Buy/Long.We wouldn't be surprised to see ETH either range here in a tight area for a few days or break lower. We're expecting an upside at some point, but not in the immediate term. We have the inflation data on Wednesday, and a hot print could be what sends ETH into the Yellow Buy box. Let's see.
Recommended from Cryptonary


PRO
Market Direction
13 min read
Mar 17, 2026
PRO
Market Direction
12 min read
Mar 13, 2026

PRO
Market Direction
13 min read
Mar 10, 2026
