Save 23% ($351) & Get a Free 1-1 Call with our Team ⏰ : 0d 2h 59m 43s
4 Hidden Charts Every Investor Should Watch Now
Bitcoin and Ethereum have already played their parts. Now the real question is what comes next, where the sideline capital flows, how speculation builds, and which ratios confirm the shift. Let's break this down through a few key charts that map out the next phase of the cycle.

Last week in Part 1, we laid the groundwork by covering Bitcoin Dominance, ETH/BTC, SOL/BTC, SOL/ETH, and the key Hyperliquid pairs. Together, those charts showed us that Bitcoin and Ethereum have already had their runs, and leadership is shifting toward Solana, Hyperliquid, and eventually the broader market.
In this second part, we extend the analysis to capture the flow of capital beyond the top majors. We'll be examining:
- Bitcoin + Stablecoin Dominance (BTC+Stables)
- Others Market Cap
- Total3/Ethereum
- Others/Ethereum
So let's dive in!
Disclaimer: This is not financial or investment advice. You are responsible for any capital-related decisions you make, and only you are accountable for the results.
Bitcoin + Stablecoin Dominance (BTC+Stables)
Weekly View: Major Reversal ConfirmedThe combined chart of Bitcoin + Stablecoin dominance has been one of our most reliable leading indicators this cycle. Price topped out deep into our weekly supply zone at 71.5–73.5%, reaching 73.29% before reversing sharply. Since then, the structure has shifted, with the chart now forming lower highs and lower lows, a classic bearish sequence that signals the market's risk appetite is returning.
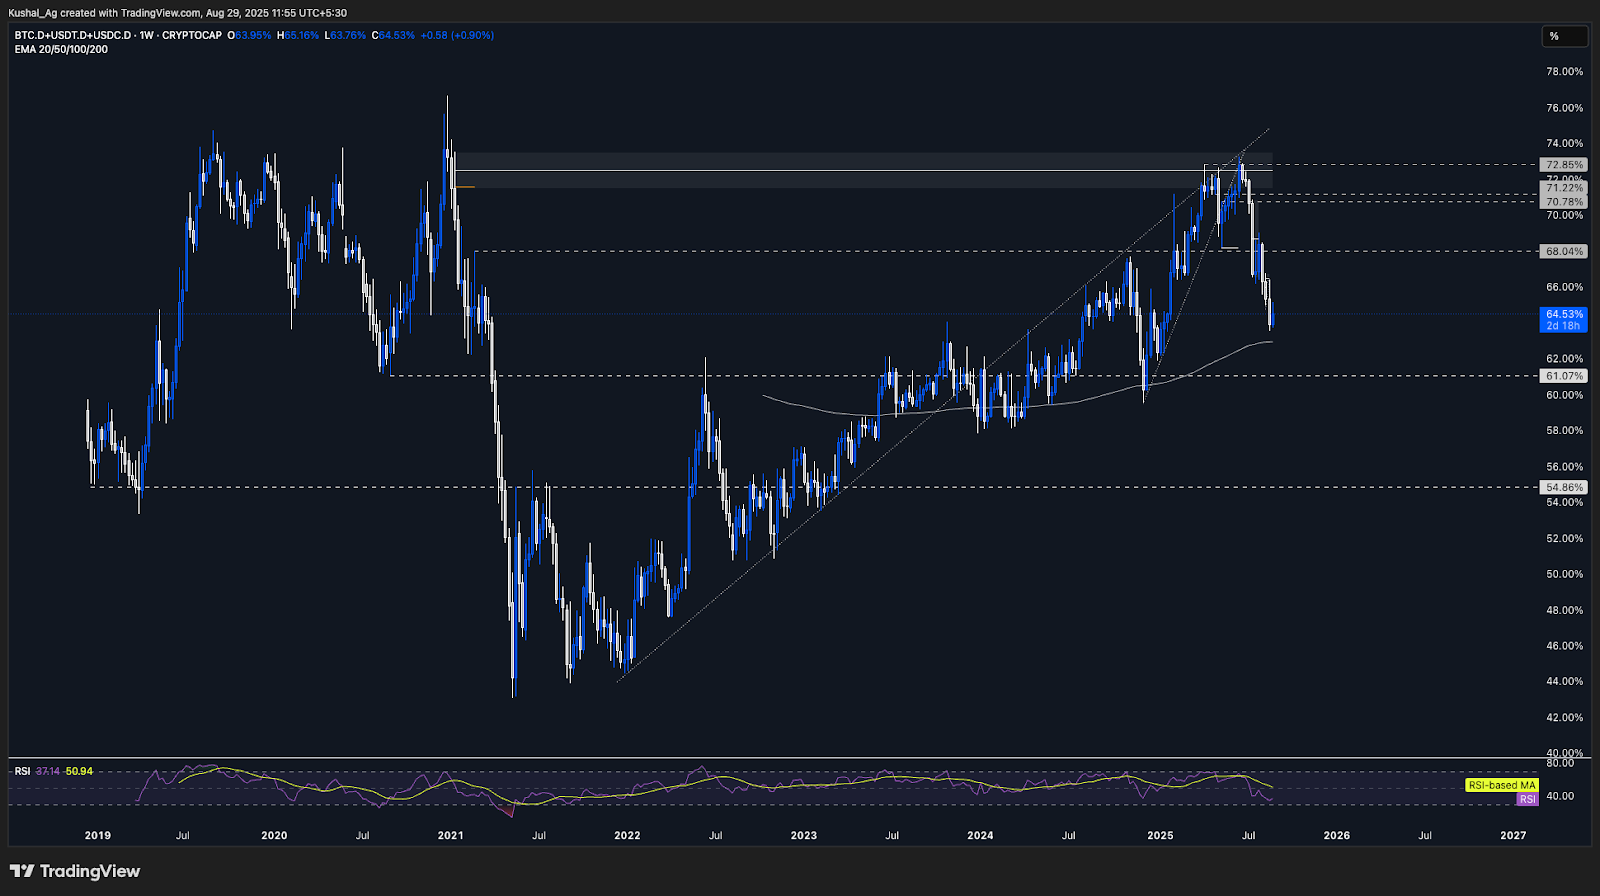
Currently, BTC+Stables is hovering around 64.5%, just above the 200 EMA on the weekly timeframe at 63%. This EMA has historically acted as a pivot level, and we expect it to be tested in the near term. A clean breakdown below 63% would confirm that the broader rotation away from Bitcoin and stables into altcoins is firmly underway.
Targets and Key Zones
The first major support sits at 61%, where a bounce could temporarily slow down the rotation and give dominance short-term relief. Beyond that, however, the chart has space for much deeper downside, with our second major target set at 54.86%. A move into this zone would mark the true acceleration point for altcoins, where capital rotation into higher beta plays typically becomes explosive.
Bearish Scenario: Short-Term Relief Rally
While the broader structure is bearish, a short-term relief bounce remains possible. Given the sharpness of the reversal from 73%, dominance may consolidate above the 200 EMA at 63% before breaking lower. In such a case, altcoins could face some short-term turbulence, but the bigger picture remains firmly in favor of rotation down the risk curve.
Key Levels to Watch
- Resistance: 71.5–73.5% (multi-year supply zone).
- Support: 63% (weekly 200 EMA), 61%, 54.86% (major downside target).
BTC+Stablecoin dominance has likely topped for the cycle. The rejection from 73.29% inside the multi-year supply zone is a strong confirmation that risk capital is leaving safety and rotating into higher beta assets. While we may see short-term consolidation or minor relief bounces, the structure is clear: downside targets at 61% and 54.86% remain in play, paving the way for Solana, Hyperliquid, and the broader altcoin market to lead the next explosive leg higher.
Having looked at Bitcoin + Stablecoin dominance, the chart that shows how much capital is parked in safety, we now turn to the "Others" chart. This tells us where that capital is going once it leaves Bitcoin and stables, into the speculative market of smaller alts and memes.
Others (Weekly + Daily)
Weekly Context: Coiling at the BasThe Others chart (market cap of all coins outside the top 10) is one of the most important gauges of speculative appetite in the market. On the weekly logarithmic timeframe, Others has been trading inside a massive wedge for years. Recently, price bounced perfectly from the 200 EMA weekly (200B) and the weekly demand zone between 189B and 226B. This double confluence triggered a strong reaction, pushing Others back inside the wedge after two brief deviations earlier in 2025.
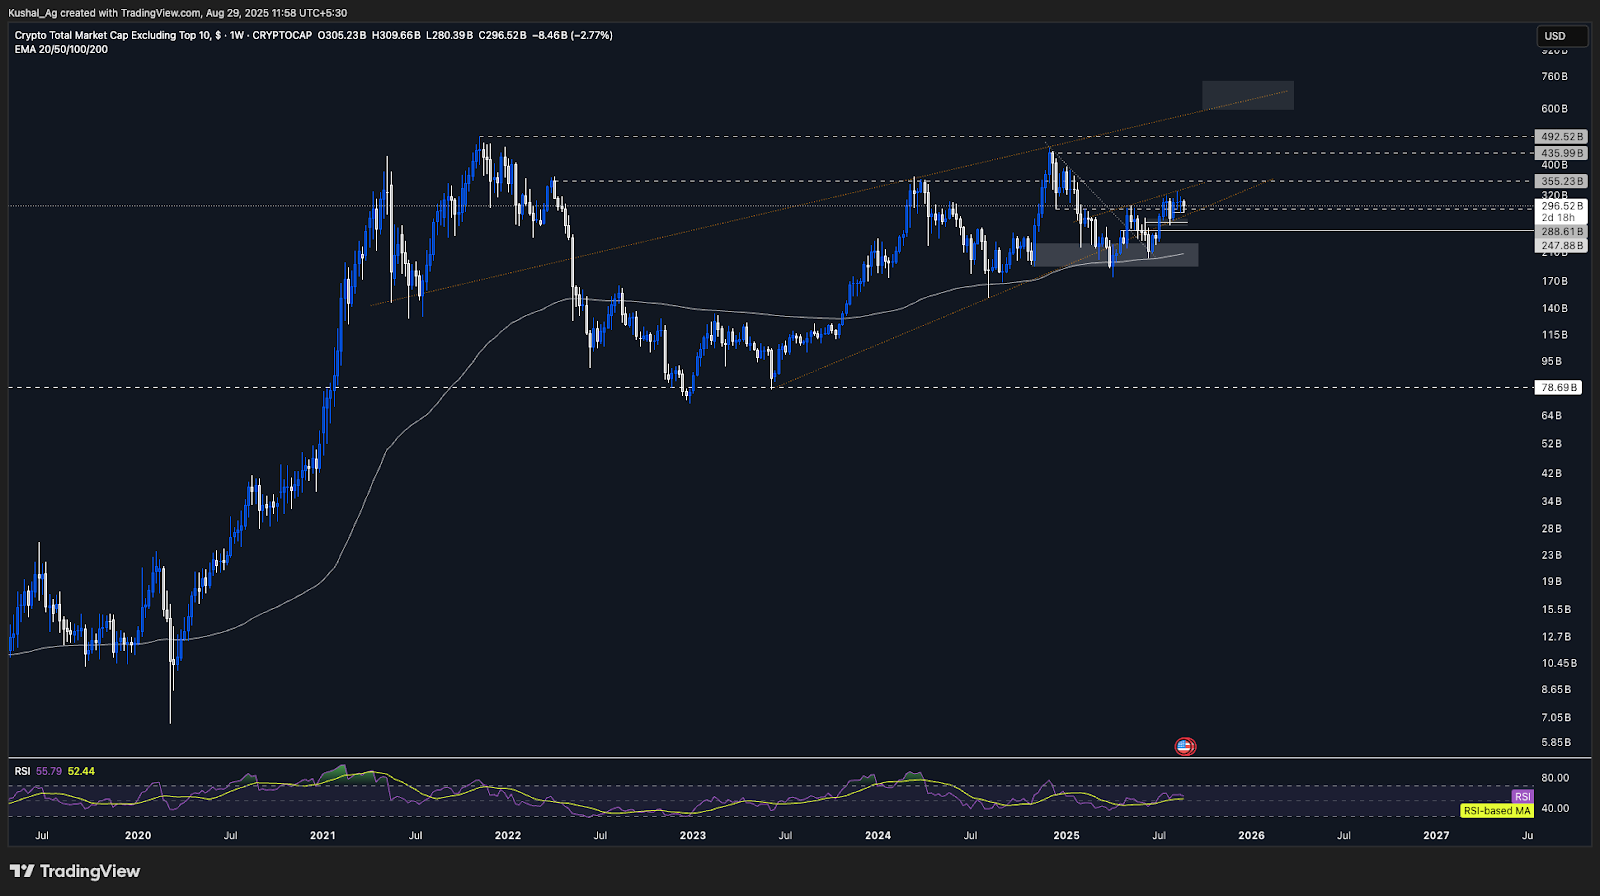
The structure now shows price squeezing at the wedge bottom with a coiled setup that typically precedes explosive breakouts. A push above the nearby downtrend would likely accelerate a move toward 366B, followed by 435B and the prior all-time high at 492B. Above that, Others would enter price discovery, with projections targeting 600–650B (the wedge top).
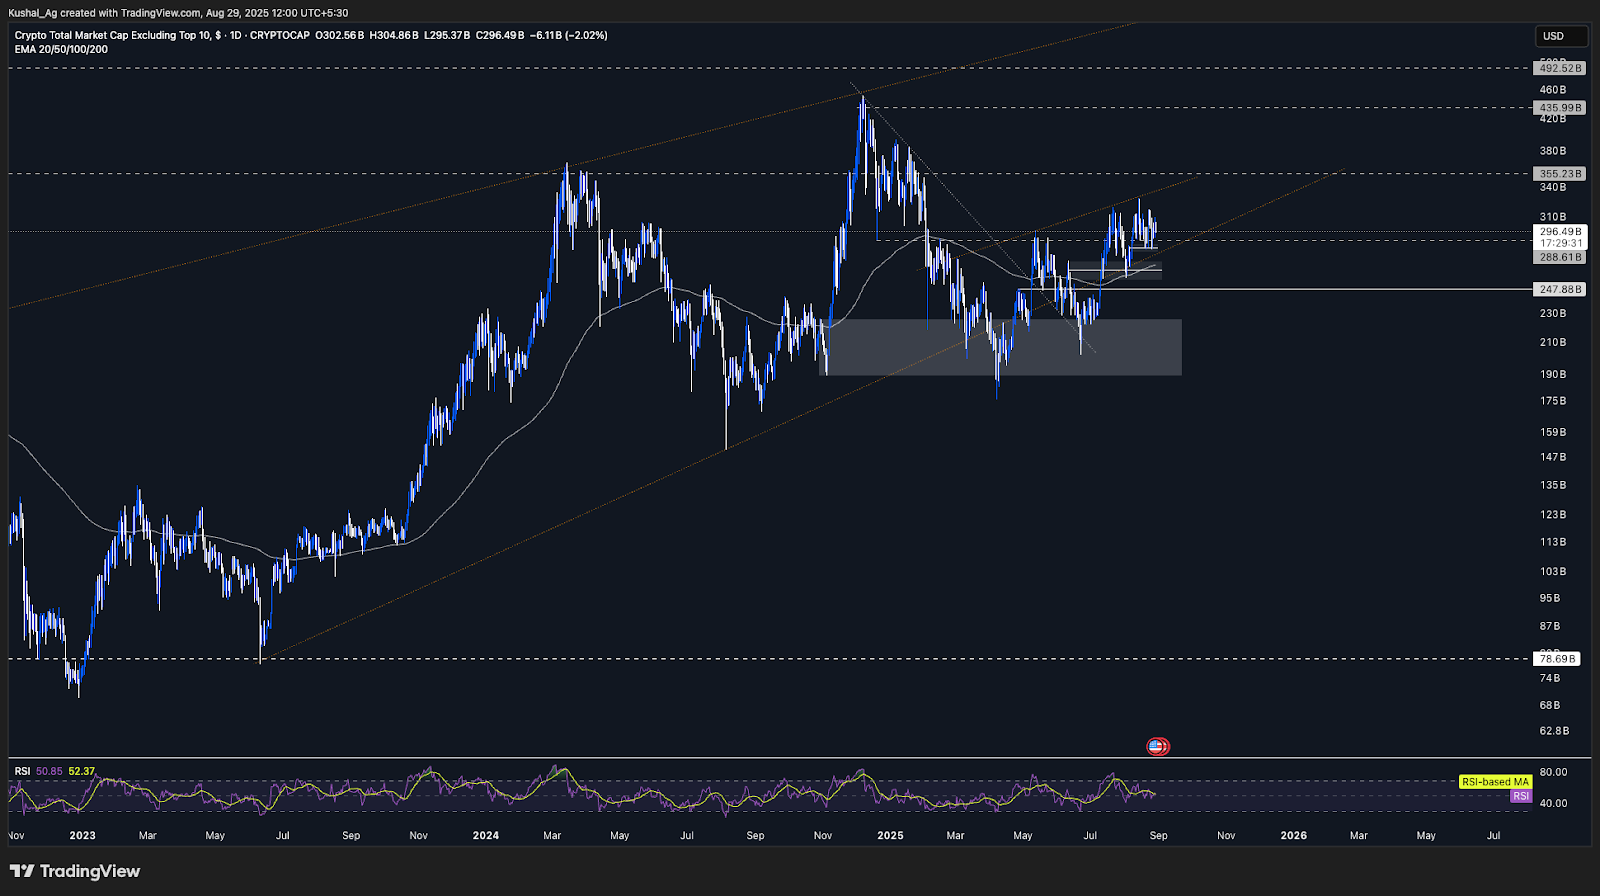
Daily Context: Bearish Pullback Scenario
While the weekly chart paints a bullish longer-term picture, the daily timeframe warns of a potential 10–15% pullback. Others is currently trading around 300B, while the 200 EMA daily sits lower at 267B. A retest of this level is possible as part of a healthy correction. Such a pullback would reset overheated conditions and set the stage for a stronger, more sustainable breakout later.
Fuel for High-Beta Alts
When Others rallies, it almost always ignites meme coins and high-beta plays. The strong bounce from the 200 EMA weekly confirms that the broader alt market has a solid base, but the short-term risk of a retest lower means volatility remains high. A move into the 366–492B range would create the conditions for a full-blown beta rally.
Key Levels to Watch
- Support: 226B (weekly demand), 200B (200 EMA weekly), 267B (200 EMA daily).
- Resistance: 366B, 435B, 492B (ATH).
- Target: 600–650B (wedge top, price discovery).
Others is coiling for its next major breakout, with a strong base built at the bottom of its long-term wedge. While the weekly chart signals massive upside potential, the daily warns that a 10–15% pullback is still on the table. Long-term, this chart strongly supports our thesis of rotation into altcoins and memes, but in the short term, traders should prepare for volatility and possible retests before the breakout unfolds.
With a view of Others MC in place, the next step is to measure how these flows behave against Ethereum. That's where the Total3/ETH chart comes in, giving us a clear signal of when capital rotation is leaving ETH and moving into the wider market.
Total3/Ethereum (Monthly)
Cycle Context: Capital Flow SignalThe Total3/Ethereum chart (market cap of all coins excluding BTC & ETH, measured against ETH) is a powerful indicator of how capital is flowing from Ethereum into the broader altcoin market. Right now, this chart is sitting in its monthly demand zone between 220M and 250M, signaling that the rotation from ETH into alts is preparing for its next phase.
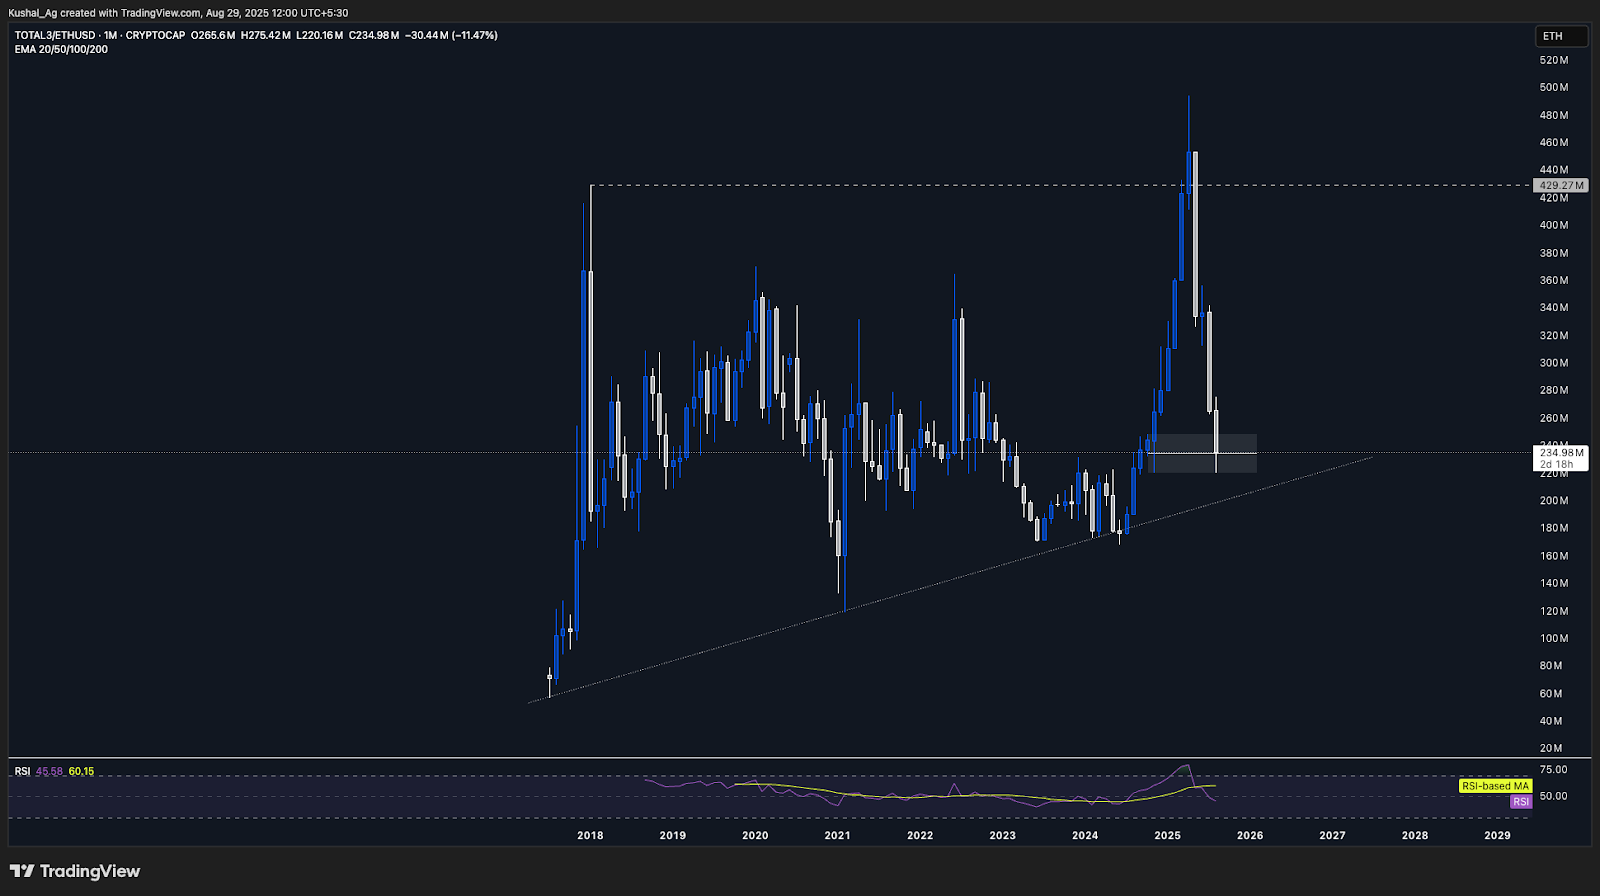
Historical Trendline Support
If price dips slightly lower, there is deeper support at 200M, which perfectly aligns with a long-term uptrend trendline dating back to July 2017. This trendline has acted as support multiple times, in 2017, February 2021, and June 2024, each time triggering major rallies in altcoins. If tested again, it would likely serve as another generational buy zone for alt rotation.
Upside Potential
From its prior all-time high around 500M, Total3/ETH has retraced sharply to its current 235M. Once this chart turns up, the implication is clear: capital will begin rotating out of ETH and into the rest of the market. This includes Solana betas, Hyperliquid, smaller L1s, and especially meme coins. In short, this chart confirms that ETH's main outperformance leg is done, and the market is preparing for risk-on behavior further down the curve.
Key Levels to Watch
- Support: 220M–250M (monthly demand), 200M (long-term trendline).
- Resistance: 300M (first reclaim level), 500M (ATH).
Total3/ETH sitting at monthly demand confirms the setup for Ethereum-to-alts capital rotation. Even if ETH pushes toward $5–5.5K in USD terms, this chart suggests the next wave of outperformance will not come from ETH, but from the broader market beneath it. This is one of the strongest confirmations that the rebalance phase is already underway.
Finally, we zoom in even further with the Others/ETH chart. This is the sharpest lens into where speculation peaks, showing whether capital is moving from ETH directly into meme coins and high-beta alts.
Others/Ethereum (Monthly)
Cycle Context: The Final Flow Into SpeculationThe Others/Ethereum chart tracks capital rotation from Ethereum into smaller-cap alts and meme coins, the highest-beta part of the market. At present, price is sitting directly inside the monthly demand zone between 63M and 72M, signaling that we are approaching the stage where speculative assets begin to absorb capital.

Deeper Support Zones
If this demand zone fails to hold, there is another strong support layer between 45M and 56M. This zone has repeatedly served as a base since 2019, sparking major alt rallies in every cycle. In the absolute worst-case scenario, a retest of this level would likely reset the market for an even stronger leg higher, but the current structure suggests the first demand zone may already be enough.
ETH vs Alts Dynamic
As with Total3/ETH, the bigger picture is that Ethereum has had its run, and capital is preparing to rotate further down the risk curve. A sustained bounce in Others/ETH would confirm the flow into meme coins and smaller altcoins, which historically marks the euphoric stages of the cycle. Conversely, if ETH strengthens further and this chart dips toward its lower demand zone, it would simply delay, not cancel, the inevitable speculative rotation.
Key Levels to Watch
- Support: 63M–72M (current monthly demand), 45M–56M (deeper support).
- Resistance: 85M, 100M, then prior highs at 120M+.
A bounce on Others/ETH here would mark the beginning of the speculative phase where memes and high-beta alts lead the charge. Even if Ethereum manages another push higher, the positioning of this chart confirms that the next major capital rotation will be away from ETH and into the broader speculative market.
Cryptonary's Take
The first part of this report showed us that the cycle's opening phase was led by Bitcoin and Ethereum. The majors have done their job; the question now is who leads the next act.In Part 2, we looked beyond the anchors and into the flows that decide the rest of the cycle, Bitcoin + Stablecoin dominance, the Others chart, and the ETH ratios. The takeaway is clear, sideline capital is rolling over and money is preparing to flow deeper into the market.
When BTC+Stables dominance breaks down and Others begin its move, it signals the transition from safety into speculation. Total3/ETH and Others/ETH confirm that Ethereum's dominance is cooling, opening the door for high-beta assets, memes, and smaller caps to accelerate.
The baton is changing hands. Solana and Hyperliquid are leading, but the charts confirm the broader market is next. Rebalancing now is the difference between catching the explosive middle phase, or watching it pass by.
Peace!
Cryptonary, OUT!
Recommended from Cryptonary


